
Abstract
Meeting college students’ basic needs is the goal of a new set of student success initiatives that address students’ urgent food, housing, or financial hardships in an effort to help them remain and succeed in college. Focusing on one California public university, we describe one such basic needs program, identifying the students who participate, their hardships and services received, and their retention over time. Students presented with issues in four main areas: food insecurity, mental health, multiple severe hardships, and need for one-time supports. In general, participants were retained at lower rates than the campus average, which is to be expected given their severe hardships. However, those who enrolled in the Supplementation Nutrition Assistance Program (SNAP) were retained at higher rates, on par with or higher than university-wide retention. California has amended SNAP regulations to waive work requirements for low-income students, making it easier for college students to qualify.
Keywords
In the past several decades, 4-year institutions of higher education have made improvements to the racial, ethnic, and socioeconomic diversity of their enrolled students (Cataldi et al., 2018; Snyder et al., 2016). However, these have been accompanied by a reduction in the purchasing power of financial aid (Mitchell et al., 2015) and a weakening of the public safety net for vulnerable families (Sherman, 2009), which has resulted in a crisis of basic needs for many college students. Researchers estimate that rates of food and housing hardships are now higher among college students than in the U.S. population as a whole (Broton & Goldrick-Rab, 2018; Cady, 2014; Nazmi et al., 2019). Up to 55% of undergraduate students in 2- and 4-year colleges face food insecurity (Broton & Goldrick-Rab, 2018; Freudenberg et al., 2011; Gaines et al., 2014; Payne-Sturges, et al., 2018), with students in community college and those in higher cost of living areas experiencing the highest rates of food insecurity. Housing insecurity is also prevalent, with up to 52% of undergraduate students reporting problems such as not being able to afford rent or utilities or experiencing frequent moves (Broton & Goldrick-Rab, 2018; Payne-Sturges et al., 2018). Research estimates that between 9% and 14% of college students experience homelessness (Broton & Goldrick-Rab, 2018; Tsui et al., 2011) and localized studies continue to emerge demonstrating comparable or even higher rates of hardships among community college and four-year college students. Not surprisingly, these high rates of economic precarity are accompanied by elevated levels of mental health issues on college campuses, particularly among students with economic needs (Lipson et al., 2018).
Seminal research in psychology suggests that physiological needs such as food and shelter constitute the foundation on which other needs can be met (Maslow, 1943). Only once individuals are able to meet their basic physiological needs can they pursue higher order needs of safety, belongingness, self-esteem, and finally self-actualization. For young people, these higher order needs are essential for academic success. Feelings of safety (Milam et al., 2010) and sense of belonging to one’s educational institution (Hurtado & Carter, 1997; Johnson et al., 2007) are both critical for student success. Furthermore, research on self-efficacy, a corollary of self-esteem, indicates that belief in one’s ability is predictive of academic outcomes in postsecondary education (Chemers et al., 2001; Zajacova et al., 2005). Thus, meeting basic needs facilitates other known theoretical predictors of student success. Conversely, students whose needs are not met may be unable to fully engage with their academics to achieve success.
The University of California campuses, including at Santa Cruz (UCSC)—the context of this study—rank very highly among research universities on indices of social mobility because of the diversity of students served and their relatively high rates of retention and graduation (CollegeNet, 2018; U.S. News and World Report, 2020). However, even in this elite system, many students struggle with having their basic needs met. Estimates suggest that 19% of students in the UC system face very low food security and an additional 23% face low food security; a total of 42% of students are food insecure based on the definition employed by the U.S. Department of Agriculture (Martinez et al., 2016). Latinx (59%) and African American (60%) students are the most likely to face food insecurity. The University of California as a whole does not have housing insecurity estimates, but at UCSC, a survey of local renters (one quarter of whom were students) indicates that overcrowding and forced moves are a major problem in the unaffordable local housing market (No Place Like Home, 2018).
With increasing numbers of low-income, underrepresented minority, and other nontraditional students attending 4-year universities, institutions of higher education are presented with challenges that require new solutions. In this study, we worked collaboratively with the program staff at Slug Support at UCSC—which provides crisis triage and ongoing support to students who face immediate food, housing, and economic needs as well as mental health and conduct issues—to explore service provision and utilization as well as student retention during and after program assistance. The study was motivated by a desire by program staff and campus officials to better understand student needs and the services offered most frequently, as well as to ensure that the program is reaching its intended population of the most vulnerable students.
Staffed by social workers trained to work specifically with students on campus, Slug Support aims to stabilize students’ financial situations and address underlying mental health problems to improve well-being, so that students may remain on campus and complete their studies. Slug Support social workers connect students to a variety of social services; enrollment in the Supplemental Nutrition Assistance Program (SNAP) is a cornerstone of this intervention, as recent California policy changes have increased eligibility for low-income college students. In this article, we explore program utilization, including the characteristics of students who are served, their needs and services provided, and their retention in the year of service as well as in future years. Although there are now many estimates of student hardship and the extent to which basic needs are going unmet, this is among the first studies to explore a basic needs intervention at a 4-year university.
Background
The demographics of UC students have changed dramatically in the past two decades, with more students coming from low-income, first-generation, and Latinx backgrounds. According to statistics maintained by the University of California Office of the President (2020), between 1999 and 2019, the percentage of enrolled undergraduates who were first-generation college students increased from 10% to 40%. The percentage who were Latinx doubled from 12% to 25%, and there was a concomitant drop in the percentage who were Caucasian from 38% to 21% but almost no change in the percentage of students who were African American/Black/Caribbean (3% to 4%). The UC is in many ways a reflection of the larger higher education landscape, as these demographic shifts are borne out across nationwide college admissions data (Cataldi et al., 2018). These shifts in the college-going population can produce upward economic mobility for low-income and traditionally underrepresented groups (Creusere et al., 2019), but these yields hinge on students being provided with the resources they need to graduate.
The increasing scope of financial need of students at UC campuses is exacerbated by the reduced purchasing power of financial aid relative to rising tuition and living costs (Mitchell et al., 2015; Singell & Stater, 2006). When first implemented, the Pell Grant covered 75% of college costs for a 4-year university but today covers just 30% of these costs (Broton et al., 2016). Moreover, because tuition costs typically make up less than half of the actual cost of attendance, and living-cost allowances are often inaccurate, the true gap between financial aid and financial need may be even larger (Kelchen et al., 2017). The financial strains posed by college enrollment are an important factor in student retention (Joo et al., 2008; Terriquez & Gurantz, 2015) as even with financial aid, low-income students are at highest risk of dropping out (Chen & DesJardins, 2008). Still, use of merit-based and especially need-based aid significantly increases student retention, and adequate financial aid is a key contributor to this (Goldrick-Rab et al., 2016; Singell, 2004; Singell & Stater, 2006).
There are few available government support programs for college students who are financially insecure. Recent California legislation modified the State’s SNAP (known as CalFresh) eligibility rules so that low-income college students enrolled full-time can count their actual or anticipated federal work study hours for the work requirement, thereby increasing eligibility for this population (California Department of Social Services, California Health and Human Services Agency, 2017). This opens the possibility of CalFresh receipt to many more college students, although, still, many students are unaware of their eligibility and others are unable to obtain work study positions because program funding is allocated by the federal government and may not cover all needy students (Scott-Clayton, 2017). California has also implemented a notification process for CalFresh-eligible students who receive Cal Grants (California Department of Social Services, California Health and Human Services Agency, 2018), the state’s need- and merit-based grant program, but it is yet too soon to see the effects of this outreach.
Slug Support staff have worked closely with the Santa Cruz County Human Services Agency to identify and designate eligibility for specific campus programs as qualifying students for CalFresh. Moreover, staff have collaborated with county officials to create smooth processes for student eligibility determinations and enrollment, as well as remove roadblocks specific to a college population (e.g., waiving residency requirements over summer vacation). UCSC undergraduate workers are trained to run CalFresh application workshops on campus that further simplify the enrollment process for needy students.
Still, some food insecure students are not eligible for CalFresh, particularly undocumented students, including those who are DACA (Deferred Action for Childhood Arrivals) registered. Enrolling eligible students in CalFresh would free up on-campus resources like food pantries to serve students who have no other alternatives for food support. Estimates suggest that in 2016 before these reforms were put in place, just 2% of students in the UC system were enrolled in CalFresh, compared with 43% who had moderate or high levels of food insecurity (Martinez et al., 2016).
Several private programs have attempted to pick up where public programs are failing. For example, the Promise Scholarship program operates nationwide and acts as a college knowledge and scholarship program to link public high school students with local philanthropy or companies that will pay for in-state college tuition. A study of the first Promise Scholarship program in Kalamazoo, MI demonstrates that covering tuition is insufficient to meet students’ needs and that more basic needs supports are required to help students persist and succeed (Collier et al., 2019).
Evidence is clear that the basic needs of many college students are going unmet, but there is limited research on how having unmet basic needs affects student outcomes. According to a study of economic instability at several California State University campuses, students who reported food insecurity, housing insecurity, or both also reported very high levels of stress, which detracted from their ability to focus on school work and manage their academic and personal lives (Crutchfield & Maguire, 2018). These students face difficult choices about how to spend their limited funds, including tradeoffs on whether to spend their money on educational expenses or food and housing. In a survey of UC undergraduates, the Global Food Initiative (Martinez et al., 2016) found that 25% of food insecure students had to choose between paying for food or educational and housing expenses, 29% had difficulty studying because of hunger, and 15% had to choose between paying for food and paying for medicine or medical care. Students facing food and housing insecurity are more likely to report lower attendance and performance in their courses, as well as higher rates of failing or withdrawing from courses (Silva et al., 2017). Although the potential mediational role of unmet basic needs is poorly understood, national research on degree completion among first-generation and low-income students clearly suggests that financial hardship contributes to higher rates of dropping out (Ishitani, 2006).
Observers have called for increasing attention to the multiple needs of and service supports for low-income college students, for example, the Lumina Foundation’s guide Beyond Financial Aid (Chaplot et al., 2015). Community colleges have been first to implement and evaluate programs providing these types of wraparound services. North Carolina’s Single Stop program, for instance, was associated with improved student academic outcomes, particularly for older students (Daugherty et al., 2020). Improving systems for public benefit enrollment and receipt was associated with improved retention for students at five different community colleges (Price et al., 2014). Still, programs focused on food insecurity among community college students have shown mixed results, with some indicating positive effects on food security and academic progress (Broton et al., 2020) others showing null results, although program implementation and take up may have been factors (Goldrick-Rab et al., 2020). Research on basic needs program utilization and effectiveness in 4-year institutions of higher education is emerging but still focused mainly on documenting the extent of need rather than addressing program utilization or effectiveness. It is critical to understand the utilization of emergency support programs for underresourced students, and this study offers one of the first examinations of a program aimed at stabilizing 4-year college students’ basic needs as a student success initiative.
Slug Support at UC Santa Cruz
UCSC is a federally designated Hispanic Serving Institution, with 25% of its undergraduate students from Latinx backgrounds; 4% who are African American/
Black/Caribbean; and a total of 42% who are first-generation college students (FirstGen, 2018; Institutional Research and Policy Studies, 2018). Estimates suggest about 36% are low-income based on the proportion who receive Pell Grants, but not all low-income students are Pell-eligible as the campus also serves a sizeable proportion of undocumented and DACA students (University of California Office of the President, 2020).
The City of Santa Cruz is among the most expensive places to live, in California and indeed in the world (Cox & Pavletich, 2018). The availability and cost of housing both on and off campus is a challenge for students, staff, and faculty. UCSC houses 52% of its students on campus and others must compete in the local rental market, leading, for some, to long commutes and substandard housing and overcrowding (No Place Like Home, 2018).
Slug Support (named for the UCSC mascot, the banana slug) is a campus-wide program that provides food, emergency housing, mental health care, and financial support for undergraduate and graduate students in need as well as mentorship and referrals to support services in the community. The program is unique in its holistic approach to addressing student needs, focusing simultaneously on students’ mental health issues and economic hardships. Its social workers provide individualized care for students to address their specific needs, and the program also operates as a conduit for key offices on campus (e.g., academic advising, financial aid, counseling, disability resources), as well as overseeing a food pantry. Beyond alleviating financial hardship, the program’s one-on-one care helps students navigate the university system, a resource that first-generation students often cannot receive from parents (Rowan-Kenyon et al., 2008). Students who seek or are referred to Slug Support services can either make an appointment or be seen in walk-in services. There, an intake specialist conducts an assessment and students who have emergency needs are served immediately.
The program began in 2011 and has grown from serving 200 students in its first year to nearly 2,000 students in the 2016 to 2017 school year. This rapid pace of growth is due to a combination of the program’s expansion in terms of staffing, its outreach efforts on campus, and the growing needs of the student population. Program participation is voluntary with the exception of students facing disciplinary action, who are required to interface with Slug Support as a condition of their continued enrollment. Other students learn about or are referred to Slug Support through their interactions with various campus programs, especially the Educational Opportunities Program (EOP) 1 and counseling services, and also by their academic advisors and by faculty or instructors.
Method
We used university institutional records to conduct analyses of program utilization among 3,726 students from 2012 to 2017 and tracked longitudinally some basic student outcomes. We report descriptive analyses using student identification numbers to merge two databases. The registrar’s office at UCSC compiles and maintains information about student demographic information, course enrollment and grades, and graduation. Slug Support staff maintain a separate case management database that includes case notes and information about the needs that students present, the types of supports they receive, and the dates of service. Data on Slug Support include all services provided between fall quarter 2012 and fall quarter 2017. This yielded 21 quarters (including summer) of program utilization data. Student enrollment data similarly cover the period beginning fall of 2012 but extend through spring of 2018 in order to assess subsequent retention of students who used Slug Support during the last extracted quarter (fall 2017).
We do not report impact estimates in this analysis and instead rely on longitudinal data to provide an important detailed description of how the program is being used and by whom, how often students return for services, and whether they continue at the university. Randomized controlled trials are often used to assess programmatic impacts, but ethical considerations prohibit randomly assigning low-income students on this campus and administrative data lack sufficient precollegiate academic predictors of student success to create a reliable propensity score matched control group.
Data and Measures
Slug Support staff enter case notes into a case management system called Advocate. They include a variety of needs that the students express during intake, such as financial hardship, housing concerns, or medical issues. Case notes also include the different supports that students are provided or to which they are referred, such as food pantry bags, an emergency hotel stay, or money from the health hardship fund. For the analysis, we coded both the needs and services or referrals offered, combining categories that were similar to each other, in some cases. Students can return to Slug Support more than once, and there are many who do so.
Beginning in fall 2016, Slug Support has hosted drop-in CalFresh workshops for any interested students. At a workshop, undergraduate interns help eligible students apply for CalFresh, and these students’ identification numbers, along with workshop date, are logged in a separate spreadsheet. Because these students did not meet with a social worker and were only assisted with CalFresh enrollment, we did not include them in the Slug Support population or any analyses thereof. Instead, CalFresh workshop attendees are exclusively included in the discussion of retention.
Students self-report demographic information on matriculation to the university. Students can ask to have their gender marker changed or removed, and many transgender students opt for this. We used EOP eligibility as a proxy for socioeconomic status. The registrar’s office maintains official academic records of all enrolled students. These include courses taken, course grades, quarters enrolled, dates of graduation, and academic level at entry. Analyses were conducted using academic records as of our extraction date in June 2018.
Analytic Techniques
We used two main analytic techniques to explore the needs and services of Slug Support students and their annual retention in the year they used the program, as well as subsequent years. First, we used cluster analysis to describe the program beyond simple frequency counts of students using Slug Support and their corresponding case notes. We found four different clusters of student program utilization using a two-step cluster analysis of all needs (k = 16) and supports (k = 26). Two-step cluster analysis is a proprietary SPSS algorithm that combines two clustering techniques: k-means (Step 1) and hierarchical (Step 2). In Step 1, each student’s score on each clustering variable is subtracted from the mean of that variable, and students with similar difference scores are consecutively preclustered together using a cluster feature tree (as described in Zhang et al., 1996). In Step 2, each precluster is compared with the following precluster across all variables and grouped into the number of clusters specified by the user. We used this technique to assess whether students who had one need or support were more or less likely to have another need or support, and thus create homogenous subgroups of students from the larger heterogeneous whole.
To assess distance between clusters, we used a log-likelihood distance measure, which places a normal probability distribution on the variables. We attempted multiple cluster solutions but ultimately chose the four-cluster solution because it was the most theoretically interpretable and matched Slug Support practitioners’ implicit understanding of the typology of students they serve. Using these four clusters, we then compared the demographics of students using Slug Support with those of the campus population as well as between each cluster. Retention outcomes were not broken out by cluster because frequency of utilization (and therefore time at the university) was used to define clusters. Instead, we conducted chi-square tests of retention among all Slug Support students and then all CalFresh students.
To further explore retention, we conducted discrete survival binary logistic regressions, focusing on next quarter retention only. This allows us to examine all students together instead of separating out by cohort, so these analyses benefit from higher statistical power. We conducted six discrete survival binary logistic regressions in total. Our first model was the simple bivariate relationship between Slug Support utilization within a quarter predicting retention to the next quarter. In the next model, we introduced other variables that may covary with retention, including academic term count (i.e., their first through last quarter at UCSC), first-generation status, EOP eligibility, gender, and race or ethnicity as control variables. Finally, we conducted four discrete survival binary logistic regressions with interactions for each demographic variable. The discrete survival models allow us to report the odds that a student drops out in the quarter that they use Slug Support. We use these models to describe what happens to students during and after their program receipt, but as is discussed in the limitations section, we do not draw causal conclusions about program impact.
Community-Engaged Research
This research was conducted through a collaborative partnership between the Student Success Equity Research Center and Slug Support at UCSC. Research questions were jointly developed, and findings were shared in ongoing discussions with program leadership and staff. In these conversations, Slug Support staff provided individual examples of when or how they saw a particular finding play out with students, and we share some of these in the text. Although Slug Support staff and other campus stakeholders such as institutional research informed the study, they were not involved in data analyses or otherwise able to influence the results.
Results
Descriptive Analyses
Between fall 2012 and fall 2017, 48,440 undergraduate and graduate students were enrolled in the university for at least one quarter, and 3,726 of them (7.7%) had used Slug Support’s services at some point. Slug Support provision increased dramatically over this 5-year period, with the program serving fewer than 100 students per quarter for the first year and more than 800 in fall of 2017. Figure 1 shows rates of service provision, and as can be seen, there does not yet appear to be any plateauing of the trend line. The ongoing growth of the program could be due to increased awareness of Slug Support but may also be due to increased need. Broadly speaking, the remarkably high utilization of a basic needs program suggests that Slug Support is intervening on issues with high unmet demand.
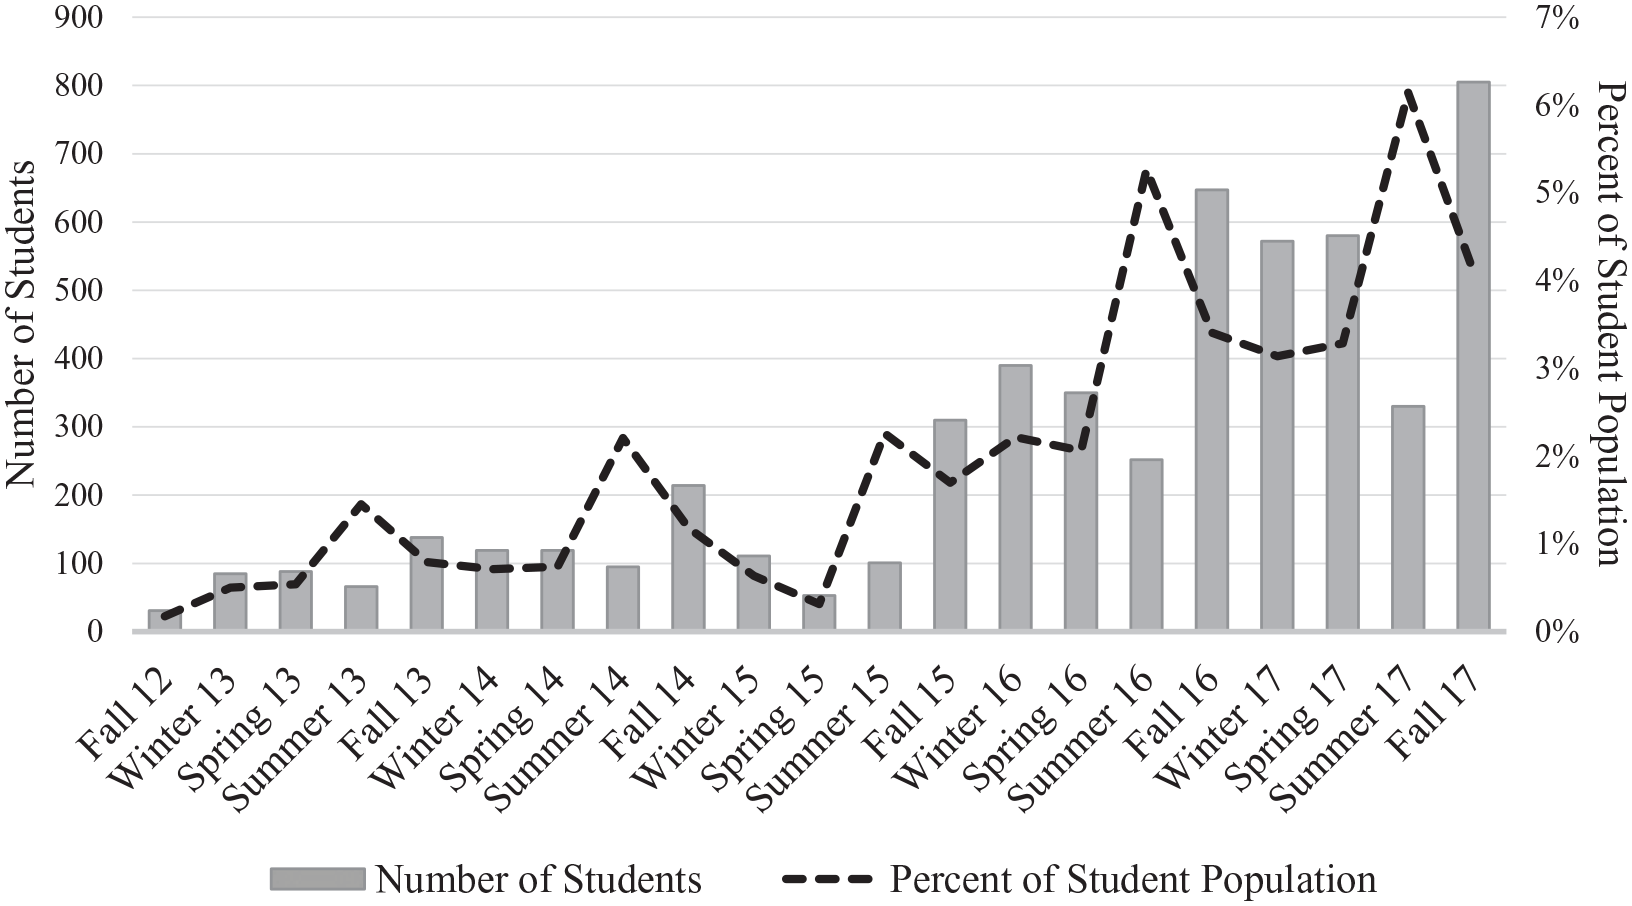
Slug Support utilization over time.
The wide variety of both needs and supports in the case notes speak to the cascading effects of unmet basic needs. Among the 3,726 students who used Slug Support, there were 5,917 Slug Support visits. As shown in the first two columns of Table 1, the five most common student needs were financial hardship, general assistance, food insecurity, mental health, and medical issues. Students received a combined 19,799 different supports, shown in the first two columns of Table 2. Some of these supports were offered directly by the Slug Support social workers and others were provided through referrals to other campus offices. We are unable to track whether students followed up on referrals to receive additional services, but social workers often personally connected students to these referred service providers in an effort to ensure follow up occurred. The most common supports included assistance with financial aid, housing office referral, clinical health referral, tutoring referral, pantry bags, and grocery store card. Although very few students (49) expressed interest in CalFresh during their intake, a much larger share (507) signed up for the program after being informed about it during a visit or workshop, demonstrating the importance of raising awareness for this program. CalFresh eligibility rules changed during the analysis period as well, increasing access to the program for college students, as discussed previously in the background section.
Total and Percentage of Slug Support Visits by Area of Student Need
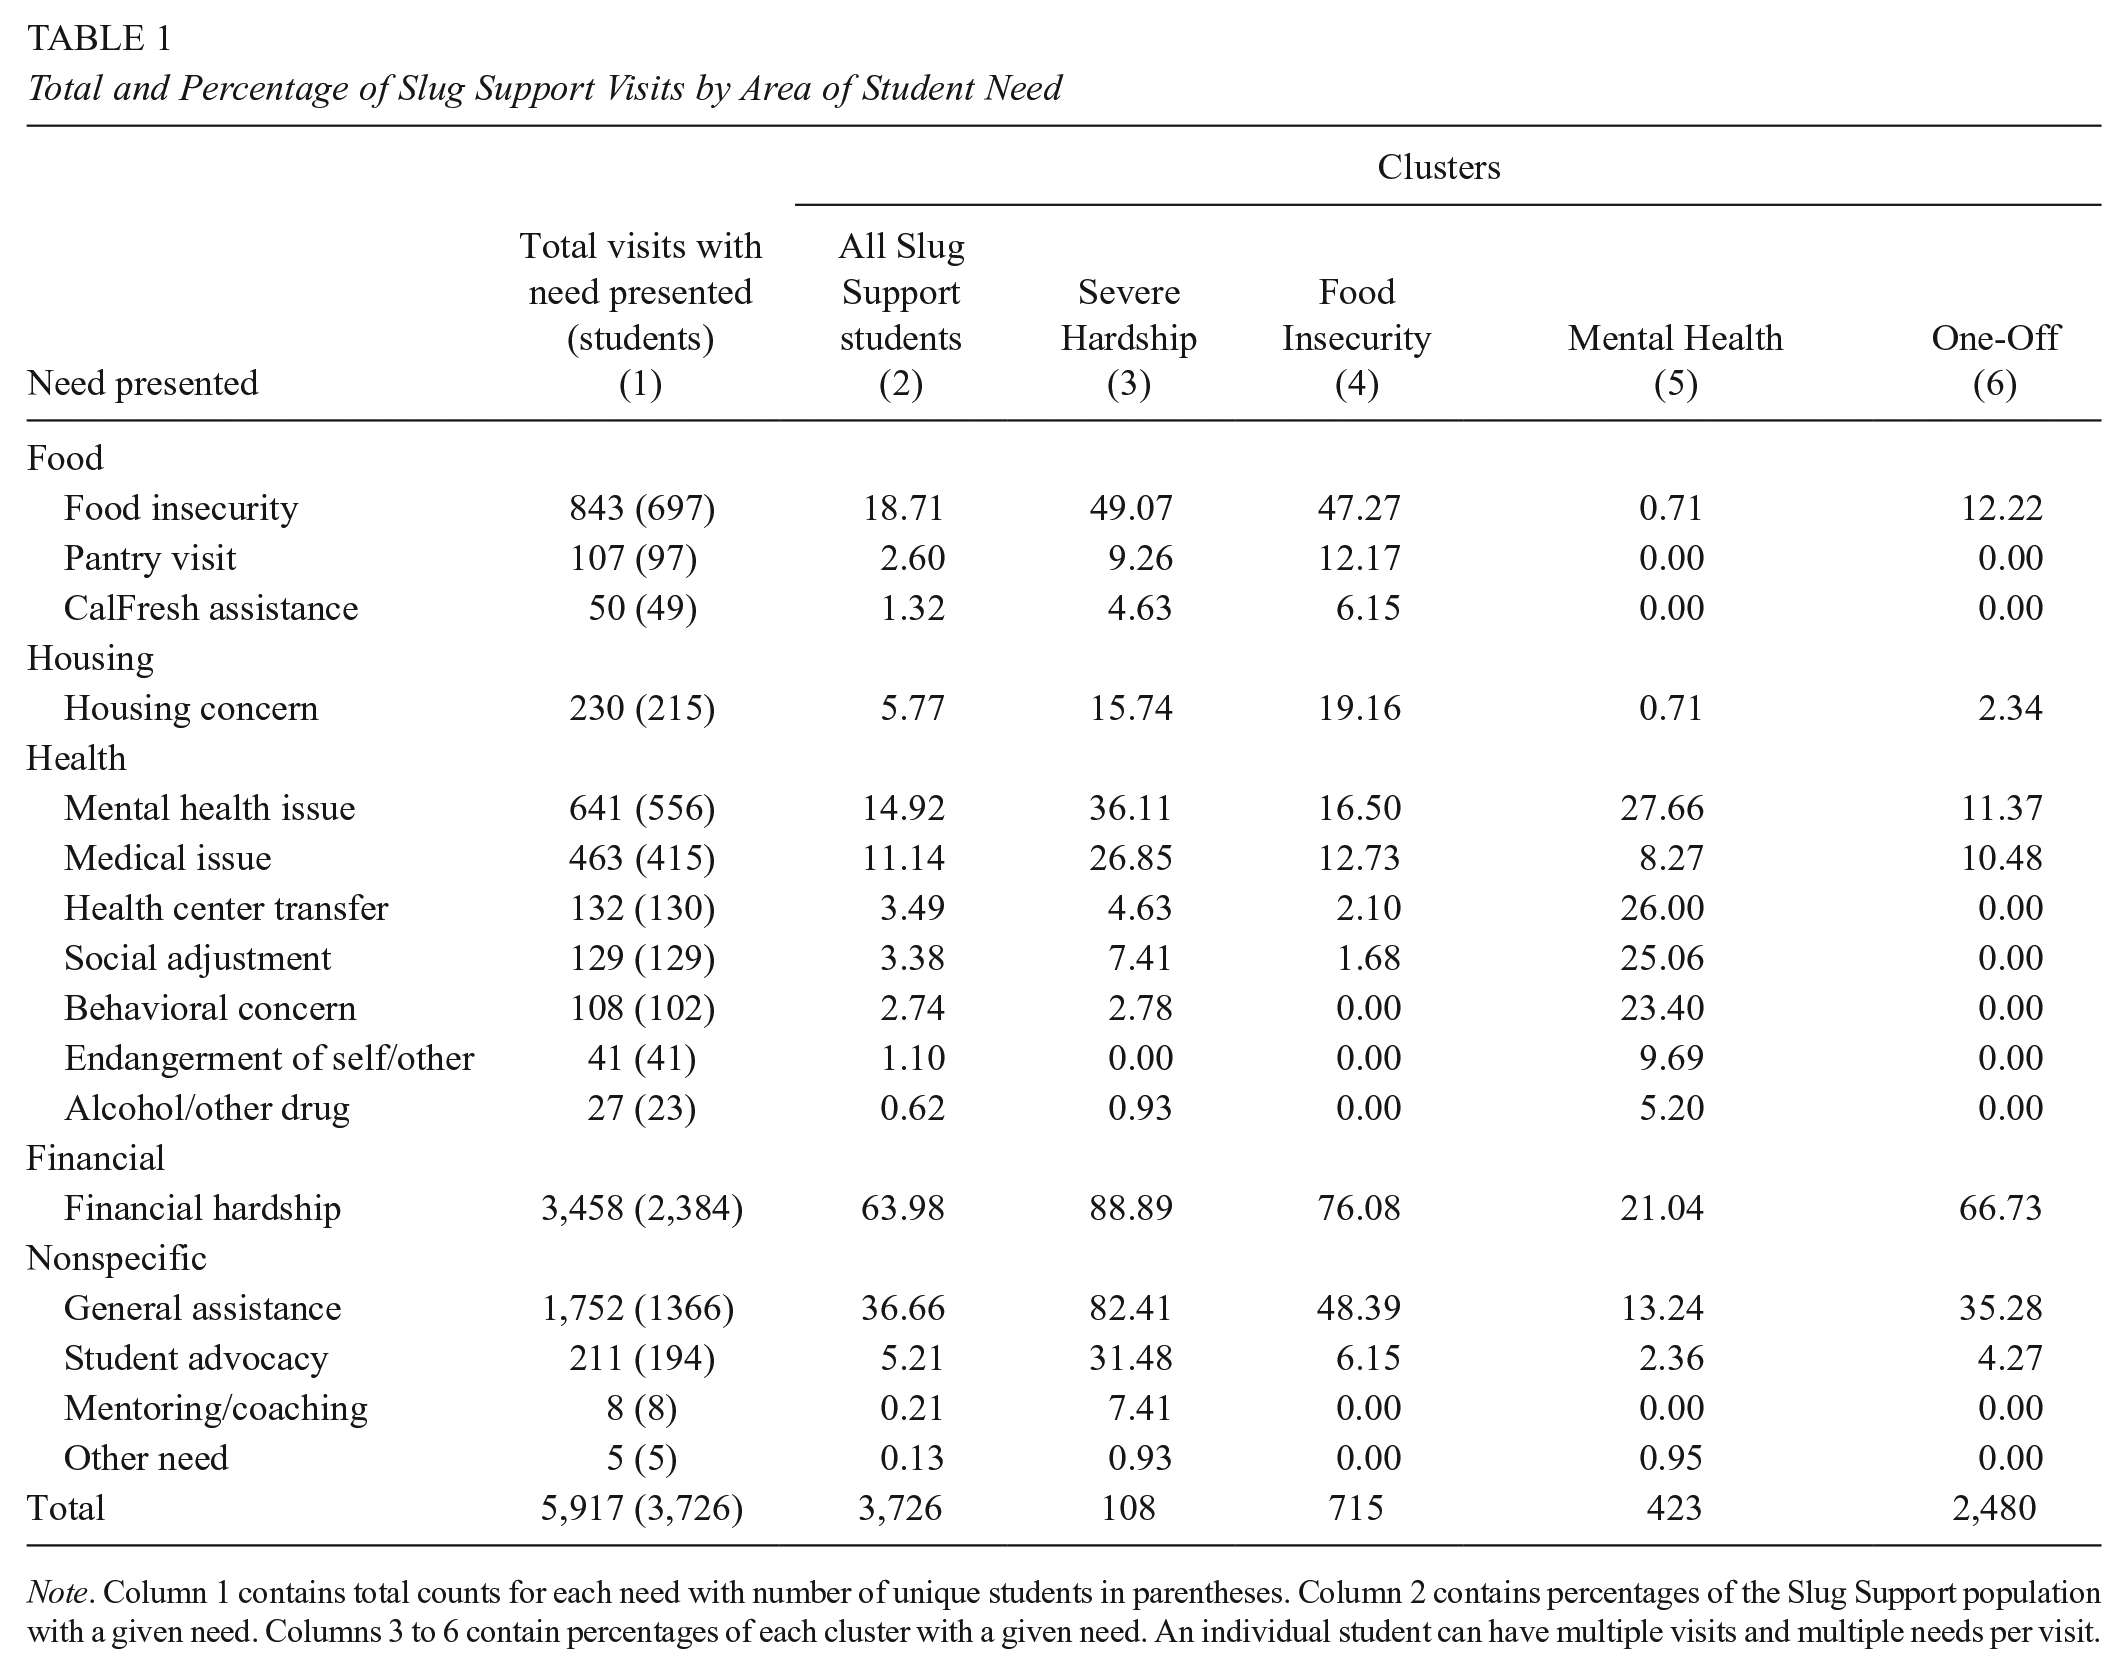
Note. Column 1 contains total counts for each need with number of unique students in parentheses. Column 2 contains percentages of the Slug Support population with a given need. Columns 3 to 6 contain percentages of each cluster with a given need. An individual student can have multiple visits and multiple needs per visit.
Total and Percentage of Slug Support Supports Provided

Note. Column 1 contains total counts for each support provided with unique students in parentheses. Column 2 contains percentages of the Slug Support population with a given support. Columns 3 to 6 contain percentages of each cluster with a given support. An individual student can have multiple visits and multiple supports per visit. UCSC = University of California at Santa Cruz.
To better capture the ways that students use Slug Support, we conducted a cluster analysis, identifying four different program utilization types: (1) frequent repeated visits for a broad array of financial hardship issues (Severe Hardship), (2) chronic food and hunger-related visits (Food Insecurity), (3) visits for academic or behavioral misconduct problems that had an underlying mental health or financial hardship issue (Mental Health), and (4) one-time visits (One-Offs). Cluster analysis does not conceptually define the clusters, so we ascribed the labels to the clusters based on the patterns of case notes that were identified by the algorithm. Counts and percentages of each cluster and mean visits are included in Table 3, percentages within each cluster with a given need are included in the last four columns of Table 1, and percentages within each cluster with a given support are included in the last four columns of Table 2.
Total, Percentage, and Mean Number of Slug Support Visits
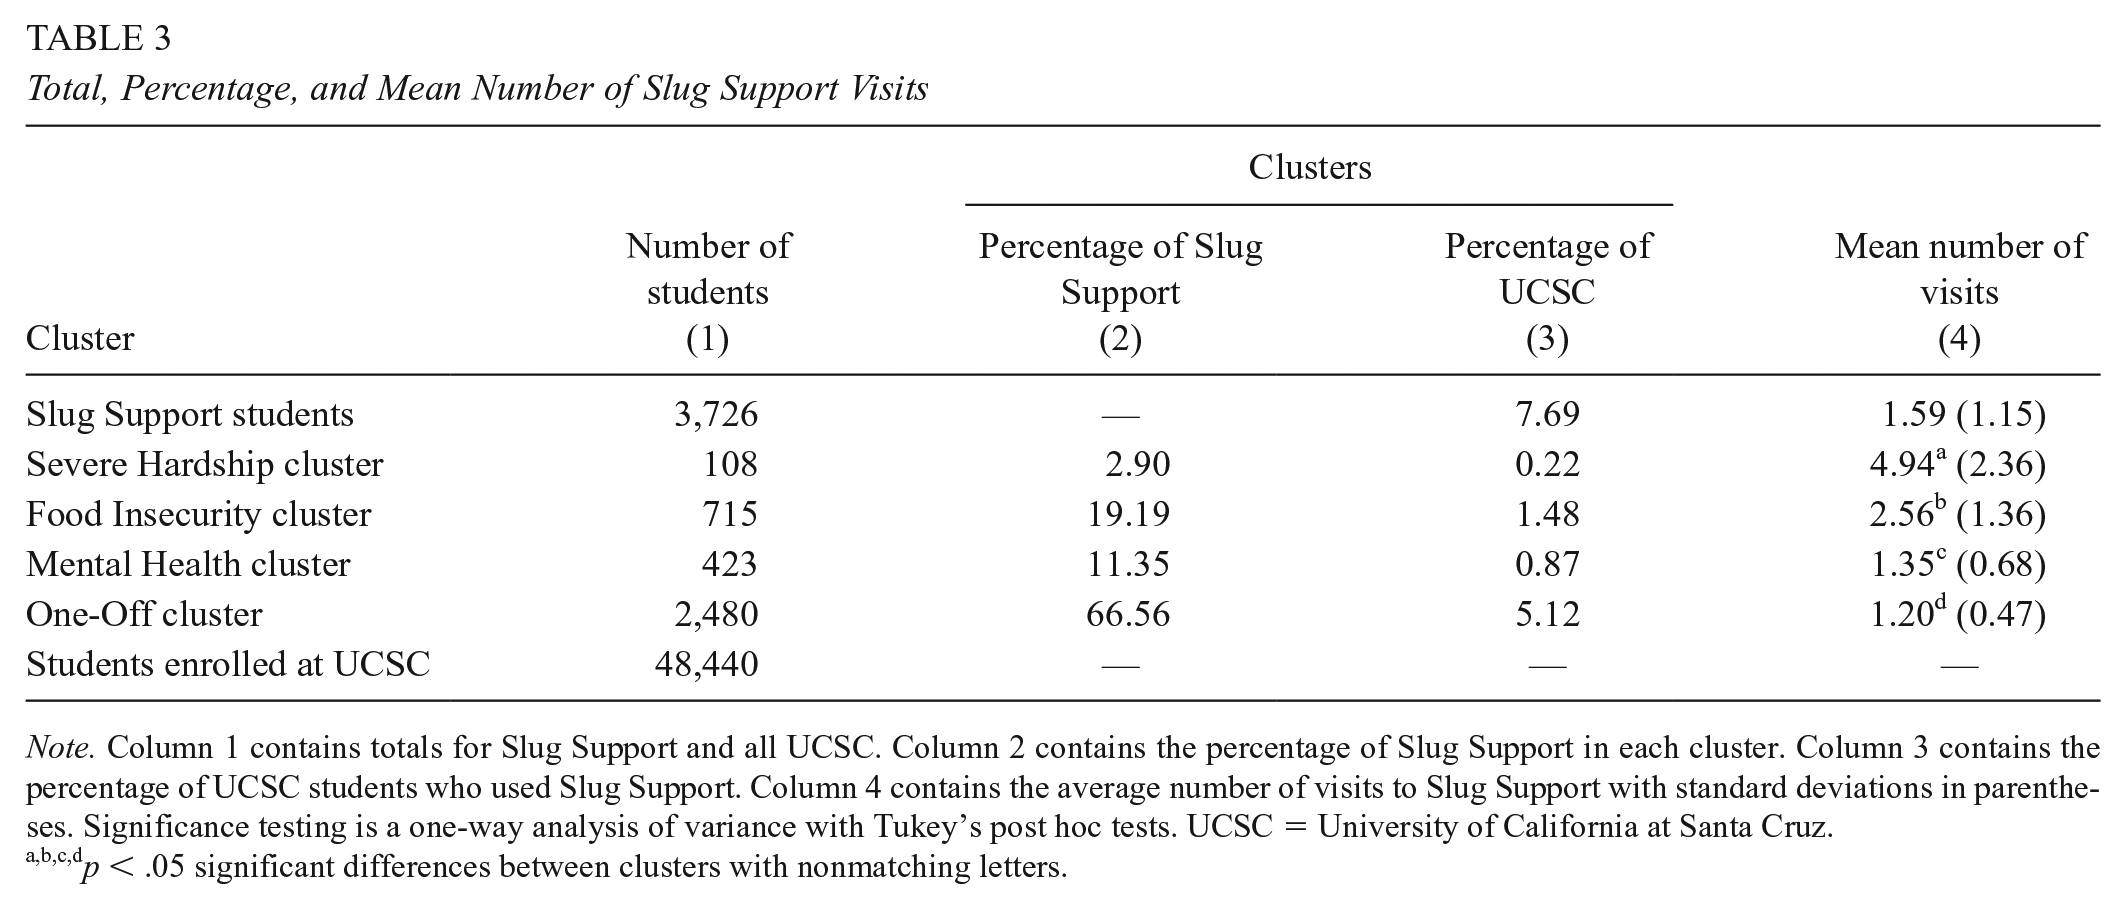
Note. Column 1 contains totals for Slug Support and all UCSC. Column 2 contains the percentage of Slug Support in each cluster. Column 3 contains the percentage of UCSC students who used Slug Support. Column 4 contains the average number of visits to Slug Support with standard deviations in parentheses. Significance testing is a one-way analysis of variance with Tukey’s post hoc tests. UCSC = University of California at Santa Cruz.
p < .05 significant differences between clusters with nonmatching letters.
The vast majority of students fell into the one-off cluster, with consecutively fewer students in the food insecurity, mental health, and severe hardship clusters. Students in the severe hardship cluster had the most visits, averaging nearly five visits, followed by food insecurity, mental health, and one-offs. The lopsided apportioning of students into the one-off cluster, which has “budgeting and financial aid” as its modal case note, suggests that a large percentage (about two thirds) of students with financial hardship can be stabilized with a one-time intervention to expedite a financial aid payout. The severe hardship cluster has relatively high rates of nearly all case note types, demonstrating how unmet basic needs can affect students in confounding ways. The confluence of variables related to conduct and psychological well-being among the mental health cluster highlights the preponderance for academic and behavioral misconduct to be rooted in issues with social-emotional well-being.
Usage Patterns by Demographic Group
UCSC is a diverse campus, and Slug Support is even more so. As shown in Table 4, Slug Support users are more likely to be Latinx (47.4% vs. 26.8% on the campus as whole) and African American/Black/Caribbean (5.6% vs. 1.9%), as well as Native-non-English speakers (28.3% vs. 20.8%) first-generation college students (62.9% vs. 41.5%), and those eligible for EOP (59.3% vs. 33.6%). Slug Support students are also more likely to be women (58.8% vs. 50.8%) and gender undefined (2.9% versus 1.3%). Finally, Slug Support serves a larger share of junior transfer students (23.5%), who come mainly from community colleges, than the campus as a whole (18.9%). Transfer students comprise one third of each entering class and they are, on average, more likely to be students of color, first-generation, and older than those who enter as frosh. Taken together, Slug Support generally serves students who have been historically underrepresented and underserved in higher education.
Demographic Characteristics of UCSC and Slug Support Students

Note. Column 1 is percentages of demographic groups among all UCSC students. Column 2 is percentages of Slug Support students. Columns 3 to 6 is percentages of each cluster. Data are for fall quarter 2012 through fall quarter 2017. Significance tests are chi-squares. EOP = Educational Opportunities Program; UCSC = University of California at Santa Cruz.
p < .05 significant differences between clusters with nonmatching letters (Columns 3–6).
p < .05 significant differences between all Slug Support and all UCSC (Columns 1–2).
Table 4 also compares the demographic information of each cluster with each other. In general, the food insecurity and severe hardship clusters had larger proportions of underrepresented and underserved demographic groups, whereas the mental health cluster was consistently more demographically similar to the overall UCSC campus population.
Enrollment Retention
A key goal of the program is to stabilize students’ housing, food, financial, or mental health situation so that they can remain enrolled in school. There are number of ways of measuring retention, so we have represented it in multiple forms in Tables 5 and 6.
Retention Cross-Tabulations for All UCSC, Slug Support, and CalFresh

Note. Column 1 indicates year of service provision. Column 2 is retention to second year (for 2012–2016 fall cohorts), Column 3 is to third year (2012–2015), Column 4 is to fourth year (2012–2014), Column 5 is to fifth year (2012–2013), Column 6 is to sixth year (for 2012 fall cohort). Retention includes graduation. CalFresh students include those who enrolled through a peer-led workshop as well as those who met with Slug Support social workers. Total number of students retained in parentheses and cumulative retention in square brackets. Significance tests are chi-squares. UCSC = University of California at Santa Cruz.
p < .05. **p < .01. ***p < .001.
Slug Support Retention Discrete Survival Analyses
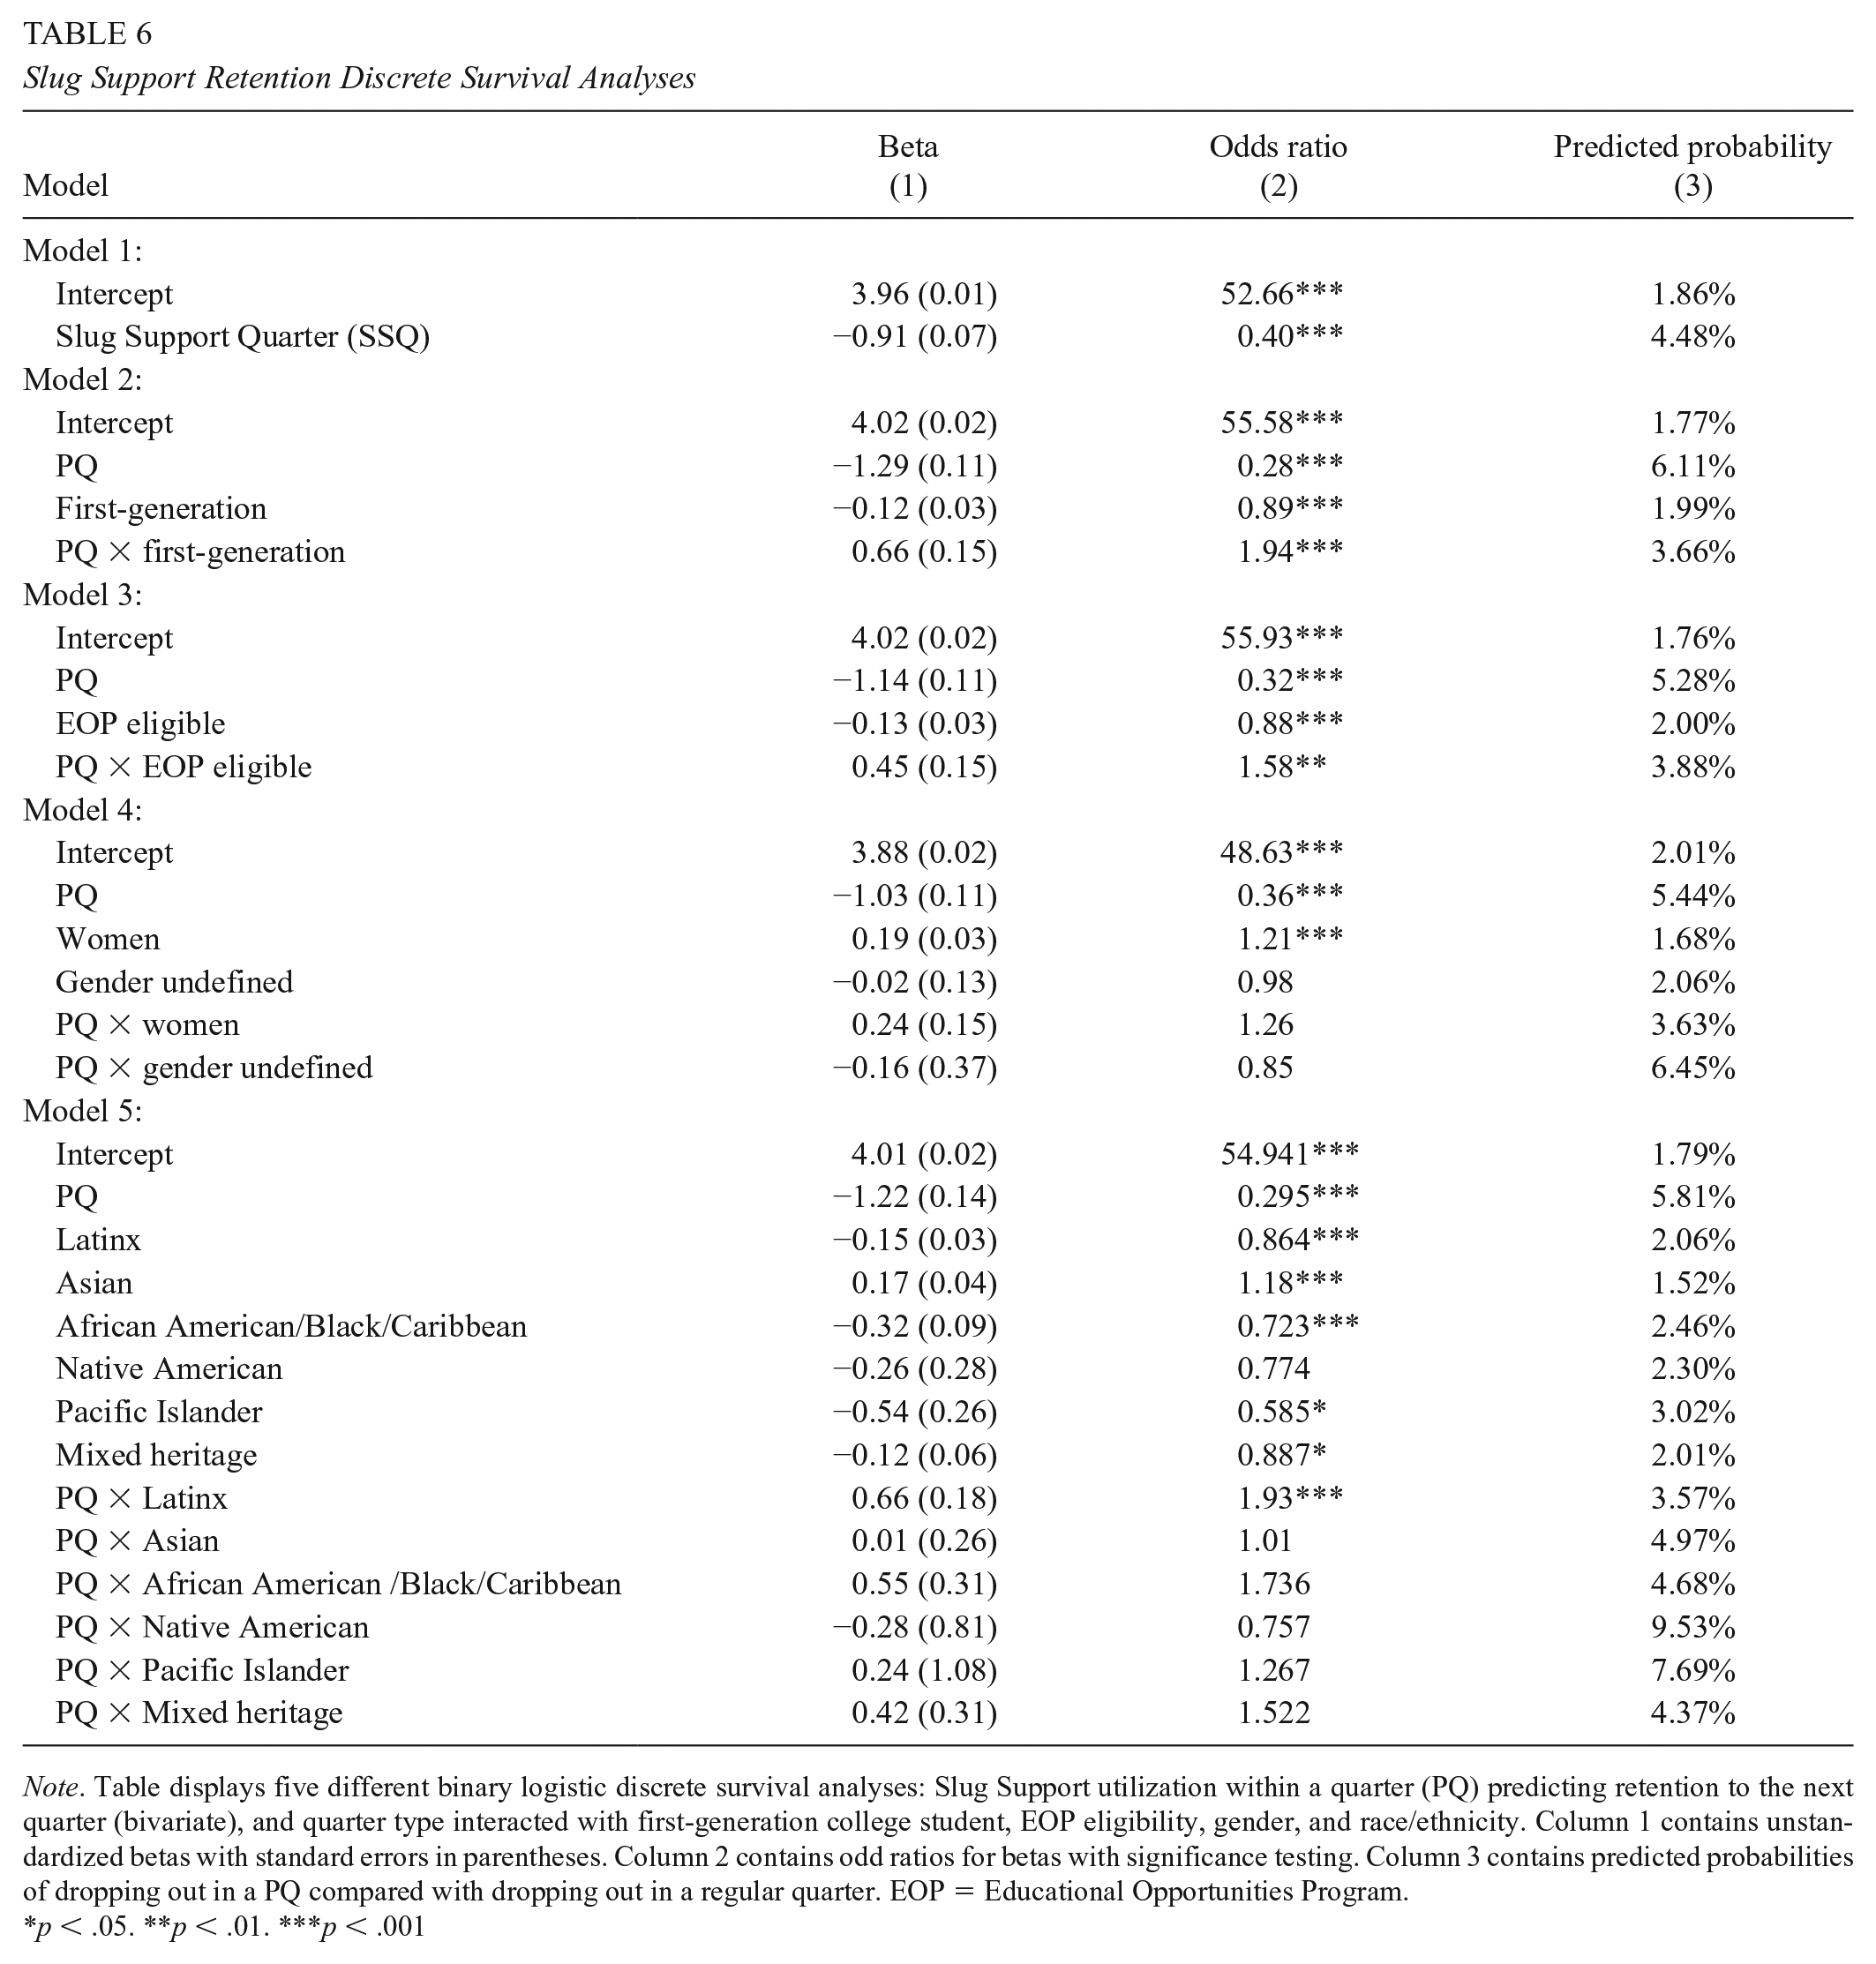
Note. Table displays five different binary logistic discrete survival analyses: Slug Support utilization within a quarter (PQ) predicting retention to the next quarter (bivariate), and quarter type interacted with first-generation college student, EOP eligibility, gender, and race/ethnicity. Column 1 contains unstandardized betas with standard errors in parentheses. Column 2 contains odd ratios for betas with significance testing. Column 3 contains predicted probabilities of dropping out in a PQ compared with dropping out in a regular quarter. EOP = Educational Opportunities Program.
p < .05. **p < .01. ***p < .001
Multiyear Retention Cross-Tabulation
Table 5 presents the proportion of Slug Support students and CalFresh enrollees—those who were supported to enroll in CalFresh either by a Slug Support social worker or through a peer-led enrollment workshop—who were retained annually. We examined second-, third-, fourth-, fifth-, and sixth-year retention (counting graduation as retention) broken out by which year the student used Slug Support or enrolled in CalFresh. Because students who used services in later years necessarily were retained to that year, we display cumulative retention rates only for students who used Slug Support in their first year. Note that first year includes both new frosh as well as new transfer students.
In general, Slug Support students are retained at worse rates than the campus average, which is not surprising given that the program reaches the students who are experiencing hardships. For example, 92.1% of all UCSC students are retained to their second year, but only 86.8% of students who use Slug Support in their first year are retained. Similar patterns emerged for all retention years shown in Table 5. We cannot know what the retention rates of these students would be had they not used the program, but there is evidence from the literature that students facing hardships experience challenges to staying enrolled that their more advantaged peers do not (Collier et al., 2019; Martinez et al., 2016).
One group that stands out in terms of retention is students who enrolled in CalFresh. They were consistently retained at higher rates than other Slug Support students, and in many cases these students were retained at rates better or equivalent to the campus average. Whereas UCSC retains 92.1% of all frosh to the second year, 93.1% of all frosh CalFresh enrollees were retained to their second year. Likewise, 93.5% of all students who enrolled in CalFresh in their second year were retained to their third, and 95.2% of all students who enrolled in CalFresh in their third year were retained to their fourth. Looking at 2-year retention (e.g., sophomore CalFresh enrollees’ retention to their fourth year) is less clear because these cross-tabulations include fewer cohorts and therefore smaller cell sizes. Although the picture is not perfectly consistent, these findings suggest that reliable public assistance for low-income students may support collegiate persistence. The parity with the campus as a whole suggests that CalFresh enrollment may greatly reduce equity gaps, as low-income students typically drop out at higher rates than middle- and high-income students. Food pantry visits, emergency hotel stays, hardship funds, and housing or employment referrals were all associated with lower retention rates than CalFresh enrollment. As noted in Tables 1 and 2, just 49 students came to Slug Support asking to be signed up for CalFresh, but 507 received this support. This suggests that higher retention rates of CalFresh enrollees compared with other students may not be due to increased motivation for staying in school by pursuing CalFresh, although we cannot claim any causal relationship.
Quarterly Retention Survival Analyses
Findings in Table 5 do not account for the demographic differences of students who use Slug Support, so Table 6 provides estimates from five different models of Slug Support on next-quarter retention for participating students as a whole and by demographic group. Overall, participation in Slug Support is associated with significantly worse next-quarter retention; predicted probabilities showed that participating students have a 1.86% chance to drop out during a non-Slug Support quarter whereas these same students had a 4.48% chance to drop out during a Slug Support quarter (model 1). When we added control variables to the model, the Slug Support beta and intercept did not meaningfully change.
We then ran four different discrete survival analyses adding in different demographic variables (Models 2–5). In each case, the historically underrepresented or underserved group experienced higher retention rates than their peers while on Slug Support. First-generation students, EOP eligible students, and Latinx students were all statistically less likely to be retained than their peers in general (i.e., during a non-Slug Support quarter). During a Slug Support quarter, however, the inverse was true: The historically underrepresented group consistently had higher retention rates than the not underrepresented group. Taking first-generation status as an example (Model 2), first-generation students were more likely than returning-generation students to drop out during a typical quarter (first-generation = 1.99%; returning-generation = 1.77%). In contrast, first-generation students were less likely than returning-generation students to drop out during a Slug Support quarter (first-generation = 3.66%; returning-generation = 6.11%). These differences may be due to how different demographic groups used the program, as these students are more likely to be food insecure, and the food insecurity cluster had the highest rate of retention, whereas those who are not first-generation, EOP ineligible, and Caucasian college students are more likely to use Slug Support for conduct and mental health issues, the cluster with the lowest retention rate. These significant crossover interactions suggest that providing basic needs supports to students when they are in crisis could reduce equity gaps in college retention, as the groups with the lowest retention rates in general (i.e., first-generation, EOP eligible, and ethnic minority) had the highest retention rates while utilizing Slug Support.
Limitations
Although the data used for this study are rich with descriptive information about students’ unmet basic needs and services received, the lack of an appropriate control group limits our ability to draw causal conclusions from this analysis. Campus officials aim to serve all students who are identified as needing support through Slug Support and rationing available services to a vulnerable population in order to create a robust research design is unethical. We have elected to not pursue quasi-experimental methods using propensity score matching because our administrative data do not have sufficient information on students’ backgrounds and current situations (e.g., housing status) for us to identify an appropriate control group. As such, we have reported only descriptive findings. We recognize that students with more motivation to remain in school or with greater support networks at college may have been more likely to seek and receive services from Slug Support, including enrolling in CalFresh, and therefore may be more likely to remain enrolled. However, it is also possible that the program offered stabilizing support without which students would not have been able to remain enrolled, particularly for those who enrolled in CalFresh without ever having seen a program social worker. We also do not know how a program like Slug Support would work in another campus context. UCSC is a diverse campus with many underrepresented and low-income students, which may reduce stigma associated with Slug Support participation. Research should consider participation in and effectiveness of these programs in less socioeconomically diverse campus environments. Future research should explore these issues in more depth.
Discussion
In an era of tightening budgets and changing student demographics, ensuring that admitted 4-year college students have a chance to succeed is of the utmost importance to institutions of higher education. Addressing students’ basic needs is an essential first step. Slug Support at UCSC was first implemented in 2012 and today serves roughly 2,000 students per year with shelter, food, financial, and other supports. Utilization is highest among underrepresented undergraduates, including those who are EOP eligible, first-generation, and ethnic minorities. Cluster analysis shows that students’ reported hardships and the supports they receive fall into four main groups, including those with multiple severe hardships, food insecurity only, mental health problems, and one-time needs for assistance or referral. Large portions of first-generation, EOP, African American/Black/Caribbean, and Latinx students presented needs specifically in relation to food insecurity and also more broadly with multiple and severe hardships that persisted across multiple visits to the program. These students were the most likely to be homeless, chronically hungry, and unable to pay for their basic needs. In contrast, students whose main problem was related to mental health were demographically more similar to the overall campus.
Although a majority of participating students were retained year to year, retention rates for Slug Support participants were lower than campus-wide averages for all groups except one. Students facing food insecurity who enrolled in CalFresh, California’s SNAP program, had the highest rates of retention, even higher than the campus-wide rate.
These findings suggest that addressing food insecurity may be an important student success intervention. This approach was aided in California, which has put in provisions to its SNAP program so that otherwise eligible college students could meet the work requirements without having to take jobs outside the university. Although several states have eased restrictions for enrolling food insecure college students in SNAP, these policy changes are not nationwide, and eligibility criteria vary between the states that allow undergraduate enrollment. Current proposals to scale back SNAP at the federal level put accessibility for college students even further out of reach (St. Amour, 2020). Our research suggests that improving access to SNAP is a potentially effective policy approach to addressing the needs of food insecure students, which can help them remain enrolled.
To serve students with the most pressing financial needs on campus requires an institutional shift from considering these issues as individual deficits and instead considering broader trends in college enrollment and cost of living. Intentional changes in student demographics to improve diversity and inclusion require additional resources to ensure students have the ability to focus on their studies rather than their economic needs. The reach of a basic needs program into the most historically marginalized groups on campus speaks to the severe challenges that some students face and the necessity for universities to provide services specific to those students’ lived realities.
Footnotes
1.
Students are designated as eligible for the Educational Opportunity Program depending on a number of criteria related to socioeconomic status: ethnicity, parental income, the high school that they attended, and California residency. On UCSC campus, EOP has counselors and different types of student programming and events, as well as a summer bridge program to support incoming students.
Authors
BRANDON BALZER CARR is a research associate at the John W. Gardner Center for Youth & Their Communities at Stanford University. He integrates education psychology and gender psychology to consider the mental processes that facilitate educational outcomes.
REBECCA A. LONDON is an associate professor of sociology at the University of California, Santa Cruz. She studies the ways that communities and community organizations support successful outcomes for children, youth, and young adults.