
Abstract
This study developed measurement scales on student leadership capacity building through a survey of 280 students from nine U.S. high schools. Exploratory and confirmatory factor analyses resulted in a personal, interpersonal, organizational, and overall scale for building student leadership capacity. The scales included eight mechanisms that schools can use to enhance student leadership: pedagogy, relationships, radical collegiality, governance structure, research, group makeup, consistency, and recognition. The scale items also reflected three leadership competencies: critical awareness, inclusivity, and positivity. Focus groups and interviews with students and teachers in these nine schools supported survey findings and suggested implications for practice.
Keywords
Baumann et al. (2014) remind us “preparation for active citizenship was a foundational principle of public education in America from its beginning” (p. 1). Not only should schools prepare students for future citizenship but they should also provide authentic opportunities for students to be civically engaged in school (Shiller, 2013) through a participatory institutional culture (Baumann et al., 2014).
Research has demonstrated that involving students in authentic leadership positions in schools (i.e., providing opportunities to share their perspectives and take part in school change processes) can have positive effects on youth development in the form of improved peer and adult relationships (Yonezawa & Jones, 2007), positive self-regard and feelings of competence, as well as increased student engagement (Deci & Ryan, 2008) and academic performance (Mitra, 2004). Additionally, schools benefit from diverse stakeholder involvement in the decision-making process (Kusy & McBain, 2000). According to the United Nations’ Convention on the Rights of the Child (1989), students should be considered a stakeholder group, as all but two nations have signed on to the idea that youth have the “right to express [their] views freely in all matters affecting the child.” Furthermore, the various demographic communities to which each student belongs benefit from what Feldman and Khademian (2003) call “cascading vitality.” When students are able to lead in ways that inspire and empower others, they “becom[e] power generators from which their constituents draw energy” (Kouzes & Posner, 1995, p. 185). In this way, students lift up people in their communities, often despite structural political and social marginalization.
There is a growing body of student voice research unearthing such evidence, yet most studies have been qualitative in design (e.g., Mitra, 2007, 2008, 2009a, 2009b; Mitra et al., 2013; Osberg et al., 2006; Ozer & Wright, 2012; Silva, 2002). Considering qualitative studies are bound by the contexts in which the studies take place, quantitative research has the potential to reach a wider audience of participants, and thus, provide more perspectives on student voice initiatives. The number of quantitative studies in the field is limited, perhaps in part due to an absence of validated measurement tools that could quantify student leadership capacity building mechanisms. Although several scales exist for measuring an individual’s leadership skills (e.g., Antino et al., 2014; Carifio, 2010; Walumbwa et al., 2008), these scales are not designed to measure organizational mechanisms that support students in building those leadership skills. Once such tools are established, quantitative studies can determine the correlational and causal relationships between specific mechanisms and desired positive outcomes, which would better inform practitioners in their efforts to design and implement quality student voice initiatives.
Study Overview
This article describes the validation of scales to measure a school’s capacity for building student leadership within a sequential, mixed-methods QUAN(qual) → qual study design. Potential scale items were developed following a review of literature on capacity building, student voice initiatives, leadership theory, and existing scales measuring leadership and youth-adult partnerships. Students from nine high schools located in the northeastern part of the United States completed the survey, with 280 responses from both urban and rural high schools. These responses were included in the exploratory and confirmatory factor analyses (CFAs), resulting in four student leadership scales with good model fit. T tests, analyses of variance (ANOVAs), and metric invariance tests found significant differences between urban and rural school students with regard to organizational items and differences by year in school for interpersonal items.
Following scale development and tests for significant difference across demographic groups two focus groups and an interview were conducted. These qualitative data, combined with narrative survey responses, further explored thoughts about student leadership for the participants and in the participating sample schools.
Measuring Student Capacity Building: A Literature Review
This section draws from student voice and leadership research to address three questions: How can educators build capacity for student leadership? What kind of student leadership should be fostered? How can a school’s student leadership capacity be measured?
How Can Educators Build Capacity for Student Leadership?
Mitra’s (2006) pyramid of student voice reflects three levels of student voice. At the bottom, students are simply being heard, perhaps by sharing their opinions on a survey. At the middle level, students work alongside adults in partnership to accomplish school goals. At the top level is building capacity for student leadership. Educators ask how to build capacity for student leadership. To further concretize capacity building, this study was organized by Mitchell and Sackney’s (2011) three dimensions of capacity building framework: personal, defined as building individual student skills; interpersonal, defined as students working with teachers to make school decisions; and organizational, defined as involving the school culture, structures, and ways of communicating.
Mitchell and Sackney (2011) noted that one of the largest barriers to educational reform is applying new knowledge in practice; therefore, it is important that personal capacity building activities such as professional development or skill-building workshops help students and teachers apply newly learned skills in school activities. Student voice scholars have identified several strategies schools have used to foster the personal capacity building of students’ leadership skills. For example, the much of student voice research speaks to the value of skills training for youth (e.g., Biddle, 2015; Yonezawa & Jones, 2007).
Interpersonal capacity is built through shared purpose and values, team building, honest critique, regular dialogue, and shared decision making through consensus (Mitchell & Sackney, 2011). Mitchell and Sackney noted discourse and dialogue foster learning more than direct instruction. They pointed out that dialogic learning occurs within relationships and joint work such as peer coaching, collaborative planning, and action research, which leads to sustained changes in teaching and learning practices. In the student voice research, one identified practice that facilitates interpersonal capacity building for students and teachers is youth-adult partnerships (e.g., Fielding, 2001; Mitra et al., 2013).
The final dimension of Mitchell and Sackney’s (2011) framework is organizational capacity, which encompasses the school culture, structures, and ways of communicating that promote learning. This dimension shapes the other two. Traditional structures often limit personal and interpersonal capacity building due to a lack of support or time, isolation from others, or hierarchical governance structures that prevent power sharing (e.g., Senge et al., 1999). Opportunities for all stakeholders, including students, to be able to step into leadership roles are critical to organizational capacity building. A growing subfield of the student voice literature focuses on the organizational mechanisms and processes that enable students to be meaningfully involved in school decisions via inclusive government structures (e.g., Brasof, 2014) and action research projects on school issues (e.g., Mitra, 2007).
A review of the student voice literature also detailed nine voice-fostering mechanisms schools can employ to support student leadership. The mechanisms, or means by which an effect or result is produced (mechanism, n.d.), included,
Radical collegiality defined by Fielding (2001) as “an expectation that teacher learning is both enabled and enhanced by dialogic encounters with their students in which the interdependent nature of teaching and learning and the shared responsibility for its success is made explicit” (p. 130).
Community partnerships, which provide training or financial resources to schools (e.g., Denner et al., 2005; Mitra, 2007).
Pedagogy or how information is conveyed and made accessible to all students (e.g., Campbell, 2009; Mitra, 2008).
Research to inform decision making, often through participatory action research (e.g., Osberg et al., 2006; Yonezawa & Jones, 2007).
Relationship building between youth and adults (e.g., B. H. J. Brown, 2010; Møller, 2006).
Consistency or regularly holding meetings at the same time and location (e.g., Chopra, 2014; Yonezawa & Jones, 2007).
Governance structure or a school’s formal system of decision making and students’ roles in it (e.g., Brasof, 2014, Pautsch, 2010).
Recognition or acknowledging and compensating students for their leadership work (e.g., Chopra, 2014; Mitra, 2009).
Group makeup or a small group size with an even youth:adult ratio (e.g., Biddle, 2015; B. H. J. Brown, 2010).
What Kind of Student Leadership Should Be Fostered?
This study focused on the leadership competencies of critical awareness, inclusivity, and positivity, which stem from authentic, social justice, inclusive, and positive leadership theories. Preskill and Brookfield’s (2009) book on social justice leadership as well as the self-awareness and self-development tenants of authentic leadership (Walumbwa et al., 2008) contributed to this study’s definition of critical awareness as reflecting on, understanding, and questioning positive and negative attributes of one’s self and society to foster equity and growth. Booysen’s (2013) definition of inclusive leadership informed this study’s definition of inclusivity, which is enabling all members to fully participate and learn from each other. The dimension of positivity was defined in this study as: applying a strengths-based lens to facilitate growth and enable flourishing. This reflects Cameron’s (2012) principles of positive leadership. Competencies or practices from college student leadership theories such as Seemiller’s (2016) Student Leadership Competencies Inventory (e.g., civic responsibility, interpersonal interaction, positive attitude) and Kouzes and Posner’s (1998) Student Leadership Practices Inventory (e.g., “challenge the process,” “enable others to act,” “encourage the heart”) are aligned to these three adult leadership theories. Redmond (2013) brings these adult-focused theories to youth leadership in the skills of critical thinking, social and emotional intelligence, and confidence. These align with this study’s focus on the leadership competencies of critical awareness, inclusivity, and positivity.
How Can a School’s Student Leadership Capacity Be Measured?
Validated instruments that measure aspects of leadership are mostly limited to self-assessment tools designed for adult respondents. Theory-specific leadership scales like the Authentic Leadership Questionnaire (Walumbwa et al., 2008) Relational Leadership Questionnaire (Carifio, 2010), and the Positive Leadership Assessment Scale (Antino et al., 2014) were validated with adult samples. These scales also focused on the skills and practices of a leader, not on the organizational supports to build leadership capacity.
Although many scales target adults, there are some leadership scales that have been adapted for or specifically designed for younger respondents. For example, Kouzes and Posner’s (1998) Student Leadership Practices Inventory was originally created for adults, but the authors adapted the scale to make the assessment accessible and relevant to students. Seemiller’s (2016) Student Leadership Competencies Inventory (e.g. civic responsibility, interpersonal interaction, positive attitude) was also designed for college students. This scale has been a valuable contribution to the student leadership field, as it measures 60 competencies and draws from the social change model of leadership development and thus recognizes leadership on individual, group, and community levels (Higher Education Research Institute, 1996). The Social Justice Leadership Scale (Özdemir & Kütküt, 2015), exclusively measuring social justice leadership skills, was designed for and validated with high school students. While these scales were made for students, they remain skill-based leadership assessments that do not fully account for the organizational mechanisms that build students’ leadership skills.
The most youth-friendly scale that measures contextual supports is the Youth-Adult Partnerships in Community Programs Scale (Zeldin et al., 2014). This scale contains two factors: supportive adult relationships and youth voice in decision making, but does not look at the three personal, interpersonal, and organizational levels, nor leadership competencies or mechanisms.
Overall Study Design
This study utilized an explanatory sequential, transformative mixed-methods design. In the language of mixed methods this was a two-phase QUAN(qual) → qual design. Creswell and Plano Clark (2011) suggest a mixed-methods approach to research is appropriate when, among other situations, a researcher wants to explain initial results and more deeply understand the problem through multiple data collection and analysis modes. Mixed-methods studies allow for a deeper exploration of the research problem and make room for the inclusion of multiple worldviews in a single study. The sequential two-phase design allowed for survey data collection across a broad range of high school students followed by narrative in-depth feedback from a small group of participants. The explanatory sequential design provided for in-depth discussion of the significance of survey findings. Using a transformative design involves the researcher designing a study to identify and challenge social injustices by elevating the voices of marginalized participants (Creswell & Plano Clark, 2011). In this case, the marginalized voices came from students who often are barred from acting as leaders and decision makers in their schools.
As this study involved a transformative design, emancipatory theory was utilized in the design and interpretation of research data. Inclusion of diverse student voices was examined through feminist, racial, socioeconomic, and ability lenses. In addition to centering historically marginalized voices, the study also aimed to start a discussion and develop a plan for transforming structures that promote hierarchy and silence students rather than simply collecting data and allowing structural oppression to continue without taking steps to address it.
In Phase 1, scale items were developed for the personal, interpersonal, and organizational student leadership capacity building dimensions. The items also covered the critical awareness, inclusivity, and positivity leadership competencies as well as eight mechanisms for building leadership capacity: pedagogy, relationships, radical collegiality, governance structure, research, group makeup, consistency, and recognition. Using the three organizational student leadership capacity building dimensions from Mitchell and Sackney (2011) as an overarching framework, the initial proposed scale items were generated following a synthesis of literature from the student voice, civic engagement, and youth and adult leadership fields. The proposed items all had a Flesch-Kincaid rating of 8.0 or less. No reverse-scored items were included. Items had a six-point response scale, with 1 = strongly disagree, 2 = disagree, 3 = somewhat disagree, 4 = somewhat agree, 5 = agree, and 6 = strongly agree. Questions were ordered to mirror the flow of conversation, first determining eligibility, and then beginning with interesting questions that draw in the respondent and help them reflect on the topic (Baron, 2018).
After initial scale items were developed, they were reviewed by doctoral students in a leadership studies program, high school teachers, high school students for whom English was a new language, and student voice scholars. Reviewers rated each item for fit within each specified dimension (i.e., personal, interpersonal, or organizational student leadership capacity building), and they selected the items that best fit the overarching student leadership construct and the specific dimension. Open response boxes asked reviewers to suggest revisions to items, comments, or questions. Student reviewers had the opportunity to ask questions or provide verbal feedback in lieu of or in addition to written feedback so as not to preclude students who had difficulty writing from providing feedback. Based on reviewer feedback, the language of individual items and the introductory sections were revised for clarity.
A pilot study with a convenience sample of 38 students indicated the need for minor word modifications in the organizational scale items and no significant changes for the personal or interpersonal scale items. The final study survey included the proposed scale items as well as open-ended narrative and demographic questions. The final scales were identified through exploratory and CFAs and validated through goodness of fit measures. In Phase 2, students and educators gave feedback on survey results and discussed implications for actions through focus groups and interviews.
The 280 survey respondents were recruited from rural and urban schools that deliver instruction in English. New York City schools were invited to participate in the study through emails from their network leaders. Rural schools from the northeastern United States received an email invitation to participate in the study from the primary author. Several of these schools were in the primary author’s personal network of contacts. Rural schools were targeted for recruitment to balance the number of respondents attending school in urban settings. Students were eligible to participate in the study if they had attended their high school for at least 3 months and could demonstrate understanding of written English as evidenced by their self-reported understanding of study instructions and initial questions. Many of the student respondents attended school in similar types of schools in New York City, and this homogeneity of the sample is a limitation of this study. Descriptive statistics for study respondents are shown in Table 1.
Descriptive Statistics for Study Respondent Demographics

Phase 1: Data Collection and Analysis
Students accessed the study on their phones via a school-specific QR code or typed the survey link into a web browser on a school computer. After completing the survey, students were invited to email the principal investigator if interested in participating in a focus group to discuss student leadership further. Teachers were invited to participate in a focus group via email.
Principal component analysis (PCA) with varimax rotation was used to analyze results for each of the three dimensions (personal, interpersonal, and organizational) as well as for the overall scale. The Kaiser-Meyer-Olkin measure of sampling adequacy was >.95 for all scales, affirming an adequate sample size for factor analysis. Item frequency distributions were reviewed for extreme measures of skewness and kurtosis ≥3.0; no distributions exceeded this guideline. All items also met the criteria of a bivariate correlation ≥.30 with at least one other proposed scale item. Factors with eigenvalues <1.0 and below the elbow of the scree plot were eliminated (Cattell, 1966). Items with loading levels less than .40 (Worthington & Whittaker, 2006) or which cross-loaded on more than one factor at .40 or higher were eliminated.
Items that were retained following PCA were entered into AMOS for CFA for each of the potential scales. Items with modification indices ≥15 and standardized residual covariances ≥1 were considered for deletion. Models were tested for goodness of fit using relative chi-square (CMIN/df [degrees of freedom]), comparative fit index (CFI), and root mean square error of approximation (RMSEA). To evaluate reliability and validity of the models, composite reliability (CR), average shared variance (AVE), and maximum shared variance (MSV) were reported.
Following CFA, comparative analyses were run for significant differences across demographic groups, including grade, length of time in the school, race, home language, presence of an Individualized Education Plan, and school. Metric invariance tests were run in AMOS. Leadership competency and mechanism item mean scores were computed in SPSS and compared using ANOVA with Tukey post hoc tests.
Phase 2: Data Collection and Analysis
Qualitative data were collected from students and adults to provide feedback on the relevance of scale results for their schools. A total of 107 narrative responses were collected from survey respondents through the open-ended narrative questions. One three-student and one 10-faculty, with nine teachers and one principal, focus group was conducted with members of one school (ENL1). The opportunity to participate in a focus group was extended to all students who had completed the survey and educators in participating schools. Focus group participants shared their interpretations of the quantitative data. No monetary or extrinsic incentive was provided for focus group or interview participation. One teacher from a different school (Transfer2) participated in a qualitative interview. Participants were shown all nine schools’ mean scores for items measuring the eight mechanisms for building leadership capacity. Using a semistructured interview protocol, participants addressed questions for approximately 45 minutes.
The process of inductive coding suggested by Boyatzis (1998) was followed. Once focus group and interview data were transcribed, memoing was used to create categories and index the raw focus group and interview data into categories. Next, an outline was produced by reducing the raw information, identifying themes in the subsamples, and comparing themes across subsamples. The codes were also applied to the narrative responses to the open-ended survey questions. Differences in subsamples in relation to the identified themes were identified. The synthesis of qualitative findings from the different schools was presented as overarching themes that may be transferable and applicable to different school contexts.
Findings
PCA found two components in the Personal Student Leadership Capacity Building Scale (Inclusive Positivity and Critical Awareness), and single-component solutions for the Interpersonal and Organizational scales. PCA results are shown in Table 2.
Summary of Scale Development PCA Results

Note. PCA = principal component analysis.
Should be <.90. bShould be more than than 60%.
Prior to CFA, bivariate correlations of factor scores were run in SPSS for the scales and components. The Interpersonal scale strongly correlated with both the Personal_Inclusive Positivity component, r = .818, p = .01 and the Organizational scale, r = .868, p = .01. The Organizational scale also strongly correlated with the Personal_Inclusive Positivity component, r = .719, p = .01. The high correlations between scales suggested the items, originally conceptualized as three separate dimensions, may be part of one overarching building student leadership capacity construct.
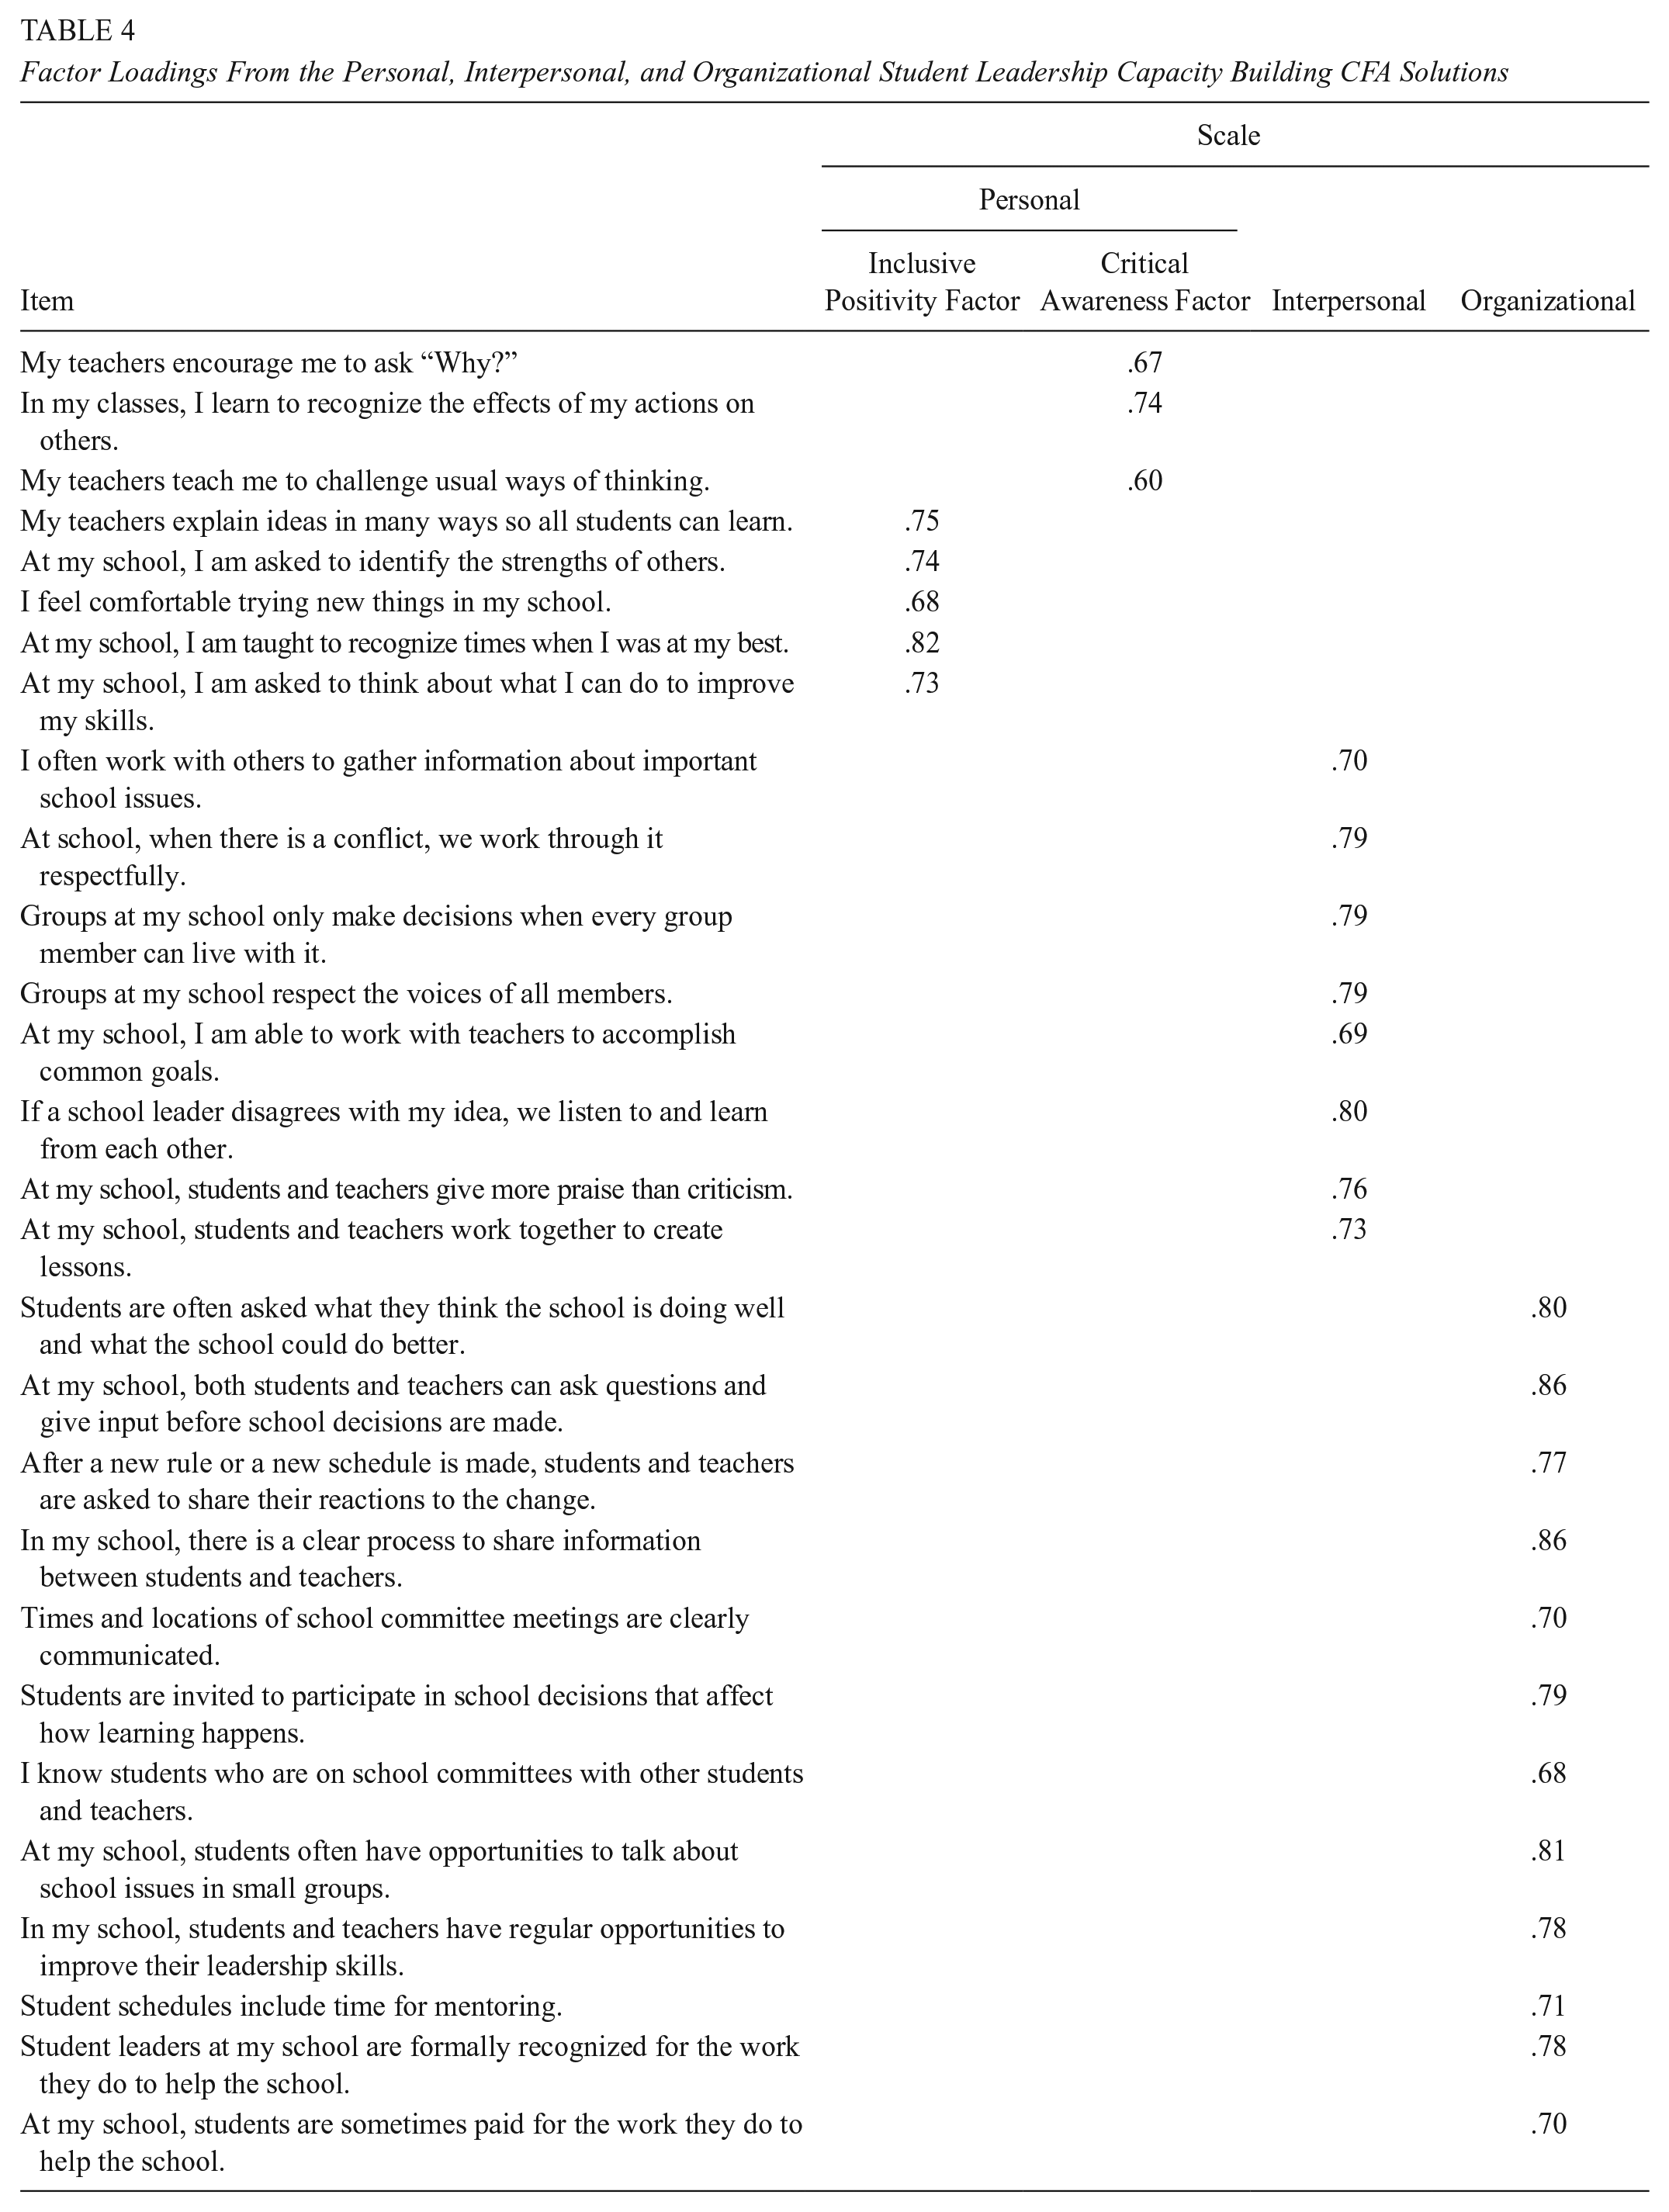
CFA was conducted to confirm goodness of fit for each of the proposed models. Model fit was good. CFA results are reported in Table 3. Item statements and factor loadings on the Personal, Interpersonal, and Organizational scales are shown in Table 4.
Summary of Scale Development CFA Results
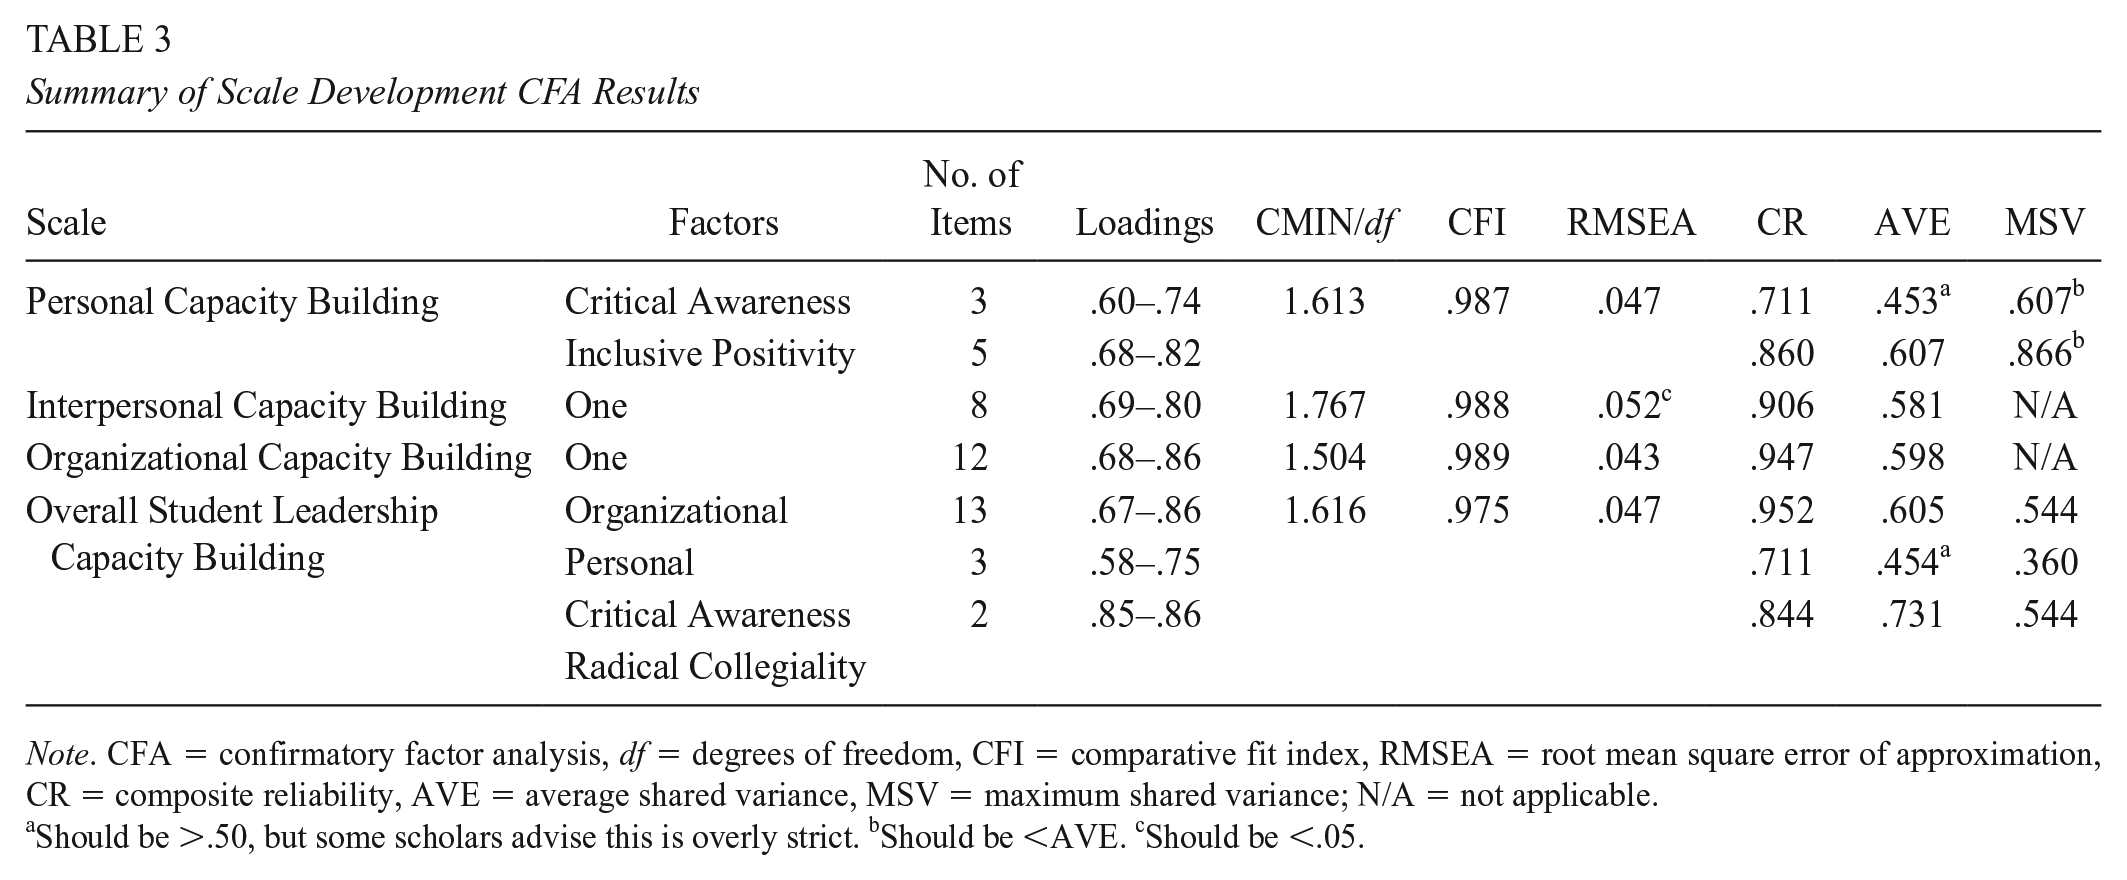
Note. CFA = confirmatory factor analysis, df = degrees of freedom, CFI = comparative fit index, RMSEA = root mean square error of approximation, CR = composite reliability, AVE = average shared variance, MSV = maximum shared variance; N/A = not applicable.
Should be >.50, but some scholars advise this is overly strict. bShould be <AVE. cShould be <.05.
Factor Loadings From the Personal, Interpersonal, and Organizational Student Leadership Capacity Building CFA Solutions
After running CFA for each separate scale, all three scales were placed in one new model in AMOS to further check the correlations between the scales. The scales were highly correlated with one another. The Interpersonal scale was highly correlated with the Inclusive Positivity factor of the Personal scale (r = .88) and the Organizational scale (r = .93). When CFA indicates factors are highly correlated, the model may be reconfigured so that all items load on one factor (T. Brown, 2015). PCA was run again, this time with all 52 initial personal, interpersonal, and organizational items, using the same process and decision rules as were used in developing the separate scales.
When all 52 proposed scale items were run together, three components emerged from PCA, accounting for 64.4% of the variance. Retained items spanned all three individual dimensions, eight mechanisms, and three leadership competencies. Components were labeled: Organizational, Personal Critical Awareness and Radical Collegiality. PCA results are shown in Table 2. CFA was run on the PCA model in AMOS, resulting in a three-factor model with 18 items and good model fit. CFA results are reported in Table 3. Item statements and factor loadings on the Overall scale are shown in Table 5.
Factor Loadings From the Overall Student Leadership Capacity Building CFA Solution

Note. CFA = confirmatory factor analysis.
Validity and Reliability
To determine if the models were valid and reliable, CR, AVE, and MSV were computed. CR should be >.7, AVE, which determines convergent validity by measuring how well the items in a given factor correlate with each other, should be >.5, and MSV, which assesses discriminant validity, should be less than the value of the AVE (Hu & Bentler, 1999). Results for all four scales are shown in Table 6.
Validity and Reliability Measures for the Student Leadership Capacity Scales

Note. CR = composite reliability, AVE = average shared variance, MSV = maximum shared variance; N/A = not applicable.
These components were correlated (r = .78).
While the AVE score for Personal Critical Awareness factor was a bit low, Malhotra and Dash (2011) argue AVE may be too strict, and CR is an acceptable measure of the scale’s reliability. Apart from the slightly high MSV scores for the Personal scale, all the scales’ validity and reliability scores met the suggested criteria for good model fit (Hu & Bentler, 1999).
Comparing Means
To determine if participants’ responses to scale items differed across subgroups of participants, independent-samples t tests and one-way ANOVAs with Tukey post hoc tests were run using the various demographic categories as the grouping variables. Factor scores were computed for each of the scales and used as dependent variables. Regression adjusted factor scores are precise, but they are not easily interpretable or intuitive; thus, the mean averages of the items in each factor are reported here. Metric invariance testing was conducted in AMOS to further explore group differences identified as significant in SPSS. This analysis helps determine whether students belonging to particular subgroups (e.g., students with IEPs [individualized education program]) reported feeling less support from the school in developing leadership than students not belonging to that subgroup (e.g., students without disabilities).
Overall mean scores for the leadership competencies of Critical Awareness (M = 4.34), Inclusivity (M = 4.38), and Positivity (M = 4.31) were similar. For the mechanisms items, the highest mean scores were on Pedagogy (M = 4.45) and Relationship (M = 4.40) mechanisms, while the mechanisms of Research (M = 4.11), Recognition (M = 4.04), and Governance Structure (M = 4.03) had the lowest mean scores.
Using AMOS, metric invariance testing further explored the significant group differences. Significant results were: urbanicity (χ2 = 30.9, p = .030) and year in school (χ2 = 79.7, p = .013) for the Overall scale; year in school (χ2 = 50.362, p = .000) for the Interpersonal scale; and urbanicity (χ2 = 27.942, p = .006) for the Organizational scale. No significant demographic differences were found for the Personal scale.
Focus Group and Interview Data
For ease of discussion, each school was labeled based on a notable feature of the school. Three “ENL” schools exclusively support students for whom English was a new language. Two “Transfer” schools serve students that have been unsuccessful in other schools. Two “Portfolio” schools require students to present a graduation portfolio in lieu of taking standardized tests. All the urban schools in this study were portfolio schools, but the latter two schools differed from the rest, as they were not designed for a specific group of students. Two “Rural” schools were labeled to highlight this unique feature.
Two focus groups were conducted. One focus group included 10 staff members from ENL1, and the other included three students from ENL1. One teacher from Transfer2 participated in an individual interview. Narrative data from the survey participants in all schools were combined with qualitative data from the focus groups and interview, and common themes were identified.
Relationships
Participants talked about the importance of relationships between students and teachers. Positive relationships appeared more common in the urban schools. Rural1 students often alluded to the absence of relationships with their teachers, stating, “[She] is one of the only teachers I trust,” and “Teachers don’t always care about you.”
School Design
Scale mean scores were likely affected by the kinds of schools that students attend. Transfer faces unique challenges when it comes to building community. As one teacher explained, “When students get to us, they have been told what they cannot do, that it’s their fault they have been unsuccessful. We need to change their mind set.” ENL1’s high score on the item about teachers explaining ideas in many ways is a reflection of the school’s design, which is intended to support students who are new to English. Urban students and teachers also referenced the value of their diverse student populations, a feature absent from the rural schools.
Conceptions of Student Leadership
Participants held different notions of student leadership. The principal of ENL1 critiqued traditional, tokenistic student leadership asking, “What does the leadership outcome mean to us? What does it look like? Is it just being the iPad manager?” A teacher addressed a common misconception, stating, “The best leaders are not always the students who do the best academically.” Students in the survey talked a lot about student leadership in the context of group work. ENL students saw collaboration as a leadership opportunity, while students from Rural1 shared mostly negative experiences with group work.
Highlighting Existing Practices
Students and teachers from many schools highlighted strong community partnerships. Students from three schools cited specific examples of restorative justice groups and after school clubs. Relationship-building practices were also highlighted. One example was “Crew,” which is a group of 15 students and one adult that meets each day for the duration of their high school careers. ENL1 has weekly mentoring for seniors and has student representation on the leadership team. Several schools collect student input via surveys, and some hold weekly town hall meetings.
Reflection for Growth
The adult focus group discussion was centered on suggestions for improvement. After noticing another school’s high scores, one teacher asked, “Are there practices you could tell us Transfer2 does that would help us improve?” During the last minute of the adult focus group, one teacher said, “Let’s choose three things to implement next year,” and teachers signed up to lead three of the brainstormed initiatives.
Suggested New Practices
The principal of ENL1 emphasized adults’ roles in fostering student leadership. A teacher said, “We need different opportunities for student leadership.” Suggestions included: hosting student visitors from other schools to discuss student leadership, personalized options for graduation portfolio projects, publicly celebrating student accomplishments, revising the language of the school’s leadership outcome, and improving transparency in the school’s decision-making process.
Barriers
Each focus group addressed barriers they faced while trying to build student leadership. Transfer2 has had difficulty building strong relationships with students, as students are not there for 4 years. Teachers and students at ENL1 shared their disappointment in students’ history of poor performance in leadership roles. Rural1 students discussed more barriers than the other schools, primarily that teachers treat students “like little kids.” One student shared, “Our opinions don’t matter . . . we are seen as just children.”
Discussion
The results of factor analysis provided two approaches to measuring how high schools build student leadership capacity. One option that emerged was a set of three dimension-specific scales: the Personal, Interpersonal, and Organizational Student Leadership Capacity Building scales. Another measurement option was one overarching scale: the Overall Student Leadership Capacity Building scale. Both approaches resulted with items from each of Mitchell and Sackney’s (2011) three dimensions of capacity building. Each approach also includes items that reflect all three proposed leadership theories as well as all eight mechanisms identified in the student voice literature. This finding indicates each of the proposed constructs are distinctive elements within the Student Leadership Capacity Building scales. The presence of these various constructs in the final scales allow schools to measure not simply whether leadership capacity is being developed, but what kind of leadership is being modeled and nurtured, and how this is being done.
Narrative data indicated the scale results reflected stakeholder perceptions, drawing attention to the importance of teacher-student relationships and how results may vary depending on the design or type of school. Students also spoke extensively about teachers’ negative attitudes toward students as a barrier for leadership building. Teachers emphasized the importance of reflecting on existing practices and the practical specificity of the items, which helped them develop an action plan for improvement.
Figure 1 displays a conceptual model, which highlights the eight voice-fostering mechanisms embedded within the three capacity building dimensions. The number of retained items representing each mechanism and the dimension-specific constructs with which they are associated is shown in Table 7. These voice-fostering mechanisms are important features of the model, as they are specific practices schools can implement to build capacity for student leadership. The model also highlights the reflection involved in building student leadership capacity. A feedback loop-style arrow indicates critically aware, inclusive, and positive student leaders are an integral part of the revision process. When students are able to lead in partnership with adults, voice-fostering mechanisms are adapted to be more effective, and student leadership is amplified.

Building student leadership capacity conceptual model.
Number of Mechanism Items in Overall Scale and Across Dimension-Specific Scales

Personal scale and Personal Critical Awareness factor in the Overall scale. bInterpersonal scale and Radial Collegiality factor of the Overall scale. cOrganizational scale and Organizational factor of the Overall scale.
Implications for Practice
Educators interested in developing meaningful student leadership in their schools can use either the Overall Student Leadership Capacity Building scale or the dimension-specific Personal, Interpersonal, and Organizational scales, either as a set or individually, to gather student perceptions of opportunities in the school to build student leadership. Special consideration should be given to ninth-grade students, as these students’ responses differed significantly from their peers. Teachers, ideally in collaboration with students, can reflect on the results and revise school practices to further the development of student leadership in their schools.
Organizational Capacity Building
The organizational mechanisms coalesce around one central mechanism: governance structure. The other organizational mechanisms are necessary components of a shared leadership governance structure that is inclusive and representative of the student body. Items measuring opportunities to participate in school governance had the lowest mean score across all nine schools (M = 4.03). As such, this should be an area of focus for schools trying to build student leadership. Strategies for developing an inclusive governance structure include using a student-written constitution (Calvert, 2004), creating a student advisory board (Campbell, 2009), or evenly distributing power among students and teachers using a three branches of government framework and supporting students to participate in school government through a civics course.
School committees should have a maximum of 15 members (e.g., Calvert, 2004; Mitra, 2007) with high stakeholder diversity, aiming for a balance of students, teachers, administrators, and parents, as productivity (Mitra, 2002) and student engagement (Yonezawa & Jones, 2007) decreases in large groups and power imbalances can prevent group success (Biddle, 2015; B. H. J. Brown, 2010; Osberg et al., 2006). Meeting times and locations should be consistently and clearly communicated. Schools should not ostracize students by meeting during class (Mitra, 2002) or not communicating meeting details to student representatives (Osberg et al., 2006). School decisions should be informed by research. Small teams should lead research projects (Mitra, 2007; Yonezawa & Jones, 2007) and findings should be strategically communicated to teachers (Ozer & Wright, 2012). Community-based organizations can support research skills at annual retreats (Biddle, 2015; B. H. J. Brown, 2010), in class (Ozer & Wright, 2012), or by training staff to train students (Goodnough, 2014). Finally, students should be formally recognized for their contributions to the school, ideally in the form of wages (Mitra, 2007) or academic credit (e.g., B. H. J. Brown, 2010; Chopra, 2014), but giving food, community service credit, or public praise to students are possible alternatives (Yonezawa & Jones, 2007). A lack of recognition and compensation can impede student voice initiatives (Pautsch, 2010). Moving forward, practitioners can create inclusive governance structures as a way to build capacity for student leadership and ultimately improve organizational outcomes.
Interpersonal Capacity Building
In the interpersonal domain, fostering youth-adult relationships should be a core aim (Biddle, 2015). While the mean score of items measuring youth-adult relationships was one of the highest mechanism scores across all nine schools (M = 4.40), the emotional nature of rural students’ narrative comments on the lack of quality student-teacher relations suggests this mechanism may be particularly important in building capacity for student leadership. Schools can improve youth-adult relationships by establishing clear channels of communication (Calvert, 2004), shared language and norms (Mitra, 2002; Goodnough, 2014), providing opportunities for storytelling (Mitra, 2009b), scheduling regular social events (Møller, 2006), and having students address teachers by their first names (Campbell, 2009). Rigid conceptions of traditional student roles are often barriers to student leadership (e.g., Silva, 2002), but a dialogic school culture (Fielding, 2001) and opportunities for youth and adults to work collaboratively in a small, structured group outside the classroom setting (Mitra, 2009) can foster radical collegiality. Schools can also train staff on the process of change (Silva, 2002) and involve adults in selecting student leaders (e.g., Osberg et al., 2006; Yonezawa & Jones, 2007) or designing programs (Chopra, 2014). Administrative support can foster adult buy-in (B. H. J. Brown, 2010) by praising the merits of youth-adult partnerships, establishing clear expectations for staff participation, and modeling partnership by regularly attending student meetings (Calvert, 2004; Chopra, 2014; Yonezawa & Jones, 2007).
Personal Capacity Building
Each school received a document summarizing the average survey scores for each capacity building dimension. For all nine schools, personal capacity building was the highest scoring dimension. Schools educate students, so it is logical that pedagogy, the sole mechanism present in the personal capacity building construct, had the highest mean score (M = 4.45). However, there is still room for growth in this dimension, particularly so teachers can support all students, not just the few students who adults may already see as leaders. When building students’ personal leadership skills, it is important teachers scaffold direct instruction (Mitra et al., 2013) and offer diverse opportunities for student leadership that build on quick wins (Mitra, 2009b). Communication and collaboration skills should be taught in classrooms, with emphasis on the importance of listening to others and embracing differences of opinion. Community partnerships can assist with skill development during class or after school, focused on youth-adult collaboration skills (Mitra, 2007), decision-making skills and student “professionalization” (Ozer & Wright, 2012), lesson observation techniques (Chopra, 2014), LGBTQ (lesbian, gay, bisexual, transgender, queer) issue awareness for teachers (Wernick et al., 2014), and building contextual knowledge integral to change processes (B. H. J. Brown, 2010). Additionally, students should have opportunities to discuss social justice issues in the classroom (Denner et al., 2005; Mitra, 2008; Ozer & Wright, 2012) and with adults outside of the classroom (Wernick et al., 2014). Opportunities for students to coplan lessons alongside teachers (e.g., Biddle, 2015; Campbell, 2009) enable students to choose how and what they learn.
Implications for Future Research
These Student Leadership Capacity Building scales provide opportunities for longitudinal data collection. Using the scales prior to and following the implementation or restructuring of a student leadership opportunity could add to the field’s understanding of the impact of specific practices. Moreover, researchers could partner with educators to develop specific interventions to build student leadership capacity and then measure the change in student perceptions. For example, if a school noticed students responded very low on the Organizational Student Leadership Capacity Building Scale, and responded by restructuring their governmental bodies and decision-making processes, they could then survey students again using the Organizational Student Leadership Capacity Building Scale after 1 year, 2 years, and 3 years after implementation to see if this positively impacts students’ perceptions of leadership opportunities and how long it may take for the shift in student perceptions to occur. These scales could also be used in conjunction with existing scales for youth development outcomes as a way to measure the statistical relationships between specific school supports for building student leadership capacity and outcomes like students’ agency, belonging, or competence. Additionally, future research could further test and validate a scale(s) using the items intended to reflect the three student leadership competencies or the items representing the eight student leadership mechanisms.
The importance of inclusive governance structures in schools emerged as an important finding of this study. This field is ripe with research possibility, as only a few scholars are conducting research on school governance structures (e.g., Calvert et al., 2015). Studying examples of positive deviance, schools that have stable, inclusive governance structures that embrace and foster meaningful student leadership, would contribute to the limited body of knowledge on governance structures.
Findings raise questions about the impact of school choice on students’ perceptions of student leadership opportunities. New York City public school students have a choice of which high school to attend. Several rural students raised this point, emphasizing they had no choice in where they attend school. The role of teacher mind sets toward student voice is another avenue for study. Several students and an administrator commented on the role of teachers’ willingness to work collaboratively with students. Assessing the relationship between teacher attitudes and student perceptions of leadership opportunities could help address this barrier to building student leadership capacity (e.g. Calvert, 2004; Mitra et al., 2013; Silva, 2002).
Limitations
One major limitation of the study was the sample. It was geographically limited to mainly New York City schools, which used graduation portfolios in place of testing, and nearly 70% of survey respondents identified as having an ethnicity that was not white. While this accomplishes the study’s goal of centering historically marginalized voices, further validation studies should be conducted with students attending schools in different areas of the country, schools that use standardized testing, and urban schools with a predominantly White population as well as rural schools with a more diverse racial makeup to better understand if the model holds for various student populations across various school types and settings. Future research should also seek to recruit more school stakeholders to participate in focus groups to discuss survey results. Due to limited interest and availability to participate, only two schools were represented in the Phase 2 focus groups, and all but one participant was from the same school. The limited participation in schools and the lack of Transfer2 student representation in the qualitative phase are both additional limitations of this study. The nature of a focus group may have also skewed the data that emerged, as interpersonal and power dynamics within the group may have affected participants’ willingness to disagree with other members or speak at all. As a result of sampling from nine schools, there was a clustering effect on the data, whereby students from the same school were likely to have similar responses to scale items. Additionally, in some schools, the number of students in a particular demographic group was so small the findings of compare means analysis may have been skewed. These limitations could be addressed by additional validation testing with a sample of students from a large number of schools.
This research was exploratory, and the initial intention was to develop a three dimension-specific personal, interpersonal, and organizational scales. The context given to students prior to each scale on the survey was created to help students think about a specific dimension when responding to items. To further validate the Overall Student Leadership Capacity Building Scale, the introductions could be revised and made into one general introduction at the start of the survey. Additionally, inserting an additional sentence into the introductory sections to clarify how students should respond to items that use the term “and” may help students more accurately respond to statements that may be considered double-barreled. For example, students should disagree with the item “Times and locations of school committee meetings are clearly communicated,” if students are informed when meetings will be held, but not where, as both elements must be present for agreement.
Conclusion
The Overall Student Leadership Capacity Building Scale and the dimension-specific Personal, Interpersonal, and Organizational Student Leadership Capacity Building Scales assess student leadership capacity building mechanisms in more detail than previous instruments, and they have been validated in high school settings. The capacity building focus of the scales enable researchers to assess leadership development opportunities schools provide to students. These tools have the potential to generate conversation between youth and adults in schools on how to provide leadership development opportunities for all students.
Footnotes
Authors
LINDSAY LYONS is a graduate of Antioch University’s Leadership and Change PhD program and currently works as an educational leadership consultant. Her research interests include shared leadership, student voice, and organizational change.
MARC BRASOF is an assistant professor of education at Arcadia University’s School of Education. His scholarship examines the role of student voice in school reform, how to distribute leadership to teachers and students, and create more democratic institutions.
CAROL BARON is a clinical professor of research methods at Antioch University’s Graduate School of Leadership and Change. She has worked in the educational field in both faculty and program evaluation roles.