
Abstract
Recent evidence points to the early elementary grades as a pivotal point for the development of science learning trajectories and achievement gaps. Using data from the Early Childhood Longitudinal Study, this study estimates the degree to which time spent on science and the breadth of science topics/skills covered predict science achievement in the earliest grades of elementary school. Using regression along with school fixed effects and student fixed effects models, we find suggestive evidence in some models (student fixed effects and regression with observable controls) that time on science instruction is related to science achievement but little evidence that the number of science topics/skills covered are related to greater science achievement. These results are generally consistent across student subgroups. We discuss the implications for early science policy and practice.
Keywords
Introduction
Improving student performance in science remains a commonly cited policy goal for political leaders, educators, and other societal stakeholders (U.S. Department of Education, n.d.). Recent evidence points to the importance of focusing on the elementary years as a foundation for later science achievement. In particular, research suggests that the earliest years of elementary school (kindergarten and first grade) are critical for the development of science knowledge and skills as well as a point of divergence in performance between subgroups of students. For instance, prior work showed that performance on a first-grade general knowledge exam, which included science content, was more predictive of science achievement through eighth grade than measures of achievement in other subjects or student background characteristics (Morgan, Farkas, Hillemeier, & Maczuga, 2016). Other work documents the existence of science achievement gaps by race/ethnicity as early as kindergarten and persisting through elementary school (Curran & Kellogg, 2016; Kohlhaas, Lin, & Chu, 2010; Quinn & Cooc, 2015). Recent work suggests that much of these differences for Hispanic and Asian students can be explained by the language and immigration contexts of the students (Curran & Kitchin, 2018). In addition to race/ethnicity, early disparities in science by income are apparent in kindergarten, and differences by gender emerge by first grade (Curran, 2017; Curran & Kellogg, 2016).
While numerous studies have explored aspects of science instruction in early elementary school, only a few have done so using large-scale or nationally representative samples (Curran, 2017; Curran & Kellogg, 2016; Morgan et al., 2016; Quinn & Cooc, 2015; Saçkes, Trundle, & Bell, 2013; Saçkes, Trundle, Bell, O’Connell, 2011). While such recent work has begun to shed light on the trajectories and disparities of early science learning with nationally representative data (Curran, 2017; Curran & Kellogg, 2016; Morgan et al., 2016; Quinn & Cooc, 2015; Saçkes et al., 2011; Saçkes et al., 2013), few nationally representative studies have explored the mechanisms and potential policy and instructional levers that might be leveraged to improve early elementary science achievement.
One potential mechanism for improving early elementary science outcomes is an emphasis on the prevalence and content of science instruction. The theoretical framework of opportunity to learn suggests the importance of exposure to content for learning (Carroll, 1963, 1989), and empirical evidence from the early mathematics literature demonstrates the importance of time spent on content and the rigor of the content for early learning (Claessens & Engel, 2013; Claessens, Engel, & Curran, 2014; Engel, Claessens, Watts, & Farkas, 2016). Within science, instructional time has been a contested area of debate, with critics pointing to a decreased allocation of time to science as a result of accountability efforts such as No Child Left Behind (NCLB) (Diamond & Spillane, 2004; Marx & Harris, 2006). Likewise, breadth or depth of content coverage in science has regularly appeared in discussions of science instruction, with comparisons to depth of international standards being common and an emphasis on depth appearing in domestic policy documents and standards such as the Next Generation Science Standards ([NGSS], 2013b; Schmidt, Wang, & McKnight, 2005).
The purpose of this study, therefore, is to further explore this line of inquiry in early science instruction and learning. In particular, this study seeks to examine the degree to which time on science content and breadth of science content covered predict early science learning gains. Additionally, given evidence of disparities in early science achievement across subgroups, this study also explores the degree to which shifts in time on science and content covered may alleviate disparities in early elementary science achievement. In particular, we address the following research questions:
What is the relationship between time spent on science instruction in the early elementary grades and student achievement in science as measured by a standardized science assessment?
What is the relationship between breadth of science content (topics and skills) covered and student achievement in science as measured by a standardized science assessment?
Do any of the before-mentioned relationships vary for student subgroups such as racial/ethnic minorities, females, or students who speak a non-English language in the home?
The answering of these questions has the potential to improve science instructional practice in the early elementary grades while also informing policies that influence early science instruction. In the next section, we present the theoretical framework that underlies this study and review relevant literature. We then turn to a presentation of the data and analytic approach followed by a discussion of results and implications.
Framework and Background Literature
We draw on the theoretical framework of “opportunity to learn.” Originating in work by Carroll (1963, 1989), the opportunity to learn framework suggests that students’ ability to learn is dependent on their contextual environment’s providing sufficient opportunities to engage with the academic content. As one of the most salient contextual environments for young children, the formal school setting can have a large impact on whether students experience opportunities to engage with science content at an early age.
The concept of opportunity to learn in the formal school setting is multifaceted, including aspects of curriculum, pedagogy, and characteristics of the classroom and school setting (Sorensen & Hallinan, 1977). Empirically, research has shown that time on content is an important measure of opportunity to learn, with more time on academic content being linked to greater student learning in the upper elementary grades, middle school, and early years of high school (Jez & Wassmer, 2015; Lavy, 2015; Marcotte, 2007; Wang, 1998). Other research, however, demonstrates that it is also important to consider what is taught, or content coverage. For instance, empirical work examining kindergarten has shown that more time on advanced mathematics content is predictive of greater achievement gains (Claessens et al., 2014; Engel et al., 2016).
Time on science content
Within the area of elementary science instruction, time on content has been an active area of debate for policy and practice in recent years. Scholars have argued that the focus on and accountability associated with assessments in mathematics and English language arts have resulted in a reduction of time spent on other subject areas, including science (Diamond & Spillane, 2004; Marx & Harris, 2006). Indeed, research supports the claim that elementary teachers spend considerably less time on science instruction than on mathematics or English language arts (Bassok, Latham, & Rorem, 2016). For instance, around 1 in 5 kindergarten and first-grade teachers reported teaching science daily in 2010 while more than 9 of 10 teachers reported teaching mathematics and reading daily (Bassok et al., 2016).
Some work suggests that the gap between time spent on science and time spent on reading or mathematics may have grown during the NCLB era (Blank, 2012; Griffith & Scharmann, 2008; McMurrer, 2008). This trend may have been furthered by recent efforts to regulate instructional time across classrooms such that teachers within a school or even across a district are teaching the same subject at the same time of the day. The result has been that in many elementary classrooms science is relegated to a specific time block, sometimes combined with another subject like social studies, and allocated a set amount of time for instruction. For example, in Washington, D.C., schools, district policy specifies scheduling requirements for elementary school instruction, allocating 120 min to literacy and 90 min to mathematics but only 45 min to a combined block for science or social studies (District of Columbia Public Schools, 2016).
Despite being allocated less time than mathematics or reading, prior work has found wide variation in the amount of time on science that elementary students experience. For instance, analysis of data from the National Assessment of Educational Progress shows that across states the average hours per week spent on science instruction in fourth grade varies from less than 2 hours per week in some states to nearly 4 hours per week in others (Blank, 2013). Other work confirms this variability while also finding that time on science instruction in fourth grade is significantly higher in states that included science in high-stakes accountability policies (Judson, 2013).
Breadth of science content coverage
Just as science instructional time has garnered discussion, so has breadth of content coverage. For several decades, researchers and practitioners have debated the merits of standards that cover a broad set of science topics compared to those that focus more deeply on a limited set of topics. Comparisons to international standards have tended to show that standards in the United States are much broader than those in countries that demonstrate the highest performance on international assessments (Schmidt et al., 2005). Other work, while tending to focus on the upper grade levels and higher education, has shown advantages to instruction that provides more depth as opposed to breadth of content coverage in science (Eylon & Linn, 1988; Sadler & Tai, 2001; Schwartz, Sadler, Sonnert, & Tai, 2009). As a result, an emphasis on the need for more depth in science instruction has been a part of various policy documents during the past several decades, including the National Research Council’s National Science Education Standards in the late 1990s and more recently as a part of NGSS (NGSS, 2013b; Schwartz et al., 2009). For example, NGSS describe a focus on disciplinary core ideas as focusing on “a limited set of ideas and practices” rather than teaching “all the facts” (NGSS, 2013b).
With regard to the breadth of science content covered, the evidence suggests that many early elementary students have limited exposure to a number of science content areas. For instance, less than half of kindergarten teachers in 2010 reported covering dinosaurs, sound, light, or the solar system in their classrooms (Bassok et al., 2016). Additionally, though the total time spent on science did not decrease significantly, the breadth of science content covered in early elementary may have changed dramatically during the past several decades. Kindergarten teachers in 2010 reported covering fewer science content areas as compared to those in 1998, though changes in the format of the survey questions across survey waves complicate the comparison (Bassok et al., 2016; Blank, 2013). This finding suggests a shift toward more depth rather than breadth, with fewer content areas’ being covered for longer periods of time.
Impacts of science instructional time and content coverage
Prior research has provided mixed evidence on the impact of early elementary science instructional time and content coverage. On the one hand, evidence shows that achievement on a general knowledge test in kindergarten and first grade including science questions is one of the best predictors of subsequent science achievement in elementary school (Morgan et al., 2016), and other work suggests that science achievement is uniquely related to the development of broader approaches to learning skills that may benefit students across subject areas (Bustamante, White, & Greenfield, 2018). The way in which instructional time and content coverage contributes to such early science achievement is less clear. Evidence from international contexts suggests that beginning science instruction in kindergarten as compared to later grades predicts greater science achievement near the end of elementary school (Tao, Oliver, & Venville, 2012). Other work, however, has found that the frequency and duration of science instruction in kindergarten is not significantly related to end-of-year general knowledge achievement or end-of-third-grade science achievement (Saçkes et al., 2011; Saçkes et al., 2013). These studies relied on now outdated data from the late 1990s and were limited insofar as they did not have a true measure of science achievement in the early grades, instead relying on a general knowledge measure that also included aspects of history, civics, and social studies. Furthermore, the studies relied on observable control variables rather than the use of more sophisticated methods to account for selection bias.
Early elementary science achievement gaps
Better understanding the relationships between opportunity to learn science in the early elementary grades and science achievement has the potential to inform practice aimed at reducing early science achievement gaps. Recent evidence has documented large gaps by race/ethnicity in science achievement across elementary school. For instance, prior work found that, on average, Black, Hispanic, and Asian students score more than half a standard deviation lower in science at kindergarten than do their White peers (Curran & Kellogg, 2016). These early gaps in science tend to be larger than those in mathematics or reading (Curran & Kellogg, 2016; Greenfield et al., 2009). A considerable portion of these differences for Hispanic and Asian students is explainable by language and immigration context (Curran & Kitchin, 2018). Other work shows that these gaps are present in later grades of elementary school (Kohlhaas et al., 2010; Morgan et al., 2016; Quinn & Cooc, 2015). Furthermore, the size of such gaps changes across elementary school (Curran & Kellogg, 2016; Morgan et al., 2016; Quinn & Cooc, 2015). Similarly, while there is no difference in science test performance by sex in kindergarten, a difference does begin to emerge by first grade, with boys outperforming girls, and continues to expand as students progress to later grades (Curran & Kellogg, 2016). While these changes suggest the possibility that differential instructional practices across groups may contribute to changes in such disparities, little empirical work has explored such a relationship.
Policy and practice relevance
Better understanding the relationship between science instruction and science achievement in early elementary school is of particular policy relevance. Many states are considering adoption of NGSS, while those that have recently adopted such standards are working through aspects of implementation (Willard, Pratt, & Workosky, 2012). These shifts represent an important opportunity to inform policy and practice around early elementary science achievement.
Given the mixed evidence on the effectiveness of early science instructional time and content coverage for improving science achievement coupled with the substantial changes in science instructional practices in the earliest grades during the past several decades, there is an impetus to further study the relationship between science instruction and science achievement in elementary school. This study fills this void by applying the latest nationally representative data on the early elementary grades to explore the degree to which two strands of opportunity to learn, time on science content and breadth of science content covered in the first 4 years of formal schooling, predict science achievement. Both time on science and breadth of science coverage are areas of active policy and practice discussion, are potentially malleable, and have available measures in the data. Other aspects of the learning environment that also may affect opportunity to learn, such as the experience of teachers or the education level of parents, are recognized and controlled for in models though not directly explored.
Methods
Data
This study draws on data from the newly released Early Childhood Longitudinal Study, Kindergarten Class of 2010–11 (ECLS-K:2011). ECLS-K:2011 is a nationally representative, longitudinal study conducted by the U.S. Department of Education. The study includes a nationally representative sample of students who were kindergartners in the 2010–2011 school year. For this study, we focus on data from the students’ first 4 years of formal schooling, namely, kindergarten through third grade (2010–2011 through 2013–2014 school years). Though fourth-grade data are available, the fourth-grade surveys do not consistently ask about science instruction across all students, preventing inclusion of this grade level in our analysis.
A unique feature of ECLS-K:2011 is its inclusion of science achievement measures in the earliest years of school. Unlike the original ECLS-K, which collected data on kindergartners in the 1998–1999 school year and lacked such early science assessments, the new ECLS allows for a richer exploration of the relationship between early elementary experiences and science achievement. In addition to including science achievement measures, ECLS-K includes a rich set of survey items collected from schools, teachers, and parents. In the next section, we detail the specific variables included in the analysis.
Dependent variable
The primary dependent variable of interest in this study was spring semester science achievement as measured by a standardized science achievement test. We use measures of science achievement for kindergarten through third grade. The ECLS-K:2011 science assessment included questions related to the physical sciences, life sciences, environmental (earth and space) sciences, and scientific inquiry (Tourangeau, Nord, Le, Sorongon, et al., 2015; Tourangeau, Nord, Le, Wallner-Allen, et al., 2015). For the kindergarten year, the assessment consisted of 20 questions, while the first- through third-grade assessments were conducted in a two-stage manner with performance on a set of initial routing questions determining the second set of questions administered. In each year, the assessments were administered verbally by a trained assessor (Tourangeau, Nord, Le, Sorongon, et al., 2015; Tourangeau, Nord, Le, Wallner-Allen, et al., 2015). Overall, the ECLS-K:2011 science assessments have a relatively high level of validity and reliability. They were developed based on commonalities in six states’ 2009 science standards and the input of a panel of educators and subject matter experts. The assessments went through a series of pilot field assessments prior to selection of the final items (Tourangeau, Nord, Le, Sorongon, et al., 2015; Tourangeau, Nord, Le, Wallner-Allen, et al., 2015). The reliability of the science assessment ranged from .75 in kindergarten to .83 across the other waves of data used. We used standardized scale scores, which were derived from item response theory measures. These scale scores are appropriate for modeling gains in science achievement (Tourangeau, Nord, Le, Sorongon, et al., 2015; Tourangeau, Nord, Le, Wallner-Allen, et al., 2015).
Independent variables
Time on science
The key independent variables of interest in this study included time spent teaching science and the breadth of science content (topics and skills) covered. The measure of time spent on science instruction was derived from two survey items in ECLS-K:2011. In the first item, teachers reported the number of days per week they spent on science content. In the second item, the teachers reported the time per day spent on science content on days in which the content was taught. We followed precedent in the literature by calculating a single measure representing minutes per week on science content by multiplying days per week by minutes per day (Claessens et al., 2014). For example, if a teacher reported teaching science content 4 days per week at 30 min per day, we would consider his or her weekly time on science content to be 120 min.
Breadth of science topics/skills
The second key independent variable, breadth of science content (topics/skills) covered, came from a series of survey items in which teachers reported the science content domains taught in their classrooms. In the kindergarten year, teachers reported whether they taught a series of 17 science topics or skills. In first and second grades, teachers provided similar responses for a series of 15 items. In third grade, teachers provided responses for 16 items. Each item is represented with a binary (0/1) indicator. See Appendix A, online, for a complete list of the items included in each grade level. To measure breadth of science content coverage, we combined these binary indicators into two count variables, one representing the number of science topics covered and the other representing the number of science skills covered. Science topics consisted of concepts and subdisciplines of science such as reports of teaching dinosaurs and fossils, weather, light, sound, three states of matter, and ecology. In contrast, science skills represented science-related skills that could be applicable across a number of scientific subdisciplines such as using the scientific method, laboratory skills, communicating scientific findings, and using tools to gather information.
Moderating variables
In addition to assessing the degree to which gains in science learning are related to instructional time and topics/skills covered, we assessed the degree to which these relationships varied for a number of student subgroups. In particular, we assessed the degree to which the key relationships of interest varied by race/ethnicity, sex, and whether a non-English language is used in the home. Race/ethnicity was operationalized as a series of binary indicators aligning with the categories included in ECLS-K:2011, specifically White, Black, Hispanic, Asian, Hawaiian or Pacific Islander, American Indian or Alaskan, and two or more races. Sex was operationalized as a binary indicator of being a female. Finally, the use of a non-English language in the home was operationalized as a binary indicator of whether a non-English language was spoken in the child’s home. Each of these variables was derived from self-reports from parent surveys.
Control variables
As with any study using secondary data, a key concern was the threat of omitted variable bias. Part of our approach for addressing the issue of confounding variables was the inclusion of a robust set of control variables. In particular, we controlled for characteristics of students (including race, sex, prior achievement), characteristics of students’ families (including income, parental education, family structure), characteristics of teachers (including sex, experience, education level), and in models without school fixed effects, school characteristics (including size and other demographic composition). The full set of control variables is shown in online Appendix B.
Participants
The analytic sample consisted of students who had available data on the key independent and dependent variables. In particular, we dropped observations missing data on science achievement or on teacher-reported time on science or topics/skills covered. Observations missing data on control variables were retained through the use of multiple imputation. We used 25 imputed data sets generated through the multivariate normal approach in Stata 15. Multiple imputation has been shown to be a strong approach for handling missing data (Allison, 2009; Graham, Olchowski, & Gilreath, 2007; Schafer, 1997). After these sample restrictions, the final analytic sample was 8,980 students for the kindergarten year, 9,430 for the first-grade year, 10,200 for the second-grade year, and 7,550 for the third-grade year (all sample sizes rounded to the nearest 10 to comply with Institute of Education Sciences restricted data requirements). While these samples reflected a nontrivial loss of observations relative to the original sample size (18,170), the use of weights provided with the ECLS-K adjusted for this nonresponse and yielded estimates that are reflective of the population. Across grade levels, these students were in 860 schools in kindergarten with an average of 2.99 sampled classrooms per school. In first grade, they were in 1,300 schools with an average of 2.64 classrooms per school. In second grade, they were in 1,640 schools with an average of 2.51 classrooms per school, and in third grade, they were in 1,540 schools with an average of 2.24 classrooms per school.
Analytic Approach
This study attempts to estimate the relationship between aspects of elementary science instruction and science achievement. The primary analytic approach relies on ordinary least squares regression with a robust set of student, family, teacher, and school controls. We also estimated models with school fixed effects, though subsequent analyses suggested that these models may be subject to significant measurement error in the key independent variables. In addition, we estimated models that made use of the longitudinal nature of the data by including student fixed effects.
Grade-level analyses
For each grade level in the data (K–3), we estimated models that predicted science achievement scores during the spring term of the respective academic year. The first set of models estimated the relationship between time spent on science (in hundreds of minutes per week) and spring science achievement. The second and third sets of models estimated the relationship between the number of science topics taught or skills taught and science achievement. We estimated models that progressively added groups of observable control variables and finally a model that also included school fixed effects. All models were weighted to adjust for the complex sampling design of the ECLS-K as well as participant nonresponse. The primary analytic model took the following form:
ScienceAchits = β0 + β1ScienceInstructionts + β2PriorAchievementits + β3TestingDatesits + β4StudentControlsits + β5FamilyControlsits + β6ExtracurricularControlsits + β7TeacherControlsts + β8OtherInstructionalControlsts + β9SchoolFEs + e its ,
where ScienceAch represents the dependent variable of interest, namely, the end-of-year standardized item response theory based on scaled achievement score for student i with teacher t in school s. ScienceInstruction represents the key independent variable (either time on science content, number of topics taught, or number of skills taught). PriorAchievement represents standardized achievement scores from the beginning of the year or end of the prior year (reading and mathematics achievement for kindergarten and reading, mathematics, and science for later grades). TestingDates represents indicators of the timing of test administration. StudentControls represents a vector of student-level controls such as race/ethnicity, sex, age, and whether a language other than English is spoken in the home. FamilyControls represents a vector of family-level controls such as parental income, parental education, family structure, and parental expectations. ExtracurricularControls represents a vector of controls for out-of-school activities such as visiting a museum, going to the zoo, and reading books. TeacherControls represents a vector of controls for teacher characteristics such as age, sex, race, certification, and education. OtherInstructionalControls represents a vector of controls for other instructional practices such as the amount of time spent on other subjects and resources available in the classroom. See online Appendix B for the full list of control variables. Finally, SchoolFE represents the inclusion of the school fixed effects.
Student fixed effects analyses
In addition to our grade-level analyses, we pooled the data across grade levels and estimated models that included student fixed effects using the longitudinal data. This approach has the advantage of controlling for all unobservable characteristics of students that are fixed across time, thereby accounting for more possible sources of bias in the estimates. The student fixed effects models closely matched those of the grade-level analyses with the exception that the school fixed effects were replaced by student fixed effects. Other time-varying control variables remained in the model.
Comparisons to mathematics and reading
While science instruction was the primary outcome of interest in this study, we also sought to compare results for science to those in the more commonly assessed subjects of mathematics and reading. Consequently, we estimated versions of both the grade-level and the student fixed effects models that predicted mathematics achievement from time on math content and reading achievement from time on reading. The mathematics and reading assessments were developed in a similar fashion to those used for science and had reliabilities ranging from .87 to .95 in reading and .92 to .94 in mathematics. More details about these assessments can be found in the ECLS-K user manual.
Limitations of the analytic approach
A key concern in this study and in any study using secondary, observational data is the threat of omitted-variable bias. In particular, it is possible that classrooms that spend more time on science or teach different numbers of science topics/skills differ systematically along other dimensions from classrooms that differ in science instruction. To the degree that such differences are correlated with both science instructional practice and student outcomes, these omitted variables can bias estimates of the relationship of interest.
Each set of control variables attempts to mitigate the threat of omitted-variable bias across a number of observable domains of potential threats to the internal validity of the study. The addition of the school fixed effects restricts estimates to variation within schools, implicitly controlling for all aspects, both observable and unobservable, that are fixed among students in the same school. Likewise, the use of student fixed effects implicitly controls for all time-invariant aspects of students over time. In doing so, the school and student fixed effects provide additional mechanisms for addressing omitted variable bias. Nevertheless, while each of the analytical approaches (controlling for observable covariates, prior achievement controls, and school or student fixed effects) serves to address potential sources of omitted-variable bias, it is recognized that sources of bias may remain. Consequently, results of the study should be interpreted as covariate-adjusted relationships rather than causal estimates.
Results
Results suggest that time spent on science instruction across the first 4 years of elementary school may predict higher science achievement, though this finding was not consistent across all specifications. While the fully specified regression models without school fixed effects and the student fixed effects models predicted higher science achievement from time on science, the school fixed effects models yielded insignificant relationships. Interestingly, results from models predicting mathematics and reading achievement from time on content in those subjects also showed somewhat similar patterns. Examining the number of science topics and skills covered revealed no significant relationships with science achievement. These primary findings were found to hold across a number of subgroups, with little evidence of heterogeneous relationships for racial/ethnic minority students, students from homes where a non-English language is spoken, or females. In this section, we present the results that support these overall findings.
Time on Science Content
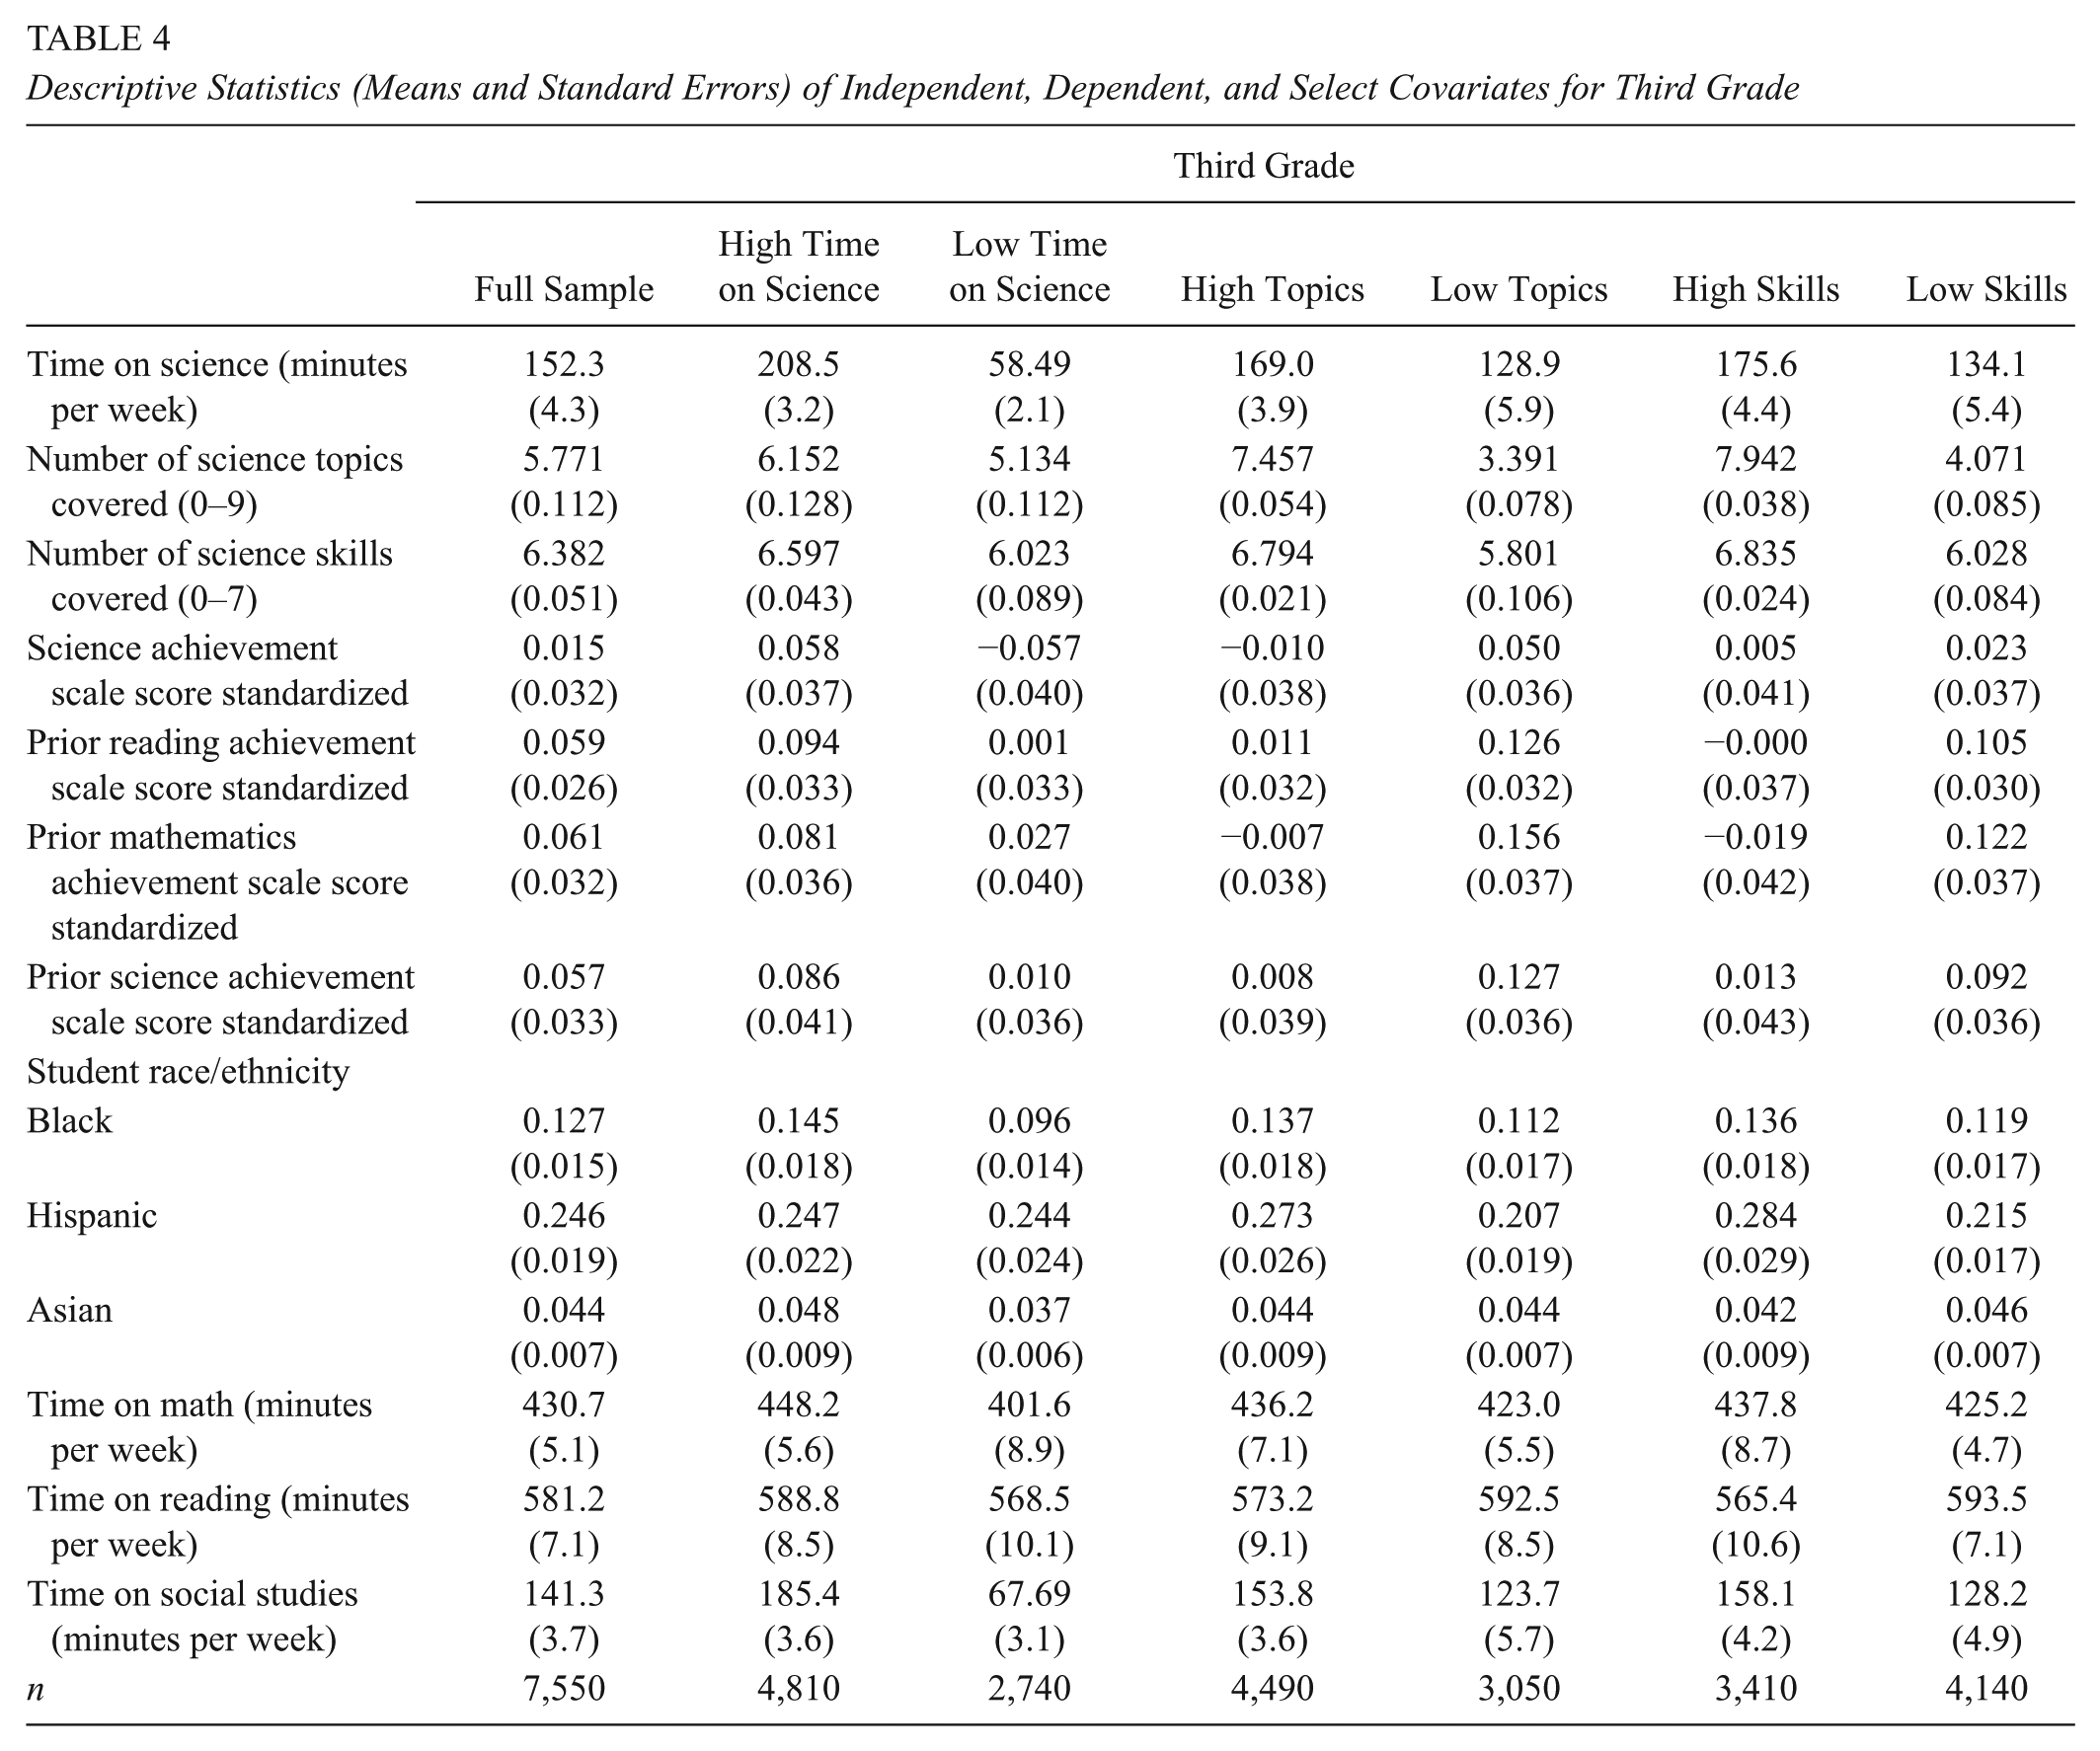
As shown in Tables 1 through 4, time on science content increased slightly during the first 4 years of formal schooling, from about 118 min per week in kindergarten to 152 min per week in second grade. That said, individual classrooms varied significantly in the amount of time spent on science. We show columns split by the median amount of time spent teaching science or number of topics/skills covered (an arbitrary cut point chosen for parsimony in the tables). For instance, in kindergarten, classrooms that were among the top half of classrooms spending time on science averaged 184 min per week, while those with time below the median averaged only 34 min per week (see Table 1). Descriptively, in kindergarten, spring science achievement was slightly higher among students in classrooms that spent less than the median amount of time on science instruction compared to those that spent more, but in Grades 1 through 3, students in classrooms spending more than the median amount of time on science tended to have slightly higher end-of-year science scores.
Descriptive Statistics (Means and Standard Errors) of Independent, Dependent, and Select Covariates

Descriptive Statistics (Means and Standard Errors) of Independent, Dependent, and Select Covariates for First Grade

Descriptive Statistics (Means and Standard Errors) of Independent, Dependent, and Select Covariates for Second Grade

Descriptive Statistics (Means and Standard Errors) of Independent, Dependent, and Select Covariates for Third Grade
Results of the regression models predicting end-of-year science achievement from time on science content provided suggestive evidence of a positive relationship between time on science content and science achievement. Table 5 shows results of models estimating the relationship between minutes on science in kindergarten (Panel 1), first grade (Panel 2), second grade (Panel 3), and third grade (Panel 4) and spring science achievement scores from the respective grade. While the fully specified model without school fixed effects (Column 6) did show a positive and statistically significant relationship between time on science and science achievement across all grade levels, this result was not robust to the inclusion of school fixed effects (Column 7). Models pooling data from all 4 years and including student fixed effects showed a positive and significant relationship between time on science content and student science achievement (see Panel 1 of Table 6). An additional 100 min on science instruction predicted a .026 standard deviation higher spring semester science achievement test score, a statistically significant yet relatively small in magnitude relationship.
Coefficients and Standard Errors From Regressions Predicting End-of-Year Science Achievement From Time on Science Content for Kindergarten, First, Second, and Third Grades

Note. Standard errors are in parentheses. Estimates are adjusted and weighted for the complex sampling design of the Early Childhood Longitudinal Study.
p < .1. *p < .05. **p < .01.
Coefficients and Standard Errors From Regressions Predicting End-of-Year Achievement From Time on Subject Content Across Kindergarten Through Grade 3 With Student Fixed Effects

Note. Robust standard errors are in parentheses. Estimates are adjusted and weighted for the complex sampling design of the Early Childhood Longitudinal Study.
p < .1. *p < .05. **p < .01.
Interestingly, models replicating these analyses with mathematics and reading achievement outcomes predicted from instructional time on mathematics or reading yielded somewhat similar results. In models including observable covariates, the relationship between mathematics/reading time and achievement in those subjects was significant in some models but not others, while the school fixed effects models generally yielded no significant relationships (see Appendix Table C1 and Appendix Table C2, online). However, results of models that pooled data across kindergarten through third grade and included student fixed effects predicted consistently positive and significant relationships between time on math or reading and achievement in those subjects. As shown in Panels 2 and 3 of Table 6, an additional 100 min per week on mathematics predicted a .017 standard deviation higher mathematics score, while an additional 100 min on reading predicted a .005 standard deviation higher reading score. While significant, these estimates were relatively small in practical magnitude.
Breadth of Content Coverage (Topics and Skills)
In addition to time on science, it is possible that science achievement is sensitive to the nature of the content taught during science instructional time. The second set of analyses examined the relationship between the number of science topics or skills teachers reported teaching and spring science achievement scores, holding constant the total amount of time spent on science. As shown in Tables 1 through 4, the reported number of science topics covered varied significantly across classrooms. Among kindergarten students in classrooms among the bottom half of reported science topics, the average number of topics covered was approximately four, while among kindergarten students in the upper half of reported science topics, the average number of topics covered was about eight (see Table 1). While the total number of reported topics teachers could report was different in the later grades, classrooms that were above the median in reported topics still reported about twice as many topics as those below the median (see Tables 2–4). The pattern for the number of science skills taught was slightly different. In kindergarten, classrooms that taught more than the median number of science skills taught almost three times as many skills (approximately 3.93) as those that taught less than the median (approximately 1.26). In first through third grades, however, there was little variation in the number of skills taught given that almost all teachers reported teaching each skill (see online Appendix Table A2).
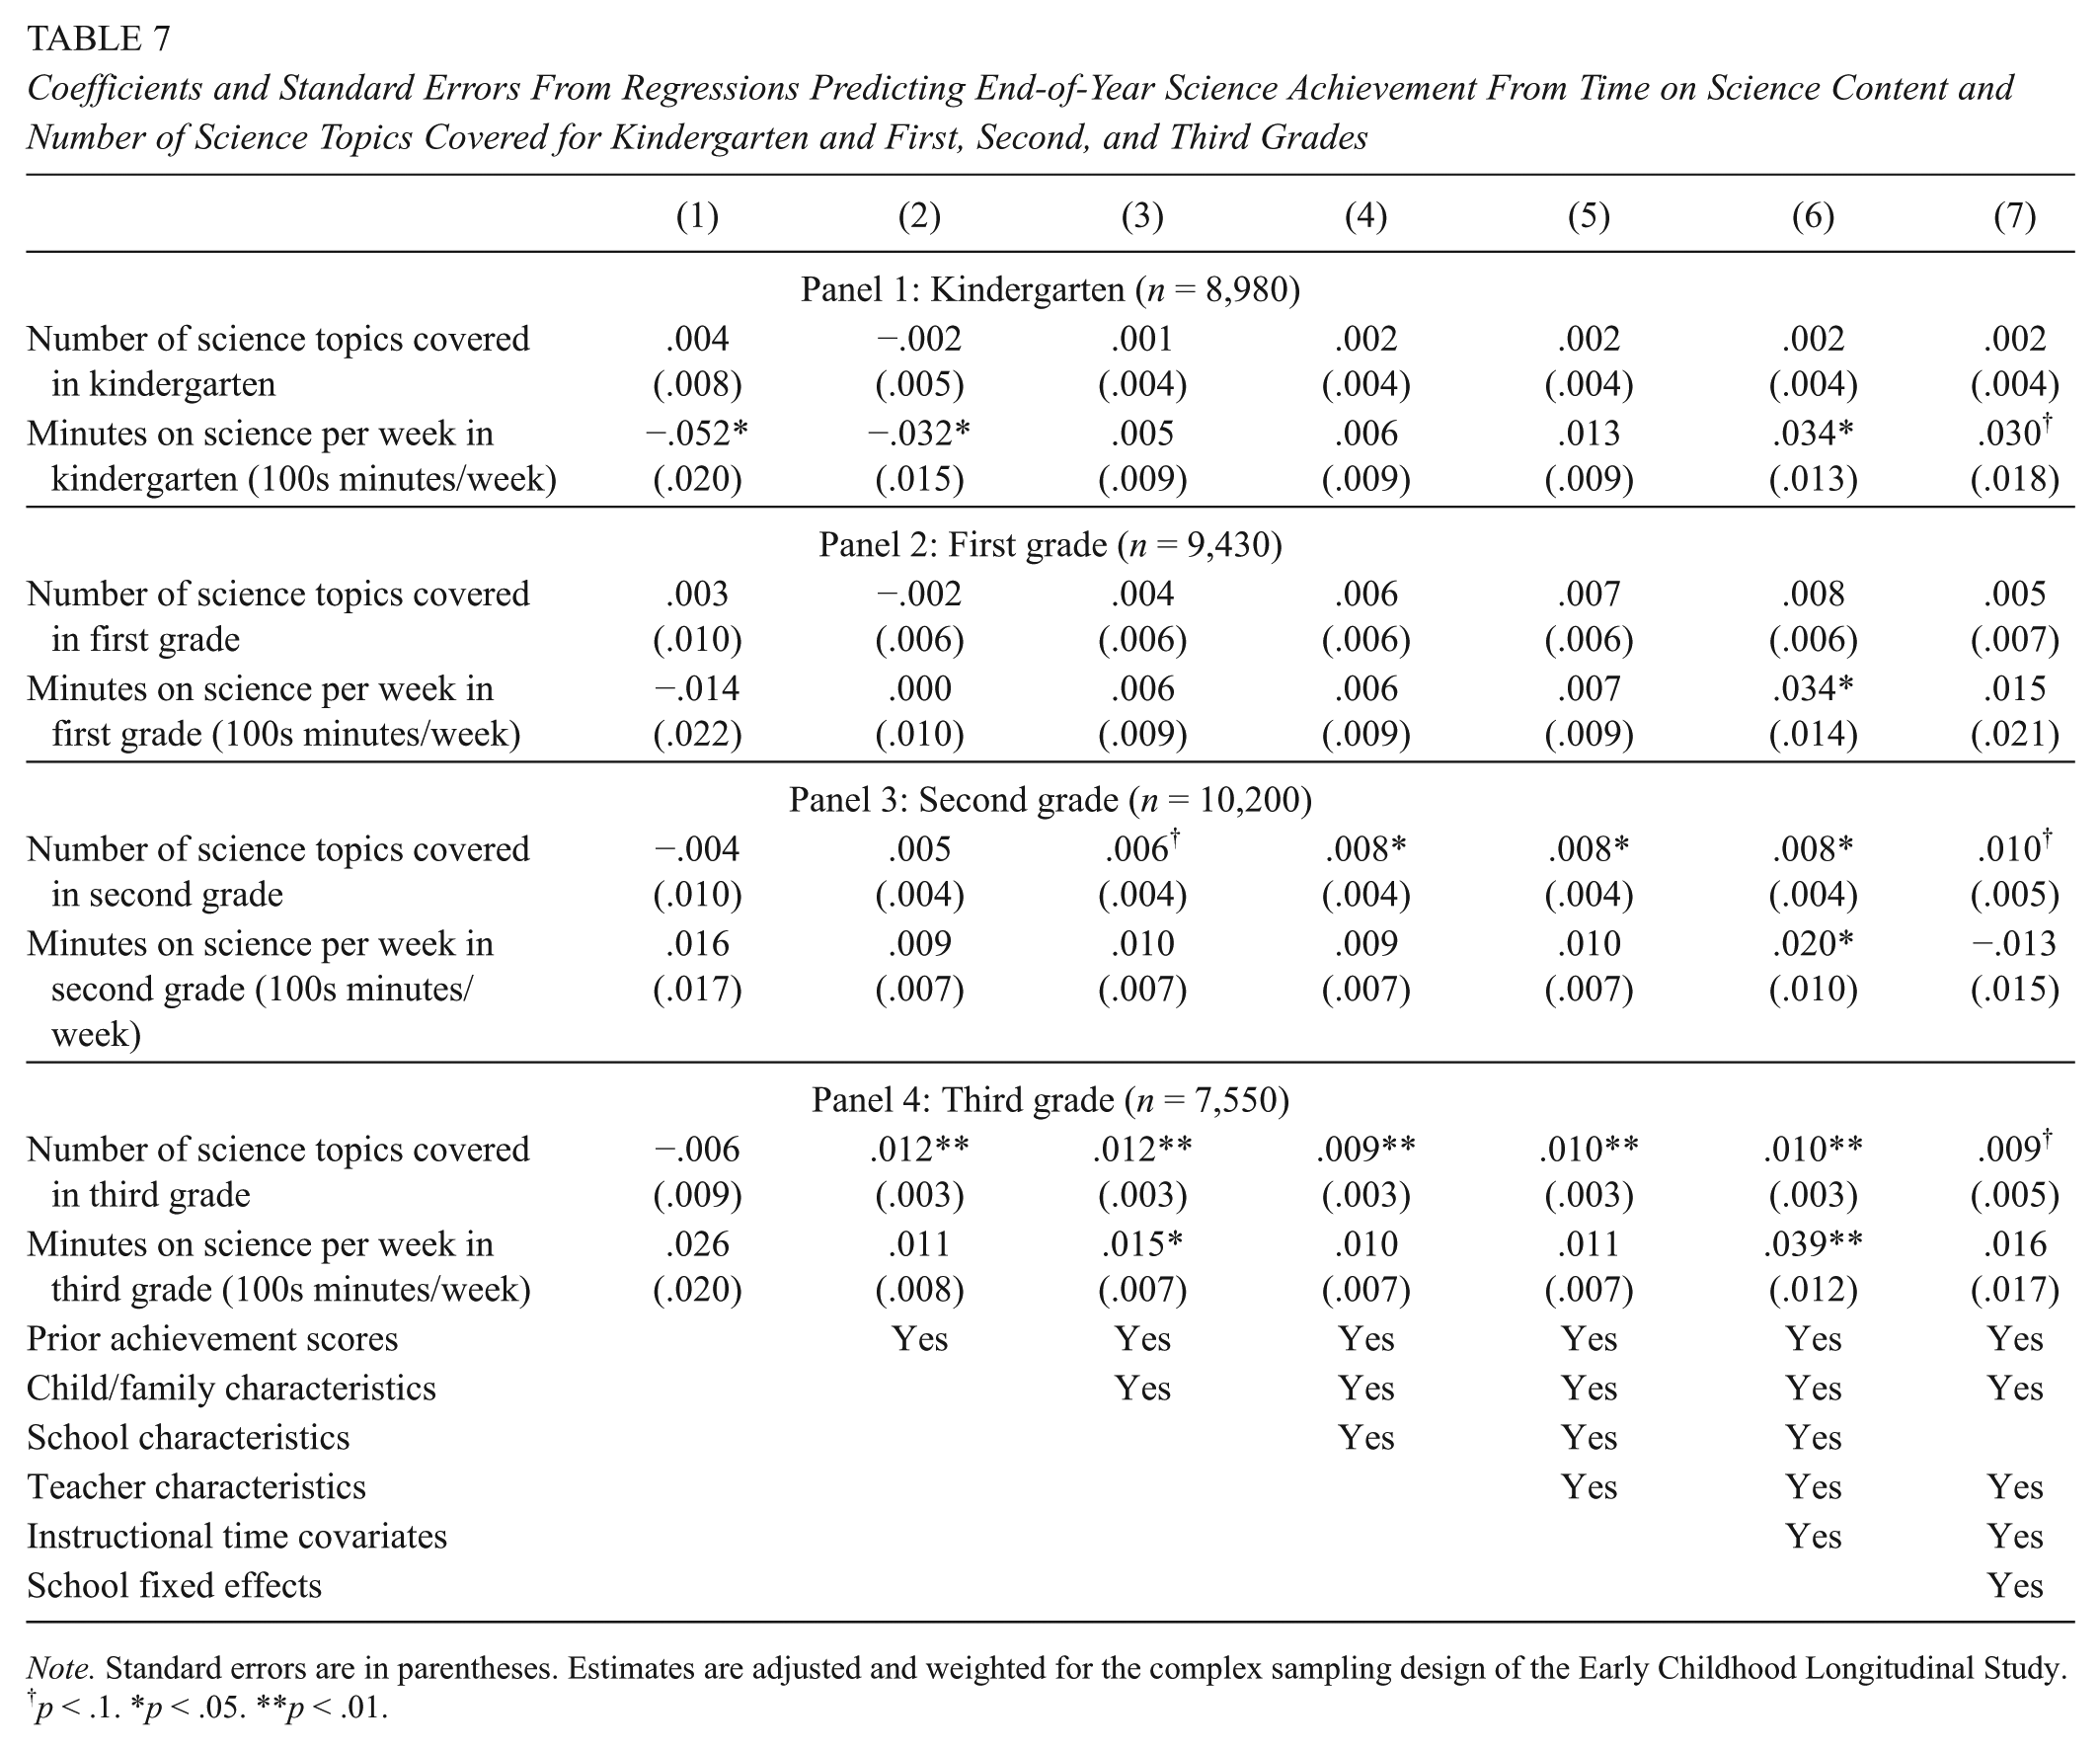
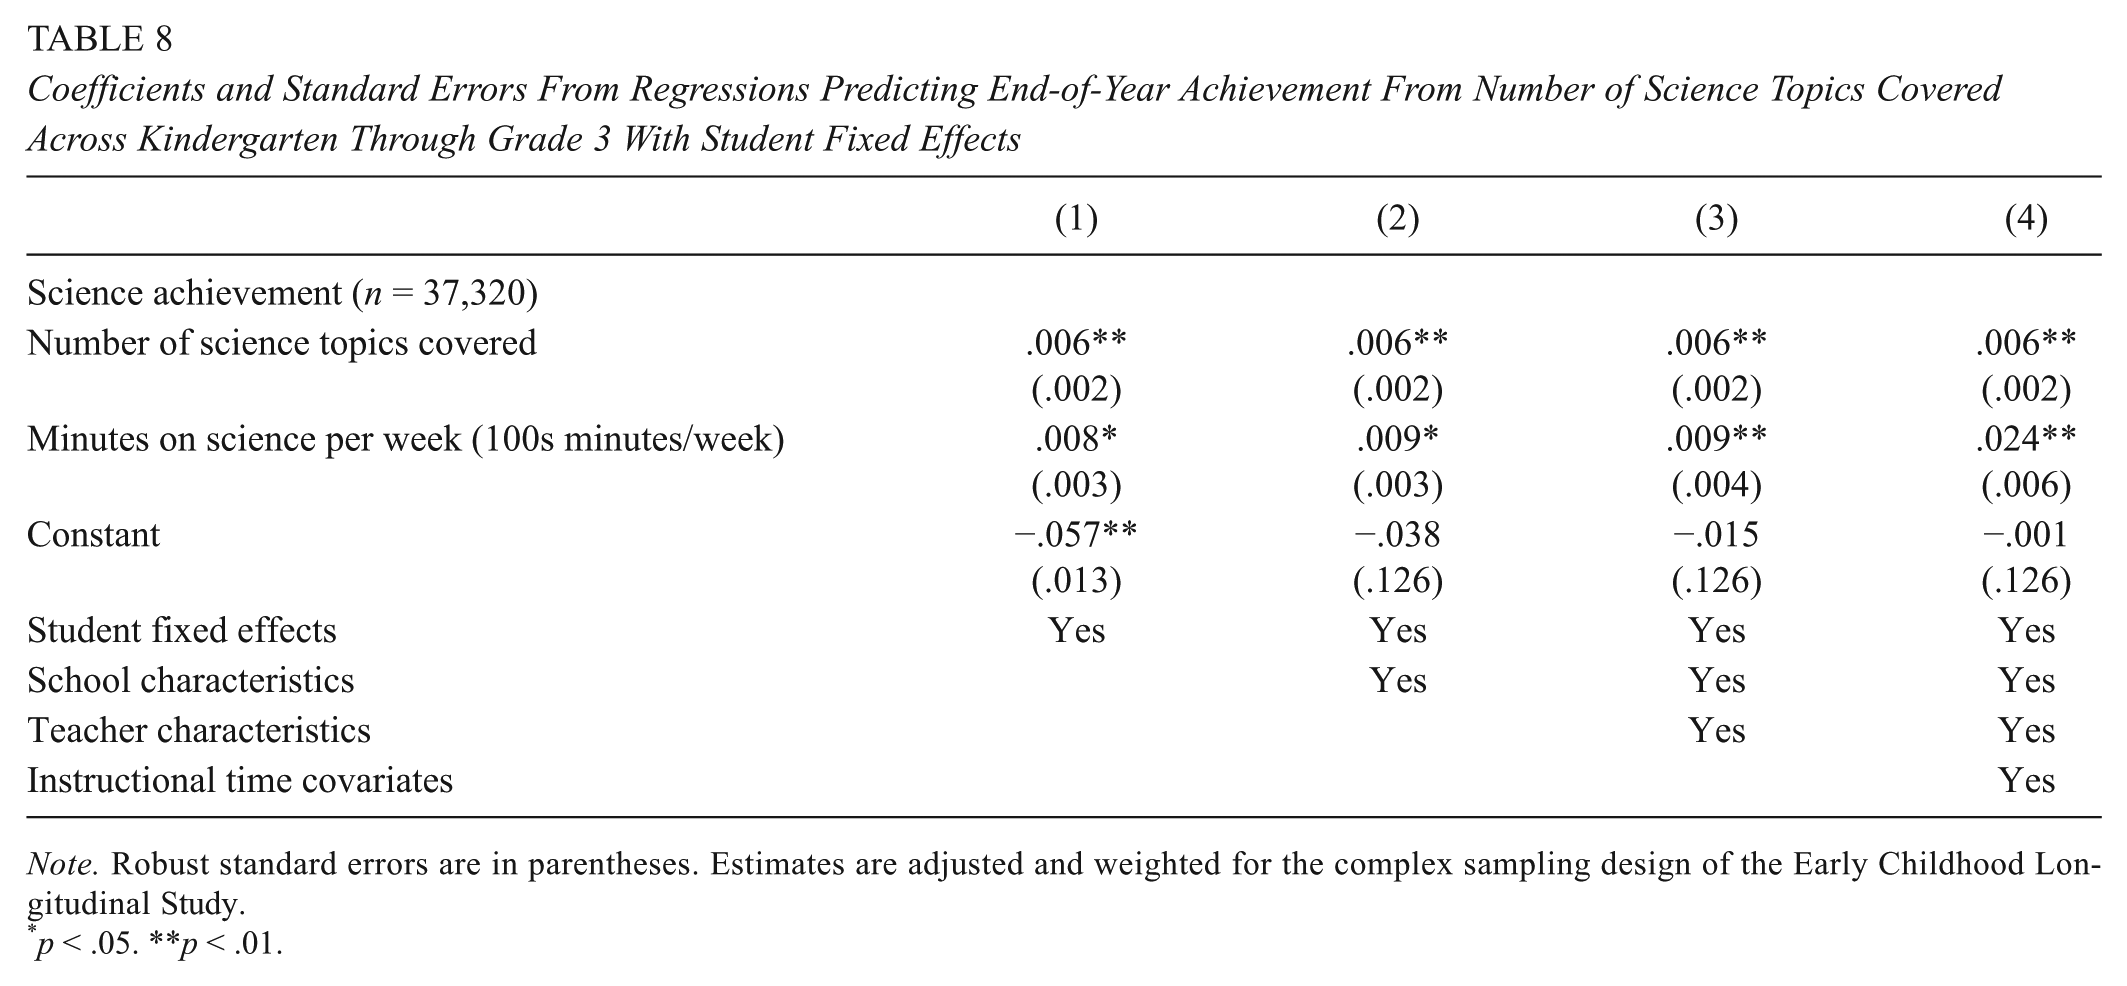
Turning then to results of the regression analyses relating the number of science topics or skills covered to science achievement, results suggest that the number of topics or skills covered is not systematically related to science achievement. Results of these models for the number of science topics are shown in Table 7. As before, results for kindergarten and first, second, and third grade are displayed across four panels. As shown, the number of science topics covered was generally an insignificant predictor of science achievement across specifications and grade levels. However, in models pooling data across all 4 years and including student fixed effects (see Table 8), the number of science topics was a significant predictor of science achievement, with each additional topic covered predicting a .006 standard deviation higher science achievement score. Insignificant results were observed for the relationship between the number of science skills taught and science achievement across almost all specifications (see Tables 9 and 10).
Coefficients and Standard Errors From Regressions Predicting End-of-Year Science Achievement From Time on Science Content and Number of Science Topics Covered for Kindergarten and First, Second, and Third Grades
Note. Standard errors are in parentheses. Estimates are adjusted and weighted for the complex sampling design of the Early Childhood Longitudinal Study.
p < .1. *p < .05. **p < .01.
Coefficients and Standard Errors From Regressions Predicting End-of-Year Achievement From Number of Science Topics Covered Across Kindergarten Through Grade 3 With Student Fixed Effects
Note. Robust standard errors are in parentheses. Estimates are adjusted and weighted for the complex sampling design of the Early Childhood Longitudinal Study.
p < .05. **p < .01.
Coefficients and Standard Errors From Regressions Predicting End-of-Year Science Achievement From Time on Science Content and Number of Science Skills Covered for Kindergarten and First, Second, and Third Grades

Note. Standard errors are in parentheses. Estimates are adjusted and weighted for the complex sampling design of the Early Childhood Longitudinal Study.
p < .1. *p < .05. **p < .01.
Coefficients and Standard Errors From Regressions Predicting End-of-Year Achievement From Number of Science Skills Covered Across Kindergarten Through Grade 2 With Student Fixed Effects

Note. Robust standard errors are in parentheses. Estimates are adjusted and weighted for the complex sampling design of the Early Childhood Longitudinal Study.
p < .01.
Subgroup Analysis
Across each of the analyses, we found little evidence that the relationship between time on science or breadth of science topics/skills covered and science achievement varied for students of different sex, of different race/ethnicity, or from homes where a non-English language is spoken. In general, models with interactions between minutes on science instruction per week and an indicator of being female (see online Appendix Table D1), a series of race/ethnicity indicators (see online Appendix Table D2), and an indicator of a non-English language being spoken in the home (see online Appendix Table D3) showed that the results of the primary findings did not appear to systematically vary for any of these subgroups. One exception to this is the relationship between minutes on science and science achievement for Black students. In both kindergarten and second grade, the relationship between time on science instruction and achievement is significantly lower for Black students than their White peers. While we do not have a clear explanation for why this would be the case, it raises interesting questions for future research that could probe the experience of Black students in the earliest grades with regard to science instruction. Like with time on science, we found no clear patterns of differential relationships by sex, race/ethnicity, or use of a non-English language in the home for the relationship between the number of science topics (see online Appendix Tables D4, D5, and D6) or skills covered (see online Appendix Tables D7, D8, and D9) and science achievement. There was also little evidence that results varied based on students’ prior science achievement.
Exploratory Analyses
In some cases, our primary findings provided mixed evidence. For example, we found positive and significant relationships between time on science and science achievement when using regression with observable controls as well as student fixed effects, but we found no such relationship in the school fixed effects models. Similarly, the number of topics covered showed a significant and positive relationship with achievement in the student fixed effects models but not in the other specifications. We empirically explored several possible explanations for the lack of significant findings across some specifications through post hoc analyses, and we present those results here.
Measurement error in teacher survey responses
A possible explanation for a lack of consistent results across all specifications is that teacher responses to survey items may be subject to measurement error. We estimated the range in the total number of minutes per week that teachers reported providing instruction across all subject areas. Descriptive analyses of these measures revealed that, on average, the range of reported instructional time by teachers in the same school was 323 min per week in third grade and 654 min per week in kindergarten. In other words, teachers in the same school often reported significantly different amounts of instructional time, despite presumably being subject to similar lengths of the school day, daily schedules, and expectations for instruction.
While some of this variation may reflect true differences in instructional time, such as a teacher who provides more recess or free play to students as compared to another who focuses more on academic instruction, we suspect that a great deal of the variation is attributable to differences in interpretation of the survey question or recall of instructional practice. For instance, some teachers might have double counted instructional time spent reading a book about nature as being both reading instruction and science instruction, while a different teacher may have categorized this time strictly under one subject or the other. We see suggestive evidence of this possibility in that approximately 25% of teachers reported a greater cumulative amount of instructional time than would reasonably be possible in a given school week (assuming 5 days with 6 hours of school per day). Given this, we did examine the relationship between time on mathematics instruction and time on reading instruction and students’ science achievement. Time on math and reading were not, however, consistently related to science achievement.
To further address the potential issue of measurement error, we reran our primary time-on-science models with a categorical measure (quintiles) of time on science as well as with the days-on-science-per-week and time-on-science-per-day measures disaggregated (rather than our composite minutes-per-week measure). While such disaggregated measures will still be susceptible to recall and measurement issues, the results (see Appendix F, online) of the disaggregated models were consistent with the primary models, suggesting, at the least, that our use of a single continuous measure or our approach of combining the two original measures into a single composite was not driving insignificant results in the school fixed effects models. Overall, however, the evidence of wide variation in responses within schools leads us to question the validity of the school fixed effects models as such within-school variation is likely more subject to measurement error than the variation across schools, which, while still subject to measurement error, is likely to have a greater component of its variation attributable to real differences in instructional time.
In addition to error in reporting time on science instruction, teachers may have interpreted science topics/skills differently, failed to recall that they were taught, or covered them to different degrees of depth. In the cases of both time on science and topics/skills covered, the measure is limited by the self-reported nature of the survey item. Teachers may have experienced recall issues given that they completed the survey in the latter half of the school year, or they may have answered the question in what they perceived to be a socially desirable or aspirational way. As such, the measures used are limited by the self-reported nature and any measurement error that is introduced as a result. To the extent that such measurement error is random, it would introduce an attenuating effect on our estimates; however, systematic error related to both treatment and outcome could bias results.
Discussion
While not consistent across all specifications, the suggestive finding that time on science content may be related to higher science achievement provides a contrast to findings of prior work using national data to examine the relationship between science instruction and science outcomes. For instance, Saçkes and colleagues’ (2011) examination of the original ECLS-K found no relationship between the frequency and duration of science instruction and an end-of-kindergarten general knowledge test (which tested science content among other domains). The work presented here, while subject to limitations, suggests such prior work may have undersold the potential of time on science instruction to improve early science learning outcomes. By using newer data with true measures of science achievement and a more robust set of estimation strategies (including student fixed effects), the findings of this work suggest that time on science in the early grades may be a useful lever for improving science outcomes. That said, the results provide less clear statements about the depth or breadth of science instruction, with fewer relationships seen between the number of topics or skills covered and science achievement.
What do the findings mean for current debates about science instruction?
Advocates for improving science outcomes often push for more time on the subject or to shifts in the coverage of content to facilitate greater depth of subject coverage (National Science Teachers Association [NSTA], 2018). They point to the relative lack of time spent in science instruction in the elementary years as compared to time spent on reading and mathematics and often criticize the increased accountability of the NCLB era, which many see as having contributed to a crowding out of science instruction in favor of more heavily tested subjects (Blank, 2012; Griffith & Scharmann, 2008; McMurrer, 2008). Similarly, they point to international assessments and studies that demonstrate higher science performance among countries where depth of science content covered (fewer topics, covered in more detail) is the standard practice (Schmidt et al., 2005). This has led to an emphasis on more depth in instruction in various national policy documents during the past several decades (NGSS, 2013b; Schwartz et al., 2009).
The results of our study suggest that such structural-level changes, particularly allocating more time to science instruction in early classrooms, may drive some improvements in science achievement but are likely not sufficient to close achievement gaps or facilitate substantial gains in overall levels of science performance. For example, even in the case of time on science, where we saw the most evidence of a positive relationship with achievement, a 100-min gain in science instruction per week predicted a .022 to .037 standard deviation higher level of science achievement. Thus, even if schools were to increase elementary science instruction time by 400 min per week, bringing it into closer alignment with time spent on mathematics and reading, our estimates suggest that average gains in science achievement would be only one tenth of a standard deviation higher. While an improvement, this represents only about 10% to 12% of the magnitude of the Black-White or Hispanic-White science achievement gap in kindergarten. In other words, simply allocating more time to science instruction or altering the depth/breadth of science instruction by changing the number of science topics or skills covered in the early elementary classroom does not appear to be a high-leverage means of improving science outcomes.
This is not to say that time for science instruction or the number of topics/skills covered are not potentially important components of improving early science achievement. Indeed, they may be necessary yet not sufficient components of effective science instruction. While the theoretical framework of opportunity to learn positions exposure in terms of time and content covered as important, it also points to the importance of how instruction of such content occurs during that time—pedagogy—as well as the resources available to support such instruction (Carroll, 1989). It is possible that the impacts of time on science and depth of coverage are limited by a lack of use of effective science instructional practices or a lack of resources and supports to facilitate such practices. We turn then to a consideration of next steps for research that might better inform early science instructional practices.
Where can the research on science instruction in the early grades go next?
Our results point to the need for future research to consider more nuanced examinations of early science instruction that hit closer to the core of the teaching and learning environment of the classroom. While the broad measures of the nationally representative ECLS-K:2011 are less suited to unpacking such approaches, future research with smaller samples and more nuanced measures may provide better evidence of the types of science instruction that may promote student learning.
A first step for future research may be to build on existing studies of instructional practices in science in the earliest grades. On the one hand, a body of evidence suggests the importance of hands-on and inquiry-based scientific instructional practices (Calabrese Barton, Koch, Contento, & Hagiwara, 2005; Cuevas, Lee, Hart, & Deaktor, 2005; Furtak, Seidel, Iverson, & Briggs, 2012; Minner, Levy, & Century, 2010; Schroeder, Scott, Tolson, Huang, & Lee, 2007). Despite evidence for the effectiveness of inquiry-based science instruction, such approaches to science have tended to be more common in the upper elementary, middle school, and high school grade levels, with fewer studies’ examining the early grades (Bulunuz, 2013; Patrick, Mantzicopoulos, & Samarapungavan, 2009; Samarapungava, Patrick, & Mantzicopoulos, 2011). At the same time, research examining mathematics and reading in the elementary school years has often found benefits of direct and teacher-led instruction (Ansari & Purtell, 2017; Guarino, Hamilton, Lockwood, Rathburn, & Hausken, 2006; Kroesbergen, Van Luit, & Maas, 2004; Morgan, Farkas, & Maczuga, 2015). These benefits have been particularly pronounced for students who come from the lower ends of the achievement distribution (Morgan et al., 2015). While some studies have begun to probe this area in elementary science (Granger et al., 2012; Slavin, Lake, Hanley, & Thurston, 2014), future studies should seek to continue unpacking the relative value of different pedagogical approaches to science learning in the earliest grades.
In addition to examining pedagogical practices, future research should seek to further explore the integration of science with other subject areas. This study provided suggestive evidence that teachers may report time on science in an overlapping way with time on other subjects, likely as a result of integration of the subject areas. NSTA has advocated for such an approach in recent position statements, and NGSS include an emphasis on such cross-cutting subject area integration (NGSS, 2013a; NSTA, 2018). Empirically, recent studies have demonstrated that science lessons that integrate inquiry with literacy activities may enhance students’ enthusiasm for science and self-reported competency in science (Bradbury, 2014; Patrick et al., 2009). For example, in one study, this approach involved the pairing of science inquiry activities with books that aligned with similar content and writing activities such as keeping a science notebook that detailed students’ inquiry activities (Patrick et al., 2009). While such integration posed potential measurement issues in this study, it represents an area for active inquiry moving forward, in regard to both measurement and establishing a more robust evidence base for such integration to be done effectively in the earliest grades.
Finally, our work points to the need for future examinations of what works and the supports needed to improve the quality of early science instruction. Prior research suggests that teacher professional development may be able to increase elementary teachers’ instruction and, in turn, outcomes for students (Gropen, Kook, Hoisington, & Clark-Chiarelli, 2017; Oliveira, 2010). For example, in an experimental examination of a preschool professional development program, Gropen and colleagues found that professional development focused on content knowledge and pedagogical content knowledge improved both quality of instruction and student performance on science tasks (Gropen et al., 2017). In addition to teacher professional development, support in the form of teaching resources may be critical. Bassok and colleagues report that the presence of a science/nature area or water/sand table in kindergarten classrooms has decreased by one third to one half from the late 1990s to the early 2010s (Bassok et al., 2016). Likewise, the number of first-grade teachers reporting the use of science equipment in their classrooms has decreased by approximately 50% during a similar time period (Bassok et al., 2016). The ability to leverage additional time or depth of coverage of topics/skills may be contingent on the presence of adequate resources such as these, suggesting that future work continue to probe the influence of resources on early science learning.
Conclusion
Improving student achievement in science and equity among subgroups of students remains a prominent goal of policy makers and educators alike. Recent studies using nationally representative data have demonstrated the importance of the early elementary years for later science achievement and disparities therein (Curran & Kellogg, 2016; Morgan et al., 2016). This study leveraged the first available nationally representative data with science achievement assessments in the earliest grades of elementary school to examine the relationship between several components of science instruction (time and breadth of content coverage) and subsequent science achievement. While providing some evidence that time on science matters for student outcomes, the results indicate that improvements in science achievement in the early grades will likely not be driven solely by higher level changes such as increasing the amount of time spent on science or adjusting the number of science topics or skills covered. Instead, the results point to the need for attention to more nuanced aspects of science instruction. For instance, aspects of curriculum, classroom resources, teacher training, and pedagogical approach may hold more promise for improving science learning. The results motivate the need for continued research on early science education and for reflection by practitioners on their current practices.
Supplemental Material
DS_10.1177_2332858419861081 – Supplemental material for Early Elementary Science Instruction: Does More Time on Science or Science Topics/Skills Predict Science Achievement in the Early Grades?
Supplemental material, DS_10.1177_2332858419861081 for Early Elementary Science Instruction: Does More Time on Science or Science Topics/Skills Predict Science Achievement in the Early Grades? by F. Chris Curran and James Kitchin in AERA Open
Footnotes
Acknowledgements
This research was supported by a grant from the American Educational Research Association, which receives funds for its “AERA Grants Program” from the National Science Foundation, under NSF Grant #DRL-0941014. Opinions reflect those of the author(s) and do not necessarily reflect those of the granting agencies.
Authors
F. CHRIS CURRAN is an assistant professor of public policy at the University of Maryland, Baltimore County, School of Public Policy. His research focuses on early elementary education and school discipline and safety.
JAMES KITCHIN is a graduate student at the University of Maryland, Baltimore County, School of Public Policy. His research interests include immigration policy and education policy.
References
Supplementary Material
Please find the following supplemental material available below.
For Open Access articles published under a Creative Commons License, all supplemental material carries the same license as the article it is associated with.
For non-Open Access articles published, all supplemental material carries a non-exclusive license, and permission requests for re-use of supplemental material or any part of supplemental material shall be sent directly to the copyright owner as specified in the copyright notice associated with the article.