
Abstract
Multilingual learners (MLs) represent an increasing proportion of public school students. Although much attention has been given to their academic performance in English language arts and math, less research has addressed their academic performance in science, particularly in elementary school. This study leveraged nationally representative data from the Early Childhood Longitudinal Study of 2010–2011 to document the science test score trajectories of MLs from kindergarten through fifth grade. Using descriptive statistics and regression analyses, our findings document wide variation in elementary science test performance among subgroups of MLs while also documenting the rapid gains this group makes in science performance across the elementary years compared with non-MLs. Our study is among the first to use nationally representative data to examine science learning trajectories of MLs and provides a foundation for policy, practice, and future research aimed at understanding how the linguistic assets of MLs promote science learning.
Introduction
Students who are in the process of adding English to their linguistic repertoires while coming from a household where a non-English language is regularly spoken represent an increasing proportion of students in U.S. public schools (American Academy of Arts & Sciences, 2016; National Center for Education Statistics, 2023). Such students include those who receive English learner services at school but also a broader set of students who navigate elementary school from a multilingual perspective. A number of terms have been used to describe this group or subgroups therein including English language learners (ELLs), English learners (ELs), emergent bilinguals, and multilingual learners (MLs). As their presence continues to expand (National Center for Education Statistics, 2023), there has been increasing attention to their academic performance in schools.
In this study, we adopt the term multilingual learner (ML) to describe students who come from households where a language other than English is regularly spoken. This group includes students who receive formal EL services at schools, a subgroup that is identified by school personnel through a formal process that indicates their native language and assesses their English proficiency often at school entry. We also use the term inclusively of a broader set of students who come from households where a non-English language is regularly spoken, reflecting our interest in this broader group and a growing body of literature that demonstrates variation in both ELs and MLs more generally (Goodrich et al., 2021; Sattin-Bajaj & Mavrogordato, 2019). In particular, recent research has pointed to the limitations of focusing only on those receiving EL services at school (Kieffer & Thompson, 2018; Thompson et al., 2023). Such work suggests that MLs, including those receiving EL services but also those not receiving EL services (such as those who have been reclassified, not yet identified for services, or whose English proficiency does not qualify for services), have unique educational experiences and trajectories that may differ from each other and their non-ML peers (Pacheco et al., 2024; Thompson et al., 2023). For example, Umansky (2016) found that multilingual learners classified as ELs had different academic trajectories than students with similar linguistic proficiencies in kindergarten who were not classified as ELs. As we describe next, the evidence on the academic performance of different populations of MLs, both as a whole and as subgroups therein, such as those receiving EL services, points to a need for further research that can improve the opportunities afforded through schools.
Although there is a robust body of evidence on the academic performance of MLs and subgroups therein (particularly those receiving EL services at school) in reading and mathematics (e.g., Fry, 2007; Goodrich et al., 2021; Murphey, 2014; Rolstad et al., 2005), their academic performance in science has received comparatively less attention (see Morgan et al. [2016] and Pacheco et al. [2024] for recent exceptions). In one of the few studies that examined the science performance of MLs, Morgan et al. (2016) found that third and fifth graders who spoke a non-English language at home scored around 1 standard deviation (SD) lower than students from English-only homes. Similarly, results from the National Assessment of Educational Progress (NAEP) demonstrate significant disparities in science at fourth grade between the subgroup of ML students receiving formal language-support services in school (what the NAEP and the Every Student Succeeds Act term as ELs) and other students (U.S. Department of Education, 2019a).
The academic performance of MLs and subgroups therein in science is important because science learning is increasingly critical for both individual and collective outcomes. Much attention has been given to the economic returns to individuals for careers in science and the importance of an educated science workforce for national economic competitiveness (Hanushek et al., 2010; National Science Board, 2018; Oreopoulos & Petronijevic, 2013). Unfortunately, as recent evidence shows, MLs are not being served to meet their full potential to contribute to and benefit from the economic returns of science education. For example, a recent policy statement from the California Association of Science Educators pointed to only 2.4% of the state’s MLs meeting or exceeding expectations on the state science assessment, leading them to state that “policies and practices to support Multilingual Learners in science should be in place at every level of the California Education System” (California Association of Science Educator, 2023). Similarly, speaking more specifically to those receiving EL services, a 2018 report by the National Academies of Sciences, Engineering, and Medicine states, “ELs are underrepresented in STEM [science, technology, engineering, and math] fields in college as well as in the workforce” (p. ix). For many students, particularly those of Hispanic ethnicity, this underrepresentation is driven in part by disparities in the K–12 educational pipeline and college enrollment (Garrison, 2013; Shi, 2017), suggesting a need to focus on early science learning trajectories. The past decade has seen significant attention to and advancement in science education in the United States, including the National Research Council’s Framework for K–12 Science Education and adoption of the Next Generation Science Standards by many states.
As emphasized by these and other recent reports (National Academies of Sciences, Engineering, and Medicine, 2022), ensuring the promotion of equity in science learning is critical. In particular, increasing the diversity of those entering science-related fields holds promise for improving a number of social outcomes, from health to public policy, through increased representation of the communities served (Rodriguez et al., 2014; Saha, 2014; Valla & Williams, 2012). MLs possess assets, including linguistic, cultural, and social capital, that position them to contribute to advanced STEM academic opportunities and careers as well as to efforts to diversify and improve representation in science-related fields (see Lee [2021] for a recent discussion).
As with reading and mathematics (Fry, 2007; Murphey, 2014; Rolstad et al., 2005), there is a body of research that examines science instruction and learning for MLs, particularly those receiving EL services (Estrella et al., 2018; Lee, 2005; Lee & Buxton, 2010); however, unlike for reading and mathematics, it has been much less common for such work to employ nationally representative data, particularly at the elementary school level (see Curran & Kitchin [2019] and Morgan et al. [2016] for some exceptions). The nationally representative work that does exist suggests that the experience of MLs in science may differ from that in reading and mathematics (Morgan et al., 2016). For example, prior work has shown that racial/ethnic and socioeconomic disparities in elementary science test performance are larger than in reading or mathematics (Curran, 2017; Curran & Kellogg, 2016) and that differences for Hispanic and Asian subgroups may be related to language (Curran & Kitchin, 2019). Furthermore, emerging research has begun to point to the heterogeneity in MLs (Goodrich et al., 2021; Johnson, 2023; Kieffer & Thompson, 2018; Kim & Choi, 2021; Pacheco et al., 2024; Sattin-Bajaj & Mavrogordato, 2019; Umansky, 2016; Wolf et al., 2024), motivating a need to examine variation within the broader category of MLs to better understand the science learning trajectories of particular groups of MLs. This is particularly important because subgroups of MLs may experience uniquely different contextual environments—from out-of-school familial and neighborhood settings to formal school settings such as differing amounts of EL services (Kangas, 2018).
This study builds on existing literature by examining elementary school science test score trajectories of MLs with nationally representative data. By examining standardized science test scores for grades K–5, it extends beyond prior work that has often been limited to outcomes of reading and mathematics and/or limited to studies in upper grade levels. In doing so, it responds to recent recommendations from the national academies on the importance of emphasizing science and engineering in the early years of schooling (National Academies of Sciences, Engineering, and Mathematics, 2022). In examining the science performance of subgroups and variation within MLs broadly defined, this study complements a number of recent studies that have begun to examine the heterogeneity within test scores of MLs (Goodrich et al., 2021; Johnson, 2023; Kieffer & Thompson, 2018; Kim & Choi, 2021; Pacheco et al., 2024; Thompson et al., 2023; Umansky, 2016; Wolf et al., 2024) and expands beyond work that tends to focus only on MLs receiving EL services at school. This focus on MLs broadly, not only those receiving EL services, recognizes that not all MLs receive EL services and that such students nevertheless may experience educational systems differently than their English-only peers and that this group has traditionally received less attention in the research literature than those formally classified as ELs. Next, by examining the ways in which science test score trajectories are sensitive to contextual variables (e.g., school, family, and individual characteristics), the study provides insights into the correlates of science learning gains for MLs as well as the contextual variation that ML subgroups experience. Finally, we still seek to understand how these test score disparities in science compare with those in reading and mathematics because prior research points to potential differences across subject areas (Curran & Kellogg, 2016). The study addresses the following research questions:
How do science test score trajectories vary across and within ML student groups in elementary school? Specifically, how do they vary for (a) MLs whose primary home language is English and those whose primary home language is not English, (b) MLs who receive formal EL services at school and those that do not, and (c) MLs who are Spanish speakers and MLs who speak less common languages?
To what extent are differences in science test score trajectories explainable by student, family, and school contextual variables?
How do the science test score trajectories for ML subgroups in science differ from those in reading and mathematics?
The findings of this study stand to make contributions to research, policy, and practice. As one of the first studies to examine early elementary science test scores of MLs on a national scale across the entire elementary school years, this study provides necessary descriptive context on the science test score trajectories of MLs, the contextual factors that may be related to different trajectories, and how these may differ from trajectories in other subjects. In examining the heterogeneity within MLs, the study points to strengths among ML subgroups whose experiences might be further studied to improve science learning outcomes for MLs broadly. In doing so, we note that our analyses examine ML subgroups spanning those receiving EL services at school to groups that may include some students who would be classified as native English speakers but are in households where non-English languages are also regularly used. Because these groups move in and out of EL services and formal recognition by school districts over time, traditional cross-sectional analyses potentially miss nuances in their academic trajectories, a limitation we address with our longitudinal dataset. We turn next to a brief review of the literature followed by a presentation of our guiding theoretical framework, data, and methods. The paper concludes with a presentation of results and a discussion of the implications for policy and practice.
Background
Although varied terms are used in schools and research, in this study we adopt the broad term multilingual learner (ML) to encompass students who are from households where a non-English language is regularly spoken and are thus learning English alongside another language. This group includes not only those identified for EL services in schools (e.g., those for whom English is not their only or primary language and whose proficiency in English might affect their academic progress in a setting where English is used for instruction) but also a broader set of linguistically diverse students (including some for whom English may be considered their primary language but who are in households where a non-English language is also regularly used, some who may have previously received EL services but no longer do, and also nonnative English speakers who are deemed proficient in English and thus never received EL services in schools). As we describe in more detail later in this paper, we focus on a number of ML subgroups, as shown in the header of Table 1.
Means and standard errors of student, family, and school characteristics in kindergarten for the full sample and by multilingual learner status
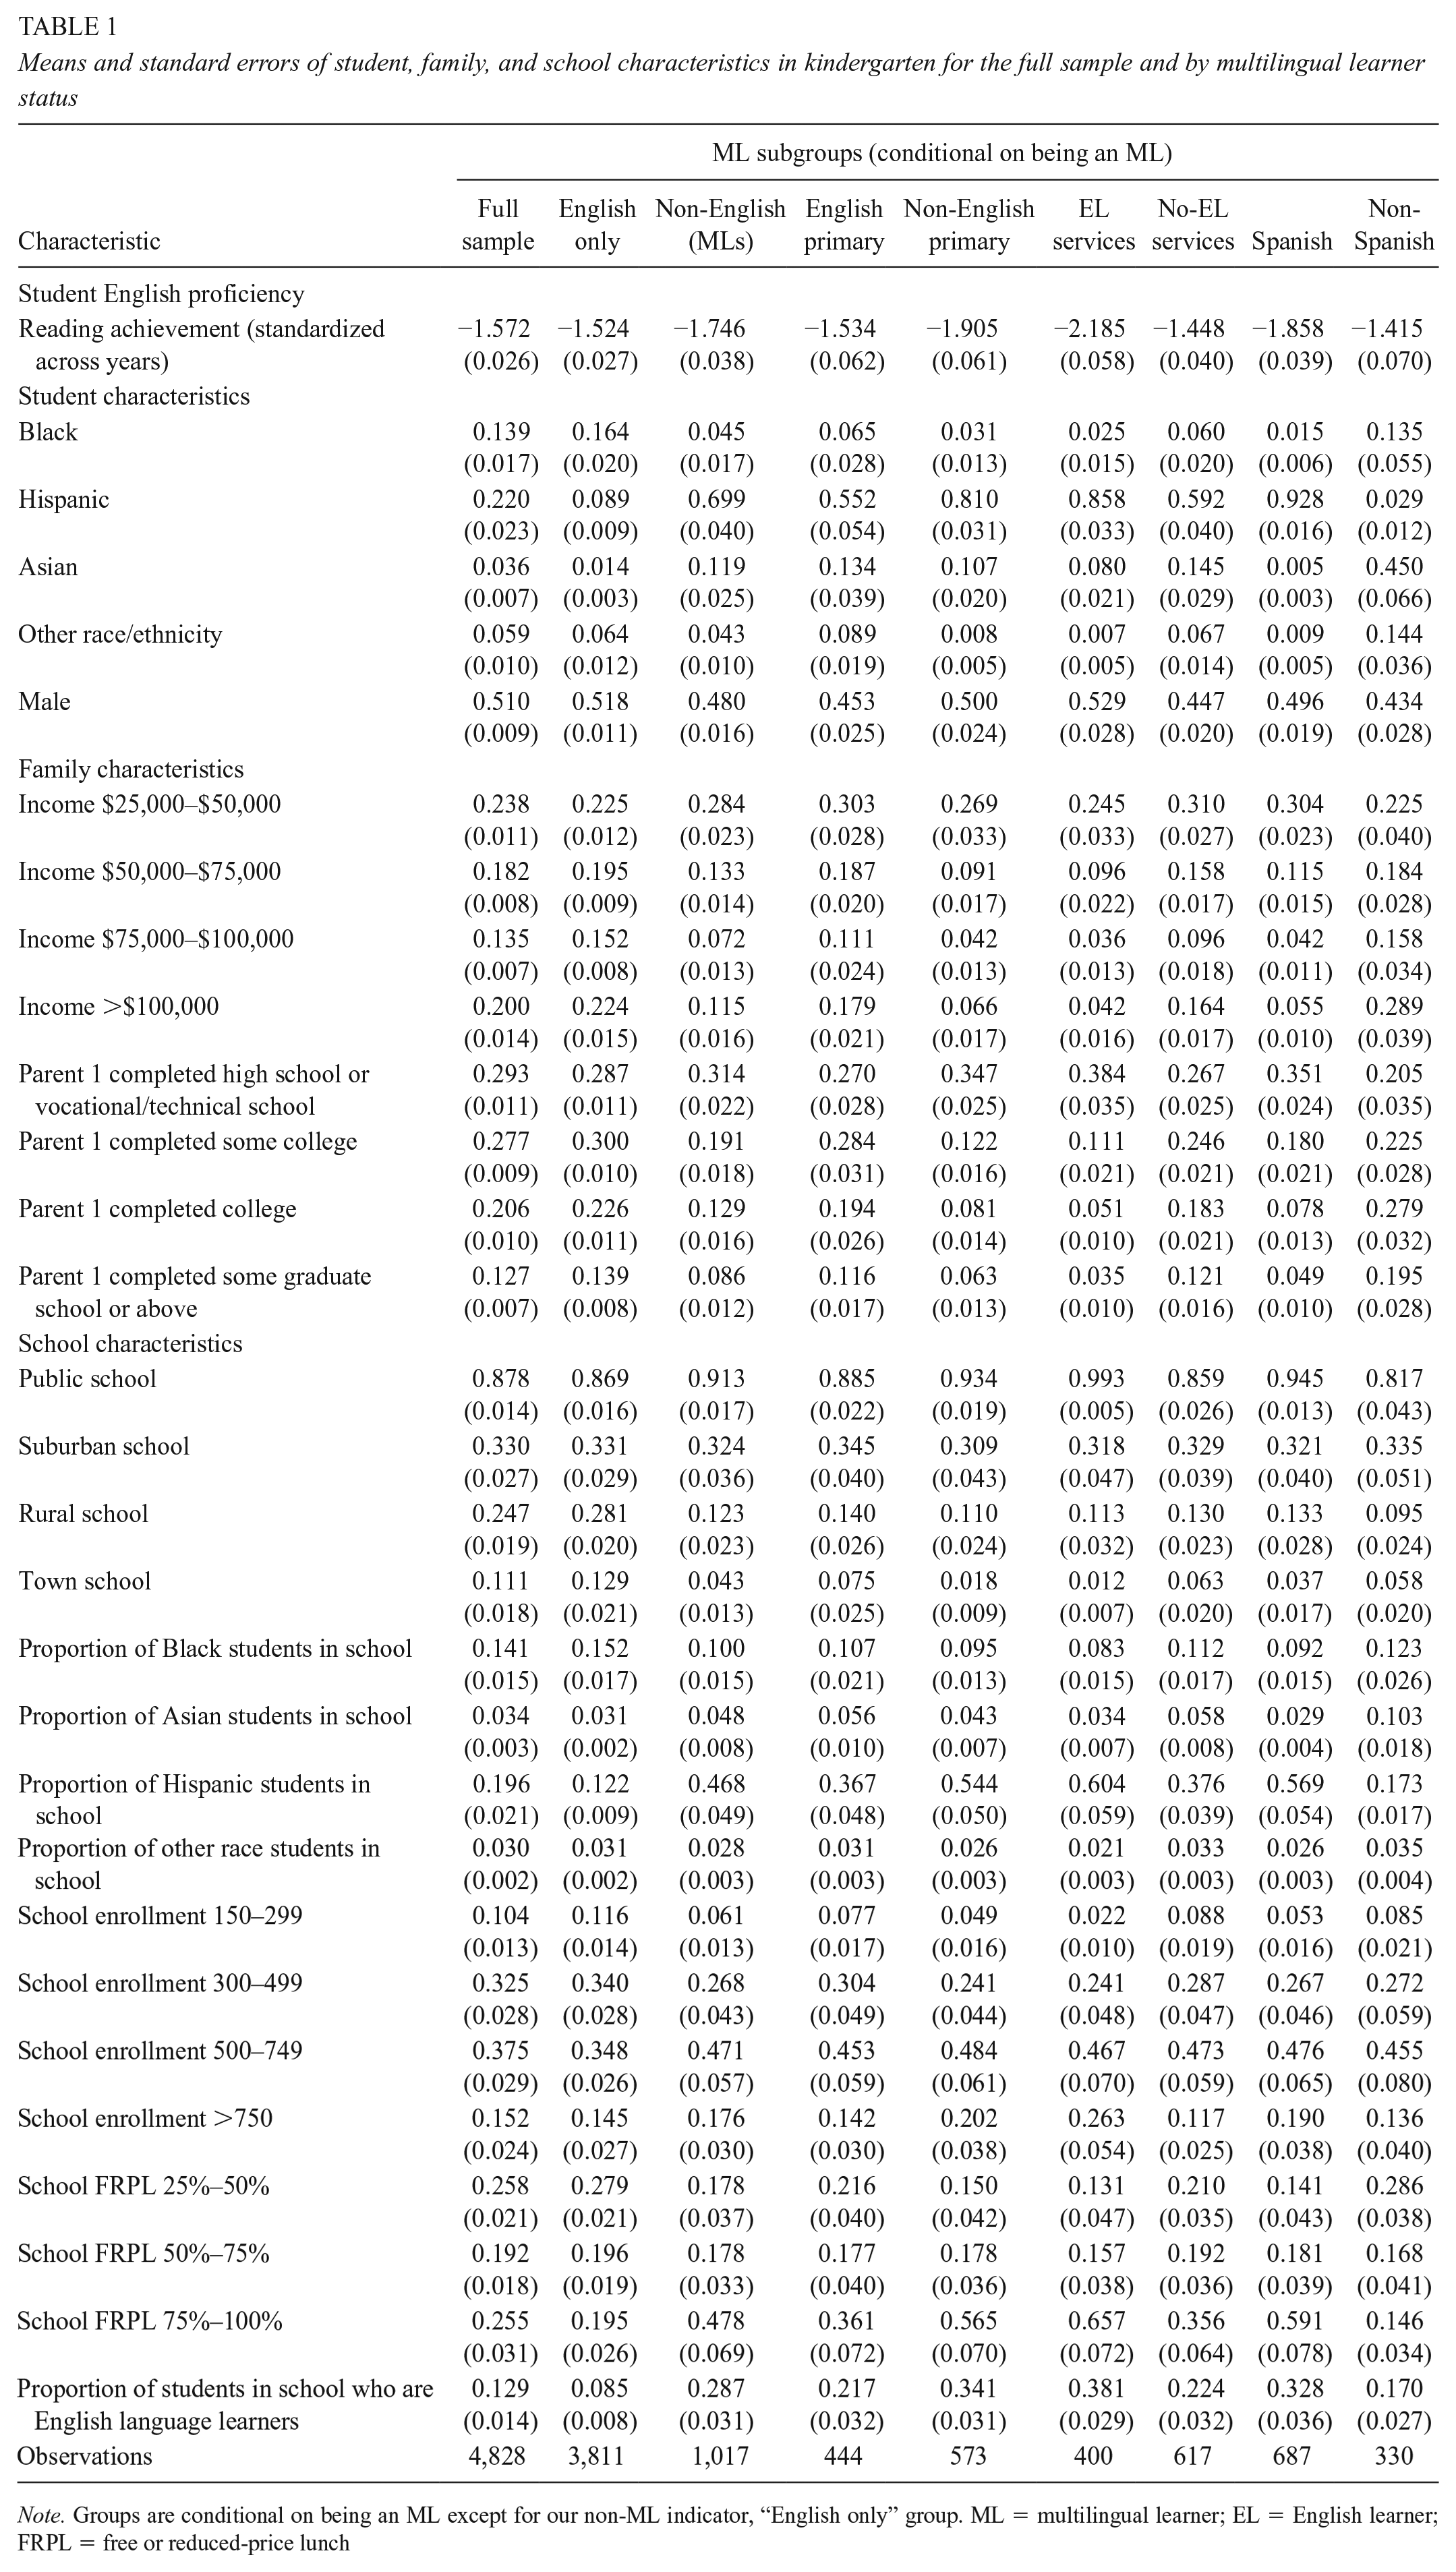
Note. Groups are conditional on being an ML except for our non-ML indicator, “English only” group. ML = multilingual learner; EL = English learner; FRPL = free or reduced-price lunch
We focus on the broader group of MLs for two reasons. First, students’ linguistic repertoires—including their proficiency in English and other languages—continually shapes their academic performance (García & Lin, 2017; García & Wei, 2014) regardless of their level of English proficiency or whether they are formally designated to receive EL services in school. Second, the literature has documented ways in which ML students might opt out of receiving EL services or are not appropriately identified to receive EL services or for reclassification (Catalano et al., 2020; Estrada & Wang 2018), the result being ML students who are not receiving formal EL services in school. Although we define MLs for this study as those from households where a non-English language is spoken, we recognize that others use the term more broadly—such as including native English speakers in dual-language programs or, more narrowly, such as using it only to refer to those receiving formal EL services at school. Further, we recognize that being from a household where a non-English language is spoken does not necessarily mean that the student is fluent in that language. By examining subgroups of MLs, we address and provide evidence on some of this variation in the use of the term ML.
Multilingual Learners in the United States
Although more than 20% of households in the United States speak a language other than English (our definition of ML; American Academy of Arts & Sciences, 2016), only about 10% of the total student population in public schools are formally identified by schools as ELs (currently qualifying for EL services; National Center for Education Statistics, 2021). Although STEM degree programs and the workforce attract a number of bilingual and international individuals, members of this population who received EL services in U.S. K–12 schools are underrepresented, in part due to overall lower rates of high school completion and college enrollment and completion (Chen, 2009; Garrison, 2013; Núñez et al., 2016; Varma, 2018). In addition, although most MLs who are formally identified by schools as ELs receive EL services to support their linguistic and academic trajectories, research is increasingly recognizing that MLs are not a monolith but rather consist of numerous subgroups with distinctly different experiences (Kieffer & Thompson, 2018). Sattin-Bajaj and Mavrogordato (2019) wrote that the indicators of being an EL “tend to be dichotomous indicators of whether or not a student has been given such a classification” and thus miss “critical differences within these large and heterogeneous groups” (para. 3). The broader group of MLs acknowledges this diversity that exists within ELs while also encompassing multilingual students who are not receiving EL services. It includes students who may identify as ELs but do not have a formal EL classification, those who have yet to be classified as ELs, those who have been reclassified out of EL status, and those who may not qualify for services but are still navigating learning English alongside another home language. Just as Sattin-Bajaj and Mavrogordato (2019) pointed to variation in ELs, recent research demonstrates the importance of expanding to encompass MLs who do not have a formal EL classification (Johnson, 2023; Kieffer & Thompson, 2018; Pacheco et al., 2024; Umansky, 2016). In other words, an ongoing challenge in understanding the differences in outcomes between MLs and non-MLs relates to heterogeneity within the ML population.
Nationally, MLs in K–12 schools make use of about 460 different languages (Kindler, 2002). By far Spanish is the most common, being the primary non-English language of around three quarters of MLs who receive EL services (U.S. Department of Education, 2019b). The next four most common languages—Arabic, Chinese, Vietnamese, and Somali—collectively are used by ~7% of such students (U.S. Department of Education, 2019b). Recent shifts in immigration patterns have seen an increasing prevalence of students speaking languages such as Arabic compared with a decade ago (NYU, 2018). This linguistic diversity also intersects with other aspects of these students’ identities, from racial and cultural backgrounds to experiences of immigration from different geographic settings (García et al., 2008).
Such heterogeneity also extends to the contextual environments of MLs. For example, in Montana, <6% of MLs identified for EL services speak Spanish, and in Hawaii, the most common language among the group is Ilocano (U.S. Department of Education, n.d.). Within states, the concentration of MLs varies by school district and school such that some MLs experience linguistic enclaves of same-language peers, whereas others may be more isolated, the experience of which has been linked to differences in opportunity and academic outcomes (Drake, 2014; Schultz, 2021; U.S. Department of Education, n.d.). For example, Goodrich et al. (2021) found that even at the state level, states with a larger percentages of multilingual students had smaller achievement gaps compared with monolingual peers in mathematics and reading. Kieffer and Thompson (2018) had similar findings, showing that MLs improved two to three times more than monolingual students’ scores in mathematics and reading in the fourth and eighth grades. In addition, MLs experience different formal educational environments and differing policies and practices that shape whether they are formally identified by schools and afforded EL services because identification procedures vary. According to Salerno and Andrei (2021), every state uses home-language surveys (i.e., parent reports of home language) as the first step in identification for EL services, although survey questions vary. However, at least 27 states then require English language proficiency screeners (i.e., an assessment or test of English ability) to be administered to students whose home language is not English, but there are differences between how students’ home languages are determined (Education Commission of the States, 2020a, 2020b; MacGregor & Sahakyan, 2020).
States and school districts vary in their processes for identifying students for EL services (Education Commission of the States, 2020b; Salerno & Andrei, 2021). Once identified, MLs deemed in need of EL services are served by a variety of instructional programs. These include sheltered immersion, pull-out or push-in instruction, and dual-language or transitional bilingual education in which some or almost all instruction is delivered in languages other than English. Programs and approaches vary in the extent to which students receiving EL services are included in mainstream classrooms and the extent to which a non-English language is used in instruction, among other dimensions. Many students move out of EL services during the elementary school years, often in ways that vary based on differences in both state law and local implementation (Estrada & Wang, 2018; Mavrogordato & White, 2017; Pacheco et al,, 2024; Umansky et al., 2020; White & Mavrogordato, 2019). MLs who exit EL services are tracked for a minimum of 2 years to assess whether they could benefit from additional support (U.S. Department of Education, 2015), although this tracking varies by state and, in some instances, by local district (Education Commission of the States, 2020c). Only recently have studies begun to examine the implications of this reclassification process on the subject area of science (Pacheco et al., 2024), and few studies have examined ML elementary students’ science trajectories more broadly.
Elementary Science Instruction
Elementary teachers are expected to cover a wide range of science concepts, skills, and practices. For example, the Next Generation Science Standards (NGSS), which were beginning widespread adoption during the time period of the Early Childhood Longitudinal Study, Kindergarten Class of 2011 (ECLS-K:2011) data collection, include topics such as forces, weather, plants and animals, geology, and outer space, among others. The NGSS emphasize science practices such as analyzing data, asking questions, and carrying out investigations. Prior work has documented the instructional strategies commonly used in elementary science classrooms, which include whole-class instruction, small-group work, and, to a lesser extent, hands-on/laboratory investigations (see Wilson et al. [2015] for a detailed discussion). In the early elementary grades, science instruction generally happens in the regular classroom, whereas instruction by a separate science teacher increases in use in upper elementary school.
Unfortunately, science often receives less time than reading and mathematics in elementary school (Conderman & Woods, 2008). Blank (2013) documented declines in science instructional time during the No Child Left Behind era, and Bassok et al. (2016) found fewer science topics covered in the early 2010s than in the late 1990s. Prior analyses of the ECLS data found that teachers spend, on average, 117 to 152 minutes per week on science in kindergarten through third grade compared with 348 to 430 minutes per week on math and 565 to 635 minutes per week on reading (Curran & Kitchin, 2019). More recent data from the 2017–2018 National Teacher and Principal Survey shows similar differences, finding that third graders nationally spent only 170 minutes on science per week compared with 500 minutes per week on language arts and reading and 350 minutes per week on math (U.S. Department of Education, 2019c). Unfortunately, for many MLs, there may be obstacles to science learning given language and cultural barriers as well as time spent out of the classroom (see Lee and Buxton [2010] for a thorough review of science instruction and MLs). Given the diversity in MLs as a group as well as the educational contexts they experience, it is perhaps unsurprising that their academic performance differs from non-MLs and across ML subgroups.
Elementary Science Achievement and MLs
Differences in average test scores between groups of students have been a central issue for policymakers for decades. From seminal work such as the Coleman Report focusing on differences in educational experiences and outcomes by race (Coleman et al., 1966) to differences by socioeconomic status (Reardon, 2018), educators and policymakers have defined these differences between groups of students, often termed achievement gaps, as a pressing policy problem. More recent literature has focused attention on the opportunity gaps—differences in opportunities that result in differences in achievement (Ladson-Billings, 2006; Milner, 2012). We purposefully avoid the term achievement gap because of its documented issues and tendency to promote deficit views of students (Gutiérrez, 2008; Ladson-Billings, 2006; Milner, 2012; Quinn, 2020; Quinn et al., 2019). However, the impetus to improve equity in academic outcomes among groups of students remains. Our work echoes a need to prioritize equity in science education as emphasized in the 2012 Framework for K–12 Science Education, where “research demonstrates the importance of embracing diversity as a means of enhancing learning about science and the world, especially as society in the United States becomes progressively more diverse with respect to language, ethnicity, and race” (National Research Council, 2012, p. 29).
Differences in average test scores have been studied extensively in both mathematics and reading at the elementary school level (Chatterji, 2006; Duncan & Magnuson, 2011; Hemphill & Vanneman, 2011; Ornstein, 2010; Reardon, 2011; Vanneman et al., 2009). Previous research has found that Black and Hispanic children enter kindergarten with lower test scores in mathematics and reading and that these differences in test scores increase throughout grade levels for Black students while remaining stable for Hispanic students (Fryer & Levitt, 2006; Reardon & Galindo, 2009). Differences in average test scores for mathematics and reading assessments administered in English also exist between high- and low-income students (Reardon, 2013) as well as by ML status (Cook et al., 2011; Durán, 2008; Polat et al., 2016). For example, ML students who speak a non-English primary home language begin kindergarten with lower math and reading scores than their peers who speak English as their primary home language, but the difference in mathematics scores narrows across the elementary school grades and can vary by school context (Han & Bridglall, 2009). Comparatively, less research has addressed disparities in science test scores (see Jackson and Ash, [2012], Morgan et al. [2016], and Quinn and Cooc [2015] for recent exceptions), perhaps due in part to less emphasis on science in state accountability systems and fewer tested grade levels to yield large-scale data (Blank, 2013; Griffith & Scharmann, 2008; McMurrer, 2008).
The emerging body of research, however, finds that the test score disparities in elementary school science do not simply mirror those in reading and mathematics (Betancur et al., 2018; Curran, 2017; Curran & Kitchin, 2019). For example, although several studies have documented disparities in elementary science between racial minority students and their White peers (Morgan et al., 2016; Quinn & Cooc, 2015), other work has found that these differences tend to be larger in science than in reading or mathematics, particularly for Hispanic and Asian students (Curran & Kellogg, 2016). Although Asian students perform on par with or higher than their White peers in the earliest grades in reading and mathematics, they significantly underperform in science (Curran & Kellogg, 2016). This difference appears to dissipate for Asian students entirely by middle school and significantly decreases in size for Hispanic students (Quinn & Cooc, 2015; Morgan et al., 2016) and appears to be explainable in part by students’ language and immigration backgrounds (Curran & Kitchin, 2019). As hypothesized by Morgan et al. (2016), the reduction in disparities between White and Hispanic and Asian students may be attributable in part to a compensatory trajectory in which many MLs gain English proficiency in the first years of school (Reardon & Galindo, 2009).
The few nationally representative studies that examined early ML or ML subgroup science test performance have found differences between these groups. While some of these differences may be a function of science assessments often being administered in English, thus creating a language barrier for some ML students, the magnitude of the differences also suggests real variation in underlying science knowledge. For example, in 2019, fourth grade students who received EL services at school scored 34 points, or about 1 SD (SD = 35), lower on the NAEP in science than those not receiving EL services. A similar difference has been observed on the NAEP going back several decades (Lee & Buxton, 2013; U.S. Department of Education, 2019a). Morgan et al. (2016) found that students who spoke a non-English language at home scored 1 SD lower than their English-only peers in the third and fifth grades. This trend of lower science achievement scores for MLs holds in higher grade levels (Mulligan et al., 2012) as content progressively becomes more complex.
Although these studies suggest systematic differences in the elementary school science performance of MLs and non-MLs, few studies have explored the nuances of elementary science trajectories among multiple subgroups of MLs. Each of the studies noted earlier tended to examine only a singular operationalization of ML, in some cases using indicators of those receiving EL services at school and in other cases using a much broader definition such as speaking a non-English language at home. Other studies leveraged only cross-sectional data, providing a limited picture of ML students’ trajectories as they progress through school. Others have focused only on particular events, such as the movement out of EL services (reclassification; Pacheco et al., 2024). As we suggest next in our theoretical framework, the heterogeneity within MLs is potentially as important to understanding their academic trajectories as variation between MLs and non-MLs.
Conceptual Framework
We draw on Bronfenbrenner’s (1979) ecological systems theory to frame our examination of ML science test score trajectories. Ecological systems theory situates development as a phenomenon nested in spheres of influence that include both formal and informal environments (i.e., school and homes—parts of the microsystem) and broader contextual influences such as cultural, political, and historical contexts (i.e., exosystem and macrosystem). Recognizing that these contextual environments vary systematically for ML students and subgroups therein (Valenzuela, 2010), ecological systems theory motivates our focus on MLs as a group distinct from non-MLs but also our examination of subgroups of MLs.
Differences in context and opportunity to leverage linguistic resources are expected to vary systematically between ML and non-MLs but also within ML subgroups such as between students who receive EL services in schools and those who do not, between those who speak a common non-English language such as Spanish and those who speak a language that may be among one of the many less commonly used non-English languages, or between those who are exposed to English at home and those who learn English predominantly in formal school settings (Goodrich et al., 2021; Sattin-Bajaj & Mavrogordato, 2019; U.S. Department of Education, 2019b). As students move through elementary school over time (the chronosystem), we anticipate these various ecological systems to potentially manifest as differences in science test score trajectories across MLs. Consistent with ecological systems theory as a guiding framework, this study thus focuses on examining these trajectories over time for various ML subgroups while examining how sets of student, family, and school variables relate to the science test score trajectories.
Contributions of This Study
This study builds on the existing research on elementary school science test score performance of MLs and responds to recent recommendations for increased attention to early science learning (National Academies of Sciences, Engineering, and Medicine, 2022). In particular, we build on existing work by focusing our analysis explicitly on the trajectories of subgroups of MLs, recognizing that MLs are comprised of subgroups with differing backgrounds, experiences, and, potentially, academic trajectories. In doing so, this study provides the most comprehensive and nuanced view of ML science performance in elementary school to date and can inform practitioners and policymakers seeking to improve equity in early elementary science.
Data and Methodology
This study used data from the ECLS-K:2011, the most recent longitudinal and nationally representative data source of U.S. elementary schools. Administered by the National Center for Education Statistics, the ECLS-K:2011 followed a nationally representative set of kindergartners in 2010–2011 through fifth grade in 2015–2016, collecting a robust set of data from children, families, teachers, and schools through a series of assessments, questionnaires, and interviews (Tourangeau et al., 2019). Although there have been policy and contextual changes since the collection of the data, such as changes in identification and tracking of ML students as part of the Every Student Succeeds Act and wider implementation of the NGSS, the ECLS-K:2011 nevertheless represents the most recent nationally representative longitudinal study of elementary school students.
A unique feature of the ECLS-K:2011 was its inclusion of standardized science assessments in each year of the survey. Prior national data collections lacked science assessments for the full range of elementary school years. For example, the original ECLS-K included only science assessments in third, fifth, and eighth grades (Tourangeau et al., 2009). The NAEP only administers science assessments in one elementary school grade (fourth grade). With standardized science assessments in each of the K–5 grades alongside a robust set of student and contextual variables, the ECLS-K:2011 was well situated to address our research questions with greater detail than prior datasets.
Analytic Sample
Participants in the ECLS-K:2011 were sampled using a clustered and stratified probability design in which geographic regions served as the primary sampling unit. Schools that included kindergartens were sampled within region and, subsequently, children enrolled in kindergarten (Tourangeau et al., 2015). Our analytic sample consisted of students who had nonmissing data in grades K–5 on our outcome of interest (i.e., performance on a standardized science achievement measure) and nonmissing data on indicators of ML status in kindergarten. Our study applied appropriate sampling weights and clustering of standard errors to account for the complex sampling design of the ECLS as well as to adjust estimates for nonresponse and sample attrition. Our final analytic sample consisted of 4,828 students, of whom 1,017 met our definition of an ML (a student from a household where a non-English language was spoken). This equated to 28,968 student-year observations. After application of weights, our analytic sample was consistent with prior national estimates, with ~20% of the sample coming from a household where a non-English language is spoken and ~10% of our sample receiving EL services (American Academy of Arts & Sciences, 2016; NCES, 2021).
Independent Variable—MLs
Consistent with our conceptualization of MLs as a heterogeneous group and through the theoretical framework of ecological systems theory, we focused on several key independent variables that captured MLs as a broad group with specific subgroups therein. In particular, we used the following four measures: (1) whether a non-English language was spoken in the home (parent report and our definition of ML), (2) whether a non-English language spoken at home was the primary language at home in kindergarten (parent report), (3) whether students received EL services at school in kindergarten (teacher report), and (4) whether students’ non-English language was Spanish or a less common language (parent report). We coded each of these as binary variables.
One particular challenge in operationalizing MLs was that students may move between categories throughout grade levels. For example, a student may receive EL services in the early grades but achieve a level of English proficiency such that they no longer receive EL services by the later grades of elementary school. Indeed, prior analyses of the ECLS sample have found that ~10% of students received EL services in kindergarten, whereas only 5% did do by fifth grade. Similarly, a teacher in one grade level may be aware that a student speaks a language other than English at home, but a teacher in another grade level may not as a result of differential interaction with parents or differences in students’ use of the language as they progress in school.
As a result, for our primary models, we used a consistent definition of students’ ML status across grade levels to facilitate a consistent sample and comparisons as students progress through school. Consistent with prior literature (Bialik et al., 2018; Morgan et al., 2016; Roberts & Bryant, 2011), we used classifications and parent reports from kindergarten for three reasons: (1) students are most likely to receive EL services in this grade level, (2) schools are likely to have more interaction with parents in earlier grades, and (3) MLs who receive or will receive EL services will not have progressed out of EL services yet (NCES, 2022).
Our analysis was limited to students whose English language met a minimum threshold for administration of standardized assessments. At the beginning of the ECLS study, a language screener was used for students whose home language was not English, and the science assessment was administered only to those who met the minimum threshold. In general, most students (~98% in spring of kindergarten) met the minimum English threshold. By the spring of the first grade school year, the language screener was no longer used because almost all students (~99.9%) had met the minimum English threshold for assessment (Tourangeau et al., 2019). To ensure a consistent sample over time, our analysis includes only MLs who met this minimum screener threshold.
Dependent Variable—Science Test Performance
Our primary dependent variable, science test performance, was measured through standardized science test scores from low-stakes assessments administered by the ECLS-K:2011 program in the spring of each school year. The assessment covered earth and space science, scientific inquiry, physical science, and life science content (Najarian et al., 2018). Beginning in first grade, the direct child assessment consisted of a two-part assessment in which the second part of the exam was adapted based on performance on the first part (NCES, n.d.). The science assessments were administered in English in an untimed one-on-one setting in which questions were read to students. In kindergarten and first grade, a small subset of students who did not pass an English language prescreener did not take the assessment, but by the end of first grade, almost all students scored high enough on the prescreener such that for later grades the assessment was administered to everyone in English (Najarian et al., 2020; Tourangeau et al., 2015).
The science assessments were based on the 2009 science standards from six states (Florida, New Mexico, Texas, California, Arizona, and Virginia) and were reviewed by a panel of experts made up of curriculum specialists and educators, providing strong validity (Tourangeau et al., 2015). We note, however, that the science assessment was developed prior to more recent recommendations from the National Research Council (2012) for science education and administered as the NGSS were being adopted—meaning that it may not capture all dimensions of science instruction advocated for by the NGSS. Reliability of the science assessments ranged from 0.73 to 0.86, with the lowest reliability occurring in kindergarten (Tourangeau et al., 2019). In models comparing with mathematics and reading, we used similar standardized assessments from the ECLS in those subjects.
We leveraged theta scores provided in the ECLS, which were estimates of students’ ability in the given domain based on their performance on the items they were administered (Tourangeau et al., 2018). A theta score was developed for every domain and assessment in which the domain was used, reported on a range from −8 to 8, with the lower score being an indication of lower ability and the higher scores reflecting higher ability (Najarian et al., 2018). Consistent with prior literature using the ECLS for longitudinal analysis (Morgan et al., 2016), we standardized (mean of 0, SD of 1) the science theta scores across all years to create a scale score that could be interpreted in SD units. Consequently, scores in the earliest grades were by design lower, on average, than scores in the higher grades, reflecting the upward academic progression of students throughout elementary school.
Contextual Variables
In addition to our primary independent and dependent variables, we also included a number of contextual variables that we used to provide a descriptive picture of ML subgroups as well as to explore the explanatory power of contextual variables for differences in elementary science trajectories across groups. The inclusion of these contextual variables reflects our theoretical framework, which points to the importance of the ecological systems students experience (Bronfenbrenner, 1979) and to ways that context shapes how students access resources within their linguistic repertoires. At the student level, we included measures of race/ethnicity and sex as well as reading test score performance. At the family level, we included a composite measure of socioeconomic status (created from indicators of income, education level, and occupational prestige). At the school level, we included measures of school size, urbanicity, racial and socioeconomic demographic composition, and proportion of MLs served with EL services. Although the ECLS consistently asked questions about almost all covariates across years, in the few cases where a question was not included in a particular grade level, we imputed values from the prior or following years. Specifically, parental education was not included in the second grade survey, so we used first grade parental education. Similarly, school racial composition in the third grade was asked only for students who were in new schools, so we used school racial composition from the prior year for those remaining in the same school.
Analytic Approach
We approached our analysis using descriptive statistics, conditional means, and regression to document science test score trajectories of MLs. To address our first research question (how do science test score trajectories vary across and within ML student groups in elementary school?), we present figures of science test score trajectories overall and by ML subgroup as well as conditional means for select grade levels. In particular, we show results separately for (a) MLs whose primary home language in kindergarten was English and those whose primary home language was not English, (b) MLs who received EL services at school in kindergarten and those who did not, and (c) MLs who were Spanish speakers and MLs who spoke less common languages.
To address our second research question (to what extent are differences in science test score trajectories explainable by student, family, and school contextual variables?), we estimated a regression model predicting science test score performance for each of the subgroups of interest with an interaction term for time, thereby modeling both differences in average test performance and also differences in their science performance trajectory over time. We chose a standard ordinary-least-squares regression model as opposed to other multilevel growth model options for simplicity of interpretation of our results. We built up specifications for these models from an unconditional model to one that included controls for student, family, and school context. Our model took the following general form:

where ScienceAch is the standardized science test score performance of student i at a particular grade level j (standardized across the K–5 grade range), ML is a binary indicator of ML status (with varied operationalizations as discussed previously), Grade is a grade level indicator, and ML × Grade is an interaction term allowing the relationship between ML status and science achievement to vary over time. StudentCharacteristics, FamilyCharacteristics, and SchoolCharacteristics represent vectors of student, family, and school variables as described earlier. Our primary interest was in β1 and β3, which represent the relationship between ML and science achievement, both differences in the intercept and slope over time.
Finally, to assess our third research question (how do the science test score trajectories for ML subgroups in science differ from those in reading and mathematics?), we modeled test score trajectories in science, mathematics, and reading from kindergarten through fifth grade for each of the ML subgroups. Although the assessments across subject areas are not directly comparable, we present these graphically showing the standardized difference between each subgroup and a comparison group (e.g., those receiving EL services at school compared with those not receiving them) for each subject area.
Sample Characteristics
We note that multiple factors relating to ML status have been shown to shape students’ academic trajectories, including MLs’ level of proficiency in English (Ardasheva et al., 2012), immigration histories (Suarez-Orozco et al., 2015), and home-language literacy (MacSwan et al., 2017). Although the full range of these factors is not included within the ECLS dataset, we provide Table 1 to demonstrate some of the heterogeneity within the ML population and its relation to science achievement. Students who lived in households where a language other than English was spoken differed in several observable ways from students from households where only English was spoken. As shown in Table 1, kindergarten students from households that spoke a language other than English were about eight times as likely to identify as Hispanic or Asian than students in English-only households. Reflecting a sociopolitical history of discrimination in workforce and educational institutions (Jiménez-Castellanos & García, 2017; Lippi-Green, 2012), these students’ parents were less educated and had lower incomes, on average, than parents of students in English-only households. Consistent with documented de facto segregation of schooling and stratification of resources (Gándara, 2010), students from households where a non-English language was spoken attended kindergartens that were more likely to be in urban settings serving greater proportions of students eligible for free or reduced-price lunch, larger overall enrollments, and greater proportions of Hispanic students. Their English reading test score performance also was lower, on average.
Although different in observable ways from their peers from English-only households, those from households where a non-English language was spoken were hardly a monolith. Our results demonstrated the wide variability in subgroups of MLs. As shown in Table 1, baseline performance on the English reading assessment varied significantly across ML subgroups. We found that among students who came from households where a non-English language was spoken, those for whom the non-English language was primary in the household were more ethnically diverse (~81% Hispanic) and had parents who were less educated and had lower incomes than those for whom English was the primary language in the household. Similarly, students who, in kindergarten, received EL services at school as well as those whose non-English household language was Spanish came from households with parents who had lower education and income and attended schools that had higher concentrations of Hispanic students and students eligible for free or reduced-price lunch compared with their peers who did not receive EL services or came from households where the non-English language was not Spanish. Although not shown in Table 1, we note that these descriptive differences tended to persist through fifth grade.
Results
In this section we present results that demonstrate the elementary school science test score trajectories of MLs; the ways in which these trajectories vary across subgroups of MLs; the extent to which observable characteristics of students, families, and schools explain these trajectories; and how these trajectories compare with those in reading and mathematics. In interpreting the results, we purposefully adopt an assets-oriented interpretation of findings, highlighting the strengths of particular subgroups of MLs and emphasizing the structural factors that may contribute to differences in test score trajectories of MLs.
To preview our findings, the results suggest that although students who speak a non-English language at home (MLs) begin elementary school with lower average science test scores than students in families where only English is spoken, there is a rapid acceleration of their science test performance relative to English-only speakers, particularly through the first half of elementary school. Interestingly, students whose non-English language is a language other than Spanish accelerate in science learning such that by third grade their science test score performance is above that of students whose households only use English. The inclusion of student, family, and school covariates in models explains substantial portions of the differences in average performance across ML subgroups. However, with some exceptions for English reading test performance, these covariates explain little of the differences in the relative trajectories of groups over the elementary school years. We show how these findings in science compare with those in reading and mathematics, pointing to similarities and differences across subject areas.
Science Test Score Trajectories
The elementary school science test score trajectories of ML subgroups reflected the heterogeneity in characteristics of the various groups. Table 2 presents the average science test score by ML subgroup. As noted earlier, the science test scores, which came from assessments administered in English, were standardized across grade levels such that averages can be interpreted in SD units relative to the average performance of all students across the K–5 span of the data. In kindergarten, students from households where only English was spoken scored, on average, 0.59 SD higher than households where a non-English language was spoken.
Science achievement test scores and standard errors standardized across years by grade level and multilingual learner subgroup

Note. Groups are conditional on being an ML except for our non-ML indicator, “English only” group. ML = multilingual learner; EL = English learner
Interestingly, however, a similar difference was observed within subgroups of MLs (students who spoke a non-English language at home). In particular, in kindergarten, students from households where a non-English language was spoken but in which English was the primary language score about 0.5 SD higher than those for whom the non-English language was primary. Students whose non-English home language was Spanish scored about 0.4 SD lower than those whose non-English language was a language other than Spanish. The largest difference between ML subgroups in kindergarten (0.72 SD) were between those who received EL services at school and those who did not receive EL services, likely reflecting the fact that students who receive EL services are selectively identified based on lower levels of English proficiency (a similar test score difference between these groups was seen in baseline reading test performance). Collectively, these differences between subgroups of MLs at the start of kindergarten demonstrate that there is as much or more variation in science test performance within MLs as there is between MLs and students who come from households where only English is spoken.
Although the differences in science test scores between MLs and non-MLs and across ML subgroups are substantial at the beginning of elementary school, we document significant and meaningful convergence of trajectories as students progress through elementary school. Figure 1 shows the trajectories of science achievement scores (standardized across grade levels) for each ML group from kindergarten through fifth grade. As shown in the figure, by third grade, there is a significant narrowing of the trajectories. In particular, the difference between students from English-only and non-English households decreased from 0.59 SD in kindergarten to 0.17 SD by fifth grade. Within students who come from households where a non-English language is spoken, the difference in average science test scores between those who use English as a primary language and those for whom a non-English language is the primary household language decreased from 0.5 SD to 0.17 SD. Students receiving EL services in kindergarten also made significant gains relative to their peers from households where a non-English language was spoken but who did not receive EL services, decreasing the difference from 0.72 SD in kindergarten to 0.34 SD by fifth grade.
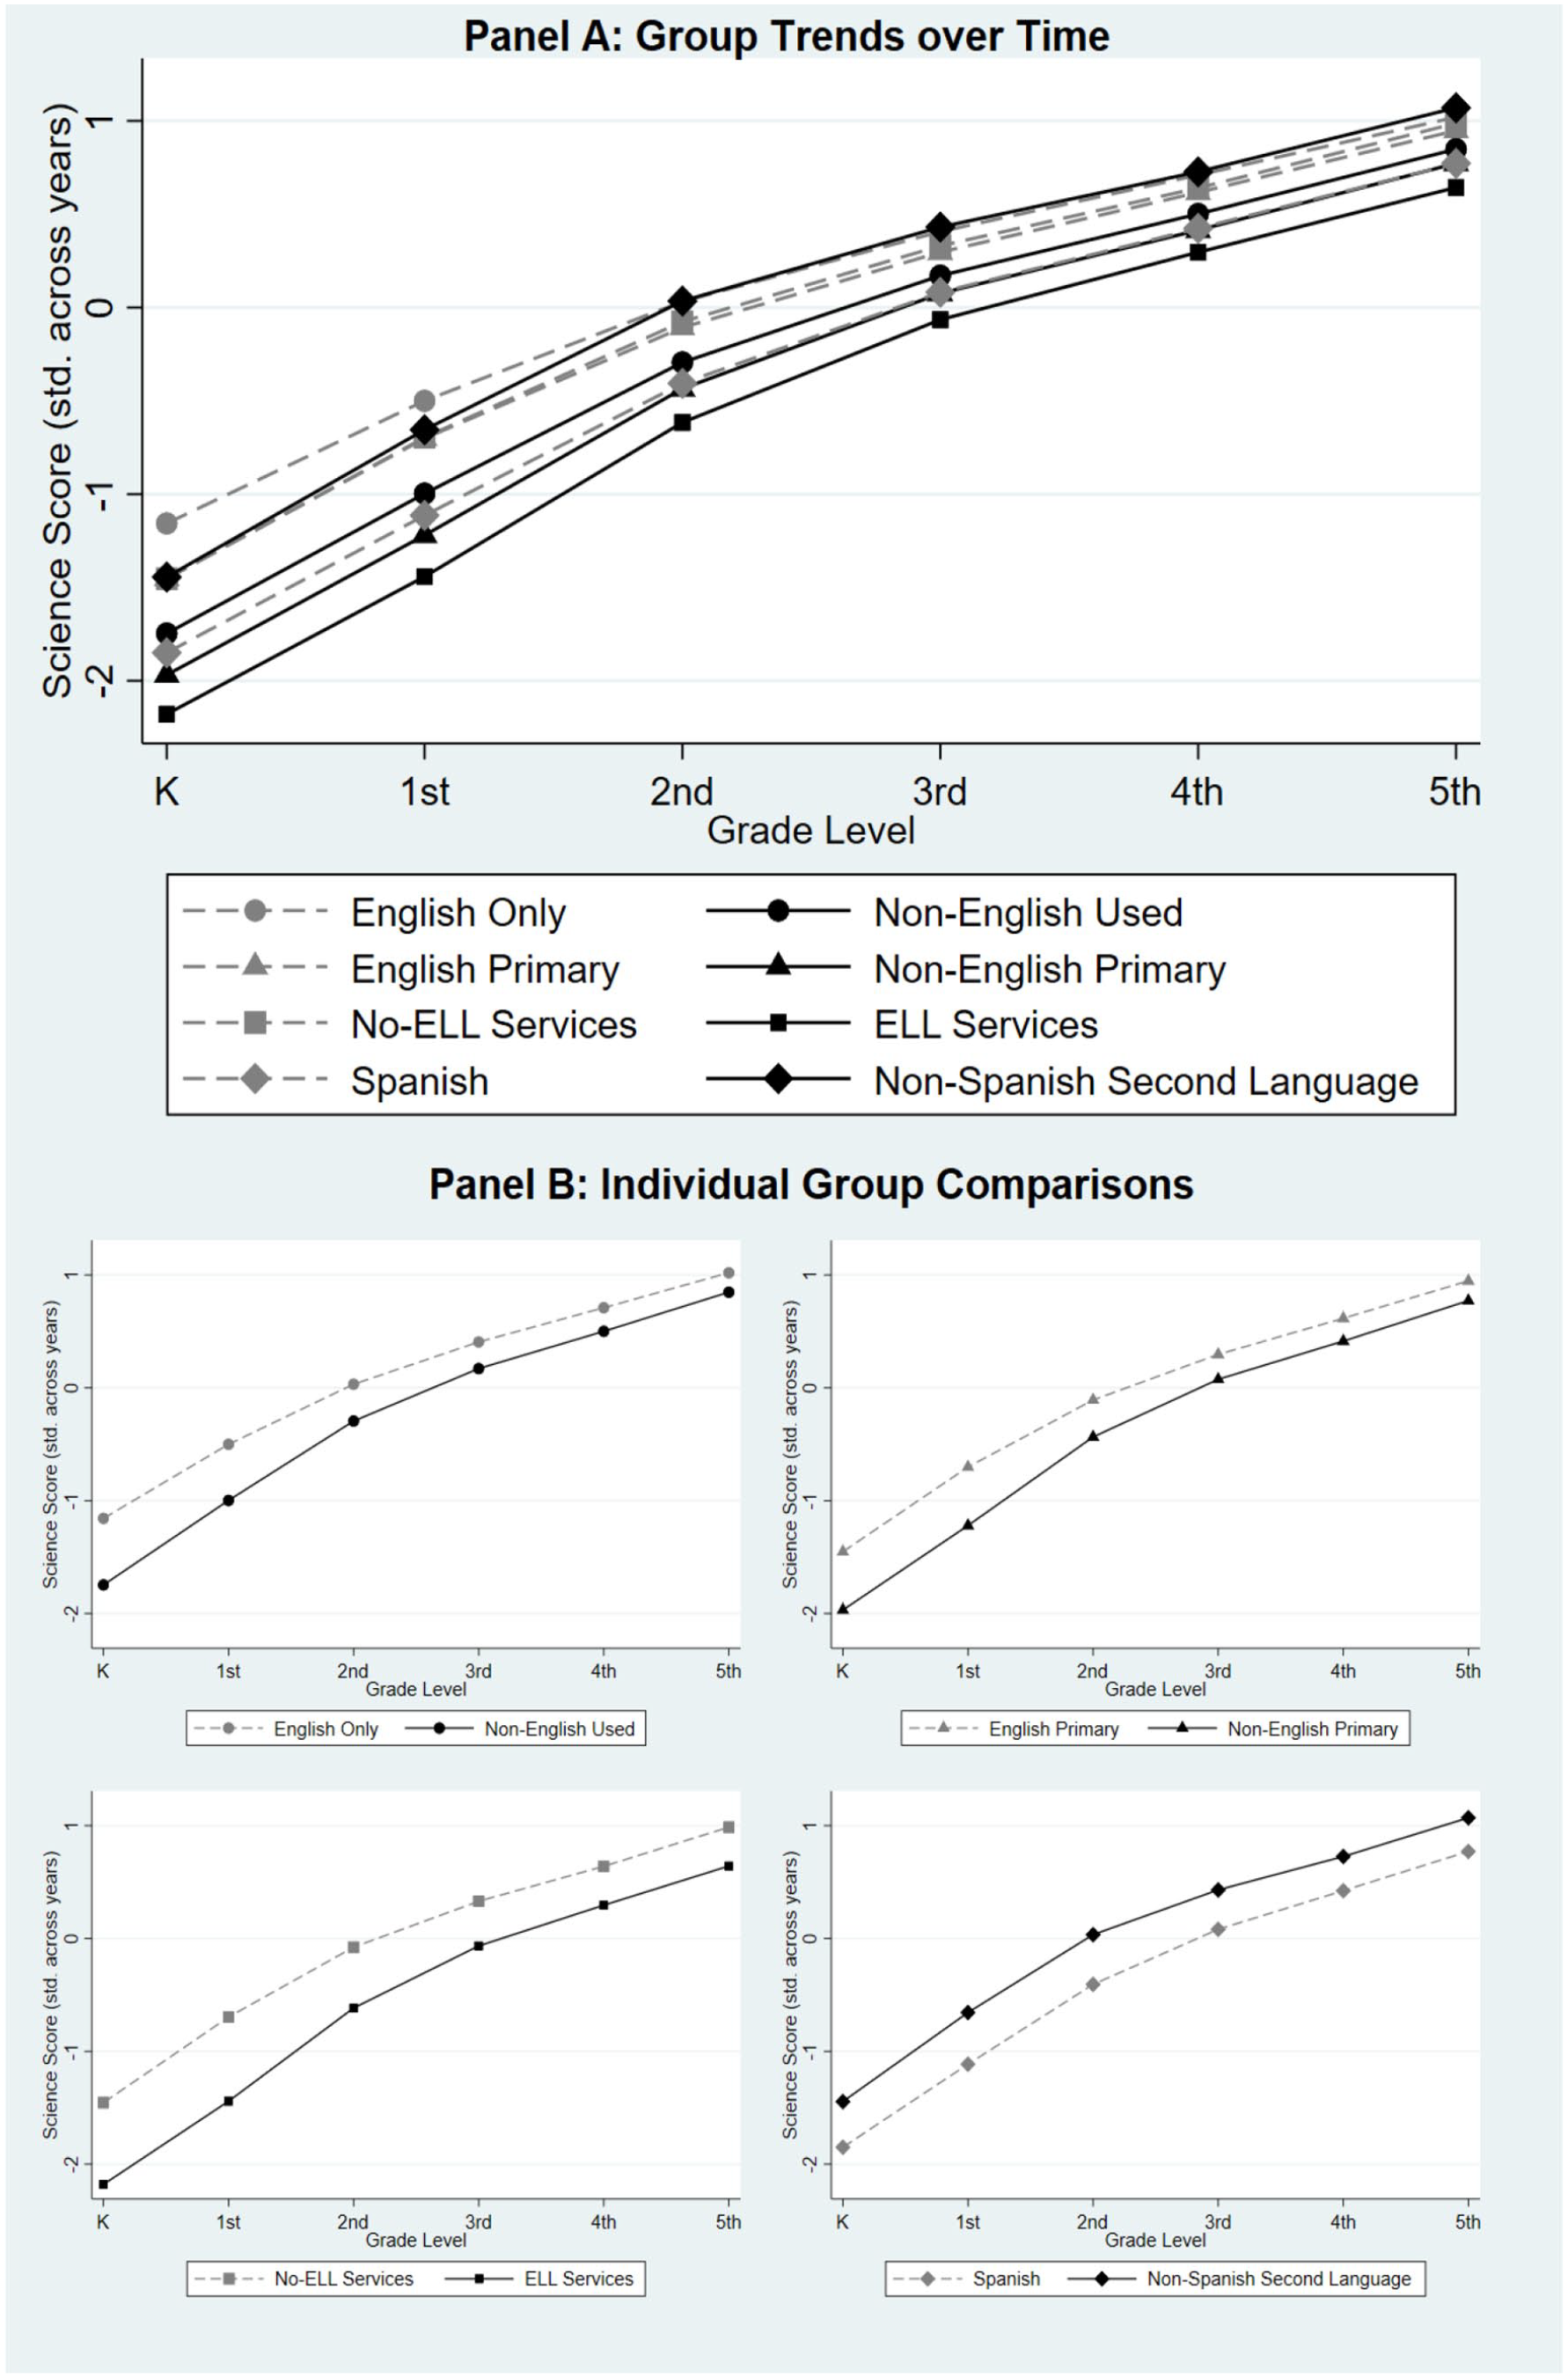
Science test score trajectories by multilingual learner subgroup.
Figure 2 demonstrates these gains broken out for students who were reclassified out of EL services (dark triangles) and those who received EL services in a given year (gray triangles) compared with ML students who received EL services in kindergarten (dark circle) and ML students who did not (gray circle). By fifth grade, ~57% (n = 552) of students receiving EL services in kindergarten had been reclassified and were no longer receiving services. As expected, those who moved out of formal EL services had higher science trajectories than those who remained, nearing, although not quite reaching, the test performance of those who were not receiving EL services in kindergarten. This likely reflects the higher language and academic performance that led to them to be exited out of formal EL services. Additionally, it also could reflect the possibility that reclassified ELs were able to receive more direct science instruction in cases where they were previously pulled out of science instruction for EL services.

Science test score trajectories for students by English learner services status across elementary school grades.
As shown in Table 2, the only ML subgroups where we did not observe as significant a convergence between science test scores were between Spanish speakers and non-Spanish speakers. In kindergarten, MLs who spoke a non-Spanish language in the household scored ~0.4 SD higher than those speaking Spanish. By fifth grade, this difference was 0.29 SD. Interestingly, however, MLs who spoke a non-Spanish language demonstrated the highest science test scores, on average, of any group analyzed by fifth grade. Most notably, while this group performed lower than their English-only peers in kindergarten, by second grade they had closed the gap with their English-only peers (see Figure 1). This finding, and the generally positive trajectories of all ML groups across elementary school, may reflect the positive benefits of multiple languages for early science learning as well as the benefits from learning English on performance on science assessments administered in English. In particular, although MLs as a whole and specific subgroups therein tended to start elementary school with lower science achievement, their trajectories showed more growth across elementary school than their English only peers. To understand the factors that may explain or be related to these trajectories, we turn next to the results of our regression analyses.
Explanatory Factors of Science Test Score Trajectories
The descriptive findings demonstrate differences in the elementary school science trajectories of MLs. Our regression analysis explored the extent to which these trajectories could be explained by observable student, family, and school characteristics (those listed in Table 1). We find that observable covariates in the ECLS explain significant proportions of the differences in levels of performance between ML and non-MLs as well as between ML subgroups; however, with the exception of reading achievement in some cases, they explain little of the difference in relative trajectories between groups.
Table 3 shows results from regression models predicting ML science test performance from indicators of a non-English language being used in the home (panel A) and, among those students, from indicators of the non-English language being the primary home language in kindergarten, receiving EL services at school in kindergarten, and the non-English language being Spanish (panels B–D). Each model includes an indicator of the ML group, a grade-level indicator, and the interaction term between the grade level and ML group. The models build from that with no controls to a fully specified model with individual, family, and school covariates. We include concurrent reading test score performance as a control in a separate model to directly examine how accounting for growth in English ability shapes science test trajectories. Consistent with the descriptive findings, in the uncontrolled model, all ML groups performed lower in science than their respective comparison groups. The inclusion of individual, family, and school covariates significantly reduced this difference, decreasing the coefficient on ML indicators by around 28% to 48% for non-English used in the home, non-English as the primary language in the home, and receiving EL services in kindergarten. Interestingly, observable covariates explained almost the entire difference between Spanish speakers and students who had a different non-English language used in the home.
Coefficients and standard errors from regression models predicting standardized science achievement from multilingual learner indicators

Note. Standard errors in parentheses.
p < 0.05; **p < 0.01; ***p < 0.001.
Across ML groups, the covariates did little to shift the coefficients on the interaction terms, suggesting that the differences in relative gains by MLs and subgroups therein were not explained by the observable covariates. The one exception to this was the inclusion of the reading test score performance, which accounted for about half the magnitude of the interaction term for students for whom a non-English language was primary in the home or those who were receiving EL services in schools in kindergarten. For the comparison of MLs who spoke Spanish compared with non-Spanish languages, accounting for reading test scores rendered the interaction term insignificant.
Comparison of Science Trajectories with Reading and Mathematics Scores
Finally, we examined the extent to which relative trajectories in elementary school science test score performance compared with those in reading and mathematics. To do so, we calculated the difference in SD units between each of our four primary ML groups of interest (i.e., non-English language used in the home, non-English is the primary language used in the home, receives EL services at school in kindergarten, and speaks Spanish) and their respective comparison groups (i.e., English only used in the home, English as primary in home but other language spoken, non-English language used in the home but not receiving EL services, and non-English language used in the home is a language other than Spanish).
Figure 3 shows results of these comparisons. In each of the graphs, the ML subgroup of interest is compared with the comparison group indicated in the heading. Across subject areas (science, math, and reading), the comparison group is indicated by the zero line on the y-axis such that the plotted points represent the relative performance of the group of interest compared with the comparison group for each subject area. Consequently, the plotted graphs represent the extent to which subgroups of MLs differ from the comparison groups across subject areas.

Comparison of test score differences in science with those in mathematics and reading by multilingual learner subgroup.
As shown in the figure, the findings indicate a substantial difference in test performance between MLs and non-MLs in science relative to mathematics and reading in kindergarten, which closed across the elementary school years. In particular, students in kindergarten who come from households where a non-English language was used were ~0.59 SD behind in science than those in households where only English was spoken. In mathematics and reading, however, this difference was less than half the size, indicating a much larger test performance gap in science than in other subject areas. MLs, however, demonstrated rapid gains relative to their non-ML peers in science that were not seen in other subject areas such that, by fifth grade, the differences between MLs and non-MLs were similar across science, mathematics, and reading. When looking within MLs, the difference across subject areas appeared most prominent for comparisons of those for whom English was not the primary language in the household and those for whom it was and between those receiving and not receiving EL services at school in kindergarten. Difference across subject areas were the smallest between Spanish- and non-Spanish-speaking MLs.
Sensitivity Checks
We ran several sensitivity checks to examine the robustness of our results to alternative specifications. First, we reran our primary results without the inclusion of sampling weights. Although weighting was preferred and recommended to address the complex sampling design of the ECLS as well as to address attrition from the sample over time (Tourangeau et al., 2019), the use of longitudinal sampling weights did reduce the sample size. In Appendix A we show results in which we use the full set of observations. The results were substantively similar to our primary results.
In our second sensitivity check, we reran results using outcomes that were standardized within grade level rather than across elementary school. In other words, a SD change in the science test score in these models represented a SD difference between groups in the distribution of scores within the given grade rather than an SD difference between groups in a particular grade level in the distribution of scores across elementary school. Appendix B shows results of this sensitivity analysis. As expected, the size of differences varied from the primary results, reflecting a different underlying distribution and interpretation of the differences, but the directionality of differences and substantive interpretations remained consistent with our primary results. The one exception here was with the inclusion of the reading test score covariate, which no longer explained away significant portions of the interaction terms.
Finally, we also examined results using a kindergarten teacher-reported measure of the teacher’s perception of whether English was not a child’s native language. This group was descriptively very similar to those identified by parents as English not being the primary language at home, and results of the regression models were similar to those for non-English being the primary language at home.
Discussion
With public schools welcoming growing numbers of multilingual students, increased attention is being paid to finding appropriate means to ensure their success (NASEM, 2018). Although much attention has been given to the needs of MLs relative to native English speakers, our results complement other recent work showing the importance of focusing on specific groups within the diverse ML population (Kieffer & Thompson, 2018). For example, although our findings show differences in science test performance between MLs and non-MLs, they also indicate similar levels of variability between kindergarten students from multilingual homes where English is the primary language and students who use a language other than English as their primary language at home. Similarly, MLs who received formal EL services differed significantly in kindergarten achievement from their ML classmates who did not receive EL services. These findings reflect the challenges that MLs face when building understanding of new content and language simultaneously and affirm prior research that demonstrates the importance of English language and literacy development as part of science instruction (Lee et al., 2007).
In addition to a need to focus on subgroups within the ML population, our findings demonstrate that this focus cannot merely mirror the interventions and policies designed to address differences in language ability. Our finding that differences between MLs and non-MLs in science were measurably greater than differences between groups in mathematics and reading aligns with prior work that has shown differences in early science test performance to not simply mirror differences in reading and mathematics (Curran & Kellogg, 2016; Curran & Kitchin, 2019). In particular, in kindergarten, students who come from households where a non-English language was used were about 0.59 SD behind in science than those from households where only English was spoken. In mathematics and reading, however, this difference was less than half the size, indicating a much larger test performance gap in science than in other subject areas. When looking within MLs, the difference across subject areas appeared most prominent for comparisons of those for whom English was not the primary language in the household and between those receiving and not receiving EL services at school. Difference across subject areas were the smallest between Spanish- and non-Spanish-speaking MLs.
This difference across subjects may reflect the relatively little attention paid to science instruction in elementary classrooms (Bassok et al., 2016), which could include important opportunities to develop MLs’ language proficiencies in relation to specific science content (Grapin & Lee, 2022). For MLs who spend most of their day with a single teacher or with a push-in language specialist, there are few opportunities in the day to develop the language of science when compared with attention to literacy and mathematics. For students in pull-out language models, this instructional time often comes outside of reading and mathematics instruction (López & Iribarren, 2014), possibly taking away from science or social studies instructional time. This finding points to the need for future research to examine relationships between EL services, reclassification, and other inputs and differences in ML learning trajectories by subject. For MLs not receiving EL services at school, they may be missing language supports that would facilitate their access to science learning.
Although our findings demonstrated differences in test performance between MLs and non-MLs as well as within ML subgroups, our findings, encouragingly, also showed positive science test score trajectories for all ML subgroups over time. MLs showed greater growth than their non-ML peers over the course of elementary school, and by the fifth grade, differences across these two groups decreased significantly. In particular, MLs who spoke a non-Spanish second language were performing on par with their English-only peers in science by fifth grade. Although the non-Spanish-speaking ML group was more advantaged in terms of parental income and education, these variables did not fully explain the changes in growth over time. Our estimates suggest that some part of this closing of test gaps may be attributable to increases in the English reading ability of MLs. That said, these rapid gains in science test performance were larger than in reading and mathematics such that, by fifth grade, the differences between MLs and non-MLs were similar across science, mathematics, and reading.
Our theoretical framework suggests that such positive science learning outcomes of MLs are likely a function of the interplay between their individual characteristics, including linguistic resources, and their contextual environment, including both school and nonschool environments (Bronfenbrenner, 1979; Canagarajah, 2013; García et al., 2008). Yet, although our student, family, and school contextual variables explained significant portions of the differences in ML subgroup performance at baseline, they did little to explain differences in trajectories across elementary school. In some models, the inclusion of an English reading test score accounted for a portion of the changes in test score differences over time, but this finding was not consistent in all our robustness checks. This foundation thus points to the need to further explore school and classroom inputs alongside students’ unique forms of capital to understand their relationship to science learning trajectories for MLs. For students receiving EL services, this could include examining program models of instruction (e.g., sheltered instruction vs transitional bilingual education) that may shape the extent to which MLs can use the full range of their linguistic repertoires within instruction (see Suárez [2020] for a recent example). For other MLs, this may mean exploring the nonformal language supports provided by general education teachers as well as their home and neighborhood contexts. For example, a growing body of research explores how teachers’ “translanguaging” practices, instructional practices that allow ELs to leverage their linguistic resources across multiple languages, may hold promise for enhancing outcomes (Pierson et al., 2021; Poza, 2018; Suárez, 2020), whereas other research demonstrates the importance of linguistic composition of neighborhoods for achievement in reading and mathematics (Drake, 2014).
Limitations
Although our study is among the first to leverage nationally representative data to explore the science learning trajectories of MLs across elementary school, it has several limitations. The use of secondary data limited operationalization of key variables to survey items included in the ECLS-K survey and may be susceptible to response bias or error (Coughlan et al., 2009). Although our study was able to explore multiple subgroups of MLs, we recognize that individuals differentially identify into these groups, are differentially perceived to be in these groups by others, and may identify in different ways over time. Additionally, given that the ECLS only administered science assessments in the earliest grades to students who passed the minimum English proficiency screener, our consistent sample over the elementary grades does not include a small handful of the students with the lowest English proficiency in kindergarten.
As noted earlier, the ECLS-K:2011 was conducted during the scaling up of the NGSS. As such, the science instructional environment and types of assessments reflected in our dataset may not perfectly represent those in use today. Another issue related to the science assessment centers around cultural bias. Prior work has raised concerns about cultural bias in elementary science assessments including the NAEP (Solano-Flores & Nelson-Barber, 2001). It is possible that the ECLS assessments similarly may be subject to such an issue.
We also note that the policy and social context have changed since the time of the ECLS-K:2011 data collection. Specifically, the 2015 Every Student Succeeds Act required each state to create a uniform system for identifying EL students and enforced stricter reporting of EL students for accountability purposes. At the same time, there have been changes in recent years in patterns of immigration, including overall rates as well as countries and languages represented (Budiman, 2020; Ward & Batalova, 2023). For example, the number of students who speak Arabic or Chinese has increased significantly in the past decade (NYU, 2018). Although it is difficult to predict how these policy and contextual changes may shape elementary ML science test trajectories, these shifts suggest the importance of future work continuing to examine these questions as new data become available.
Finally, it is also important to note that our research questions were descriptive in nature and did not aim to make causal inferences of the effectiveness of particular inputs, such as EL services. Future work may probe the school inputs further that explain differential science growth among subgroups of MLs.
Conclusion
Students from households that speak a language other than English represent a diverse and growing group of public school students (American Academy of Arts & Sciences, 2016; NCES, 2021). Supporting the science learning of this group is important not just for economic competitiveness but also for increasing representation and equity in the science fields and providing diverse role models for future generations of linguistically diverse students (Adair et al., 2012; Anderson & Cavallaro, 2002; Gershenson et al., 2021). This study provides one of the most comprehensive examinations of early elementary science learning among multilingual learners and, in doing so, provides a foundation for understanding and bettering their science learning trajectories.
Footnotes
Appendix A: Results Without Survey Weights (Maximizing Sample Size)
Coefficients and standard errors from regression models predicting standardized science achievement from multilingual learner indicators without survey weights

| Factor | No controls | Individual covariates | Family covariates | School covariates | Reading test score | All covariates |
|---|---|---|---|---|---|---|
| Panel A | ||||||
| Non-English used at home in kindergarten | −0.575***
(0.0120) |
−0.420***
(0.0130) |
−0.373***
(0.0115) |
−0.422***
(0.0125) |
−0.427***
(0.0094) |
−0.255***
(0.0104) |
| Grade level | 0.426***
(0.0020) |
0.426***
(0.0019) |
0.421***
(0.0019) |
0.425***
(0.0019) |
0.157***
(0.0022) |
0.186***
(0.0022) |
| Interaction | 0.0845***
(0.0040) |
0.0845***
(0.0038) |
0.0840***
(0.0037) |
0.0855***
(0.0038) |
0.0692***
(0.0031) |
0.0707***
(0.0029) |
| Observations | 45,150 | 45,150 | 45,150 | 45,150 | 45,150 | 45,150 |
| Panel B | ||||||
| Non-English primary at home in kindergarten | −0.542***
(0.0230) |
−0.480***
(0.0224) |
−0.339***
(0.0221) |
−0.445***
(0.0223) |
−0.332***
(0.0179) |
−0.237***
(0.0180) |
| Grade level | 0.465***
(0.0058) |
0.465***
(0.0056) |
0.461***
(0.0054) |
0.468***
(0.0056) |
0.185***
(0.0055) |
0.210***
(0.0054) |
| Interaction | 0.0781***
(0.0076) |
0.0781***
(0.0073) |
0.0780***
(0.0071) |
0.0758***
(0.0073) |
0.0500***
(0.0059) |
0.0522***
(0.0057) |
| Observations | 11,664 | 11,664 | 11,664 | 11,664 | 11,664 | 11,664 |
| Panel C | ||||||
| English learner services in kindergarten | −0.689***
(0.0223) |
−0.611***
(0.0220) |
−0.492***
(0.0217) |
−0.577***
(0.0224) |
−0.383***
(0.0180) |
−0.297***
(0.0181) |
| Grade level | 0.479***
(0.0047) |
0.479***
(0.0046) |
0.475***
(0.0045) |
0.481***
(0.0046) |
0.210***
(0.0049) |
0.228***
(0.0049) |
| Interaction | 0.0771***
(0.0074) |
0.0771***
(0.0072) |
0.0773***
(0.0070) |
0.0743***
(0.0072) |
0.0406***
(0.0058) |
0.0435***
(0.0057) |
| Observations | 11,664 | 11,664 | 11,664 | 11,664 | 11,664 | 11,664 |
| Panel D | ||||||
| Spanish used at home in kindergarten | −0.413***
(0.0246) |
−0.000259 (0.0375) |
−0.128***
(0.0241) |
−0.213***
(0.0266) |
−0.0992**
(0.0196) |
0.137***
(0.0289) |
| Grade level | 0.503***
(0.0068) |
0.503***
(0.0067) |
0.500***
(0.0063) |
0.506***
(0.0066) |
0.226***
(0.0062) |
0.248***
(0.0061) |
| Interaction | 0.0102 (0.0081) |
0.0102 (0.0080) |
0.00865 (0.0076) |
0.00639 (0.0079) |
−0.0198**
(0.0064) |
−0.0177**
(0.0061) |
| Observations | 11,664 | 11,664 | 11,664 | 11,664 | 11,664 | 11,664 |
Note. Standard errors in parentheses.
p < 0.05; **p < 0.01; ***p < 0.001.
Appendix B: Test Scores Standardized within Year
Coefficients and standard errors from regression models predicting standardized science achievement within year from multilingual learner indicators

| Factor | No controls | Individual covariates | Family covariates | School covariates | Reading Test Score | All Covariates |
|---|---|---|---|---|---|---|
| Panel A | ||||||
| Non-English used at home in kindergarten | −0.786***
(0.0714) |
−0.521***
(0.0661) |
−0.540***
(0.0568) |
−0.600***
(0.0507) |
−0.622***
(0.0559) |
−0.394***
(0.0496) |
| Grade level | −0.0327***
(0.0044) |
−0.0327***
(0.0044) |
−0.0414***
(0.0045) |
−0.0356***
(0.0046) |
−0.0260***
(0.0048) |
−0.0300***
(0.0048) |
| Interaction | 0.111***
(0.0082) |
0.111***
(0.0082) |
0.113***
(0.0083) |
0.112***
(0.0087) |
0.114***
(0.0109) |
0.113***
(0.0105) |
| Observations | 28,968 | 28,968 | 28,968 | 28,968 | 28,968 | 28,968 |
| Panel B | ||||||
| Non-English primary at home in kindergarten | −0.739***
(0.0963) |
−0.608***
(0.1022) |
−0.442***
(0.1079) |
−0.563***
(0.1051) |
−0.487***
(0.0687) |
−0.351***
(0.0709) |
| Grade level | 0.0219*
(0.0095) |
0.0219*
(0.0095) |
0.0160 (0.0104) |
0.0227*
(0.0098) |
0.0339**
(0.0117) |
0.0311**
(0.0111) |
| Interaction | 0.0994***
(0.0168) |
0.0994***
(0.0168) |
0.0989***
(0.0179) |
0.0969***
(0.0171) |
0.0947***
(0.0139) |
0.0932***
(0.0141) |
| Observations | 6,102 | 6,102 | 6,102 | 6,102 | 6,102 | 6,102 |
| Panel C | ||||||
| English learner services in kindergarten | −1.052***
(0.0928) |
−0.941***
(0.0945) |
−0.785***
(0.0952) |
−0.898***
(0.0992) |
−0.584***
(0.0748) |
−0.479***
(0.0781) |
| Grade level | 0.0345***
(0.0077) |
0.0345***
(0.0077) |
0.0302***
(0.0079) |
0.0343***
(0.0083) |
0.0507***
(0.0073) |
0.0476***
(0.0071) |
| Interaction | 0.109***
(0.0163) |
0.109***
(0.0163) |
0.107***
(0.0163) |
0.106***
(0.0176) |
0.0910***
(0.0155) |
0.0898***
(0.0160) |
| Observations | 6,102 | 6,102 | 6,102 | 6,102 | 6,102 | 6,102 |
| Panel D | ||||||
| Spanish used at home in kindergarten | −0.636***
(0.1053) |
−0.113 (0.1632) |
−0.206 (0.1067) |
−0.326**
(0.1029) |
−0.295**
(0.0878) |
−0.0140 (0.0876) |
| Grade level | 0.0606***
(0.0146) |
0.0606***
(0.0146) |
0.0579***
(0.0162) |
0.0617***
(0.0138) |
0.0532***
(0.0142) |
0.0527***
(0.0141) |
| Interaction | 0.0241 (0.0165) |
0.0241 (0.0165) |
0.0191 (0.0182) |
0.0204 (0.0164) |
0.0466**
(0.0169) |
0.0419*
(0.0169) |
| Observations | 6,102 | 6,102 | 6,102 | 6,102 | 6,102 | 6,102 |
Note. Standard errors in parentheses.
p < 0.05; **p < 0.01; ***p < 0.001.
Acknowledgements
The authors appreciate the helpful feedback of Timothy Drake, Enrique “Henry” Suarez, Griff Jones, and Jessaca Spybrook on earlier versions of this manuscript.
Funding
This material is based on work supported by the National Science Foundation under Grant No. 2100419. Any opinions, findings, and conclusions or recommendations expressed in this material are those of the author(s) and do not necessarily reflect the views of the National Science Foundation.
Open Practices Statement
Authors
F. CHRIS CURRAN is an Irving and Rose Fien Endowed Professor in Education, associate professor of educational leadership and policy, and director of the Education Policy Research Center at the University of Florida. His research focuses on school safety, discipline, and early childhood education.
MARK B. PACHECO is an assistant professor of ESOL/bilingual education in the School of Teaching and Learning at the University of Florida. His research focuses on multilingual students’ language and literacy practices and how teachers can support these practices across content areas. He is a former high school English as a second language and English teacher.
LELYDEYVIS BOZA is a doctoral candidate in educational leadership and policy at the University of Florida. Her research focuses on the inequities faced by Latino/a students in K–12 and the role activism can play in their self-advocacy.
AMBER DEIG is an assistant professor of curriculum and instruction at the University of Southern Mississippi. Her research explores multilingual learners in K–12 content areas.
KATHARINE HARRIS-WALLS is a doctoral candidate and graduate research assistant in educational leadership and policy at the University of Florida. Her research focuses on issues of equity in education, including test score disparities in math and science and opportunity hoarding.
TIFFANY TAN is a doctoral candidate and graduate research assistant in educational leadership and policy at the University of Florida. Her research focuses on the experiences of preservice and in-service teachers of color, specifically in the areas of retention and recruitment.