
Abstract
The Math Curriculum Impact Study was a large-scale randomized controlled trial (RCT) to test the efficacy of a digital core curriculum for Grade 5 mathematics. Reasoning Mind’s Grade 5 Common Core Curriculum was a comprehensive, adaptive, blended learning approach that schools in the treatment group implemented for an entire school year. Schools in the control group implemented their business-as-usual mathematics curriculum. The study was completed in 46 schools throughout West Virginia, resulting in achievement data from 1,919 students. It also included exploratory investigations of teacher practice and student engagement. The main experimental finding was a null result; achievement was similar in both experimental groups. The exploratory investigations help clarify interpretation of this result. As educational leaders throughout the United States adopt digital mathematics curricula and adaptive, blended approaches, our findings provide a relevant caution. However, our findings are not generalizable to all digital offerings, and there is a continuing need for refined theory, study of implementation, and rigorous experimentation to advise schools.
Keywords
Educational leaders recognize a need to improve students’ mathematics achievement (English, 2015; Gonzales & Kuenzi, 2012). As the President’s Council of Advisors on Science and Technology (2010) stated, “STEM education will determine whether the United States will remain a leader among nations” (p. vii). Mathematics is well understood to be the fundamental building block for improving STEM education (Augustine, 2005; English, 2015). Late elementary school is a particularly important point of intervention because the building blocks for algebra, such as fractions and mathematical expressions, are emphasized in the curriculum (Common Core State Standards Initiative, 2010); in late elementary school, a transition from basic arithmetic toward algebra should be underway (Knuth, Stephens, Blanton, & Gardiner, 2016). When students fall behind in late elementary school, success in further mathematics learning becomes less likely (Siegler et al., 2012). Leaders in education are looking to new digital curricula for improvements in student learning, and efficacy research is needed to determine what works.
Purpose
The Math Curriculum Impact Study (MCIS) evaluated the efficacy of a digital core curriculum resource for improving achievement in Grade 5 mathematics. Given challenges of improving mathematics achievement for struggling students, the study also looked for differential treatment effects based on prior achievement in Grade 4. The curriculum was developed by the nonprofit company Reasoning Mind. It implemented theoretically noteworthy “blended” and “adaptive” learning capabilities, which are discussed in the following section. The curriculum itself is described in more detail in the Research Design and Methods section. A secondary purpose of MCIS was to explore patterns of teacher practice and student use that could inform interpretations of the study’s achievement findings.
We addressed the primary and secondary purposes by conducting a randomized controlled trial (RCT) that could meet the standards set by the What Works Clearinghouse (2017). We used complementary methods to examine qualities of implementation and student engagement. We call this the MCIS Study and not the Reasoning Mind Study because there have been prior Reasoning Mind studies. Further, the study was conducted by an independent evaluation team, not Reasoning Mind.
Significance
When we launched the MCIS Study, many districts were seeking new resources to address the recent adoption of new “college and career ready” curriculum standards (e.g., the Common Core; Common Core State Standards Initiative, 2010). The curriculum market was rapidly shifting to adoption of digital, instead of traditional paper-based resources. In particular, the use of adaptive, blended digital technologies was rapidly expanding (Powell et al., 2015). Districts had new opportunities to choose “core” resources for mathematics built around these digital features. Traditionally, districts select a single core curriculum as a primary, comprehensive resource for instruction for a given grade level. When a school or district adopts, purchases, and implements a core curriculum resource, it typically expects all teachers to use this as the backbone for mathematics instruction. Selection of core curriculum is a critical decision that determines many aspects of instruction and pedagogy throughout the school year. In complement, “supplementary” mathematics resources provide additional support. They are usually less comprehensive and are typically intended to be used less frequently, with more teacher discretion, and not necessarily by all students.
Districts consult efficacy research when choosing a core curriculum (Penuel, Farrell, Allen, Toyama, & Coburn, 2016). However, prior research on technology-rich curricula have yielded mixed findings, as the review that follows will make clear. Given these mixed findings, additional studies are needed.
Prior to widespread integration of technology into core curricula, many early studies of computer use in schools reported positive effects on achievement (Guerrero, Walker, & Dugdale, 2004; Honey, Culp, & Carrigg, 2000; Kulik, 2003). By 2010, some randomized trials and other sound studies had begun to find meaningful effects of newer technological interventions on student outcomes (Clements & Sarama, 2008; Pape et al., 2010; Roschelle, Rafanan, et al., 2010; Roschelle, Shechtman et al., 2010b). However, amid positive results, other studies of educational technology had found small or mixed effects (Angrist & Lavy, 2002; Bielefeldt, 2005; Campuzano, Dynarski, Agodini, & Rall, 2009; Kulik, 2003). Meanwhile, research that had examined impacts of traditional (not digital) core curricula in elementary mathematics indicated that there could be meaningful differences in efficacy. For example, Agodini et al. (2009) demonstrated effect sizes of d = .30 and d =.24 in Grade 1 mathematics achievement in research that compared the Math Expressions and the Saxon curricula to two alternative curricula.
Cheung and Slavin (2013) conducted a meta-analysis of evaluations of technology-based mathematics instruction. Overall, they found evidence of statistically significant impacts on student achievement; however, there were important nuances among the studies. Evaluations of elementary products found stronger impacts (d = .17) than secondary products (d = .13). Evaluations found that programs that were used more than 30 minutes a week had more impact than programs that were used less. Supplementary products were found to have a bigger effect (d = .19) than core products (d = .09), and the authors suggested this may be due to weak implementation of comprehensive programs. Programs with high levels of implementation had larger effects (d = .26) than programs with low levels of implementation (d = .12). Effect sizes were similar across socioeconomic populations. More rigorous study designs yielded smaller effects (d = .09).
Later, Pelligrini, Lake, Inns, and Slavin (2018) conducted a best-evidence synthesis of evaluations of 61 elementary math programs, including several that incorporated technology. Overall, they found tutoring and small-group interventions most effective. Their systematic review of rigorous studies through March 2018 yielded 14 studies of 10 different programs that “strongly emphasize the use of technology,” some as supplemental and some as core. The programs themselves also represented a heterogeneous mix of theories; some used adaptive approaches, and several used multimedia, games, or other types of digital media. Based on these evaluations, the authors calculated an overall positive effect size of d = .07. Notably, only one technology-based program (Mathematics and Reasoning, based in the UK) demonstrated a statistically significant result with a positive effect size (Worth, Sizmur, Ager, & Styles, 2015). The other programs, including Dreambox, Accelerated Math, Educational Program for Gifted Youth, Waterford Early Learning, and ST Math, had small effects that were not statistically significant. Reasoning Mind’s supplemental (not core curriculum) product was included and showed no effect (Wang & Woodworth, 2011). In contrast, the digital core curriculum Time to Know showed an effect size of d = .31, which was promising but not statistically significant.
The meta-analysis authors noted that though there is an overall positive effect size across the evaluations, the results are heterogeneous and do not provide clear support for any particular theory or approach. Overall, the theories and approaches in digital core curricula are rapidly evolving, and newer approaches are often highly touted. There is a need to continue to examine whether such approaches can have measurable impacts on student achievement.
Adaptive and Blended Instruction
Today, a typical characterization of technology’s value to mathematics education is the opportunity to “personalize” instruction to fit the needs of different students. However, the term personalize has unclear and varied definitions (Cavanagh, 2014; SRI International, 2018), and positive effects associated directly with personalization per se have been small (e.g., d = .09, in Pane, Steiner, Baird, Hamilton, & Pane, 2017). In contrast, adaptive and blended instruction are two complementary approaches to applying technology that are better defined and can create opportunities for new kinds of interactions in the elementary mathematics classroom.
Adaptive Instruction
Aleven, McLaughlin, Glenn, and Koedinger (2016) posit a framework of three nested loops in which data are gathered by technology from students’ work on mathematics problems and used to adjust instruction. The first is the inner loop, in which technology adapts to students by providing them with feedback specific to their work as they solve problems. Providing more frequent, targeted, and helpful feedback can improve learning (Shute, 2008). Next is the middle loop, in which technology changes the pace of instruction and depth of problem-solving challenges. Technology can also provide teachers with real-time data, often in the form of digital dashboards, that supports formative assessment (e.g., Wiliam, Lee, Harrison, & Black, 2004) by showing students’ progress and making recommendations for differentiated interventions (Powell et al., 2015). This kind of instruction has a history that goes back to early work in “mastery learning” (Block & Burns, 1976), and meta-analyses have shown that formative assessment can have a positive impact on learning (e.g., Kingston & Nash, 2011). However, prior research has indicated a risk that individualizing the pace of learning can lead struggling students to fall farther behind (e.g., Levin, 1987). We return to this theme in the Discussion section. Finally, in the outer loop, technology can provide data to help teachers improve their overall classroom implementation based on aggregate student metrics collected by the system. Product developers can also use aggregate data to improve the technology and better support implementation.
Blended Instruction
These adaptive instruction capabilities can enable classroom configurations in which teachers and technology have balanced and complementary roles in guiding student learning (Graham, 2006; Means, Toyama, Murphy, Bakia, & Jones, 2010). Christensen, Horn, and Staker (2013) define blended learning as: a formal education program in which a student learns at least in part through online learning with some element of student control over time, place, path, and/or pace and at least in part at a supervised brick-and-mortar location away from home. . . . The modalities along each student’s learning path within a course or subject are connected to provide an integrated learning experience. (p. 6)
Adaptive instruction can provide teachers with supports to attend to individual students’ needs in ways that would be more difficult without technology. Using technology can help keep students “on task” (Stallings, 1980) doing mathematics with support and feedback from a computer while a teacher directs attention to individual students (Powell et al., 2015). This can enable teachers to focus their limited instructional time to differentiate their instruction to the needs of individual students (e.g., Tomlinson et al., 2003); however, this can be hard for many teachers to implement in practice (Delisle, 2015). In blended learning theory, technology can thus both free teachers from the need to orchestrate the large group’s minute-to-minute activity and also provide teachers with student performance data to guide individualized instructional decision making.
Some prior research has examined impacts of adaptive and blended learning in mathematics (e.g., Pane, Griffin, McCaffrey, & Karam, 2014; What Works Clearinghouse, 2016). Evaluations of middle school adaptive learning technologies have found statistically significant, positive impacts (e.g., Roschelle, Feng, Murphy & Mason, 2016). Prior research has also examined blended learning in elementary school, but the rigorous studies have focused primarily on reading instruction (Conner, Morrison, Fishman, Schatschneider, & Underwood, 2007; Prescott, Bundschuh, Kazakoff, & Macaruso, 2018) or implemented case studies (e.g., Powell et al., 2015). Hence there is an unmet need to examine a digital core curriculum at scale for elementary school mathematics that incorporates promising new adaptive and blended learning approaches.
Selection of the Digital Core Curriculum
We selected Reasoning Mind’s Grade 5 Common Core Curriculum (RM-CC5) for the MCIS Study for several reasons. In addition to its implementation of adaptive, blended learning throughout a fully integrated digital core curriculum, its design was grounded in research-based recommendations for mathematics curricula, had wide and growing adoption, had promising initial evidence, and had a process for achieving implementation fidelity. Further detail appears in the Appendix.
Research Questions
The MCIS Study had two main confirmatory research questions aligned with the primary purpose of the study and two main exploratory research questions aligned with the secondary purpose to examine teacher practice and student engagement. The confirmatory questions addressed the overall main effect and examined the potential for differential treatment effects based on prior achievement. The exploratory questions were important to our interpretation of the findings on the confirmatory research questions; in short, to interpret a null effect, it is important to consider qualities of implementation and use.
Confirmatory Research Questions
Research Question 1: In schools that adopt RM-CC5 as their core resource for Grade 5 mathematics, compared with schools that use their business-as-usual resources, do students have higher mathematics achievement?
Research Question 2: Are there differential treatment effects based on prior year (Grade 4) achievement levels?
Exploratory Research Questions
Research Question 3: How did teachers’ use of instructional resources differ between the treatment and control groups?
Research Question 4: Did students substantively engage with the digital curriculum, and were there differences based on prior achievement?
Research Design and Methods
Experimental Groups
The MCIS Study was a 2-year RCT in West Virginia public schools, implemented in classrooms in SY2014–2015 and SY2015–2016. Recruitment occurred primarily in SY2013–2014, and schools were randomly assigned to a treatment or control condition and asked to participate for two full school years. All teachers in treatment schools were expected to implement RM-CC5 as their core Grade 5 mathematics resource for each year of the study, along with specific usage guidelines and professional development requirements discussed below. Teachers in control schools were expected to implement their business-as-usual resources (e.g., existing curriculum resources and supplemental technologies). The first implementation year (SY2014–2015) was considered the warm-up year, during which treatment teachers learned about RM-CC5 as they used the materials with students and received professional development. The second year (SY2015–2016) was considered the measurement year. The 2-year duration was based on RM’s experience onboarding teachers. Shifting to a blended learning model can be challenging (e.g., Powell et al., 2015); Reasoning Mind expected teachers to grow in their first year and implement more effectively in their second year. We report findings from the Grade 5 classroom cohort in which schools were using RM-CC5 for a second year. Grade 4 classrooms did not participate in MCIS; thus, Grade 5 students were new to RM-CC5 in this second year.
Setting
MCIS took place in West Virginia (WV). WV had already established the infrastructure for widespread adoption of a digital curriculum (West Virginia Department of Education, n.d.). Also, WV had approved trial use of RM-CC5 as a core curriculum. Further, because mathematics scores were below the national averages (National Center for Educational Statistics [NCES], 2011), teachers and schools in the state were motivated to improve mathematics achievement. In addition, WV had recently adopted new curricular standards and assessments that would be implemented during SY2014–2015, the first year of the MCIS Study. These were called West Virginia’s College & Career Readiness Standards (WVCCRS) and the West Virginia General Student Assessment (WVGSA). The West Virginia Department of Education (WVDOE) provided the data from the WVGSA for use as the study’s main outcome measure.
Recruitment and Participants
Recruitment requirements and incentives
The research team launched several recruitment efforts in SY2013–2014—a media event, presence at a statewide meeting of principals, and an announcement from the state superintendent. Requirements for school participation were sufficient technology resources, having at least one Grade 5 class, agreement to random assignment, agreement to allow the WVDOE to share student data, and agreement for teachers and students to participate in additional data collection (e.g., interviews, surveys). As incentives, treatment schools received the RM-CC5 program free of charge for their Grade 5 classes, and control schools (or their elementary school feeders) received a supplemental Reasoning Mind program free of charge for their Grade 2 classes. Teachers in both groups received a stipend for participation in research activities.
Recruitment and randomization
According to the NCES (n.d.), the student population across WV’s 340 elementary schools was predominantly White (93%), and the majority of schools were in rural regions (55%). To increase the potential generalizability of the study to the U.S. population (i.e., 51% White, 24% Hispanic, and 16% Black), we sought to oversample schools with higher Black and Hispanic populations and in urban areas.
All schools were randomly assigned to the treatment or control group. Randomization occurred in waves as applications were submitted throughout the year. We used a rolling assignment process because schools needed information as early as possible so that they could plan for the upcoming school year. When possible, schools were randomized in blocks of two to six with similar characteristics. The majority of schools had similar demographics and were blocked by school-level prior mathematics proficiency. In special cases, Grade 5 classrooms in middle schools were blocked or schools with high ethnic minority student populations were blocked. Two schools that had relatively late applications were independently randomly assigned to condition on their own. One of these schools was randomly assigned in Year 1 but was then unavailable to participate until Year 2. The Reasoning Mind team worked with the school’s administration to ensure that the school had the resources and training to begin the treatment condition late. As the school followed all additional study requirements, we decided to include it in the study. As a cautionary measure, we ran the main analyses both with and without this school included; overall findings were the same both ways.
Participants and attrition
Guided by our power analysis (see Appendix) we recruited a total of 56 schools into the study. Of these, 29 were assigned to the treatment group, and 27 were assigned to the control group. The imbalance was due to the fact that both schools that were assigned individually (rather than in blocks) happened to be randomized into the treatment group. A total of 46 schools completed the study through the second year; 23 were treatment group schools, and 23 were control group schools, with attrition rates of 20.7% and 14.8%, respectively. The overall school-level attrition rate was 17.9%, and the differential attrition rate was 5.9%. According the What Works Clearinghouse (2017), with an 18% overall attrition, 5.7% differential attrition is the “cautious boundary” for tolerable threat of bias under both optimistic and cautious assumptions. We examined school-level prior mathematics proficiency and found no statistically significant differences among schools that dropped out or stayed in the study in either group. Teacher staffing changes across study years were similar in both groups; 29% and 30% of teachers in the treatment and control groups respectively taught Grade 5 mathematics in Year 2 only. These teachers were included in all data analyses.
Table 1 shows the characteristics of the 46 schools that completed the study. Despite the efforts to oversample, student populations at participating schools were still predominantly White, and only two urban schools participated. About two-thirds of the schools had only one teacher who taught Grade 5 mathematics; the rest had up to four. For WVGSA analyses, we included all Grade 5 students for whom the WVDOE provided the Grade 5 score. Of these, 4.7% were missing WVGSA Grade 4 score data, which were imputed in the analyses.
Characteristics of Schools, Teachers, and Students that Completed the Study

Note: WVGSA, West Virginia General Student Assessment.
Source: National Center for Education Statistics (n.d.). There were no statistically significant differences between the groups for the school-level poverty indicator, urbanicity, or campus ethnicity.
Source: West Virginia Department of Education. There were no statistically significant differences between the groups for gender or prior achievement.
The treatment and control groups were statistically equivalent at baseline on all variables examined. Campus-level data were obtained from publicly available information released by the NCES (n.d.). There were no statistically significant differences between treatment and control groups on campus poverty, campus urbanicity, or campus ethnic distributions. Student-level data were obtained from the WVDOE. Prior mathematics achievement was also equivalent between groups; there was no statistically significant difference between groups on the Grade 4 WVGSA. The multilevel model used to test these group differences is introduced in the Data Analysis Methods section, and specific findings are presented in the Results section under Research Question (RQ) 1. There was also no significant difference between groups in gender distributions.
RM-CC5 Intervention
RM-CC5 and its adaptive, blended learning model were implemented in the treatment condition as the adopted, core instructional resource for a school, intended to replace any textbook materials. Teachers were expected to use Reasoning Mind every day as their core curriculum, and they were asked to dedicate 90 minutes per day to mathematics instruction for all Grade 5 students. Students worked individually on computers throughout the class period, and the teacher worked with individual students or small groups of students. RM-CC5 incorporated Aleven et al.’s (2016) three theory-relevant nested adaptive learning loops (discussed earlier): (a) Students received immediate feedback as they solved problems; (b) the technology changed the pace of instruction and depth of problem-solving challenges in response to student work, and teachers were provided detailed system reports to make decisions about differentiated instruction; and (c) implementation coordinators (ICs) employed by Reasoning Mind evaluated teachers’ implementation against a rubric and focused their coaching accordingly. We discuss students, teachers, and ICs in more detail in the following.
While using RM-CC5, students engaged in a series of “missions” aligned with learning objectives; in each mission, they worked on math problems with multiple representations at three levels of difficulty (Figure 1). Prior to use in MCIS, 49 learning objectives in RM-CC5 had been aligned to state instructional standards. In addition to these, learning objectives below and above grade level were also available as appropriate. Within each objective, Level A problems provided practice in one-step problem solving with a target skill, Level B problems involved more steps and went beyond direct application of a target rule, and Level C problems integrated content from beyond the current objective. Problem difficulty was differentiated based on students’ performance on the objective. In addition, RM-CC5 provided 136 “Smarter Solving” activities to prepare students for the end-of-year assessment. These were intended to be used during the first 15 minutes of class each day.

Screen shots of student views. (Top) Reasoning Mind’s Grade 5 Common Core Curriculum assignments are presented as missions in a game. This map structures the sequence of activities in a learning objective. (Bottom) Activity screen with multiple representations to help students develop a more generalized and complete understanding of fractions.
Building on research on engagement with technology (e.g., Connolly, Boyle, MacArthur, Hainey, & Boyle, 2012; Federation of American Scientists, 2006), RM-CC5 sought to motivate students by providing a supportive instructional environment with game-like features, such as narratives, cinematics, characters, and awarding of points. A character named “Genie” provided direct coaching and illustrated positive attitudes and behaviors.
Teachers were provided with a dashboard that displayed real-time student performance data on the learning objective and made recommendations for instruction (see Figure 2). Teachers were given guidance to work with individual students or small groups of students. Consistent with good use of formative assessment, RM-CC5 also enabled teachers to assign follow-up assessments to see if their inventions helped.
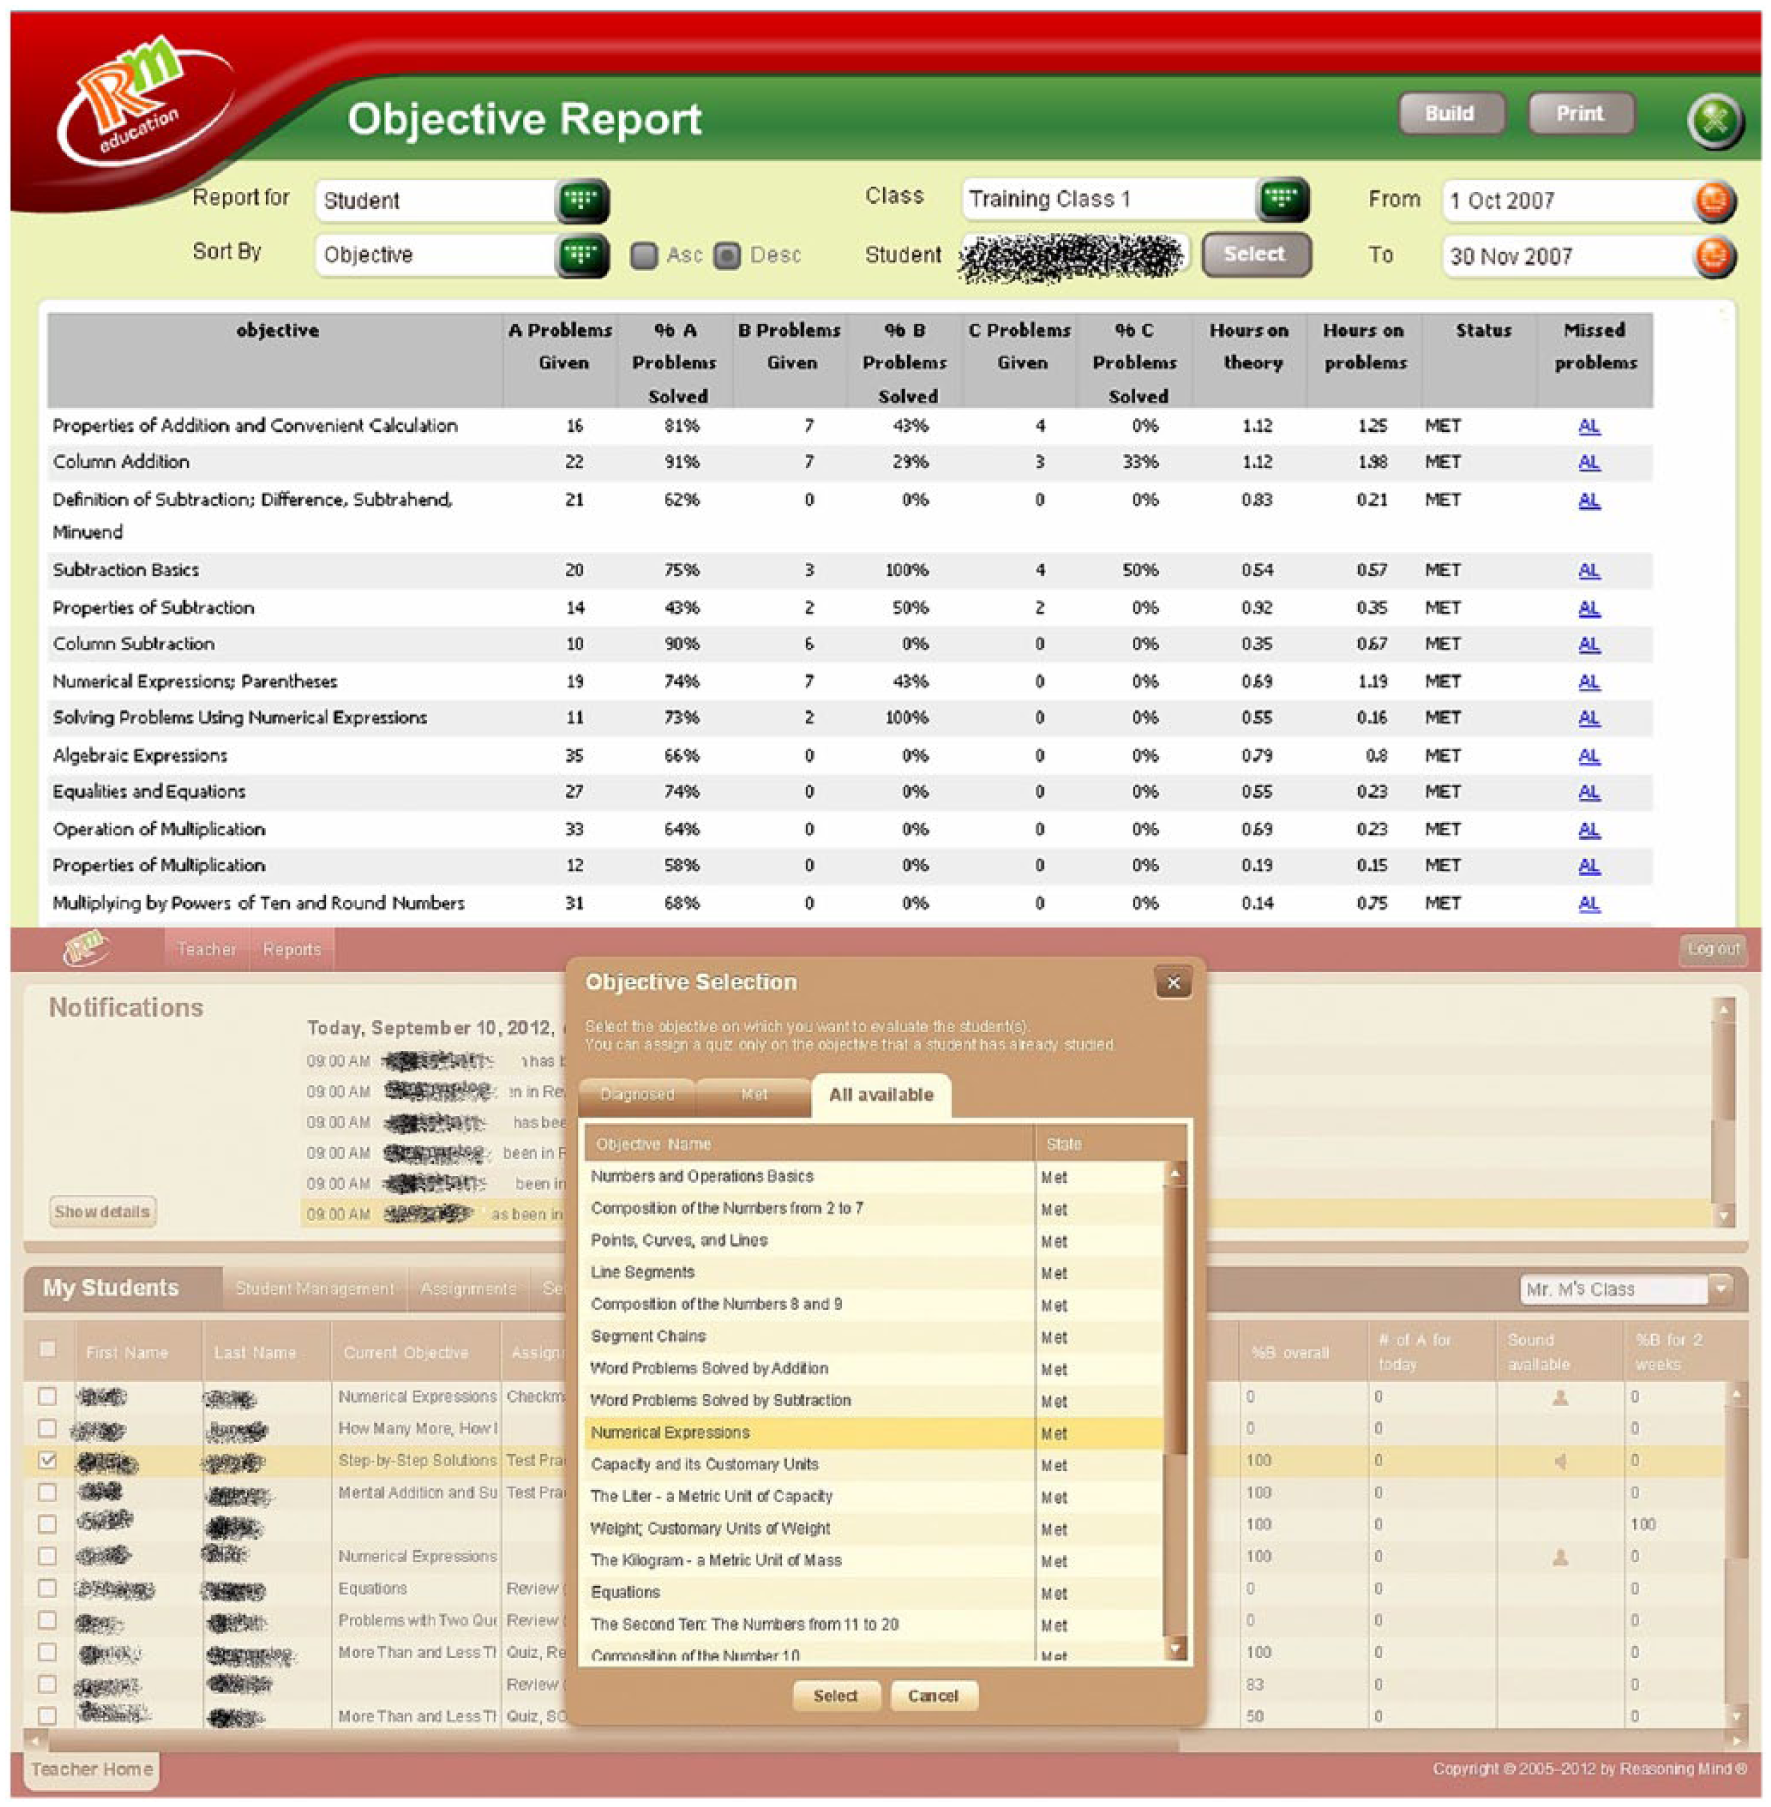
Screen shots of teacher views. (Top) A portion of the Objective Report that teachers can generate to find out how students are doing on individual topics. It includes links to the Activity Logs, allowing teachers to easily view the logs for each objective. (Bottom) Quiz for progress monitoring. Student performance on this assessment will inform how the system adapts to student needs.
Over 2 years, the IC team provided approximately 60 hours of required content-rich teacher professional development (PD) to guide teachers in how to implement the blended learning approach. The first PD experience was an in-person workshop that provided an orientation to the program. Subsequent PD was delivered in modules throughout each school year, with options for both in-person and online engagement. Each school was assigned an IC who stayed in frequent contact with schools during implementation and visited them as necessary. The IC team for the MCIS Study comprised eight ICs and a lead coordinator who reported to the research team. ICs conducted classroom observations regularly, using a rubric to benchmark each school’s implementation throughout the year and coached teachers in improving instruction and achieving high-quality implementations of adaptive, blended learning.
Measures
Student achievement measures
The primary independent variable was end-of-year mathematics achievement, measured by the WVGSA. The WVDOE provided the data from this assessment. The WVGSA has two parts: a computer-adaptive test and performance tasks. It includes multiple-choice questions, extended response items, and technology-enhanced items. Performance tasks require students to apply their knowledge and skills to respond to complex real-world problems. For each Grade 5 student in the measurement year (SY2015–2016) cohort, the WVDOE provided the Grade 5 mathematics scale score and proficiency level in spring 2016 (outcome measure) and the Grade 4 mathematics scale score and proficiency level in spring 2015 (covariate measure). The WVDOE also provided student-level information about gender and ethnicity.
Teacher instructional logs and survey
The MCIS Study elicited treatment and control teachers’ self-reports of their classroom practice and implementation. Teacher participation was managed by one teacher liaison who communicated with each of the teachers in both the treatment and control groups throughout each year. To support attainment of high response rates, incentives described previously included stipends to participating teachers in both groups, and we engaged the assistance of the ICs to follow up with nonresponsive teachers.
The research team developed two measures, both administered online to teachers in both groups. The first was an implementation log. The log was designed to take about 10 minutes to complete and asked about instructional practices on a given day: the length of the class period, the teacher’s use of data to make instructional decisions, the kinds of mathematical interventions the teacher used, the materials and technology the class used, the interaction structures the students worked in (e.g., whole class, individual, pairs), and teachers’ perceptions of student engagement. All teachers were asked to fill out the log for 5 days in a row in each of 3 separate weeks that researchers selected during the measurement year (for a total of 15 instructional days). The second measure was a survey administered at the end of the school year. The survey for both groups asked about satisfaction with their curriculum, overall technology use, test preparation activities, professional development experiences, and perceptions of impacts of the curriculum on students’ achievement. Additional questions for treatment teachers concerned interactions and challenges with various aspects of RM-CC5.
System use metrics for students
The RM-CC5 system captured extensive data for students and teachers as they used the digital materials throughout the school year. We used the following metrics to characterize student performance and intensity of use in the RM-CC5: total time logged into RM-CC5 during the school year, learning objectives met, number of practice problems given, accuracy of problem solving, total time spent in Smarter Solving lessons during the school year, and Smarter Solving lessons completed.
Additional measures
The MCIS team also gathered additional data about classroom implementation, teacher experiences, and student dispositions through observations, interviews, and surveys. Fully analyzing and reporting on these additional instruments is beyond the scope of this article; more details on implementation are discussed elsewhere (e.g., Bumgardner, Herman, Knoster, & Knotts, 2017; Singleton, Roschelle, Feng, & Shechtman, 2019).
Data Analysis Methods
All analyses were conducted on an “intent to treat” basis with the school as the unit of treatment. For confirmatory RQ1, we used multilevel modelling (MLM), specifically two-level hierarchical linear models (students nested within schools), to estimate the effects of the treatment (Raudenbush & Bryk, 2002). We considered using a three-level model; however, because about two-thirds of the schools had only one teacher participating in the study, a two-level model was more appropriate. For a given school, the model included all data provided by the WVDOE for the school’s Grade 5 students (i.e., no students were omitted for any reason). The two-level MLM accounts for measurement and sampling error at both the student and school levels, resulting in correctly adjusted standard errors for the treatment effect. We modeled the mean differences in Grade 5 WVGSA between students in treatment and control schools, controlling for prior achievement, as measured by the Grade 4 WVGSA. The MLM was as follows:

where Yij was the Grade 5 WVGSA for the i-th Grade 5 student in the j-th school; Xij was a student-level covariate (i.e., Grade 4 WVGSA); Ij was an indicator of the j-th school being in the treatment group; β00 was a constant representing the expected (average) student outcome when the grand-mean-centered student level covariates had values of zero and the student was in the control condition; β01 was the estimate of the treatment effect of the intervention; and eij and r0j were the student- and school-level residual terms. Missing Grade 4 data were imputed using multiple imputation (Azur, Stuart, Frangakis, & Leaf, 2011). Analyses were run using the Stata mi command with 20 implicates (these are copies of the database with different values imputed for the missing Grade 4 scores). Covariates in the multiple imputation were school ID, gender, and ethnicity (White/non-White). Effect size was calculated as the number of points of difference attributable to the treatment divided by the pooled within-group estimate (including both treatment and control students) of the standard deviation of student scores.
To test for equivalence of groups at baseline, we used a similar two-level model but with Yij as the Grade 4 WVGSA for the i-th Grade 5 student in the j-th school, no covariate, Ij as an indicator of the j-th school being in the treatment group, and β02 as the estimate of differential baseline achievement.
For confirmatory RQ2, we examined the treatment effects within subgroups comprising students at each of the four Grade 4 proficiency levels (defined by the state). We also examined achievement for female versus male students. Within each subgroup, we applied the two-level models to test for baseline equivalence and treatment effect. Within each implicate, students were assigned to Grade 4 proficiency level based on the observed or imputed Grade 4 score (allowing the same student to be in different proficiency levels in different implicates). The regressions for each Grade 4 proficiency level subgroup included all students in each implicate who were assigned to that proficiency level. Had any tests turned up statistically significant, we were prepared to manage the risk of inflated Type I error rates by using the false discovery rate procedure of Benjamini and Hochberg (1995).
All models were fit using the xtmixed procedure within Stata version 13 (using the “mi estimate” prefix) and restricted maximum likelihood estimation. Continuous covariates were grand mean centered. Categorical variables were represented as 0/1 indicators for each category.
For the exploratory research questions, we conducted descriptive, correlational, and MLM analyses. For RQ3, we conducted descriptive analyses of teachers’ reports on the teacher instructional logs and teacher survey in both the treatment and control groups. For RQ4, we conducted descriptive analyses of students’ RM-CC5 system use metrics in the treatment group only. We also calculated a correlation matrix to examine collinearity among Grade 4 WVGSA, Grade 5 WVGSA, and key RM-CC5 system use metrics. Means, population standard deviations, and correlations were calculated using the 20 implicates as if they represented a data set 20 times as large as the observed data. We also used the two-level MLM model to examine the proportion of variance (R2) in Grade 5 WVGSA accounted for differentially by Grade 4 WVGSA and key RM-CC5 system use metrics. To calculate R2 values, we first calculated predicted values based on the multiply imputed xtmixed regressions and then calculated the residuals (i.e., the differences between the predicted values and observed or imputed values). The ratio of the variance of the residuals divided by the variance of the observed/imputed values was the estimate of 1 – R2.
Results
Confirmatory Analyses
Table 2 presents descriptive and inferential statistics in the overall sample and for selected subgroups.
Grade 4 and Grade 5 West Virginia General Student Assessment Student Mathematics Scores

Note: No statistically significant differences between the treatment and control groups were found, either at Grade 4 or Grade 5. ES = effect size; COEFF = coefficient; ICC = intraclass correlation.
To test for baseline equivalence between the treatment and control groups, we used the two-level multilevel model (MLM) predicting Grade 4 score. The model was run on both the imputed and nonimputed versions of the Grade 4 score for the whole sample and for each subgroup. In each instance, there was no statistically significant difference between the groups at the p < .05 level.
To test for the main Grade 5 treatment effects, we used the two-level MLM predicting Grade 5 score, controlling for Grade 4 score (with imputed values). There was no statistically significant difference between any of the groups at the p < .05 level.
For missing Grade 4 data (<5%), we generated 20 implicates of the Grade 4 score and used Smarter Balanced (n.d.) to convert Grade 4 score to proficiency level. The Ns reported by proficiency level include the average number of students the 20 implicates placed in each proficiency level, rounded to the highest whole number.
RQ1: Impact on achievement
As shown in the Grade 4 column of Table 2, the experimental groups were equivalent at baseline on the Grade 4 WVGSA. As shown in the Grade 5 column and Treatment Effect Grade 5 columns, a two-level MLM model controlling for Grade 4 WVGSA indicated that the main effect of assignment to condition did not result in a statistically significant difference on the Grade 5 WVGSA: There was no overall difference in outcomes between the treatment and control groups. Both the control and treatment schools were distributed across the range of school-level achievement at both Grade 4 and Grade 5 (Figure 3). The correlation between the Grade 4 (including imputed values) and Grade 5 WVGSA was high (n = 1,919, r = 0.79, p < .0001).

Scatterplot of Grade 4 and Grade 5 West Virginia General Student Assessment, Aggregated at the School Level.
RQ2: Impacts by prior achievement
This analysis tested the treatment effects for students at different levels of prior achievement (see Table 2). Students were divided into four subgroups corresponding to Grade 4 WVGSA achievement levels. We also examined treatment effects by gender (cell sizes for ethnic subgroups were too small to analyze). For each subgroup, separate two-level MLM models indicated baseline equivalence on the Grade 4 WVGSA and no differences between control and treatment groups on the Grade 5 WVGSA.
Exploratory Analyses
RQ3: Teacher practices in the treatment and control groups
To address this question, we analyzed the teacher instructional logs and teacher survey. Response rates were high and satisfactory on both measures in both groups, with slightly higher rates in the treatment group. For the implementation log, 100% and 87.9% of teachers completed at least one log in the treatment and control groups, respectively (t = 2.2, p < .05). The average total logs per teacher were 13.4 and 13.3 in the treatment and control groups, respectively. For the survey, the response rates were 97.4% and 84.8% in the treatment and control groups, respectively (t = 1.9, p = .06). Key observations follow.
Curriculum use in the control group
As reported in the survey, control teachers reported using a variety of curricula at their schools, including EngageNY, Everyday Mathematics, Excel Math, Go Math, Investigations, iReady Common Core, Math Expressions, and New Mark Learning.
Technology use
Technology was used in both treatment and control classrooms, but use was higher in treatment classrooms. On the survey, in response to the question about how much their students used technology in a regular week of math class, 89.5% of treatment teachers and 10.7% of control teachers indicated students used technology for at least half the class time, respectively (t = 10.0, p < .0001). Note that 60.7% of control teachers reported that students used technology 26% to 50% of the time.
Teacher role
Teachers in the two groups reported different frequencies of teaching activities. In the treatment group, teachers reported greater frequency of one-on-one instruction with individual students (mean of 49.9% of total log days vs. 27.0% in the control group, t = 12.3, p < .0001). In the control group, teachers reported greater frequency of leading whole-group instruction (mean of 39.0% of total log days vs. 11.7% in the treatment group, t = 17.7, p < .0001) and working with small groups (mean of 29.5% of total log days vs. 15.5% in the treatment group, t = 8.8, p < .0001).
Class period length
In the implementation log, treatment teachers reported longer durations of class periods devoted to teaching mathematics. The means were 78.4 minutes (SD = 9.8) in the treatment group and 69.0 minutes (SD = 13.9) in the control group. This difference of an average of 9.4 minutes was statistically significant (t = 3.3, p < .01). This was most likely related to RM’s request for 90-minute mathematics periods.
RQ4: Student engagement with RM-CC5
Because RM-CC5 is adaptive to each student’s pace of learning, analyses of student use attended to variation at both the student and school levels. Table 3 shows the descriptive statistics for each of the metrics, aggregated at the school level. Complete use data were available for 881 (93.7%) of the 940 treatment students for whom we had WVGSA Grade 5 scores. In the following analyses, calculations used an estimate of 160 school days per year; 180 total days is typical in WV but includes noninstructional days for testing and other special events.
Reasoning Mind’s Grade 5 Common Core Curriculum (RM-CC5) System Use Key Metrics Aggregated at the School Level and Summarized Across Schools

Total time logged into RM-CC5 during the school year (hours)
Across all treatment schools, students were logged into RM-CC5 for an overall estimated average of 56.7 minutes per day, with a school-level SD of about 7.7 minutes. Within any given classroom, students’ log-in time spanned a wide range (Figure 4). Note that the majority of the class period was spent using the technology, as expected for the treatment group.
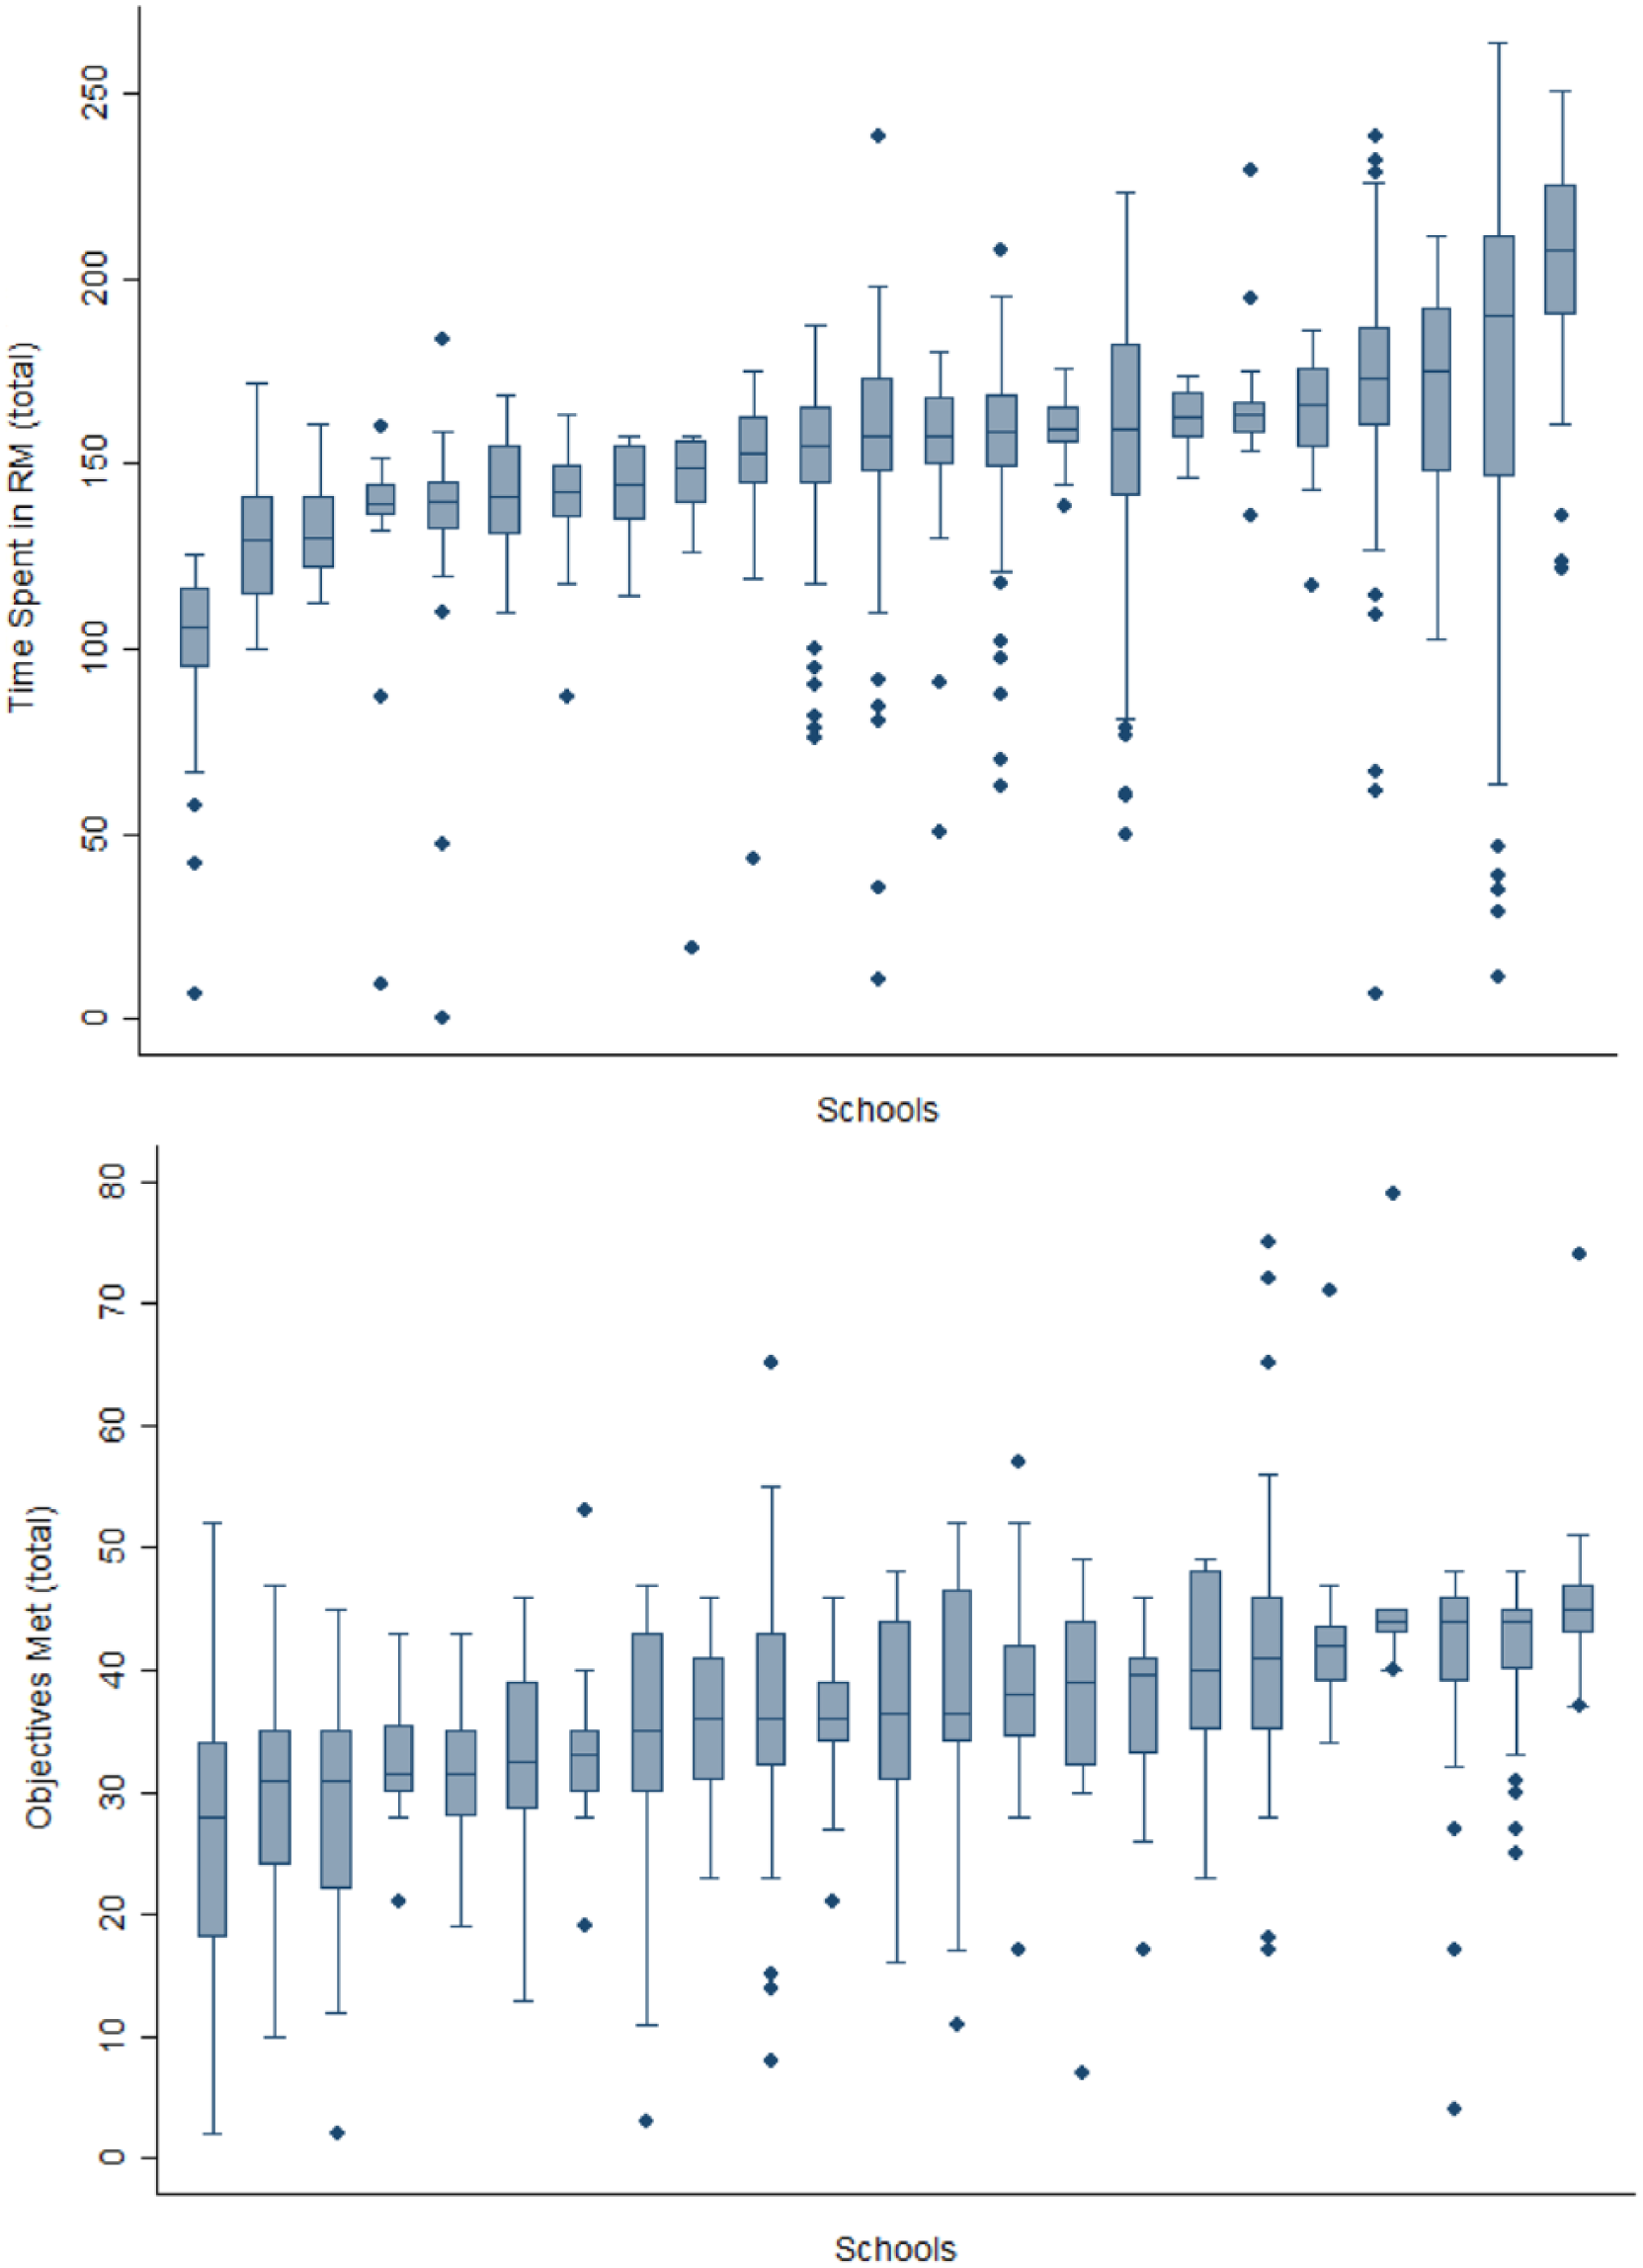
Distributions within treatment schools of total time logged into the Reasoning Mind system and total objectives met (sorted by school median).
Core curriculum learning objectives met
On average, across treatment schools, students met about 36.7 RM-CC5 learning objectives, with a school-level SD of 5.2. There were 49 Grade 5 objectives, and additional objectives were available below and above grade level. Within any given school, students varied in how many objectives they met (Figure 4).
Practice problems
Students worked an estimated average of 14.5 problems per day, the majority at Level A. We observed considerable variation between schools on both number of problems given and levels of accuracy.
Total time spent in Smarter Solving during the school year (hours)
On average, students spent about 17.2% of the online time doing Smarter Solving lessons. This was an estimated average of 9.8 minutes per day, with a school-level SD of about 1.2 minutes.
Compliance with the RM-CC5 program
The system use metrics (Table 3) suggested that all the RM-CC5 schools were compliant with the program model.
Collinearity of RM-CC5 metrics
Table 4 shows a correlation matrix of RM-CC5 metrics and student achievement. Most of the system metrics were collinear. Several may have varied together because they related to time on task or dosage. These include total time logged into RM-CC5, core learning objectives met, practice problems given, total time spent in Smarter Solving, and lessons completed in Smarter Solving. Problem accuracy may have been less closely related to these variables because it was more of an indication of mathematical precision.
Correlation Among System Use Metrics and Achievement Key Metrics Correlated With West Virginia General Student Assessment (WVGSA) Scores and Among Each Other

p < .0001.
RM-CC5 engagement and student achievement
As shown in Table 4, there were also correlations between RM-CC5 metrics and both Grade 4 and Grade 5 WVGSA. Although it was impossible to tease apart causality, we extended our two-level MLM model of Grade 5 WVGSA (with Grade 4 WVGSA imputation) to examine whether any variability could be accounted for by the RM-CC5 metrics. As discussed, the Grade 4 and Grade 5 WVGSA were highly correlated with each other, and the Grade 4 WVGSA alone accounted for 66% of the variance in Grade 5 WVGSA. We added RM-CC5 metrics into the model: time logged into RM-CC5, number of learning objectives met, number of problems given (A, B, and C), and problem accuracy for each problem type. Together, these added variables accounted for an additional 7.3% of the variance. Thus, after controlling for prior knowledge, these RM-CC5 usage metrics had a small positive linear relationship with Grade 5 WVGSA.
Together, the findings for RQ4 suggest that students substantively engaged with the system and all of the schools appeared to be compliant with implementing the program. There was, however, extensive variation in engagement at both the school and student levels. Both prior achievement on the Grade 4 WVGSA and grade-level achievement on the Grade 5 WVGSA were correlated with engagement metrics. Although there are potentially important relationships between Grade 4 and Grade 5 achievement and content coverage, the study was not designed to make causal inferences about mechanisms by which this may occur. Because of the collinearity among all the variables, we cannot infer which variables matter the most, if any. Also, there may be additional unmeasured factors that could have influenced the findings.
Discussion
The RM-CC5 schools in the MCIS Study did not outperform schools in the business-as-usual condition. Here, we review characteristics of the study and findings from the exploratory research questions to consider three broad types of potential explanatory factors (Seftor, 2016): experimental research design, program implementation, and program theory. We conclude this section with a discussion of the limits of generalizability of these findings.
Experimental Research Design
Technical problems with the experimental research design or execution could have affected the findings. However, we argue that the experimental design was sound and well executed. It was conducted by a research team independent from Reasoning Mind, the experimental groups were equivalent at baseline in prior achievement, and outcome data were provided by the state. Although there was slightly high differential school attrition of 5.9%, this was not likely to have affected the results; we examined school-level prior mathematics proficiency and found no statistically significant differences between schools that dropped out or stayed in the study in either group.
There was also a strong and confirmable contrast between resources used in the treatment and control groups. RM-CC5 program theory was based on a conceptualization of adaptive, blended learning classroom models in which students interact one on one with technology as a primary mechanism for instruction, the system monitors student progress frequently, and the teacher and technology use data to adapt instruction to individual needs. In our findings for RQ3, we found that most of the control group curricular resources were paper-based (however, iReady and GoMath include technology), and although technology was available in the control group, the role of technology was clearly supplemental, as technology was used less than 50% of classroom time in the majority of control classrooms. Further, observers found a statistically significant higher degree of data use in the RM-CC5 classrooms than in the control group (Bumgardner et al., 2017). There was likely some degree of adaptive, blended learning in some control classrooms, yet there still was a strong contrast between the treatment and control groups in the degree of reliance on technology to deliver instruction and use of student data to adapt instruction and thus in the intensity of adaptive, blended learning.
One design issue to consider in future research is whether a state accountability measure is the best way to characterize achievement differences between groups using different instructional approaches. The research team considered a range of alternative assessments and reached the opinion that given the policy context of the research and full-year scope of the intervention, the strongest research design would use the state’s assessment as the main outcome measure. This supports the external validity of the research; the WVGSA is an important educational outcome measure in West Virginia, and end-of-year accountability assessments matter in every state. Further, after examining information about relevant standards and assessments in WV and in other states, the research team did not find a reason to suspect these WV results would not generalize to states using Common Core Standards or Smarter Balanced Assessments (Smarter Balanced Assessment Consortium, 2012).
However, one potential limitation may be a lack of instructional sensitivity; state accountability assessments are typically “distal” measures (Ruiz-Primo et al., 2002), not intended to be sensitive to the specific instructional intent of any particular intervention (Lipsey, 1990; Lipsey & Hurley, 2009). Indeed, there have been some critiques of the instructional sensitivity of the recent end-of-year assessment designs (Polikoff, 2016). In the MCIS study, RM-CC5 potentially could have more effectively supported learning for students who needed content below the Grade 5 level, but the Grade 5 WVGSA would not likely have been sensitive enough to instruction below grade level to enable detection of differences between groups. Also, RM-CC5 may have focused in more depth on Number and Operations topics than was captured by the WVGSA measure.
Program Implementation
Another possible explanatory factor could be related to lack of implementation of the digital curriculum. However, this does not appear to be the case. Overall, all the treatment schools followed the RM-CC5 program with fidelity to the desired intensity of usage. In particular, all schools used RM-CC5 as their core Grade 5 resource, the implementation coordinators reported coaching teachers in each school, and the RM-CC5 system metrics showed that students in all schools were using the system throughout the school year. There was, however, significant variation among schools in details of implementation beyond the overall implementation fidelity benchmarks. In our extensive exploratory analyses, we did not find any single mediating variable to account for achievement differences. One moderator, prior achievement, predicted both system use and outcomes. However, we were unable to make causal claims about this given collinearity among all the variables.
Program Theory
Finally, the underlying program theory that informed the design of the system may have had problems, gaps, or nuances that could have limited the potential of RM-CC5 to impact achievement. RM-CC5 program theory was based on a conceptualization of adaptive, blended learning classroom models in which students interact one on one with technology as a primary mechanism for instruction, the system monitors student progress frequently, and the teacher and technology use data to adapt instruction to individual needs. As an efficacy study, MCIS was not designed to evaluate claims about specific aspects of the program design or theory; however, findings from our exploratory analyses point to two important themes that might be explanatory factors and would be worthy of further study.
The first theme relates to the balance between adaptive learning (which prioritizes individuals’ mastery of content) and coverage-oriented learning. We noted that in the treatment condition, there was wide variation in coverage of learning objectives at both the student level and school level. If too much time is spent on mastering topics early in the curricular sequence, the lack of coverage of later topics may interfere with raising achievement on accountability measures such as the WVGSA; assessments like these are designed to gauge progress on curricular expectations across all the topics in a school year. Indeed, one anecdotal, although frequent teacher complaint about RM-CC5 was that students were not experiencing all the material that would be tested. We heard no similar complaints from teachers in the control condition.
An adaptive learning system might compromise individual student performance on a state assessment if the adaptive algorithm limits students’ exposure to their state’s expected topics for their grade level. Long ago, Burris, Heubert, and Levin (2004a, 2004b) addressed a similar tension in the design of the Accelerated Math program: If the system responds to student struggles by slowing the pace of instruction, students will miss out on later topics. Research on mastery learning has demonstrated the possibility of addressing pace-related challenges (Guskey & Gates, 1986), but perhaps RM-CC5’s pacing for struggling students needs further adjustment.
The second theme is the potential for shifts in classroom activity types to interfere with raising achievement. The RM-CC5 blended learning model emphasized independent student work and teacher intervention, a shift from traditional classrooms that typically also include whole-class instruction, whole-class discussion, and peer or small-group interactions. The blended learning model did not include a rotation through small-group activities, which is a typical recommendation for blended learning approaches (Powell et al., 2015). The lack of emphasis on small-group work was reflected in teachers’ reports of their classroom activities. Though we do not have data to draw specific conclusions, we wonder if program theory missed opportunities that complementary nontechnology small-group and full-classroom activities might offer. For example, cooperative learning and peer tutoring are effective small group activities (Kyndt et al., 2013). Also, the lack of small-group work might have influenced students’ motivation, engagement with learning, and opportunities for social-cognitive processing. Research on the role of full-classroom discussions suggest that teachers use such discussions to establish mathematical goals and norms, engage and develop students’ reasoning, and develop a sense of belonging and identity through classroom relationships around mathematics (Franke, Kazemi & Battey, 2007).
Limits to Generalizability of the Experimental Findings
There are important limits to the generalizability of the finding that the use of the RM-CC5 digital core curriculum resulted in the same level of achievement as in business-as-usual classrooms. First, as discussed, the demographic characteristics of WV and the sample in MCIS were not reflective of all regions of the United States. Schools that implement RM-CC5 in a different region or with different student populations may experience different results. Also, other adaptive, blended learning core curricula are in use, such as Time to Know (Rosen & Beck-Hill, 2012). Such products may differ from RM-CC5, for example, in terms of program theory and implementation, and they might perform differently at scale. In addition, our findings have limited generalizability to other content or grade levels.
Conclusion
The MCIS Study was conducted at an important time in the national discourse about longstanding needs to improve mathematics achievement. Educational leaders were then and are now making decisions about new curriculum resources and approaches to meet college- and career-ready goals. Use of paper curriculum resources continues to decline, and new digital offerings are abundant. Adaptive technologies and blended learning are frequently featured for their potential to advance learning, yet empirical results from rigorous, large-scale, independent evaluations are rare, especially for core elementary school math resources.
The primary purpose of the MCIS Study was to evaluate the efficacy of a new digital core curriculum for improving achievement in Grade 5 mathematics. Although it is no doubt disappointing to some stakeholders, MCIS’s null result does not indicate that the treatment approach was bad or did not work; rather, it shows that the research could not distinguish its effects from business-as-usual curricula. With regard to future research, the null result is not a strong warrant for cutting off further exploration of blended or adaptive learning, as we detected no harm to students, and further improvements could yield eventual measurable impacts.
We noted three issues that deserve attention in future research and development. First, measurement remains a challenge in studies of educational technology interventions. Given the potential limits of the instructional sensitivity of state accountability measures, the educational technology sector is not confident that these measures adequately indicate the true value of innovative approaches. Second, adaptive approaches have an unresolved tension between coverage and mastery. When the pace of a student through instructional objectives slows to allow greater mastery, student performance on an assessment of grade-level standards might be compromised. The field needs stronger theory to manage this balance in classroom settings. Third, we noted that a blended learning approach can increase the dominance of two activities: independent learning at a computer and teacher interventions. Although these activities may be beneficial, there may also be teacher or learner strengths that are better activated in alternative activities, such as full classroom instruction or small-group collaboration. Thus, we need more program theory about how the “blend” in a blended learning classroom can be best tuned to leverage learner and teacher strengths as well as technological capabilities.
Researchers and policymakers have long held that it is important to report null effects to retain balance and objectivity in our understanding of potential innovations. A null effect can sharpen our thinking and make us realize how many factors must be understood and controlled to successfully improve the complex system that exists in a mathematics classroom. Through research that finds a null effect, we can learn what should be measured more carefully the next time, and we can refine hypotheses. As we explore in more detail in Singleton et al. (2019), MCIS demonstrates that a complex change in classroom practices, including the intensive daily use of technology and data, as well as shifts in the role of the teacher, can be introduced widely across a state. We expect the shift from paper to digital curriculum resources to continue. A task for further research is to leverage what we are learning about the capabilities of digital resources and malleability of classroom routines to realize improved outcomes at scale.
Footnotes
Appendix
The additional content in this Appendix includes (a) more detail on the selection of Reasoning Mind and (b) a power analysis.
Acknowledgements
This material is based on work conducted by SRI Education, in partnership with Reasoning Mind, supported by the Institute of Education Sciences of the U.S. Department of Education under Grant R305A130400. Any opinions, findings, and conclusions or recommendations expressed in this material are those of the authors and do not necessarily reflect the views of Institute of Education Sciences. We thank the West Virginia Department of Education for providing access to the data. We especially thank the Reasoning Mind team, led by CEO Alex Khachatryan. None of the authors has a financial interest in Reasoning Mind. We also thank the students, teachers, and schools of West Virginia who participated in the study, as well as the project staff: L. Gallagher, H. Javitz, B. Lopez-Prado, M. Salciccioli, S. Vasquez, and T. Wetzel from SRI and P. Herman, K. Bumgardner, A. Knotts, and K. Knoster from McREL.
Authors
NICOLE SHECHTMAN is a principal education researcher at SRI Education. Her interests include the design and implementation of efficacy research to examine the impacts of educational technologies at scale.
JEREMY ROSCHELLE is executive director of learning sciences at Digital Promise Global. His research investigates the design and evaluation of advanced technologies that aim to enhance learning of important mathematics.
MINGYU FENG is a senior research associate in the STEM program at WestEd. Her research interests include design, implementation, and efficacy of educational technology, educational data mining, and learning analytics.
CORINNE SINGLETON is a senior education researcher at SRI Education. Her evaluation research uses both qualitative and quantitative methods to examine issues related to education for underserved populations, innovative teaching and learning, educational technology, and math education.