
Abstract
This study used NWEA’s MAP Growth math test scores from approximately 1.7 million students to examine the lasting effect of COVID-19 on high school math achievement and the associations among course-taking trajectories, demographic characteristics, and math achievement. We found that a drop in math achievement emerged for students in eighth grade in 2020–21 and persisted into 10th grade in spring 2023. Regarding students’ math course-taking trajectories, while there were no statistically significant COVID impacts on enrollment rates in Algebra 1, Geometry, and Algebra 2, significant negative COVID impacts were found for those who took these courses in 10th grade. Lastly, although pre-COVID disparities existed in math achievement across racial/ethnic subgroups, there were no disproportionate impacts of COVID-19 on specific racial/ethnic subgroups after controlling for prior achievement. Implications of these results for students’ math learning and school policies are discussed.
Introduction
High school algebra is considered a gatekeeper to higher-level mathematics (e.g., Geometry, Algebra 2, Calculus) as well as students’ academic success in high school and beyond (Brown et al., 2018). Studies have shown that high school algebra coursework significantly predicts students’ later performance in upper-level math courses (Lee & Mao, 2021) as well as in college courses (Kowski, 2013; Woods et al., 2018). Despite its importance, high school students’ failure in algebra has been a stagnant problem across the country. Approximately 18% of the students did not pass Algebra 1 during their ninth-grade year (Rickles et al., 2017), and about 80% of students who dropped out of high school reported that failure in Algebra 1 was their primary dropout reason (Schachter, 2013). More seriously, students’ failure rate in algebra is much higher for underrepresented students, contributing to a serious ethnic/racial achievement gap (Stoker et al., 2018).
Further, as COVID-19 spread around the world, how and where students learned changed dramatically. Research has shown that students’ math test scores have been negatively impacted by COVID-19, with larger negative impacts for students of color and students attending high-poverty schools (Cohodes et al., 2022; Fahle et al., 2022; Kuhfeld & Lewis, 2022a). In particular, students who were in middle school during the pandemic demonstrate more pronounced setbacks in math. Only 26% of eighth-grade students performed at or above proficiency on the National Assessment of Educational Progress (NAEP) math assessment in 2022, a drop of seven percentage points compared to 2019. Lewis and Kuhfeld (2022) estimated that students who were in eighth grade in the 2022–23 school year would have a recovery timeline that would extend past when they would be expected to graduate from high school. However, little work has examined the lasting impacts of COVID-19 on math achievement for students currently attending high school.
One of the important factors affecting students’ success in higher-level mathematics and college is students’ math course-taking trajectories (Domina et al., 2014; Mokher & Hu, 2022; Ngo & Velasquez, 2020). Understanding students’ math course-taking trajectories helps explain student learning opportunities and outcomes and provides a picture of how students engage with different content throughout high school and beyond, which in turn, can provide practical guidance on mathematics education policy (U.S. Department of Education, 2018). Research has consistently shown that students’ early access to algebra (e.g., taking Algebra 1 in eighth grade) was positively associated with their subsequent enrollment in higher-level math courses (i.e., Geometry, Algebra 2, Calculus; Domina et al., 2014) and their later math achievement (Lee & Mao, 2021; Smith, 1996). Furthermore, a few studies have demonstrated that students’ math course-taking sequences are influenced by their prior performance or demographic characteristics, such as race/ethnicity or socioeconomic status (SES) (Bozick & Ingels, 2008; Domina & Saldana, 2012; Riegle-Crumb & Grodsky, 2010). However, much uncertainty exists about (1) how students’ high school math course-taking sequences for algebra and geometry have been impacted due to the COVID-19 pandemic and (2) the interrelations among course-taking trajectories, demographic characteristics, and math achievement during the pandemic.
In this study, we examine (1) the lasting influence of COVID-19 on high school students’ math achievement, and (2) the associations among math course-taking trajectories, demographic characteristics, and math achievement during the COVID-19 pandemic using general math, Algebra 1, Geometry, and Algebra 2 test scores from NWEA’s MAP Growth math assessments collected in middle and high school grades before and during the COVID-19 pandemic (NWEA, 2019). Specifically, we used longitudinal data from 700,000 students during the prepandemic period (2017–2019) and from 1 million students during the pandemic period (2020–2022) in a consistent set of 5,000 high schools. We addressed the following three research questions:
Background
COVID-19 Pandemic and Mathematics Learning
In efforts to better understand the impacts of COVID-19 and to inform recovery efforts, several studies have empirically investigated how COVID-19 impacted student learning. While most studies found significant decreases in student achievement, these effects were larger in math, which requires more immediate feedback and more intense teacher-student interaction than in other subjects (Cohodes et al., 2022; Fahle et al., 2023; The Nation’s Report Card, 2022). For example, Lewis and Kuhfeld (2021) compared third- to eighth-grade students’ math achievement in fall 2021 with prepandemic average achievement in fall 2019. The findings showed that student math achievement in fall 2021 was lower on average than in a typical year, and the decline was much larger for math scores than for reading scores. In subsequent studies, Kuhfeld et al. (2022c) and Fahle et al. (2024) found evidence of rebounding, defined as a pattern of achievement gains that match or surpass prepandemic levels, in third- through eighth-grade students’ math achievement in the later phase of the pandemic. However, the patterns of rebounding were not evenly distributed across student groups, with minoritized students and students in high-poverty schools often still having the longest path to recovery.
The pattern of decline in math was also observed in college readiness assessments. The ACT reported that the high school class of 2022 had the lowest average ACT scores in the past 30 years, with average math scores decreasing by .6 points from 2021 to 2022 (ACT, 2022). Another study (Burkholder & Salehi, 2023) found that ACT scores significantly declined compared to prepandemic periods for first-generation students, whereas no significant changes were found for other demographic groups. However, as many colleges and universities have moved to test-optional policies, trends in traditional college readiness assessments like the ACT and SAT are now less reliable for understanding high school achievement since far fewer students are taking these assessments (Bennett, 2022). At the same time, record levels of grade inflation have been reported in high school math and science classes, making grade point average (GPA) a poorer measure of achievement and college readiness than before the pandemic (Sanchez, 2023).
Other work has found that the pandemic could have further widened the gaps and educational inequities that existed previously for our nation’s most marginalized populations. In particular, several studies have reported that racial/ethnic or environmental inequalities in students’ achievement widened during the COVID-19 pandemic (Kogan & Lavertu, 2021; Kuhfeld et al., 2022b, 2022c; West & Lake, 2021). For instance, Black and Hispanic third- to eighth-grade students scored much lower in mathematics in 2021–22 and 2022–23 compared to the national average in the prepandemic period (Kuhfeld et al., 2022b; Lewis & Kuhfeld, 2023). Multiple studies reported that students who live in communities with greater poverty and COVID-19 infection rates showed lower growth rates in mathematics than students living in low-risk communities (Fahle et al., 2023; Kuhfeld et al., 2022c). Additionally, teachers reported not being able to devote as much time to math instruction during the pandemic (Wolfe et al., 2023).
In sum, studies have reported significant decreases in student math achievement during the COVID-19 pandemic, and the impact seems to be greater for students who are Black, Hispanic, or are living in high-risk communities. However, most of these results were based on middle school data, and much uncertainty still exists about the impact of COVID-19 on high school students’ mathematics achievement. Thus, our first research question examines high school students’ overall patterns of growth in math achievement during the 2022–2023 school year.
Course-Taking Trajectories in Mathematics
Students need ample opportunities to learn higher-level mathematics in high school to succeed in mathematics and other science, technology, engineering, and mathematics (STEM) courses in college (Byun et al., 2015; Kim et al., 2015; Leyva et al., 2022). The most frequent math course-taking pathways for students in the United States involve taking Algebra 1 in ninth grade, Geometry in 10th grade, Algebra 2 in 11th grade, and no mathematics in 12th grade (Brown et al., 2018; U.S. Department of Education, 2018). Students on the accelerated math course trajectory often take Algebra 1 in eighth grade, Geometry in ninth grade, Algebra 2 in 10th grade, and some advanced math course (e.g., Advanced Placement [AP] Statistics or Probability and Statistics) in 11th or 12th grade (Wolfe et al., 2023). Note that we define Algebra 1, Geometry, Algebra 2, and Precalculus as upper-level math courses, and AP Statistics, AP Calculus, Probability/Statistics, and Trigonometry as advanced math courses (National Center for Education Statistics, 2022).
Studies have found that students’ early access to Algebra 1 (e.g., in eighth grade) was positively associated with their subsequent enrollment in upper-level math courses and their later math achievement (Domina et al., 2014; Lee & Mao, 2021; Smith, 1996). For example, Domina et al. (2014) found that taking Algebra 1 in eighth grade positively influenced students’ enrollment in subsequent upper-level math courses in the next year (e.g., Geometry) as well as in 10th grade (e.g., Algebra 2). In contrast, students who do not take algebra by eighth or ninth grade are unlikely to take any calculus courses before graduation (U.S. Department of Education, 2018). Further, students who failed Algebra 1 in ninth grade and recovered credit after 10th grade were less likely to graduate high school within four years (Rickles et al., 2017). Thus, math courses taken early in high school result in differential opportunities and outcomes years later.
When examining variations in students’ math course-taking trajectories, researchers have identified that these differences cannot be solely explained by their prior academic performance but are often influenced by students’ demographic characteristics, such as gender, race/ethnicity, and SES (Attewell & Domina, 2008; Huffaker et al., 2025; Kelly, 2009), as well as school characteristics, such as the urbanicity of the school, school size, and school poverty rates (Steiner et al., 2024). Specifically, students who are White, Asian, or have high SES were more likely to take the most advanced course sequences (Bozick & Ingels, 2008; Domina & Saldana, 2012; Huffaker et al., 2025; Riegle-Crumb & Grodsky, 2010). Other studies found that taking algebra in eighth grade positively influenced students’ enrollment in advanced math courses as well as math performance. Importantly, these effects were larger for female, Black, or ELL students than for their male, White, or non-ELL peers (McEachin et al., 2020). Regarding school characteristics, large, suburban, and low-poverty schools were more likely to offer advanced math courses compared to their counterparts (Steiner et al., 2024), indicating that students in small, nonsuburban, or high-poverty schools may have limited access to advanced math education.
Due to unequal access to upper-level math courses across different student-level and school-level characteristics, particularly race/ethnicity, some school districts have instituted policies that either seek to push more students into Algebra 1 by eighth grade (Rickles, 2013) or restrict all students from having access to algebra until high school (Schwartz, 2023). However, the debate is far from settled, and there are still many districts and states having ongoing and impassioned arguments about when students should be exposed to upper-level math courses (García, 2024; Napolitano, 2024; Velez, 2023).
In addition, there is still insufficient evidence about whether the COVID-19 pandemic further delayed students’ math course-taking trajectories, particularly for underrepresented students, compared to prepandemic levels. Thus, our second research question compares students’ math achievement and course-taking trajectories during the COVID-19 pandemic with the pre-COVID period. Additionally, in our final research question, we examine racial/ethnic group differences in their course-taking trajectories and math achievement.
Methods
Data Source
The data used for this study is taken from the NWEA anonymized longitudinal student achievement database. School districts across the country use NWEA MAP Growth assessments (NWEA, 2019) to monitor elementary and secondary students’ reading and math achievement and gains. Unlike state summative or end-of-course tests, MAP Growth assessments are typically administered multiple times in a school year, including in the fall (late August through November) and spring (late March through June). In middle and high school grades, schools have the option to administer either a general math assessment (aligned to middle/high school math standards) or a course-specific math assessment (Algebra 1, Geometry, and Algebra 2) to students. The assessment selected typically reflects a student’s course enrollment (an assumption we describe in further detail in the course roster section).
In this study, we follow two separate cohorts of students: (a) Cohort 1 moves from seventh to ninth grade between spring 2021 and spring 2023, and (b) cohort 2 moves from eighth to 10th grade between spring 2021 and spring 2023 (see Figure 1 for an illustration of the course pathways observed in each cohort). Both ninth and 10th grades are crucial periods in mathematics learning, as ninth grade encompasses both the transition to high school and high school graduation requirements, and 10th grade is when most students are first exposed to upper-level math courses beyond Algebra 1.
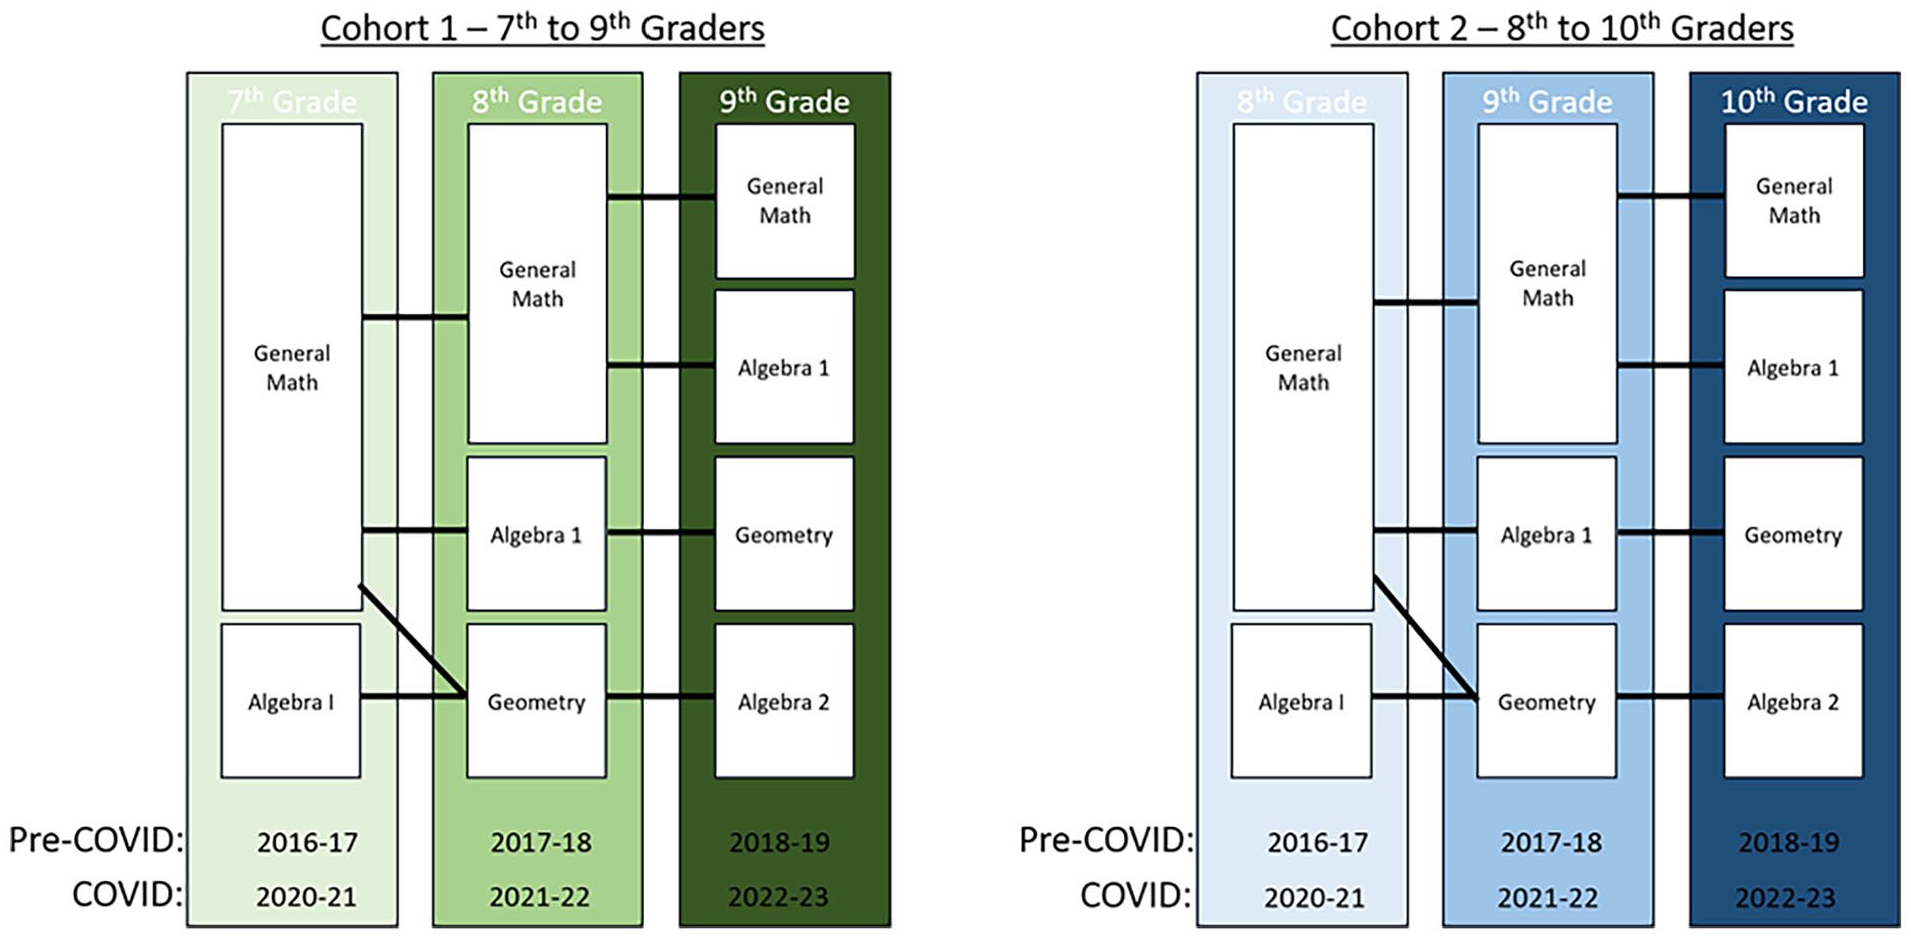
Course-taking sequences in our sample.
We further disaggregated each cohort by which math assessment (general math, Algebra 1, Geometry, or Algebra 2) was administered in the 2022–23 school year, resulting in eight separate samples collected during the pandemic. Leveraging eight different datasets enabled us to examine the relationship between various course-taking trajectories and subsequent math performance during the pandemic. Additionally, to understand how course-taking patterns and achievement differed from the COVID-19 and pre-COVID periods, we analyzed a parallel set of eight samples that were tracked across spring 2017 and spring 2019.
Measures
Test scores (MAP Growth general math and course-specific tests), roster information (course names), student demographic information, and school characteristics were collected for each student in our sample.
MAP Growth Assessment—General Math
MAP Growth is a computer-adaptive test that precisely measures achievement even for students above or below grade level. The test is vertically scaled to allow for the estimation of gains within and across grade levels. Test scores are reported on the RIT (Rasch Unit) scale, which is a linear transformation of the logit scale units from the Rasch item response theory model and ranges between 100 and 350. More information about the reliability and validity of the MAP Growth assessments can be found in the assessment’s technical manual (NWEA, 2019).
Students in middle and high school take the grade 6+ version of MAP Growth, which is aligned to math state content standards in grades 6–12. While the domains assessed in MAP Growth Math 6+ vary somewhat state by state, the most widely used version, which is aligned to the Common Core State Standards, covers operations and algebraic thinking, the real and complex number system, geometry, and statistics and probability. Most students (98.4%) in our analytical sample took the general math test in seventh and eighth grade, though a subset of students in middle school were already assessed with a course-specific assessment. We describe in the matching strategy how we handled the use of different assessments in middle school.
MAP Growth Assessment—Course-Specific Tests
Additionally, NWEA offers course-specific middle and high school math tests in Geometry, Algebra 1, and Algebra 2. The course-specific tests are designed to measure student learning during a course rather than as year-end evaluations (NWEA, 2022). The assessments are adaptive with course-specific content that is unrelated to the student’s grade when enrolled. Scores on the course-specific math assessments are on a separate scale from the general math assessments, ranging between 100 and 350. NWEA released its course-specific math tests in August 2017, and these tests were increasingly adopted throughout our sample period (see Table 1 for changes in sample size between the pre-COVID and COVID periods).
Student Characteristics for Analytic Sample

Note. N student = number of students; N schools = number of schools. The pre-COVID sample includes the 2016–17 to 2018–19 school years, while the COVID sample includes the 2020–21 to 2022–23 school years.
Course Rosters
Prior to the start of testing each term, school data administrators submit rosters to NWEA with one or more course enrollments for each student. Among other data points, these rosters include a required free-text field for the class name of each of the students’ reported enrollments (e.g., Santiago 8th Grade Math, Geometry - Grade 9, etc.). Because of the flexibility allowed by this field, there is a degree of heterogeneity across the schools with respect to the information that can be extracted from these course names. However, schools are incentivized to report complete and accurate rostering data during this process as assessment results are reported back to teachers at the classroom level based on these data.
While the type of MAP Growth assessment administered within each term served as the primary measure of individual students’ math course enrollment for students who took a course-specific assessment (Algebra 1, Geometry, or Algebra 2), course roster data were incorporated to confirm that a student’s assessment type was a reliable proxy for their course enrollment. Because the general math assessment is not specific to a single math course enrollment, we do not draw inferences about enrollment patterns based on the students who were administered this exam. In the online supplemental materials, we describe our process of (a) identifying course names from the roster text strings and (b) validating that students administered a course-specific assessment were in fact enrolled in a course covering that material.
Student and School Demographic Characteristics
The NWEA data also included student demographic information, including student race/ethnicity and gender at assessment, though student-level socioeconomic status was not available. We created one dummy variable on students’ gender (female = 0, male = 1) and six dummy variables on race/ethnicity (Asian, Hispanic, Black, White, American Indian or Alaska Native, and Native Hawaiian or Other Pacific Islander), with Not Specified or Other as a reference group. School-level characteristics, including urbanicity (i.e., dummy variables for rural, town, and suburban schools with city schools as the reference group), percent of students eligible for free or reduced-price lunch (FRPL), and enrollment were drawn from the 2018–2019 Common Core of Data (CCD) files collected by the National Center for Education Statistics.
Missing Data
To be included in the study, students were required to have at least one observed test event during the final school year of the study (2022–23 in the COVID period, 2018–19 in the pre-COVID period). Since our study followed students across three school years and districts opted into taking the MAP Growth tests each year, 76% of students had at least one term with missing test scores. Across the samples, less than 1% of students were missing information about race, and these students were recoded into the “Not Specified or Other” racial category. Additionally, 3% of students were in schools that we were unable to match to the CCD data to obtain school characteristics, and thus, these schools were dropped from the analysis. To address the pattern of missing RIT scores in our data, we used Mplus to do multiple imputations (Muthén & Muthén, 2017). We generated five imputed datasets per cohort and course combination. More detail on the multiple imputation approach is described in the online supplemental materials.
Analytical Sample Characteristics
Our total COVID sample consists of approximately 1.1 million students in 5,000 schools, while our pre-COVID sample consists of 732,000 students within a similar number of schools. Table A4 in the online supplemental materials compares the characteristics of our school samples (pooling across cohorts) with the population of U.S. public schools serving grades 7–10. Our sample contains approximately 1 in 10 U.S. public schools but is not nationally representative.
The top half of Table 1 provides the unweighted demographic characteristics of each of the eight samples during the COVID and pre-COVID periods. A few patterns are worth noting. First, there were sizable demographic differences in which students had access to upper-level math courses in our sample. For example, 11.2% of students in our COVID Algebra 2 sample were Asian and 39.1% attended urban schools, while only 3.2% of students in our COVID general math sample were Asian and 23.7% attended urban schools. Second, the proportion of White students in our COVID samples was lower than with our pre-COVID samples (ranging between 34.8% and 47.1% during COVID vs. 45.5% and 57.7% pre-COVID) while the proportion of Hispanic students was higher for the COVID samples (ranging between 26.6% and 32.9%) than for the pre-COVID samples (ranging between 9.3% and 23.8%).
These differences are likely due to two factors: (a) changing composition of students enrolled in specific courses over time and (b) shifts in the schools in the sample over time. Table A6 in the online supplemental materials shows the demographic differences across time when keeping the schools in the sample consistent across the two periods, which shows more muted differences. To account for the shifts in schools within our sample over time, we kept the larger (nonconsistent) sample of schools but employed a matching approach to reweight the sample to account for the sample differences across the pre-COVID and COVID periods.
Matching Strategy
To account for the demographic differences in our pre-COVID and COVID samples, we matched students from the pre-COVID and COVID periods using propensity scores (Lechner, 2002; Rosenbaum & Rubin, 1983). The propensity score model predicted whether a student was tested during the COVID period as a function of student-level covariates (i.e., race, gender, middle school test scores, and middle school test type) and school-level information (i.e., free and reduced price lunch eligibility, urbanicity, and racial and ethnic demographic breakdowns). We used the MatchIt package in R to calculate propensity scores using the subclassification method (Ho et al., 2011). The online supplemental materials provide more detail on this matching approach as well as a comparison to other available options.
The bottom half of Table 1 provides the demographic characteristics after applying propensity score weights. The end result was a closer match between the pre-COVID and COVID samples, particularly for Geometry and Algebra 2 students. These results are especially important given that students in subject-specific courses had some of the biggest differences in demographics between the pre-COVID and COVID periods.
Analytic Approach
Research Question 1—How has the COVID-19 pandemic affected general math achievement for students who were in high school during the 2022–2023 school year?
Students in our general math sample were assessed with the MAP Growth general math assessments on a consistent scale (math 6+) across middle school and the start of high school. This allowed us to estimate and compare growth rates both within and across grade levels, which allows for a clearer understanding of the timing of COVID effects. Consistent with prior longitudinal analyses of MAP Growth test scores in elementary and middle school (e.g., Kuhfeld et al., 2022c; Lewis & Kuhfeld, 2022), we used multilevel growth model analyses to examine differences in growth rates across the school year and summer in the pre-COVID and COVID periods. This modeling approach allows us to differentiate the degree to which COVID-19 affected growth while students were in and out of school, as well as to pinpoint exactly when the recovery period actually began.
Specifically, for cohort 1, we modeled students’ general math test scores from the spring of seventh grade to the spring of ninth grade, conditional on months during each school year and summer break. School calendars were obtained from districts to determine exactly when testing occurred relative to the start/end of each school year. Equation 1 below shows the primary growth model formulation for student i in school j at timepoint t:

where
In this model, the intercept
Time in our model was coded such that our intercept represents the predicted score at the end of ninth grade (for more details on the coding of time, see the online supplemental materials). We also included a set of interaction terms to estimate the difference in the term-specific growth rates as well as the difference in scores at the end of ninth grade, comparing the pre-COVID and COVID periods. Student-level and school-level random effects were included for the intercept. For cohort 2, we modeled from the spring of eighth grade until the spring of their 10th-grade year at the end of the sample period, using the isomorphic equation structure as cohort 1. Models were estimated using HLM8 separately for each cohort, with propensity score weights included at the student level. Results were then pooled across the five imputations.
RQ2: How do high school students’ Algebra 1, Geometry, and Algebra 2 course-taking and achievement levels during the COVID-19 pandemic compare to the pre-COVID period?
First, we examined whether the percentage of students enrolling in Algebra 1, Geometry, and Algebra 2 in ninth and 10th grade differed between our pre-COVID and COVID periods. We tracked enrollment based on course tests administered, but as described earlier, this measure was validated against actual roster data. We excluded the general math sample (which is by far the largest proportion of the overall sample) from this analysis because its test type (general math) did not correspond to a specific course enrollment.
Second, for each upper-level math course (Algebra 1, Geometry, Algebra 2) and cohort, we examined whether students’ high school spring math scores were lower during the COVID period compared to the pre-COVID period. In our first model (model 1), we only controlled for period (0 for pre-COVID, 1 for COVID). For model 1, the intercept β0j is the predicted score for student i in school j pre-COVID, and β1j is the predicted difference in that score due to COVID. We included random effects at the school level for both the intercept and the COVID indicator.
Level-1:

Level-2:

In our second model (model 2), we added controls for middle school math achievement, student race/ethnicity, and gender. Prior middle school math achievement was standardized, and school-level FRPL rates were grand mean centered prior to running the models. The intercept β0j now represents the predicted score for female students whose race is not specified or other and who have average middle school achievement.
Level-1:

Level-2:

In our third model (model 3), we added school-level characteristics (e.g., school-level FRPL and urbanicity). In this model, β0j is the predicted score for female students whose race is not specified or other, with average middle school achievement, and who attend urban schools with average FRPL rates.
RQ3: Do students’ Algebra 1, Geometry, and Algebra 2 achievement patterns differ by race/ethnicity?
For each math cohort taking upper-level math courses (i.e., Algebra 1, Geometry, Algebra 2), we also examined differences in COVID-19 impacts by racial/ethnic groups. This final model mirrored model 3 but also added interaction terms for race/ethnicity and the COVID period.
Results
RQ1: Evidence of Continued Rebounding in General Math Scores
Figure 2 compares the pre-COVID and COVID growth trajectories for each cohort that took the general math assessment in all three school years. The estimates shown in this figure were calculated based on the growth model parameters shown in the left half of Table 2 (adding student and school covariates to the model did not change our parameters meaningfully). In addition, to help with the interpretation of the score differences at each time point, we calculated the standardized difference between the pre-COVID and COVID estimates within a cohort/term (for more details on calculating the point estimates and standardized differences, see the online supplemental materials).

Score trajectories for the general math sample.
Model Parameters for General Math Multilevel Models

Note. SY = school year. The intercept represents the expected test score in the final term (spring 2023 in the COVID period, spring 2019 in the pre-COVID period).
p < .05. **p < .01. ***p < .001.
A few patterns are clear in Figure 2. First, students who were in eighth grade (cohort 2) during the first full year of the pandemic (2020–21) showed a moderate decline in their test scores by spring 2021 (.05 SD), a decline that was maintained through spring 2023 (.06 SD). However, following the drop occurring by spring 2021, the growth rates for cohort 2 were essentially parallel during the following two school years. Scores declined faster for our cohort 1 students during the summer of 2021 relative to the corresponding pre-COVID period (summer 2017). Additionally, we saw more evidence of differentiated growth patterns for cohort 1 in the subsequent two school years, with students mostly caught up by the spring of ninth grade.
RQ2. COVID Impacts on Course-Specific Tests
Course Enrollment Changes
Figure 3 shows the changes in students’ enrollment in Algebra 1, Geometry, and Algebra 2 in ninth and 10th grade between the pre-COVID and COVID periods. The majority of ninth-grade students (cohort 1) took Algebra 1 during both time periods (84% in pre-COVID, 80% in COVID period). However, the percentage of students taking Geometry in ninth grade did increase from 13% to 17% during the COVID pandemic. The majority of 10th-grade students (cohort 2) were enrolled in Geometry, with a slightly higher percentage (65%) during the COVID than the pre-COVID period (58%). About a fifth of 10th-grade students were enrolled in Algebra 2 during both periods.

Enrollment in high school math courses between pre-COVID and COVID periods.
Algebra 1
We estimated the COVID-19 impact on test scores in spring 2023 for students enrolled in Algebra 1 in ninth grade (cohort 1) or 10th grade (cohort 2). Table 3 shows the difference in test scores for the COVID-19 students relative to the pre-COVID students from models 1 to 3 for all courses and cohorts. Controlling for middle school math achievement as well as student/school demographics, there were no significant COVID differences for students in Algebra 1 in ninth grade. However, there was a significant negative effect (1.27 RIT points, .39 SD) for students in Algebra 1 in 10th grade.
COVID-19 Differences in Course-Specific Test Scores

Note. The Geometry sample included 231,639 students in cohort 1 and 117,621 students in cohort 2. The Algebra 1 sample included 45,913 students in cohort 1 and 31,662 students in cohort 2. The Algebra 2 sample included 7,897 students in cohort 1 and 37,135 students in cohort 2. Students in our Algebra 2 sample took a mix of math courses in middle school, so we also include a control variable for whether students took the general math or Algebra 1 test in middle school for that sample only.
p < .05. **p < .01. ***p < .001.
Geometry
Similar to Algebra 1, there were no significant COVID-19 impacts for ninth-grade students enrolled in geometry during the spring of 2023. However, there was a statistically significant negative difference in achievement between the pre-COVID and COVID periods (.93 RIT points, .22 SD) for 10th-grade Geometry students even after controlling for student and school-level covariates.
Algebra 2
The final set of analyses we ran was to estimate the impact of COVID-19 on students enrolled in Algebra 2 in ninth and 10th graders (both of which are accelerated course-taking pathways) during the spring of 2023. For Algebra 2, the same trends we saw in Algebra 1 and Geometry persist—namely that for ninth-grade Algebra 2 students, there was no significant COVID effect on test performance. However, for 10th-grade Algebra 2 students, there was a significant negative effect (1.31 RIT points, .54 SD), which represented the largest COVID effect among the three courses.
RQ3. Subgroup Differences on Course-Specific Tests
Algebra 1
We also compared COVID effects by racial/ethnic subgroups after controlling for our full set of covariates. The first panel of Figure 4 shows the model-implied mean estimate (as a point) and confidence interval (as a vertical line) for the Algebra 1 RIT scores during pre-COVID (left line with a circle) and COVID (right line with a triangle) for each racial/ethnic subgroup. We observed evidence of pre-COVID disparities in Algebra 1 achievement for our ninth grade cohort even after controlling for middle school math achievement, with Asian students outperforming other groups. However, we did not see evidence of disproportionate impacts of COVID-19 on certain racial/ethnic subgroups. Specifically, we observed small and insignificant COVID-19 drops across all racial/ethnic groups without a clear pattern of larger drops for individual groups.
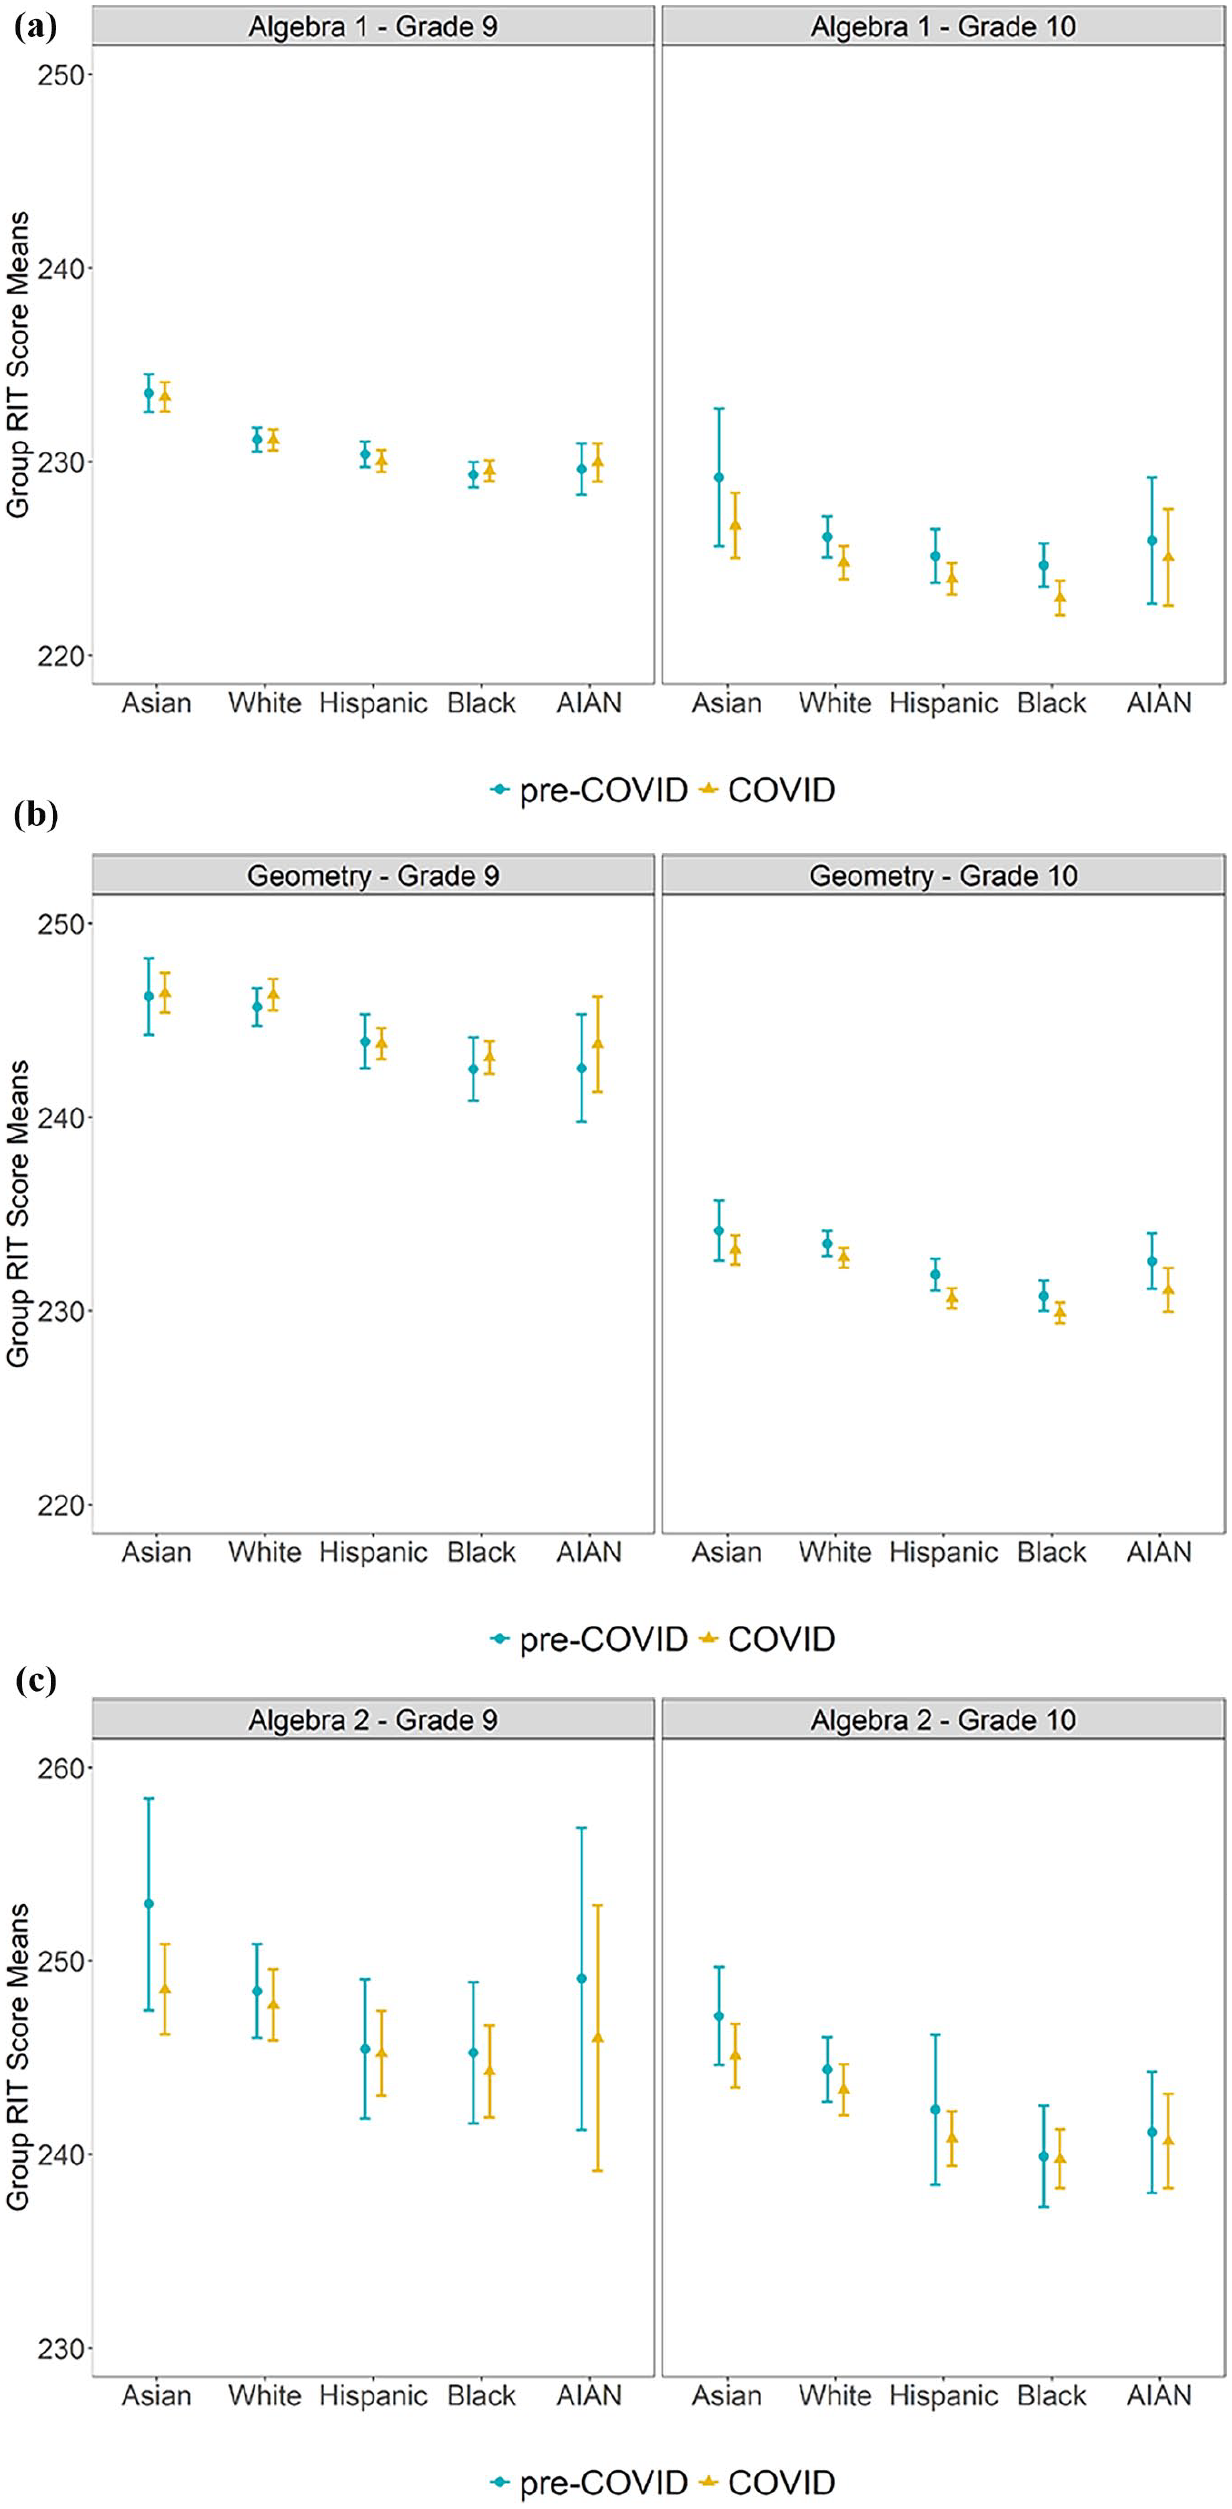
Test scores by race/ethnicity during pre-COVID and COVID periods: (A) Algebra 1, (B) Geometry, and (C) Algebra 2.
Geometry
For geometry students, there were significant differences in pre-COVID achievement by racial/ethnic subgroups, with especially notable disparities among Black and American Indian or Alaska Native students. Again, we observed these subgroup differences after accounting for a variety of factors (gender, locale, middle school achievement, etc.). Lastly, in line with findings for Algebra 1, there were no significant differential impacts of COVID between racial and ethnic subgroups for Geometry students.
Algebra 2
We did not see evidence of significant differences by race/ethnicity prior to or during the COVID-19 pandemic for students enrolled in Algebra 2 in ninth or 10th grade. However, it is important to note that our sample size was the smallest for the Algebra 2 sample (n = 7,897 in cohort 1, n = 37,135 in cohort 2) and the confidence intervals for each subgroup are much larger in this analysis (potentially masking a real effect).
Discussion
Research has shown that the COVID-19 pandemic negatively impacted students’ mathematics achievement in middle school, especially among those from underrepresented backgrounds (Cohodes et al., 2022; Fahle et al., 2023; Kuhfeld & Lewis, 2022a). However, little is known about how the pandemic affected students’ math achievement as they entered and progressed through high school. In addition, much uncertainty exists regarding how students’ high school math course-taking sequences have been impacted by the pandemic. In this study, we examined the lasting influence of COVID-19 on high school students’ math achievement and the associations among math course-taking trajectories, demographic characteristics, and math achievement during the COVID-19 pandemic.
This study had three main findings. First, the difference in math achievement between the COVID and pre-COVID cohorts emerged by 2021, and this gap persisted through spring 2023, though we observed some evidence of catch-up for ninth graders. Second, the effects of the pandemic on students’ math achievement varied depending on their math course-taking trajectories. While there were no statistically significant COVID impacts for students who were enrolled in upper-level math courses in ninth grade, significant negative COVID impacts were found for those who took those courses a year later in their 10th-grade year. Lastly, while there was some evidence of initial pre-COVID disparities in students’ Algebra 1 achievement across students’ racial/ethnic subgroups, there were no disproportionate impacts of COVID-19 on certain racial/ethnic subgroups after controlling for prior achievement. We discuss each of these findings in more detail.
Differences in Math Achievement Between the COVID and Pre-COVID Cohorts
Findings show that the differences in math achievement between the COVID and pre-COVID cohorts emerged by 2021, and students had not fully recovered by spring 2023. This aligns with other studies showing that the pandemic negatively affected students’ math achievement (Allen, 2022; Burkholder & Salehi, 2023; Lewis & Kuhfeld, 2021; The Nation’s Report Card, 2022). Regarding student recovery patterns, different trends emerged by cohort. Students who moved from seventh grade to ninth grade during the observed period showed a steeper decline at the beginning of the COVID, though they had nearly caught up with their pre-COVID counterparts by the end of the period. On the other hand, the students who moved from eighth grade to 10th grade during the same period showed a moderate decline compared to their pre-COVID counterparts, and the achievement gap between the two cohorts did not narrow by the end of the period.
The Effects of COVID Vary Depending on Math Course-Taking Trajectories
Despite ample evidence that students entering high school during the pandemic may have lower test scores than prior classes, we observed that the rates of enrollment in upper-level courses in high school had not meaningfully shifted in the 2022–23 school year. Among ninth graders, the percentage of students on an accelerated course (e.g., taking Geometry in ninth grade) may have even ticked up a bit. The lack of change in course enrollment is perhaps not surprising given that most course placement decisions are made based on a range of factors rather than strictly test score cut-offs (Wolfe et al., 2023).
Findings indicated that the impact of the pandemic on students’ math achievement varied depending on their cohort and course-taking trajectories. Specifically, the students in cohort 1 who took the most common math sequence (i.e., general math in eighth grade and Algebra 1 in ninth grade) as well as those on accelerated sequences (i.e., Algebra 1 in eighth grade and geometry in ninth grade or general math/Algebra 1 in seventh grade, geometry in eighth grade, and Algebra 2 in ninth grade) were not significantly affected by the pandemic after accounting for prior math achievement and other student-level and school-level covariates. However, the students in our cohort 2 who took the delayed sequence (i.e., general math in ninth grade and Algebra 1 in 10th grade), the most common sequence (i.e., Algebra 1 in ninth grade and geometry in 10th grade), or the accelerated sequence (i.e., Geometry in ninth grade and Algebra 2 in their 10th grade) were negatively affected by COVID compared to their pre-COVID counterparts after accounting for prior math achievement and other student-level and school-level covariates. While this study does not allow us to tease apart why the students in the most common or the accelerated sequences in 10th grade (i.e., cohort 2) were negatively affected by COVID, it is noteworthy that students in a similar sequence in ninth grade and expected to take Algebra 2 in 10th grade in 2023–2024 (i.e., cohort 1) were not negatively affected. This suggests that there may be grade-level effects, in addition to course-sequence effects, impacting student math achievement during the pandemic. This finding seems to be consistent with the results of Lewis & Kuhfeld (2023), who used MAP Growth data, and Kogan and Lavertu (2022), who investigated how the COVID-19 pandemic affected student math learning in Ohio as of 2021. Both studies indicated that students in later grades (i.e., seventh and eighth grade) experienced larger math achievement declines compared to those in lower grade levels (i.e., fifth and sixth grades), suggesting substantial grade-level effects on student math achievement during the pandemic.
One possible explanation for this grade-level effect is that higher-grade students experienced greater anxiety and pressure, which may have had a stronger negative impact on their learning than on lower-grade students. High school students reported higher levels of anxiety and depression than middle school students during the pandemic, largely due to schoolwork stress, lack of engagement, and learning challenges (Demaray et al., 2022; Styck et al., 2021). With a heavier academic workload and the added pressure of preparing for college or future careers during the pandemic, they experienced greater stress than lower-grade students, which may have further hindered their achievement.
While much pre-COVID research has demonstrated a positive association between students’ early access to Algebra 1 and their later math achievement (Domina et al., 2014; Smith, 1996), and a negative impact of delayed access to upper-level mathematics on student outcomes (Rickles et al., 2017; U.S. Department of Education, 2018), our findings seem to be aligned with the studies showing that a heterogeneous effect of early algebra access on student math achievement (e.g., McEachin et al., 2020). Our findings suggest that early exposure to upper-level mathematics may benefit some students who are prepared or are at certain grade levels, but not all students. This study is particularly relevant to current national debates about whether or when to provide early access for all to algebra in middle school, with the recent movement in some school districts to make student access to advanced math courses more equitable and bring back universal access to eighth-grade algebra (García, 2024; Napolitano, 2024).
Differences in Math Achievement by Racial/Ethnic Subgroups
Lastly, we investigated how students in racial/ethnic minority groups were differentially affected by the COVID pandemic. While most prior studies have found that racial/ethnic or environmental inequalities in students’ achievement widened during the COVID-19 pandemic, with larger learning delays for students of color or those attending high-poverty schools (Cohodes et al., 2022; Kogan & Lavertu, 2021; Kuhfeld et al., 2022b, 2022c; West & Lake, 2021), our results indicated no significant differences in math achievement during the pandemic by racial/ethnic subgroups after controlling for covariates, including middle school math achievement.
This discrepancy may be attributed to our study’s focus on high school students’ math achievement, whereas other previous studies examined elementary or middle school students’ achievement. In addition, it might be due to our focus on course-specific assessments on upper-level math courses (i.e., Algebra 1, Geometry, and Algebra 2) rather than general math assessment scores. As the students included in these analyses took at least one upper-level math course by their ninth or 10th grade, our sample might be initially different from students who never enrolled in upper-level math courses by 10th grade.
Further, it is important to note that our results revealed significant pre-COVID disparities in Algebra 1 and Geometry achievement, with Asian students outperforming other race/ethnic groups in Algebra 1, and notable disparities observed among Black and Native American students in Geometry. Thus, while our results indicate that the COVID-19 pandemic did not widen the achievement gap between racial groups, it is important to recognize that significant racial disparities in math achievement still persist, particularly for minority students.
Limitations
There are a few limitations of our study worth noting. First, our propensity score matching strategy may not have been sufficient to account for differences between the pre-COVID and COVID periods. We included controls in our models for key covariates (race/ethnicity, school percent FRPL), but it is possible that there were unobserved differences between covariates that we were unable to account for. Additionally, we were limited by not having a student-level measure of economic disadvantage to use in our matching approach and analyses.
Second, while we control for middle school achievement when examining COVID-19 differences in high school test scores, our middle school test scores were from spring 2021, which most likely already have COVID impacts baked in. We conducted a sensitivity analysis (described in the online supplemental materials) that followed a subset of students in our COVID sample back to spring 2019 to better understand how racial/ethnic differences emerged during the beginning of the COVID-19 pandemic. We observed that the test score differences between our pre-COVID and COVID racial/ethnic subgroups samples were smaller in 2019 than in 2021, implying our middle school math achievement control may not fully account for differences emerging in the early stages of the pandemic.
Third, while our sample is large (approximately 10% of public schools serving grades 7–10), it is not nationally representative and may not generalize to the student population of U.S. high schools. Finally, it is important to note that all students in our sample were in middle school (i.e., sixth or seventh grade) when COVID-19 first hit. Therefore, it is possible that incoming high schoolers, who were in elementary school when COVID led to extended school closures and likely missed out on more fundamental math building blocks, might show larger negative effects of the pandemic on their math achievement.
Conclusion
In conclusion, while we found a gap in math achievement between the COVID and pre-COVID cohorts persisted through spring 2023 and observed significant negative impacts of the pandemic for students who took advanced math courses during their 10th-grade year compared to their pre-COVID counterparts, we did not find significant race/ethnicity performance gap in high school math courses widened as much as anticipated based on prior middle school test results (Cohodes et al., 2022; Fahle et al., 2023; Kuhfeld & Lewis, 2022a). However, it is important to note that substantial racial disparities in math achievement continue to exist, especially among minority students. Together, our findings suggest the need for continued support to close the achievement gaps between the COVID and pre-COVID cohorts and to ensure equitable access to resources for minority students. These findings have particular urgency as federal ESSER funds expired in fall 2024, well before the students in high school will have fully recovered from the pandemic impacts. Given the pivotal role of early high school math opportunities for college enrollment and later outcomes, states should explore alternative funding mechanisms to ensure high school students are still able to access tutoring and additional support after the expiration of federal funds.
Further, our results indicate that the percentage of high school students on accelerated math course-taking trajectories is largely unchanged since before the pandemic. This study cannot provide direct answers to the ongoing debate in many districts and states around how early students should have access to algebra content, but our results do indicate that the relationship between prior achievement and performance in advanced math courses was complicated by the timing of the COVID pandemic. Students on accelerated math course trajectories who had their coursework in upper middle school grades interrupted by COVID school closures showed negative effects of COVID on their spring 10th-grade test scores, implying additional learning opportunities may be needed even for students on more advanced math tracks. Without additional support, these disparities will create a range of challenges for students interested in pursuing STEM fields in higher education in the upcoming years.
Supplemental Material
sj-docx-1-ero-10.1177_23328584251353514 – Supplemental material for High School Math Course-Taking: Shifts in Access and Achievement Post-COVID-19
Supplemental material, sj-docx-1-ero-10.1177_23328584251353514 for High School Math Course-Taking: Shifts in Access and Achievement Post-COVID-19 by Megan Kuhfeld, Gustave Robinson, Jazmin Isaacs, Sofia Postell, Ji-Eun Lee and Erin Ottmar in AERA Open
Footnotes
Declaration of Conflicting Interests
The author(s) declared no potential conflicts of interest with respect to the research, authorship, and/or publication of this article.
Funding
The author(s) disclosed receipt of the following financial support for the research, authorship, and/or publication of this article: This research was funded by the Walton Family Foundation and stewarded by the Center on Reinventing Public Education.
Note: This manuscript was accepted under the editorial team of Kara S. Finnigan, Editor in Chief.
Authors
MEGAN KUHFELD is the director of growth modeling and analytics at NWEA. Her research seeks to understand students’ academic and social-emotional trajectories and the school and neighborhood influences that promote optimal growth.
GUSTAVE ROBINSON is a data analyst at NWEA. His current research focuses on the distribution of K–12 curricular opportunities.
JAZMIN ISAACS is a research analyst at NWEA. Her research interests include quantitatively and qualitatively examining the continued impact of COVID-19 on early learners, as well as the effectiveness of various recovery efforts.
SOFIA POSTELL is a research analyst at NWEA. She supports a variety of projects concerning academic recovery and measuring trends in student achievement.
JI-EUN LEE is a research scientist at the Learning Sciences and Technologies at Worcester Polytechnic Institute. Her research interests focus on applying learning analytics and educational data mining techniques to improve instructional design and student learning in online learning environments.
ERIN OTTMAR is an associate professor of learning sciences, technology, and psychology at Worcester Polytechnic Institute. Her research focuses on the design, development, and testing of innovative technology interventions that embed cognitive, developmental, perceptual, and educational principles of learning into everyday mathematics practice.
References
Supplementary Material
Please find the following supplemental material available below.
For Open Access articles published under a Creative Commons License, all supplemental material carries the same license as the article it is associated with.
For non-Open Access articles published, all supplemental material carries a non-exclusive license, and permission requests for re-use of supplemental material or any part of supplemental material shall be sent directly to the copyright owner as specified in the copyright notice associated with the article.