
Abstract
Propensity score matching was used to compare third-grade test scores in English language arts, mathematics, science, and social studies for children who had and had not participated in Georgia’s Pre-K 4 years earlier. After matching, each group included 46,262 children (mean age 8.36 years in third grade). In all subject areas, children who had participated in Georgia’s Pre-K scored significantly higher (Cohen’s D = .06 to .09), and pre-K participation was associated with an 11% to 17% increase in the odds of scoring proficient or above. Among children enrolled in free or reduced-price lunch, participation in Georgia’s Pre-K was associated with higher test scores and greater likelihood of scoring proficient or above; however, the opposite was true for children not enrolled in free or reduced-price lunch. Associations between pre-K participation and math scores were stronger for children whose home language was not English as compared to those whose home language was English.
Introduction
Public Pre-K Programs
Nationally, in 2017, more than 1.3 million 4-year-olds attended state-funded, public pre-K programs across 43 states and the District of Columbia, and state spending on those programs exceeded $7.6 billion (National Institute for Early Education Research, 2018). Participation in intensive, small-scale, multiyear early care and education programs has been linked to a range of long-term positive outcomes in adulthood, including higher high school and college graduation rates, higher employment rates, and reduced likelihood of receiving welfare (Belfield et al., 2006; Campbell et al., 2002). Whether there are also benefits linked to large, less intensive, single-year programs, such as state-funded pre-K, is of interest to researchers, educators, parents, and policy makers. The current article explores this question for one of the nation’s largest and oldest universal pre-K programs, by comparing third-grade state-administered standardized test scores in English language arts (ELA), mathematics, science, and social studies for children who did and did not participate in Georgia’s Pre-K.
A recent report from the Brookings Institution reviewed the short- and long-term impact of public pre-K programs and concluded that there is evidence for large effects of pre-K participation as children enter kindergarten, but evidence for positive longer term effects of pre-K participation is mixed (Phillips et al., 2017). Several studies are similar to the current article in that they considered associations between pre-K participation and state-administered standardized test scores in elementary school, including studies conducted in Arkansas (Jung, Barnett, Hustedt, & Francis, 2013); Arlington, Virginia (Arlington Public Schools, 2010); Colorado (Colorado Department of Education, 2015); Louisiana (Ramey, Ramey, & Asmus, 2011); Michigan (Xiang & Schweinhart, 2002); New Jersey (Barnett, Jung, Youn, & Frede, 2013); New Mexico (New Mexico Legislative Finance Committee, 2016); North Carolina (Dodge, Bai, Ladd, & Muschkin, 2017); Tulsa, Oklahoma (Hill, Gormley, & Adelstein, 2015); Tennessee (Lipsey, Farran, & Durkin, 2018); Texas (Andrews, Jargowsky, & Kuhne, 2012); and Washington (Bania, Kay, Aos, & Pennucci, 2014). Most of these studies focused on solely ELA or math tests, but a few included science and/or social studies as well.
As Phillips and colleagues (2017) described, the findings from these studies have been mixed. Most reported positive associations between pre-K and standardized test scores in elementary school. For example, in North Carolina, Dodge and colleagues (2017) found that children who went to the state pre-K program had higher third-grade math and reading scores. Likewise, in Michigan, Xiang and Schweinhart (2002) found that children who went to their state pre-K program were more likely to pass fourth-grade literacy and math tests.
In many states, however, the findings were more nuanced. For instance, in Arkansas, Jung et al. (2013) found that pre-K attendance was associated with higher scores in language, math, and literacy at the end of first and second grade, but only with literacy at the end of third grade. Arlington Public Schools (2010) found that overall, children who had participated in pre-K scored about the same as those who had not on third-, fourth-, and fifth-grade reading, math, history, and science tests; however, when looking only at economically disadvantaged students, those who attended pre-K scored higher than those who had not on third-grade math and history (but not reading or science) and in fourth- and fifth-grade reading and math (but not science or history).
In Tulsa, the pre-K program is one of a few in the nation that is universal, like Georgia’s, meaning there are no income or risk requirements for enrollment; all children in the state who meet the age requirements are eligible, though a slot is not guaranteed. Hill and colleagues (2015) looked at third-grade math and reading test scores and found evidence that boys who participated in pre-K had higher math scores in third grade than boys who did not participate, but no evidence of differences in math scores were found for girls, and no differences were found for children’s reading scores. A more recent study in Tulsa that followed children into middle school found a main effect for standardized tests in math, but not for reading (Gormley, Phillips, & Anderson, 2018). When looking at various subgroups, the authors found a significant association between pre-K participation and seventh-grade math scores for children eligible for free lunch, but the association was nonsignificant for those eligible for reduced-price lunch and marginal for paid-lunch students. Further, they found that students who had been English language learners at any point during their schooling had marginally higher seventh-grade math scores if they had been to pre-K, but there was no effect of pre-K for students who had never been English language learners.
Researchers in Louisiana (Ramey et al., 2011) examined the association between pre-K participation and test scores in four academic areas: ELA, math, science, and social studies. These are the same four areas included in the current article. They found that children who had attended Louisiana’s pre-K program, which targets low-income children, were more likely to score in the “basic or above” category in all four areas in third grade than low-income children who had not attended the pre-K program.
Lipsey and colleagues’ (2018) study of Tennessee’s targeted pre-K program, the only study to randomly assign children to program participation or not, tracked children’s achievement through third grade. Despite outperforming their nonparticipating peers at the beginning of kindergarten, the groups did not differ at the end of kindergarten, and by second and third grade, the pre-K program participants scored lower in math and reading than nonparticipants.
Given the mixed evidence of sustained benefits of participating in a public pre-K program, it would be useful to know the outcomes associated with a well-established system with universal reach such as Georgia’s. Past research indicates that pre-K’s benefits accrue more to some groups of children than others, but there is not consistent evidence regarding various subgroups. In addition, most studies linking pre-K to later skills focus on math and ELA; few examine science or social studies, and there are no consistent patterns in the associations between pre-K and particular academic domains in elementary school. Additional research, including a large sample and four academic domains, will add to the collective body of evidence, helping the field better understand the role of pre-K in elementary school success.
Georgia’s Pre-K Program
Georgia’s Pre-K, administered by Bright From the Start: Georgia Department of Early Care and Learning (DECAL), aims to provide high-quality preschool experiences to 4-year-olds to help prepare them for kindergarten. Georgia first began implementing its pre-K program in 1992, creating the nation’s first state-funded universal pre-K program in 1995. Georgia’s Pre-K is offered in all 159 counties across the state and served 84,000 4-year-olds in the 2016–2017 school year. The program is offered in a variety of settings, including private childcare, local schools, Head Start centers, military bases, technical colleges, and not-for-profit programs. All lead teachers are required to hold a minimum of a 4-year degree in early education or a related field, and in 2016–2017 almost three quarters of teachers were certified to teach early childhood education. Each classroom also employs an assistant teacher who is required to have at least a Child Development Associate credential. A strength of Georgia’s Pre-K is its monitoring and technical assistance system. Each program is assigned a pre-K consultant, who ensures compliance with the program’s standards while also providing training and technical assistance (see Bright From the Start, n.d., for further information).
Using a regression discontinuity design, Peisner-Feinberg, Schaaf, LaForett, Hildebrandt, and Sideris (2014) found that participation in Georgia’s Pre-K had significant positive effects on children’s school readiness skills, including language, literacy, and math, as they entered kindergarten. Likewise, a study by Henry and Rickman (2004) in the early 2000s followed children in Georgia’s Pre-K through first grade and compared their early academic gains to children who attended Head Start or private preschool. Overall, they found gains among children in these groups did not differ significantly on any of 16 early academic outcomes, such as receptive language, expressive language, and cognition. There has not been a study in the past decade that has examined outcomes at later grades for Georgia’s Pre-K children compared with those who did not attend, although a longitudinal study is under way. That study is following children who attended Georgia’s Pre-K through at least fourth grade and will compare them with a sample of children who did not participate in Georgia’s Pre-K or any comparable service on academic and social skills, using nationally normed measures administered by the research team (B. Ponder, personal communication, February 1, 2019).
Current Study
This study compares third-grade test scores from Georgia Milestones End-of-Grade (EOG) tests for children who did and did not attend Georgia’s Pre-K, after creating matching samples. This work expands the existing literature in several ways. First, Georgia’s Pre-K is one of the largest and oldest in the country, allowing for consideration of pre-K’s benefits well after the initial start-up and scale-up phases. States and programs that have seen benefits from newer or smaller scale efforts can benefit from knowing how Georgia’s program is working after more than 20 years of implementation. Second, Georgia’s Pre-K Program is unusual in that it is universal. Most state pre-K programs are available only to children from low-income homes or who have other risk factors. Tulsa’s findings indicate that universal pre-K is associated with medium- and long-term outcomes for some, but not all, children (Gormley et al., 2018; Hill et al., 2015). Asking similar questions in a different universal pre-K program can elucidate the role of pre-K for children from different backgrounds. Finally, this study complements the ongoing longitudinal study of Georgia’s Pre-K by looking at an entire cohort of Georgia’s third graders, rather than a study sample, and using the state’s standardized test scores, which reflect the state’s educational standards rather than assessments administered by researchers, which can be compared to national norms.
Importance of third-grade test scores
We selected third-grade test scores as outcomes for this study because third grade is the first time that all children in Georgia’s public schools are assessed using the same test, so it is the first time that children who did and did not attend pre-K can be compared statewide. Further, third-grade skills are predictors of later skills. With each higher grade in elementary school, reading is increasingly required for learning; children who start fourth grade without being proficient in reading cannot benefit from a substantial portion of the curriculum, which relies on reading (Annie E. Casey Foundation, 2010). Reading at or above grade level in third grade is a strong predictor of eighth-grade reading skills, high school graduation, and college attendance (Hernandez, 2011; Lesnick, Goerge, Smithgall, & Gwynne, 2010). There is less research regarding the importance of third-grade math, science, and social studies achievement, but states and schools are increasingly focused on these domains due to the importance of science, technology, engineering, and math education and careers (Gonser, 2018a; Mongeau, 2018), coupled with the importance of social studies in promoting critical thinking and civic participation in our increasingly diverse society (Gonser, 2018b).
Moderation
In addition to main effects, the current article looks at the benefits of pre-K for two subgroups of children of special interest to Georgia’s leadership: those from low-income families and dual language learners (DLLs). Advocates often cite pre-K’s potential to lessen achievement gaps and increase readiness among children at risk for school difficulties as a key rationale for public support and funding (Friedman-Krauss, Barnett, & Nores, 2016; Klein & Knitzer, 2006). Indeed, there is some evidence that high-quality early education experiences are especially beneficial for low-income students and students with other risk factors (Burchinal, Peisner-Feinberg, Bryant, & Clifford, 2000; Votruba-Drzal, Coley, Koury, & Miller, 2013), although the evidence is mixed (Valentino, 2018).
While Georgia’s Pre-K is not means tested, Georgia’s Pre-K leadership sees reducing the achievement gap between children from low-income families and their middle- and upper-income peers as one of their aims. Further, DECAL is committed to ensuring that children from lower income homes have access to high-quality early education experiences and has implemented several programs focused on supporting lower income families through the Child Care Development Fund. In addition, Georgia’s rapidly growing population of DLLs is of particular interest to Georgia’s Pre-K administrators (B. Ponder, personal communication, February 1, 2019). In one of the first reports from the ongoing longitudinal study of Georgia’s Pre-K, Peisner-Feinberg, Schaaf, and LaForett (2013) reported that children who were Spanish-speaking DLLs began their pre-K year significantly behind their same-age peers on several early academic measures. At the end of pre-K they had demonstrated growth in skills in both English and Spanish, but their skills still lagged markedly in comparison to children from English-speaking homes. Based on those findings, DECAL leadership created the Rising Pre-K Summer Transition Program to provide additional supports and resources to DLLs in the summer before children begin their formal Georgia’s Pre-K experience. Thus, understanding possible differential associations between pre-K participation and school success for children from different income and home language groups is important to DECAL (B. Ponder, personal communication, February 1, 2019).
Hypotheses
Based on research in other states and Georgia, we hypothesize that (a) participation in Georgia’s Pre-K will be associated with higher scores on third-grade standardized tests in ELA, mathematics, science, and social studies; (b) participation in Georgia’s Pre-K will be associated with a higher probability of being proficient on third-grade standardized tests in all four subject areas; (c) participation in Georgia’s Pre-K will be more strongly associated with third-grade scores and proficiency for children enrolled in free or reduced-price lunch (FRL) than those who are not in all four subject areas; and (d) participation in Georgia’s Pre-K will be more strongly associated with third-grade scores and proficiency for children whose home language is not English than those whose first language is English, in all four subject areas.
Method
Data Source
All data come from the Georgia’s Academic and Workforce Analysis and Research Data System (GA•AWARDS), a statewide longitudinal data system that combines education and workforce data from 10 state agencies to support research and informed decision making. The authors requested and received deidentified records for all third graders in public school in Georgia in 2015–2016. The file included a variable indicating whether each child had participated in Georgia’s Pre-K in 2011–2012 as well as Georgia Milestone EOG test scores and demographic characteristics.
Sample
A total of 137,858 students were included in the data set received from GA•AWARDS, representing all children enrolled in third grade in a public school in Georgia in 2015–2016. We included all of these students in our analysis, except 1,548 who did not have Georgia Milestone EOG test scores because they had significant cognitive disabilities and took an alternative assessment. Therefore, our initial analytic sample includes a total of 136,310 students. Their mean age in third grade was 8.36 (SD = 0.48) years. More than 99% of the children were between the ages of 8 and 10, with very small numbers of children younger than 8 (n = 128) or older than 10 (n = 100).
Analysis Variables
Pre-K participation
The key predictor in our analysis was whether the student participated in a Georgia’s Pre-K Program in the 2011–2012 school year. This information was provided to GA•AWARDS by DECAL. For the remainder of this article we call those who participated in Georgia’s Pre-K pre-K students and those who did not non-pre-K students.
Third-grade standardized test scores
According to the Georgia Department of Education (2015), the Georgia Milestones EOG assessments are summative tests designed to provide information about how well a student has mastered the grade-level state-adopted content standards in ELA, mathematics, science, and social studies. All students are required to participate in the Georgia Milestones tests at the end of Grades 3 through 8, except those with significant cognitive disabilities, who are excluded from the current analyses because they take the Georgia Alternate Assessment instead (Georgia Department of Education, n.d.). For each EOG assessment, a student receives a scale score as well as an achievement level designation: (a) beginning, (b) developing, (c) proficient, and (d) distinguished. According to Georgia Milestones, children who score in the proficient or distinguished groups are prepared for the next grade. Those who score in the beginning or developing groups are likely to need additional support to be prepared for the next grade (Georgia Department of Education, 2018). An independent evaluation of Georgia Milestones Assessment System concluded that GaDOE [Georgia Department of Education] has engaged in a test and item development process that meets professional standards for quality and rigor and that the EOG and EOC [End-of-Course] assessments in its Georgia Milestones Assessment System adequately reflect the Georgia state–mandated academic content standards. (P. 4; see also Forte, Towles, Greninger, Buchanan, & Deters, 2017)
In 2015–2016, the third-grade ELA test included 60 items covering reading, vocabulary, writing, and language. Only 54 of the items were used to determine the student’s score; the remaining 6 were field test items. Of the 54 items used to determine the score, 50 were multiple-choice items, 3 were constructed-response or short answer, and 1 was an extended writing item requiring students to write an opinion or informative/explanatory response after reading two passages. Students had up to 240 min to complete the ELA test (Georgia Department of Education, 2015). The reliability coefficient for the third-grade ELA test was .89 (Georgia Department of Education, 2016).
The third-grade math test included 73 items, 64 used for scoring and 9 used for field testing. Of the 64 used for scoring, 61 were multiple-choice, and 3 were constructed-response items. The content covered four broad domains: operations and algebraic thinking, numbers and operations, measurement and data, and geometry. Students had up to 170 min to complete the test (Georgia Department of Education, 2015), and the reliability coefficient was .92 (Georgia Department of Education, 2016).
The third-grade science test included 75 items (65 for scoring and 10 for field testing), all of which used a multiple-choice format. The content covered three broad domains: earth science, physical science, and life science. Students had up to 140 min to complete the test (Georgia Department of Education, 2015), and the reliability coefficient was .91 (Georgia Department of Education, 2016).
The third-grade social studies test included 75 multiple-choice items (66 for scoring and 9 for field testing). The four broad content areas were history, geography, government/civics, and economics. Students had up to 140 min to complete the test (Georgia Department of Education, 2015), and the reliability coefficient was .91 (Georgia Department of Education, 2016).
In our analytic models for this study we included the scale score as a continuous outcome. ELA scores ranged from 236 to 830 (M = 503.77, SD = 57.18), mathematics scores ranged from 290 to 705 (M = 515.65, SD = 46.78), science scores ranged from 315 to 695 (M = 508.46, SD = 43.07), and social studies scores ranged from 311 to 680 (M = 505.50, SD = 43.11). Scale scores of each of the four subjects were normally distributed (skewness ranged from .18 to .46; kurtosis ranged from 2.92 to 3.27), and there were no outliers.
In addition, for each subject area, we divided students into two groups based on their designated achievement levels. One group included students who did not reach the proficiency level, with designated levels of beginning and developing learners. The other group included students who reached the proficiency level, with designated levels of proficient and distinguished learners. We included students’ membership in these two groups as a dichotomous outcome.
Matching variables
For these analyses, children who had and had not participated in Georgia’s Pre-K were matched on child age (in years), gender, race (Black or African American, White, and other), and ethnicity (Hispanic or not; see next section for additional details about the matching procedures). Records from third grade were used for these variables because those are the most complete, and we did not anticipate that they would change during the early elementary grades. In addition, we included three covariates measured in kindergarten: student’s enrollment in FRL, whether the child’s home language was English, and whether the student had an identified disability. Kindergarten records were used because these are characteristics that might change over time, and they are intended to be measures of differences between children prior to pre-K participation. However, for non-pre-K students, kindergarten records were the earliest available, so we selected those to ensure that the data are comparable for the pre-K and non-pre-K students.
In addition, children in the two groups were matched on the kindergarten school they attended in an effort to reduce unobserved differences in the selection process (Cook, Shadish, & Wong, 2008). Including kindergarten school helps to account for differences that the two groups may demonstrate in third grade as a result of attending schools that vary in quality and neighborhood effects (e.g., availability of Georgia’s Pre-K, quality of other early childhood programs in the area). Of course, it does not fully account for these differences, because children can change schools or attend schools outside their neighborhood, and elementary quality varies across years, but it does strengthen the equivalence of the two groups.
All children had valid third-grade demographic information, but kindergarten demographic and school information was missing for 25,445 (19%) of the 136,310 students in our analysis because they were not enrolled in a public kindergarten in Georgia in 2015–2016. Those children were retained in the sample, and pre-K students with missing kindergarten demographics were matched with non-pre-K students with missing kindergarten demographics. Compared to the group with reported kindergarten demographics, the group with missing kindergarten demographics includes slightly older children (8.7 years old vs. 8.4 years old in third grade), more boys (53% vs. 50%), more African American children (42% vs. 37%), and fewer White children (44% vs. 51%). All regression analyses include a dummy variable indicating whether kindergarten demographics were missing (1) or not (0), as suggested by Cohen and Cohen (1975).
Analytical Approach
Students who participated in Georgia’s public pre-K program were likely different from those who did not attend in many ways, not just pre-K attendance. To the extent possible, it is essential to remove preexisting differences between the two groups to increase our confidence that differences seen at the end of the third grade were not the result of differences that existed before pre-K. To this end, we employed Rosenbaum and Rubin’s causal effect framework (Rosenbaum & Rubin, 1983; Rubin, 2001) in which inference about the impact of a treatment involves conjecture regarding what the outcome for targeted individuals would be if they had not received the treatment. Specifically, we conducted propensity score matching to ensure balance between students who did and did not participate in Georgia’s Pre-K. Balance indicates the two groups of students are comparable regarding a set of covariates and hence implies that pre-K attendance is, on average, independent of this set of covariates.
Propensity score matching
We first employed logistic regressions to predict a propensity score for each student, defined as the conditional probability of participating in Georgia’s Pre-K Program given each student’s value on the full set of covariates. We selected non-pre-K students to match pre-K students. That is, we created a matched sample on the variables described above (age, gender, and race/ethnicity; FRL; home language; identified disability; kindergarten school). To minimize data loss, we also matched exactly on the missing status of kindergarten demographic factors, so that a non-pre-K student who did not have recorded kindergarten demographic factors was matched to a pre-K student who also did not have such records.
We matched students with replacement. That is, one non-pre-K student could be matched to multiple pre-K students who attended the same kindergarten school. We used a caliper width of .1 to ensure a sufficiently close match in propensity scores between the two groups (Caliendo & Kopeinig, 2008). We conducted propensity score matching using self-written programs and functions based on the Matching package in R (Sekhon, 2011).
Match quality
We conducted three tests to assess the quality of the match, based on the recommendations of Rubin (2001). The first was the most intuitive, calculating standardized mean differences (SMDs) of the covariates between matched pairs after propensity score matching (see Appendix Table 1). After matching, the SMDs were between –.002 and +.008, markedly smaller than the acceptable range of –.1 and +.1, and none were statistically significant, indicating balance between the matched pre-K and non-pre-K groups, conditional on observed covariates. The second method involved calculating the SMD of propensity scores of the two groups. Rubin indicated it should be less than .25; in our sample it was <.001. The third method involved calculating the ratio of the variances of the propensity scores in the two groups. Rubin indicated that it should be between 0.5 and 2.0; in our sample, it was 1.0.
Multilevel modeling
After propensity score matching, we employed multilevel models on matched pairs. In our multilevel models, students were nested within their kindergarten schools. All other matching variables (other than kindergarten school) were included as covariates because even after matching, small differences may remain between the pre-K and non-pre-K groups. Regression models with controls were used to compare outcomes for the propensity-score-matched subsamples for the same reason they are typically used in randomized control trials—to reduce variability and to increase the power of the comparison (Rubin & Thomas, 2000). Accordingly, the coefficients of the pre-K attendance variable in our models estimated the adjusted mean difference between groups in outcome variables. We conducted all analyses in R, followed by quality checks in Stata.
Results
Table 1 presents descriptive statistics prior to matching for the matching variables and third-grade assessment scores for children who did and did not attend Georgia’s Pre-K. Variables in the Demographics panel were used in logistic models to generate propensity scores. As expected, there was imbalance between groups on demographic factors. For example, about 72.4% of pre-K students were enrolled in FRL in their kindergarten year, compared with about 66.5% of the non-pre-K group (p < .001). Another, less extreme example of imbalance was the proportion of Black and African American students—39.3% of the pre-K group versus 36.8% of the non-pre-K group (p < .001). Non-pre-K students scored significantly lower than their pre-K counterparts on all third-grade outcomes (the English Language Arts, Mathematics, Science, and Social Studies rows of Table 1).
Demographic Characteristics and Third-Grade EOG Scores for Pre-K and Non-Pre-K Students Prior to Matching

Note: The pre-K and non-pre-K groups were significantly different (p < .001) on all variables prior to matching. EOG = End-of-Grade.
Of the 60,810 pre-K students in the data set, 46,262 matched with non-pre-K students. Descriptive statistics for the two groups after matching are shown in Table 2. After matching, no significant differences remained between the two groups on the matching variables. We see that differences between the pre-K and non-pre-K groups in Table 2 on EOG scores were generally smaller than in Table 1, suggesting that preexisting differences among children who did and did not attend public pre-K programs account for a considerable share of the simple differences in their third-grade outcomes.
Demographic Characteristics and Third-Grade EOG Scores for Pre-K and Non-Pre-K Students After Matching
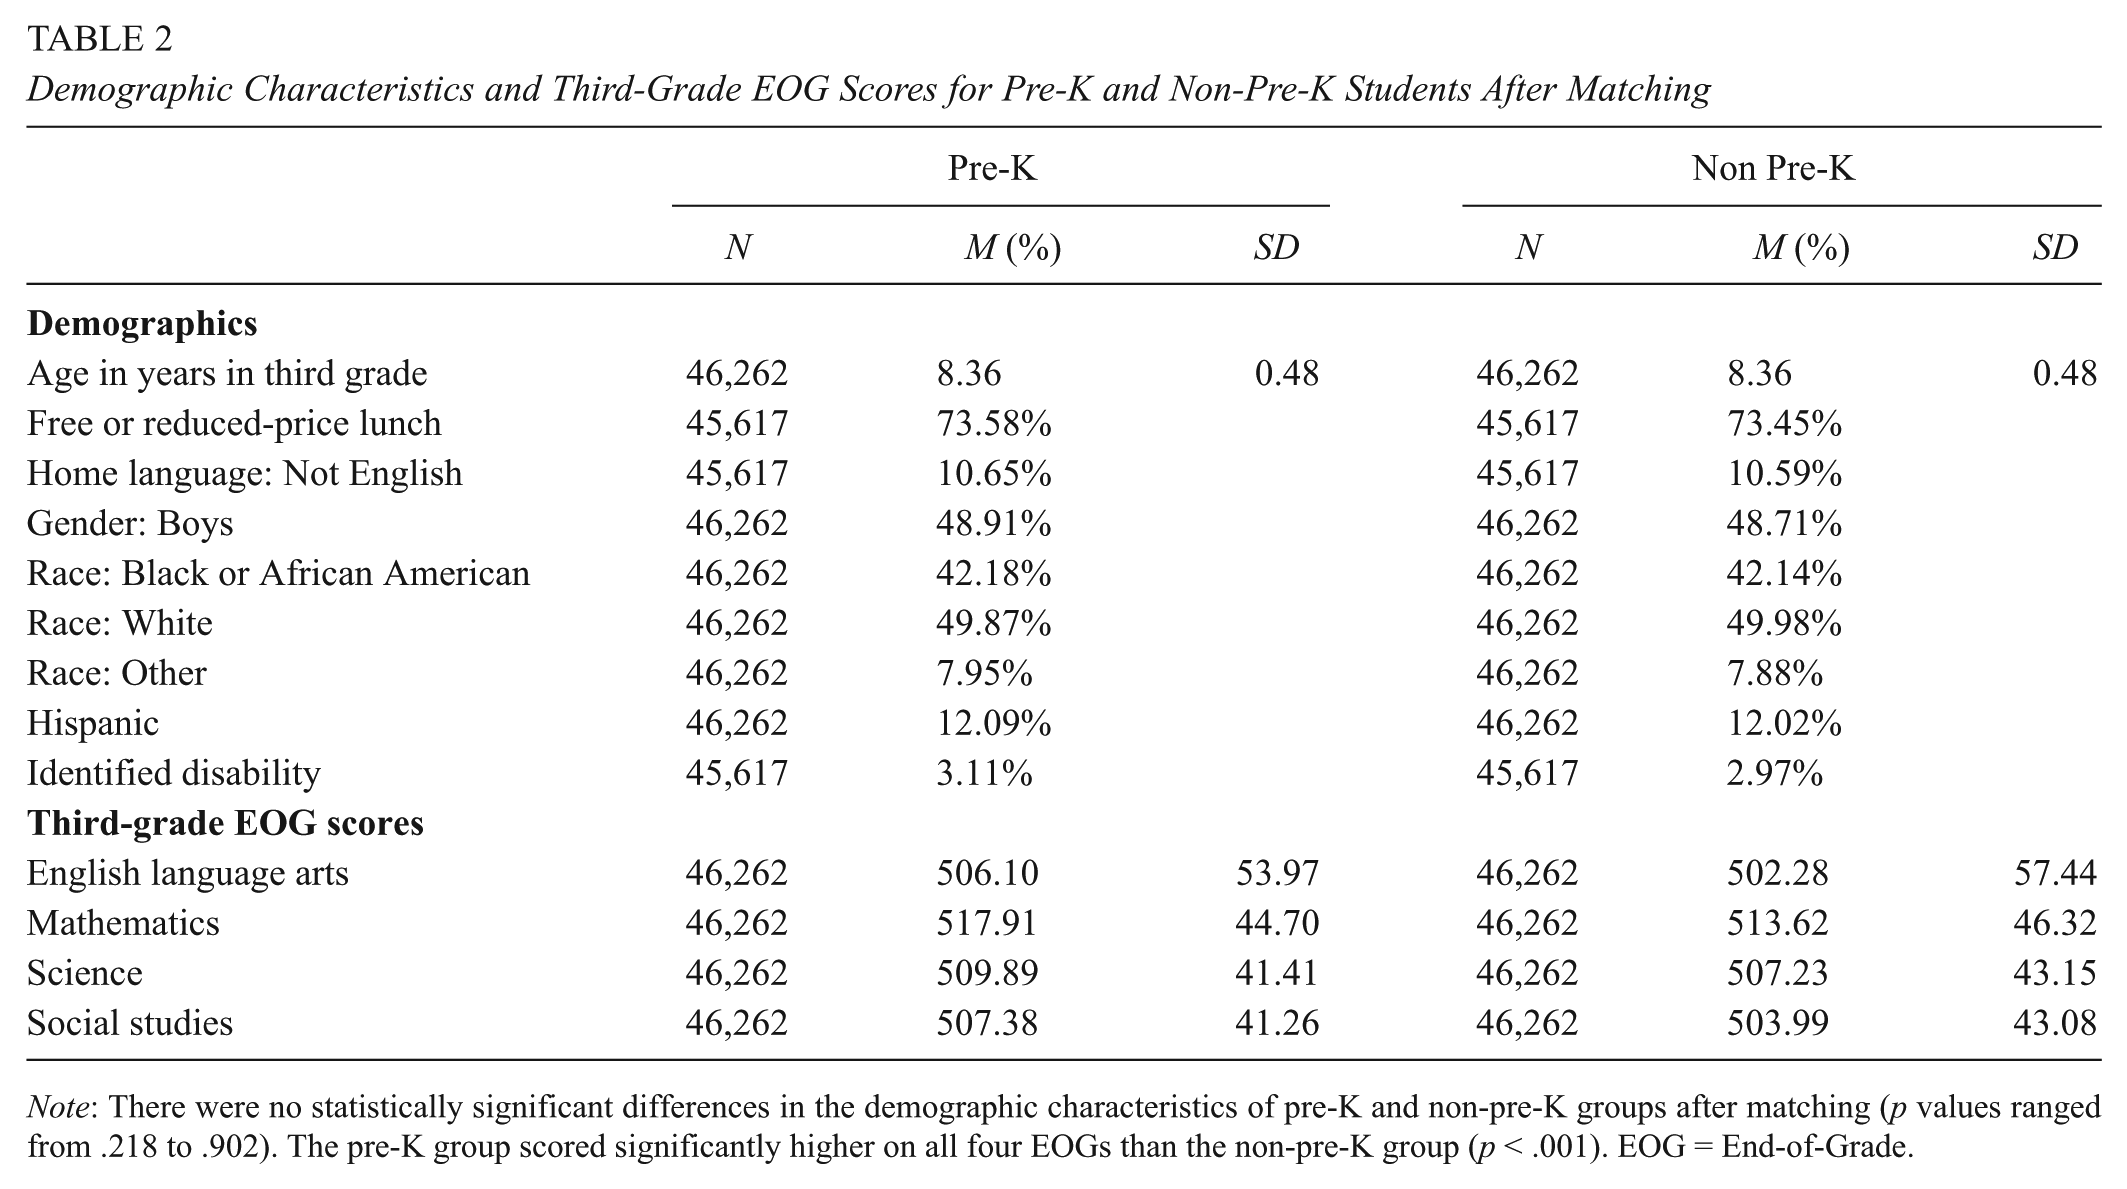
Note: There were no statistically significant differences in the demographic characteristics of pre-K and non-pre-K groups after matching (p values ranged from .218 to .902). The pre-K group scored significantly higher on all four EOGs than the non-pre-K group (p < .001). EOG = End-of-Grade.
Hypothesis 1: Scale Scores
We conducted multilevel modeling and nested students within their kindergarten schools. Model 1 of Table 3 shows significantly positive associations between pre-K participation and third-grade outcomes. We have included the full results from multilevel models, including covariates, in Appendix Table 2. After propensity score adjustment, results indicate that pre-K participation was associated with ELA scores that were 3.95 points higher, mathematics scores that were 4.36 points higher, science scores that were 2.73 points higher, and social studies scores that were 3.46 points higher. Given that standard deviations of these assessment scores were around 50 (see Table 1), pre-K students scored about .06 to .09 standard deviations higher (Cohen’s D) in the four subjects than non-pre-K students.
Hierarchical Linear Modeling Results Comparing Third-Grade Outcomes for Students Who Did and Did Not Participate in Georgia’s Pre-K

Note: FRL = free or reduced-price lunch.
p < .1. *p < .05. **p < .01. ***p < .001.
Hypothesis 2: Proficiency Levels
We conducted logistic multilevel modeling to test whether pre-K students had a higher probability of scoring in the proficient or distinguished range on third-grade EOGs compared to non-pre-K students. Significant results in Model 2 of Table 3 confirm this hypothesis for all four subject areas.
In addition, Figure 1 presents the odds of pre-K and non-pre-K students’ scoring proficient or distinguished in third grade. Odds is defined as the ratio of success to failure (Vogt, 1999). It is calculated by dividing the probability that something will happen by the probability that it will not. These probabilities were calculated taking both random and fixed effects of multilevel models into account. Taking ELA as an example, we see that the odds of a pre-K student reaching the proficient or distinguished level at the end of the third grade was .52, whereas it was only .47 for a non-pre-K student. Thus, pre-K participation was associated with an 11% increase in the odds of being prepared for fourth grade at the end of third grade. For math, pre-K participation was associated with a 17% increase in the odds of proficiency or greater; for science it was 11%, and for social studies it was 14%.

Odds of scoring proficient or distinguished on third-grade end-of-grades for children who did and did not participate in Georgia’s Pre-K.
Hypothesis 3: FRL
To test whether public pre-K participation is more strongly associated with third-grade test scores for children who were enrolled in FRL, we added FRL and the interaction term of pre-K and FRL to our multilevel models. See Model 3 of Table 3 for the results.
We found that in all subject areas, the association between pre-K and test scores was different depending on FRL. Among children who were enrolled in FRL, those who went to pre-K scored higher in all third-grade subjects (Cohen’s D between .10 and .14). Among children who were not enrolled in FRL, those who had not gone to pre-K scored higher in all third-grade subjects (Cohen’s D between –.03 and –.06).
Hypothesis 4: Home Language
To test whether public pre-K participation is more strongly associated with third-grade test scores for children who are DLLs, we added an interaction term of pre-K attendance and whether the student spoke English versus another language at home to our multilevel models (see Model 4 of Table 3). For most subject areas, the interaction was marginal (p < .10). For math, the interaction was significant (p < .05). That association was positive for both groups, but the association between pre-K participation and third-grade math score was stronger for children who did not speak English at home (Cohen’s D of .09 for English home language vs. .14 for non-English home language).
Robustness Check
In the analyses reported in previous sections, we conducted propensity score matching to reduce selection bias and to draw inferences about the association between participation in Georgia’s Pre-K and third-grade EOGs. Our matching procedure achieved balance; that is, the comparison groups were equivalent on all covariates, supporting the validity of the estimated association. However, there were two decision points with regard to matching that could affect the results. To ensure that the findings were robust with regard to these decisions, we conducted two sets of additional analyses.
Match without replacement
The first decision we explored further was in the matching procedure; we conducted the match with replacement because literature suggests matching with replacement produces more reliable results (Smith & Todd, 2005). This means one non-pre-K student could be used multiple times as a match to multiple pre-K students. Our procedure of matching with replacement resulted in 55,783 matched pairs. Given that we had 60,810 pre-K students before matching, the match rate was about 92%. In the matched non-pre-K group, more than half of the students were used more than once. There was even one non-pre-K student who was matched to 27 pre-K students because the kindergarten school this student attended had 85 pre-K students and only 25 non-pre-K students. We were concerned that matching with replacement could lead to bias because a few non-pre-K students could unduly influence the results.
Therefore, we conducted matching without replacement to check the robustness of our results. After matching without replacement, we obtained 36,857 matched pairs, indicating a match rate of about 61%. Results of this set of analyses are shown in Appendix Table 5. This set of results resembled results shown in the previous section, except pre-K effects were significantly greater for all of the four outcomes for students whose home language was not English compared with those who spoke English at home.
Match on metropolitan areas
The second decision we explored further was that we matched exactly on kindergarten schools. We did this in an attempt to account for the quality of the education children received between kindergarten and third grade and neighborhood effects. However, some schools may have no or a very small number of pre-K (or non-pre-K) students. Students from these “small” schools would probably be dropped from our multilevel models because they lacked matches, potentially biasing our results.
We addressed this concern by grouping children into three groups: (a) Atlanta-area kindergarten, (b) non-Atlanta-area kindergarten, and (c) missing kindergarten/changed area. Children were categorized as “changed area” if they attended more than one school during kindergarten and those schools were in both the Atlanta and the non-Atlanta areas. Note that there were too few “changed area” children (n = 1,414) to treat them as a separate group (as we had done for children who changed schools in the main analyses), so they were combined with those who had missing kindergarten information for this check. We used the Atlanta Regional Commission’s (n.d.) definition of the Atlanta area and included Cherokee, Clayton, Cobb, DeKalb, Douglas, Fayette, Fulton, Gwinnett, Henry, and Rockdale counties.
We then conducted matching exactly on these three groups. We obtained 60,578 matched pairs with a match rate of about 99.6%. Results of this set of analyses are shown in Appendix Table 6. This set of results was similar to those in the previous section regarding significance and magnitude of coefficients, except pre-K effects were significantly greater in all four subject areas for children whose home language was not English, compared with those who spoke English at home.
Discussion
The findings indicate that, on average, third graders who participated in Georgia’s Pre-K scored higher than children who did not participate in Georgia’s Pre-K in all subject areas included on the EOG. The effect sizes ranged from .06 to .09 standard deviations so are small by traditional metrics (Cohen & Cohen, 1975). They are roughly comparable to those seen in third grade in Arkansas (.00 to .13; Jung et al., 2013) and Texas (.05 to.06; Andrews et al., 2012) but smaller than those seen in second grade in New Jersey (.16 to .24; Frede et al., 2009) and third grade in Washington (.14 to .16; Bania et al., 2014). Those studies, however, did not use the same methods as did the current study. The studies in Arkansas and New Jersey were based on samples of children who were selected for participation in a longer longitudinal study. The studies in Texas and Washington relied on administrative data, as did the current study, but rather than using propensity score matching, the researchers compared children who had attended their pre-K programs to children who were eligible but did not and added some control variables to account for selection bias. Our methodology is stronger than that used in Arkansas or New Jersey because we were able to include almost all children in third grade in Georgia, making the sample much larger. Our methods are stronger than those used in Texas or Washington because propensity score matching attempts to mimic randomization by creating a sample of Georgia’s Pre-K participants that is comparable on all covariates to a sample of children who did not attend Georgia’s Pre-K. Further, by matching children on kindergarten school, we minimized bias associated with school quality and neighborhood factors.
We think these effects are important, despite their small size, for several reasons. The gap between participation in Georgia’s Pre-K and third-grade test scores is long (4 years), and the children had many experiences that affected their test scores after participation in Georgia’s Pre-K. Likewise, Georgia’s Pre-K is a broad intervention designed to serve many purposes in addition to promoting academic achievement, such as improving social skills, smoothing the transition to kindergarten, and engaging families in their children’s education (Bright From the Start, n.d.). EOGs are not designed to test the effects of pre-K, so they may not align well with the goals of Georgia’s Pre-K. Further, we used careful statistical techniques to guard against bias, but those techniques also tend to decrease the size of effects (National Institute of Child Health and Human Development, Early Child Care Research Network, & Duncan, 2003). When less stringent controls are used, the effects were slightly larger (ranging from .10 to .12). Despite these factors, students who attended Georgia’s Pre-K scored, on average, significantly higher on all EOGs at the end of third grade.
We recognize that some researchers might argue that the significant interactions (discussed below) indicate we should not interpret this main effect. However, we think that interpreting average effects is important given that this was the study’s main research question and that the interactions are quite small.
Interactions
Tests of interactions were significant for FRL in all four subject areas and for home language in math. Post hoc tests indicated that scores were slightly lower for non-FRL children who participated in Georgia’s Pre-K than for those who did not, but the effects were less than half as large as the positive pre-K effects for children enrolled in FRL. For home language, associations between pre-K and test scores were stronger in math for children whose home language is not English, relative to their peers, but the effects were positive for both groups regarding all four subject areas. These stronger effects for at-risk children are consistent with those in studies of pre-K in other states and nationally (Andrews et al., 2012; Arlington Public Schools, 2010).
One possible explanation for these interactions relates to the experiences of the non-pre-K group. Among children who do not go to pre-K, non-FRL children and those who speak English at home may be more likely to attend high-quality private preschools than their counterparts from lower income households or whose home language is not English. Those high-quality settings may afford comparable experiences to those offered by Georgia’s Pre-K, thereby eliminating pre-K’s benefits. Unfortunately, there are no data available about the preschool experiences of nonparticipating children to test this hypothesis.
Alternatively, it may be that high-quality preschool experiences are more important for children who are at risk for academic difficulties. Children from low-income families typically have fewer educational resources at home, such as books, and less access to adults to provide stimulating verbal interactions (Linver, Brooks-Gunn, & Kohen, 2002), possibly increasing the benefit of the pre-K experience (Magnuson, Meyers, Ruhm, & Waldfogel, 2004). Past research has found mixed results with regard to the benefits of pre-K for children from different income groups. For instance, Weiland and Yoshikawa (2013), working in the Boston Public Schools, found positive impacts of pre-K participation on most outcomes for children from lower and higher income families; although for some outcomes, the associations were stronger for children from lower income families. Likewise, Gormley, Gayer, Phillips, and Dawson (2005), working in Tulsa, Oklahoma, found positive associations between pre-K attendance and academic outcomes for children from all income groups. On the other hand, Magnuson et al. (2004) and Gormley and Gayer (2005) both found associations between pre-K attendance and children’s outcomes for economically disadvantaged students, but not for their more economically advantaged peers.
We do not think that these unexpected results should be interpreted to indicate that a pre-K program serving only children from low-income families would be preferable to Georgia’s universal program. We cannot know if we would have found these same results for children receiving FRL if the program served only economically disadvantaged children. Program quality is typically higher in universal pre-K programs, like Georgia’s, as compared with those that serve only children at risk for school difficulties, possibly due to peer effects, ability to attract higher quality teachers, and support from the general public (Ladd, 2017). Indeed, Miller, Votruba-Drzal, McQuiggan, and Shaw (2017) found that children from low-income households demonstrated greater gains during pre-K when enrolled in economically integrated classrooms than when enrolled in classrooms targeting economically disadvantaged children.
Limitations
These analyses capitalize on the wealth of data collected and maintained by GA•AWARDS, including information to identify children who did and did not participate in Georgia’s Pre-K. Analysis of this sort of records data, however, has some inherent limitations.
First, and most important, we cannot draw causal conclusions from these analyses. We do not know that the higher test scores for children who participated in Georgia’s Pre-K were due to their participation. Other factors, such as family supports, may both cause children to participate in Georgia’s Pre-K and cause their scores to be higher. To the extent possible, we have addressed this concern using propensity score matching and control variables, but it is never possible to account for all differences between children who do and do not take part in voluntary programs.
Second, these analyses compare third-grade test scores only for children who did and did not participate in Georgia’s Pre-K 4 years earlier. It is possible that some children in the non–Georgia’s Pre-K group actually participated in Georgia’s Pre-K 5 years earlier but were retained in pre-K or early elementary school. Likewise, some children who participated in Pre-K 4 years earlier may have been excluded from our analyses because they were retained and did not yet have third-grade test scores. Depending on which children were retained, this omission could bias results in either direction.
Third, we do not have information about the preschool experiences of children who did not participate in Georgia’s Pre-K. Some of them likely went to high-quality private preschools, while others were likely in family child care homes or cared for exclusively by a parent or relative. Including children who attended other high-quality programs may be attenuating the strength of the findings.
Finally, we do not have information about these children’s early elementary experiences. Clearly, third-grade test scores result from the accumulated learning that occurs prior to school and during the early elementary grades. We did match children on the school they attended for kindergarten, which partially addresses this problem by ensuring that we do not have systematic differences in school quality from the start. However, collecting and incorporating information about the quality of elementary schools would greatly strengthen our understanding of these test scores.
Conclusions and Future Directions
This study adds to the body of research regarding school achievement for children who attend pre-K. Even with the study limitations, the findings suggest that children, particularly those from low-income families, benefit from pre-K. Additional research is needed, though, to understand why evaluations of state-funded pre-K have had mixed results. This additional research should address the implementation of pre-K, documenting the extent to which the pre-K classrooms were implementing the program as intended (e.g., meeting the standards) as well as the quality of the children’s elementary school classrooms. We would learn more from longitudinal studies that randomly assigned children to pre-K (or not) in states where waiting lists are long enough to do this. Longitudinal studies would allow us to understand better the role of pre-K and each subsequent year of school experience in supporting children to meet important educational milestones by third grade. These longitudinal studies also would allow us to examine the effects of pre-K on outcomes of interest besides the ones measured in schools, such as behaviors that support a healthy lifestyle, family engagement in children’s learning, and children’s executive function.
Footnotes
Appendix Table 1
Appendix Table 2
Appendix Table 3
Appendix Table 4
Appendix Table 5
Appendix Table 6
Acknowledgements
Authors
DIANE M. EARLY is a senior research scientist in early childhood education at Child Trends. Her research interests include public pre-K, teacher education and preparation, and quality improvement.
WEILIN LI is a senior data scientist at Child Trends. Her research focuses on utilizing both traditional and cutting-edge statistical and computational approaches for education policy research.
KELLY L. MAXWELL is a senior program area director for early childhood research at Child Trends. Her research interests include quality rating and improvement systems, school readiness assessments, and evaluation of early childhood initiatives.
BENTLEY D. PONDER is the senior director of research and policy at Bright From the Start: Georgia Department of Early Care and Learning (DECAL), where he oversees DECAL’s research agenda and manages internal evaluation projects, policy analyses, and ongoing data projects. Past and current projects include validation efforts for the state’s tiered quality rating and improvement system, longitudinal evaluations of Georgia’s Pre-K Program, research for the state’s Child Care Development Fund plan, and a statewide early education economic impact study.