
Abstract
This study investigated the validity and reliability of the Motivated Strategies for Learning Questionnaire (MSLQ) for minority students enrolled in STEM courses at a historically black college/university (HBCU). Confirmatory factor analysis was used to test the third-order factor structure and to respecify the model. An adequate fit to the study sample data was achieved for the respecified MSLQ (MSLQ-R), and measurement invariance was verified on four groups within the HBCU sample. The highest correlates with EOC grade on the MSLQ-R were self-efficacy, task value, effort regulation, and time and study environment. Metacognitive self-regulation and strategy use variables were found to not correlate with EOC grade. A useful capability to discriminate on the basis of academic performance was exhibited by the MSLQ-R.
Keywords
Science, technology, engineering, and mathematics (STEM)–educated graduates possess knowledge and skills that are critical to a large portion of the U.S. workforce and contribute to the economic competitiveness and innovation of the nation (National Science Board [NSB], 2015). However, there are persistent challenges in producing and retaining STEM talent in the United States to meet the current workforce demands, as documented in several national reports (National Academy of Science, 2011; National Academy of Sciences, National Academy of Engineering, & Institute of Medicine, 2007, 2010; NSB, 2016). Although about 28% of all U.S. college students select a STEM major, more than half switch to a non-STEM field or leave postsecondary education without earning any credentials (Chen, 2009). This departure rate is even higher for individuals from groups underrepresented in STEM, including African Americans (Chen, 2013). Most students who switch from STEM to non-STEM degree programs do so after taking challenging and demanding STEM gatekeeper courses—introductory science, mathematics, and engineering (President’s Council of Advisors on Science and Technology, 2012). Earning low or nonpassing grades in these courses reduces academic self-efficacy and often leads to negative attitudes toward STEM, which can further prompt students to disengage and change majors (Eagan, Hurtado, & Chang, 2010; Gasiewski, Eagan, Garcia, Hurtado, & Chang, 2012).
Learning in STEM involves many self-regulated learning processes that require students to plan, set goals, think critically, assess and select their approach, build knowledge, monitor progress, and evaluate their actions and outcomes (Sinatra & Taasoobshirazi, 2011). Students must control and manage their behaviors to develop skills, learn from others, utilize available resources, manage their time and effort, and complete tasks. STEM learning also requires students to show interest, be motivated, be inquisitive, have purpose and value, explore, and endure frustration. Highly self-regulated students find ways to learn and overcome obstacles by adjusting their motivation, affect, and learning approach (Zimmerman & Martinez-Pons, 1990). Understanding the motivational beliefs and learning behaviors that students exhibit in STEM courses is of key importance toward improving academic learning and achievement (Komarraju & Nadler, 2013).
Self-regulated learning, the degree to which a student systematically uses metacognitive, motivational, and/or behavioral strategies in his or her own learning process (Schraw, Crippen, & Hartley, 2006; Wolters, Pintrich, & Karabenick, 2005; Zimmerman, 1989, 1990, 2008), has been shown to have positive impact on academic achievement of students (Cassidy, 2011; Cleary, Platten, & Nelson, 2008; DiBenedetto & Bembenutty, 2013). Self-regulated learning is a proactive process and has complex links, including direct and mediated effects, to students’ knowledge base, academic self-efficacy, and achievement (Komarraju & Nadler, 2013; Vanderstoep, Pintrich, & Flagerkin, 1996; Zimmerman, 1989, 2008; Zimmerman & Martinez-Pons, 1990). Self-regulation is essential for students to have in academic settings and is malleable (Dembo & Seli, 2004; Zimmerman, 1989). Students who possess strong self-efficacy beliefs make greater use of effective cognitive strategies in learning, manage their time and learning environments more effectively, and monitor and regulate their own effort more thoroughly (Chemers, Hu, & Garcia, 2001; Schraw et al., 2006). Students vary widely in their perceptions of academic self-efficacy and use of learning strategies in tasks (DiBenedetto & Bembenutty, 2013; Zimmerman & Martinez-Pons, 1990). This may be because self-regulated learning is inseparable from the purpose of engagement, where the type of self-regulated action relevant for engagement in a particular task depends on (a) the “subject” who is doing the regulating; (b) the “object” that is being regulated; and (c) the “means” by which regulation is conducted (Kaplan, 2008). Research has shown that self-regulatory learning can be taught (Azevedo & Cromley, 2004; Cleary et al., 2008; Schmitz & Wiese, 2006); therefore, knowledge about self-regulated learning, purpose of engagement, and achievement is important for guiding academic analysis and developing interventions to improve student learning and academic performance (Kaplan, 2008; Kitsantas, Winsler, & Huie, 2008; Zimmerman, 1989). Valid and reliable tools that are designed fro diverse populations are needed for measuring self-regulation and to guide interventions.
Measuring Self-Regulated Learning
The Motivated Strategies for Learning Questionnaire (MSLQ) is one of the most widely used instruments designed to measure self-regulated learning (Dinsmore, Alexander, & Loughlin, 2008; Roth, Ogrin, & Schmitz, 2016; Zimmerman, 2008). The MSLQ, a self-report questionnaire, was designed to correspond to the three elements in the definition of self-regulated learning: motivation, metacognition, and behavior (Pintrich, 2004; Pintrich, Smith, Garcia, & McKeachie, 1991, 1993; Wolters et al., 2005). The MSLQ has two parts: Part I. Motivation and Part II. Learning Strategies (see Appendix A).
Part A, the Motivation section of the MSLQ is intended to assess value, expectancy, and affect reported by students. Self-efficacy, a component of expectancy, is broad and combines judgments of one’s ability to accomplish a task, confidence in one’s skills to perform a task, and expectancy for success in the task. Academic self-efficacy relates positively to academic outcomes (Chemers, Hu, & Garcia, 2001; Komarraju & Nadler, 2013; Schraw et al., 2006). The affect component section is operationalized as test anxiety, although this anxiety is considered an emotional construct as opposed to a motivational one (Hilpert, Stempien, van der Hoeven Kraft, & Husman, 2013).
Part B, the Learning Strategies section of the MSLQ is intended to assess use of cognitive, metacognitive, and resource management strategies reported by students. Cognitive processes incorporate skills to encode, memorize, and recall information. Cognitive strategies include students’ reported use of basic and complex strategies for the processing of information from texts and lectures. Metacognition, knowledge about the task, and knowledge about the strategy influence cognition. Metacognitive control strategies involve the use of strategies that help students control and regulate their own cognition. Engaging in a task, which includes selective activation of strategies to perform the task and the task effort, is influenced by goals and outcome perceptions (Pintrich, Wolters, & Baxter, 2000; Schraw et al., 2006; Zimmerman, 1989, 1990; Zimmerman & Martinez-Pons, 1990). Resource management strategies capture students’ approaches to managing and controlling other external resources available to them.
The MSLQ has been classified as an aptitude measure of self-regulated learning (Muis, Winne, & Jamieson-Noel, 2007; Zimmerman, 2008), and the instrument assesses the propensity of students to engage in self-regulated learning in a specific context. The MSLQ does not use norms, reflecting the assumption that students’ responses may vary as a function of the task, situation, course, or school context. Course specificity is provided by asking students to respond to questions regarding their learning and motivation in a specific class (Roth et al., 2016). Students report, retrospectively, how they behave in various types of situations. Consequently, students would likely be accessing long-term memory and making generalizations about what they believe they do in a particular situation (Pintrich et al., 2000).
A number of researchers have utilized the MSLQ to examine the relationship between motivation, self-regulated learning, and academic achievement at the college level (Al-Harthy, Was, & Isaacson, 2010; Kitsantas et al., 2008; Komarraju & Nadler, 2013; Lynch, 2006, 2010; Lynch & Trujillo, 2011; Vanderstoep, Pintrich, & Fagerlin, 1996; VanZile-Tamsen, 2001). Consistently, these research studies have found students’ self-efficacy scores to be the strongest predictor of course performance and academic achievement, even in cases where prior achievement was used as a control variable. Also, to varying degrees, students’ scores on specific regulatory scales of effort regulation and time and study environment management have been shown to be the next significant predictors of achievement. Research also has shown differences in self-reported use of self-regulatory strategies to be a consistent measure distinguishing students by achievement level (Effeney, Carroll, & Bahr, 2013; Nandagopal & Ericsson, 2012; Vanderstoep et al., 1996; VanZile-Tamsen & Livingston, 1999; Zimmerman & Martinez-Pons, 1990; Zusho, Pintrich, & Coppola, 2003).
Research on the MSLQ with diverse populations and in diverse situations is needed (Cho & Summers, 2012; Pintrich et al., 2000). The validity of questionnaires is influenced by participants’ ability to relate questions about strategies to their own learning experiences and analyze the strategic aspects of their learning in a conscious manner (Roth et al., 2016). Most of the research studies conducted using the MSLQ have included only a small percentage of African American students in the samples (Bembenutty, 2007; Jakubowski & Dembo, 2004; Kitsantas et al., 2008; Komarraju & Nadler, 2013; Zusho et al., 2003), and no MSLQ studies on a population of African American students while taking STEM courses at a historically Black college/university (HBCU) have been found. In addition, recent studies have documented psychometric problems with the MSLQ, particularly the factor structure associated with measuring self-regulated learning (Credé & Phillips, 2011; Dunn, Lo, Mulvenon, & Sutcliffe, 2012; Hilpert et al., 2013; Muis et al., 2007; Tock & Moxley, 2017). Pintrich et al. (2000), the authors of the MSLQ, acknowledged problems of lack of a stronger fit between the theoretical model and the actual empirical data, and they recommended more research on self-regulation and control instruments such as the MSLQ with more ethnically and racially diverse populations as well as students across a range of age and achievement levels (Pintrich et al., 2000; Wolters et al., 2005). Consequently, there is a need to assess the validity of the MSLQ for diverse groups in different context and environments.
Significance of the Study
An instrument that is used as a measure of self-regulated learning should be valid and reliable for different populations and in various contexts and sensitive to differences in the ability levels of respondents. Results from measurements then can provide insights to educators to enable design and implementation of strategic self-regulatory training and focused interventions to target specific motivational beliefs and develop effective self-regulatory skills to enhance learning and academic performance of students. The current study is part of an effort to investigate self-regulated learning behaviors and their relationships to academic achievement for African American undergraduate students in STEM courses at an HBCU. There is insufficient evidence on the validity and reliability of the MSLQ for measuring self-regulated learning on this under-sampled population. The purpose of the current study is to address this need and is as follows: (a) to test factorial validity of the entire MSLQ for the study sample group and setting; (b) presented with findings of an unsatisfactory model fit, to propose and test a better-fitting factorial structure for the MSLQ based on a rigorous statistical respecification method; (c) to test measurement invariance of the respecified instrument across subgroups within the sample; and (d) to explore self-regulated learning with the respecified instrument on the sample. This work will contribute to knowledge of the generalizability of the MSLQ to minority populations and in minority undergraduate institutions and the utility of the modified instrument as a diagnostic tool in understanding learning needs of students in similar content and contexts.
Method
Participants
Participants were undergraduate students (N = 258) enrolled in STEM gatekeeping courses (chemistry, mathematics, and physics) at a mid-Atlantic Southern institution designated as an HBCU. The percentage of students enrolled in each course was chemistry, 26%; mathematics, 52%; and physics, 22%. No participant was duplicated in the sample. Demographic information on the participants in the study, hereafter referred to as “HBCU sample,” is shown in Table 1. The HBCU sample was largely female (67.1%) and African American (74.8%), with a mean age of 24 years. The academic classifications of the participants were 26.4% freshmen, 29.5% sophomores, 25.2% juniors, and 18.6% seniors. There were 147 (57%) STEM majors among the participants, distributed in the following disciplines: 83 (56%) biology, 11 (7%) chemistry, 1 (1%) computer science, 8 (5%) mathematics, 34 (23%) pharmaceutical science, and 10 (7%) physics. One hundred and eleven (43%) in the HBCU sample were non-STEM students. The specific courses in which participants were enrolled are considered gatekeeping to the extent that they are required mathematics or science courses in the plans of study in the various degree programs of the participants.
Demographics of Two Population Samples by Gender, Race, Academic Level, and Major
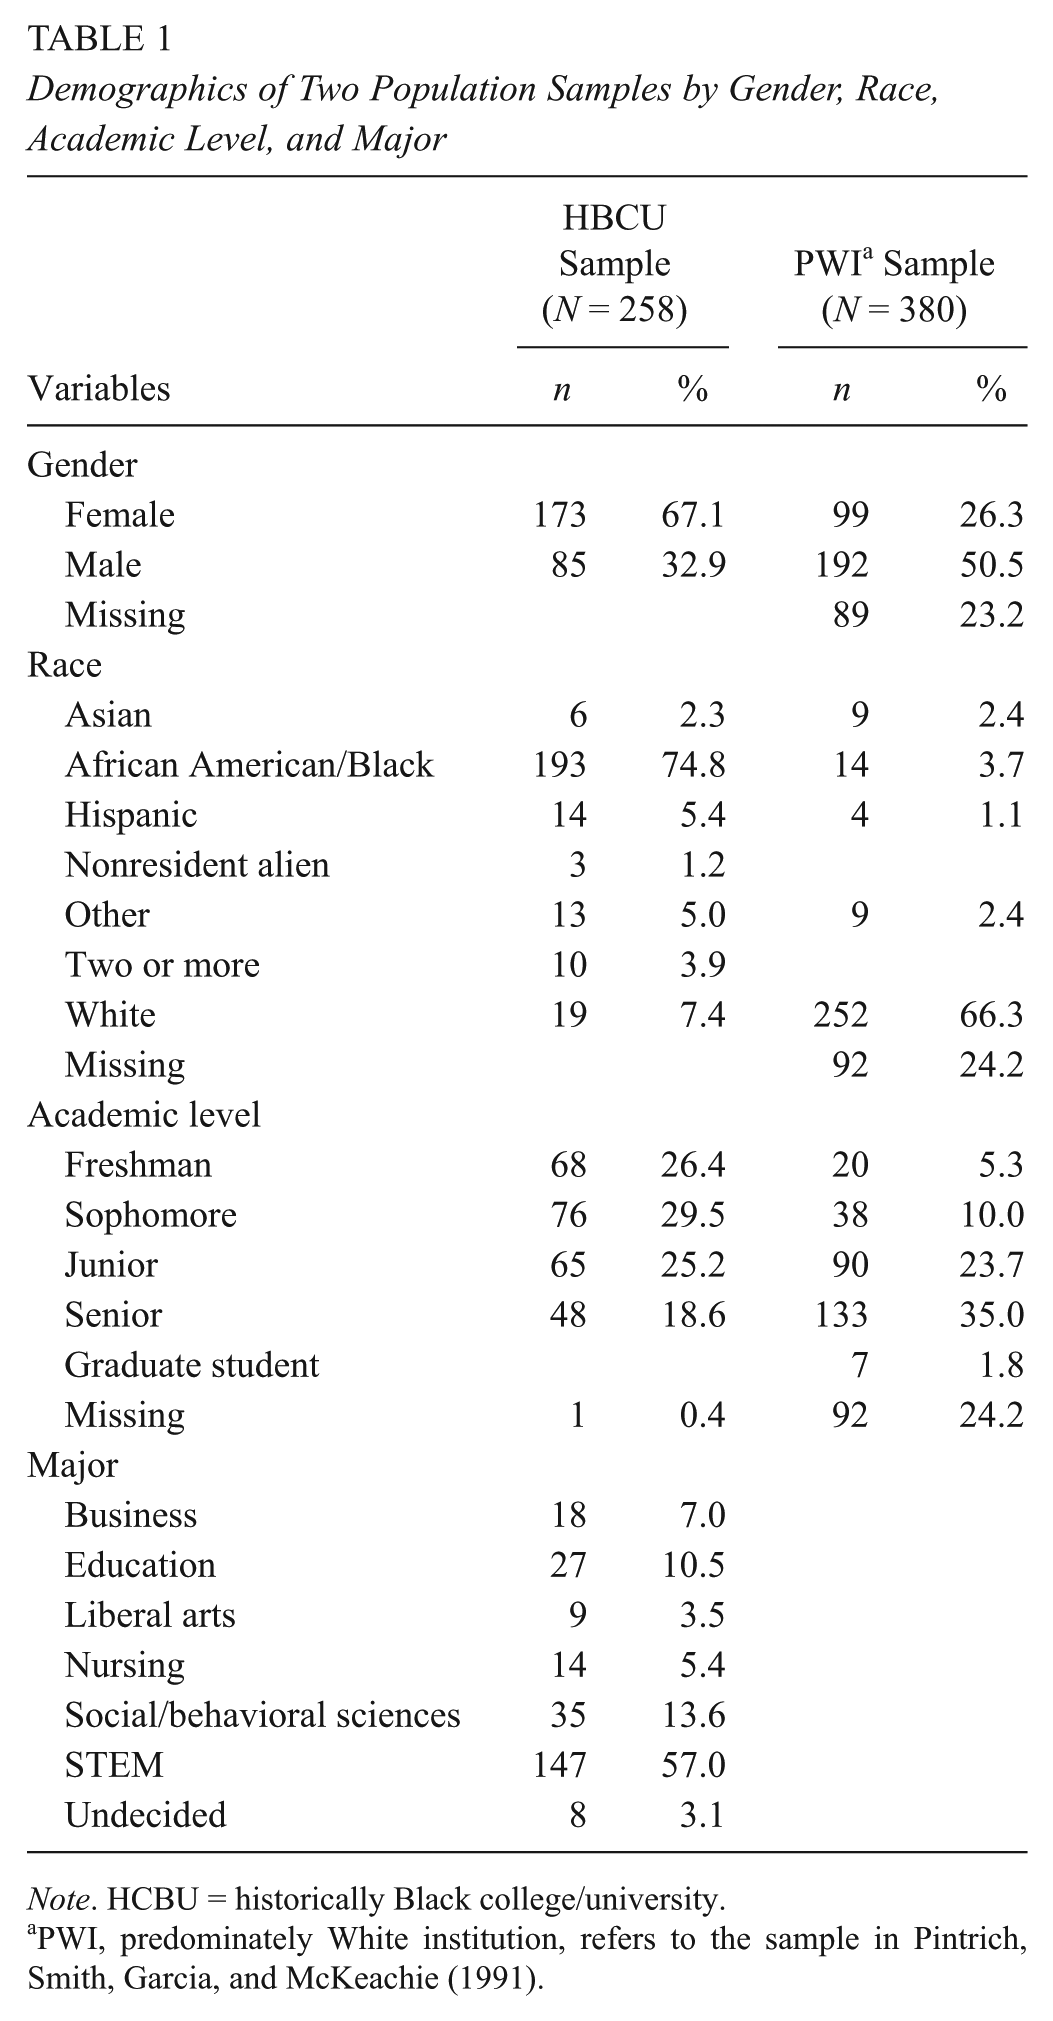
Note. HCBU = historically Black college/university.
PWI, predominately White institution, refers to the sample in Pintrich, Smith, Garcia, and McKeachie (1991).
For comparison, demographic information on the validation sample from the original MSLQ study conducted at a predominately White institution (Pintrich et al., 1991, 1993) is shown in Table 1 (hereafter referred to as “PWI sample”).
Measures
Self-regulated learning measure
The full 81-item MSLQ was used for this research. The MSLQ consists of two major sections: motivation (31 items) and learning strategies (50 items). The two sections are further subdivided into 15 scales (Duncan & McKeachie, 2005; Garcia & Pintrich, 1996; Pintrich et al., 1991, 1993). All items use a 7-point rating scale (1 = not at all true of me, to 7 = very true of me). The items in the original MSLQ are listed in Appendix A. The scales in the original MSLQ are listed in Appendix B. The Motivation section consists of six scales: Intrinsic Goal Orientation (INTR), Extrinsic Goal Orientation (EXTR), Task Value (TASKV), Control of Learning Beliefs (CNTRL), Self-Efficacy for Learning and Performance (SEFF), and Test Anxiety (TANX). The Learning Strategies section consists of nine scales: Rehearsal (RHRSL), Elaboration (ELAB), Organization (ORGNZ), Critical Thinking (CRTHK), Metacognitive Self-Regulation (META), Time and Study Environment Management (TSTDY), Effort Regulation (EFFREG), Peer Learning (PEERLRN), and Help Seeking (HPSEEK).
Academic performance
Academic performance was measured by collecting end-of-course (EOC) grades for the classes used in this study. EOC letter grades for each class were converted to a 4.0 scale (A = 4.0, B = 3.0, C = 2.0, D = 1.0, and F = 0) and then standardized by z-transform to control for grading differences between different professors and different subjects. EOC letter grades of W, for withdrawal, or I, for incomplete, were reflected as missing data, leaving 233 grades for the sample. In addition to EOC grades, students’ cumulative grade point averages (cGPA) were obtained from institutional records to serve as an achievement measure.
Procedure
Professors teaching STEM gatekeeping courses were asked to allow students in their classes to participate in the MSLQ survey. Agreement was obtained from 10 professors across 18 sections of classes in subject areas chemistry, mathematics, and physics. The full version of the MSLQ survey (Pintrich et al., 1991) was administered to the selected classes before midterm in fall semester 2014. Three graduate students served as proctors to collect signed consent forms and administer the survey in class sections. As an incentive for participation in the survey, the proctors raffled off three $25 MasterCard/VISA gifts cards in each class after completion of the survey. The full MSLQ survey was administered during regular class times for each of the mathematics classes and during the associated laboratory session times for each of the chemistry and physics classes that participated. The MSLQ survey took about 20 minutes, and students were instructed to respond to survey items reflecting on the course in which they were enrolled. The response rate was approximately 65% of 488, for a total of 316 completing the survey. Fifty-eight cases had various missing item data and were removed. The final sample size was 258 with no missing MSLQ item data.
The MSLQ survey data for the HBCU sample were collected from classes in subject areas chemistry, mathematics, and physics. Five sections were General Chemistry I. Nine mathematics sections were College Algebra and Trigonometry I (six), precalculus (one), and calculus (two). Four physics sections were algebra-based General Physics I and calculus-based General Physics for Scientist and Engineers I (one). The distribution for participants across these class sections was: 44 (17%) Calculus, 81 (31%) College Algebra and Trigonometry I, 66 (26%) General Chemistry I, 43 (17%) General Physics I, 14 (5%) General Physics for Scientists and Engineers I, and 10 (4%) Precalculus.
For comparison, the PWI Sample (Pintrich et al., 1991) was from 37 classrooms spanning five disciplinary subject areas: business (9, 2%), education (25, 7%), humanities (106, 28%), social/behavioral science (153, 40%), and STEM (87, 23%).
Analysis
The factor validity of the MSLQ to measure the posited motivational and self-regulated learning constructs will be determined by rigorous statistical analysis on the model for the HBCU sample. Other factor-analytic studies on the MSLQ typically test the motivation and learning strategies sections separately and only to first-order factor levels (Cho & Summers, 2012; Pintrich et al., 1993; Smith & Chen, 2017). The present study will test the conceptualized third-order factor structure of the full 81-item MSLQ. The observed structural properties of the MSLQ for the sample will then provide indicators to serve as a baseline for model respecification. Subject to finding and verifying a valid and reliable respecified measure, relationships between self-regulated learning and academic performance will be explored.
Confirmatory factor analysis (CFA) was conducted on the factor structure of the MSLQ to investigate the psychometric properties. Factor structure refers to the relationships between the observed variables (i.e., measured items) and the underlying latent, unobserved factor (the construct being estimated). CFA can provide a check of construct validity for the expected factor structure for participants in a study (Meyers, Gamst, & Guarino, 2013).
CFAs were conducted using IBM SPSS Amos 23 (Arbuckle, 2014; IBM SPSS Amos 23, 2014). Parameter estimates were generated using maximum likelihood and tests of goodness of fit. Hu and Bentler (1998) recommend always reporting standardized root mean square residual (SRMR)—an absolute fit index—and one relative fit index between the models and the data. Meyers et al. (2013) recommend reporting five fit measures—three absolute fit indices and two relative fit indices. The values of chi-square divided by degrees of freedom (χ2/df), the Goodness of Fit Index (GFI), the Adjusted Goodness of Fit Index (AGFI), and the SRMR were reported for the initial analysis for comparison purposes with the original MSLQ validation study of the developers (Pintrich et al., 1993). However, Hu and Bentler (1998) do not recommend using GFI and AGFI as absolute fit indices because they are not sensitive to model misspecification. Therefore, root mean square error of approximation (RMSEA) and Comparative Fit Index (CFI) were used in the remaining analyses as additional indices of absolute fit and relative fit, respectively. For the absolute fit indices, the recommended cutoff values for good model fit are as follows: χ2/df < 2.0, GFI/AGFI > .9, SRMR < .05, and RMSEA < .08. For the relative fit measure, CFI > .95 indicates a good model fit, but above .9 is acceptable. A marginal fit is considered for CFI values between .8 and .89, and a poor fit is considered for CFI values less than .8 (Meyers et al., 2013).
CFA was also used in subsequent model respecification procedures. Additional fit measures for making comparisons between different models are: Akaike Information Criterion (AIC), Browne-Cudeck Criterion (BCC), Bayesian Information Criterion (BIC), and expected cross-validation index (ECVI). The model with the smallest values for these parameters is considered the better one (Meyers et al., 2013). The sample size of 258 was not large enough to allow for a randomly split CFA test-validation pair of data sets (Guadagnoli & Velicer, 1988); therefore, no replication analysis was conducted for this study.
Measurement invariance testing of the respecified MSLQ was conducted by multiple group CFA, using IBM SPSS Amos 23, to determine whether parameters of the measurement model and/or the structural model are equivalent (i.e., invariant) across two or more groups within the sample. Invariance testing of the measurement model indicates whether the items used for the instrument have the same meaning to respondents from the different groups in the sample. If invariance cannot be established, it would be difficult to determine if the differences observed are due to true differences or different psychometric responses to the items (Chen, Sousa, & West, 2005; Cheung & Rensvold, 2002). The chi-square difference statistic, Δχ2, and the Comparative Fit Index difference, ΔCFI, are used as indicators in invariance testing. The value of Δχ2 represents the difference statistic between two χ2 models fitted to data from each in a given group. If Δχ2 is not statistically significant, then evidence of invariance for that model is claimed, meaning it was as good a fit for data from each within the group (Byrne, 2016; Meyers et al., 2013). Byrne (2016) suggests also that invariance decisions be based on the CFI difference, and if ΔCFI < .01, then evidence of invariance of the groups to the model is claimed.
Descriptive statistics, internal consistency estimates of reliability, were calculated for the respecified MSLQ scales for the HBCU sample. Scale variables were constructed by taking the mean value of the items that make up that scale. Bivariate correlations were calculated for the respecified MSLQ scales and EOC grade for the HBCU sample. From the full HBCU sample, high- and low-achieving students were grouped for further analysis. The achievement measure was cGPA. The high achievement (HA) group was formed by assigning students whose cGPA was at or above the 75th percentile (M + .675 × SD), and the low achievement (LA) group was students whose cGPA was at or below the 25th percentile (M + .675 × SD) for the sample. A multivariate analysis of variance (MANOVA) was conducted to determine if the MSLQ would discriminate on students’ achievement level to gauge instrument utility as an academic diagnostic tool.
Results
Model Comparisons
Two CFAs were conducted separately on the motivation and learning strategies sections of the MSLQ in a fashion similar to that done by Pintrich and his colleagues (Garcia & Pintrich, 1996; Pintrich et al., 1993). The first maximum likelihood estimation was carried out on the 31 motivation items to see how well a correlated six-factor model for that section fitted the data. The second maximum likelihood estimation was carried out on the 50 learning strategies items to see how well a correlated nine-factor model for that section fitted the data. The model fit indices for each MSLQ section to the HBCU sample data are shown in Table 2. Both the motivation section and learning strategies section models of the MSLQ fail to fit the HBCU sample data. Based on current standards, the fit indices reported by Pintrich et al. (1991) for the two MSLQ sections to the PWI data also indicate a poor fit (see Table 2).
CFA Fit Statistics for Two-Section MSLQ Model on HBCU Sample and PWI Sample

Note. CFA = confirmatory factor analysis; MSLQ = Motivated Strategies for Learning Questionnaire; HBCU = historically Black college/university; PWI = predominantly White institution; GFI = Goodness of Fit Index; AGFI = Adjusted Goodness of Fit Index; SRMR = standardized root mean square residual; CFI = Comparative Fit Index; RMSEA = root mean square error of approximation.
p < .001.
Respecification of MSLQ
A third-order factor model for the full 81-item MSLQ was configured in SPSS AMOS. The model is illustrated in Figure C1 (Appendix C). The original names of the MSLQ scales were retained as first-order factors (see Appendix B). The first group of second-order factors were Value, Expectancy, and Affect. These constituted proposed third-order factor, Motivation. The remaining group of second-order factors were Cognitive, Metacognitive, and Resource Management. These constituted proposed third-order factor, Learning Strategies. Correlation between Motivation and Learning Strategies variables was allowed in the model. As shown in Table 3, the third-order factor model of the MSLQ was a very poor fit for the HBCU Sample: χ2/df = 1.94, SRMR = .10, CFI = .69, and RMSEA = .06.
CFA Fit Statistics for Full MSLQ and (Respecified) MSLQ-R Models on HBCU Sample

Note. CFA = confirmatory factor analysis; MSLQ = Motivated Strategies for Learning Questionnaire; HBCU = historically Black college/university; χ2 = chi-square statistic; df = degrees of freedom; CFI = Comparative Fit Index; SRMR = standardized root mean residual; RMSEA = root mean square error of approximation; AIC = Akaike Information Criterion; BCC = Browne-Cudeck Criterion; BIC = Bayesian Information Criterion; ECVI = expected cross-validation index; CI = confidence interval; MSLQ-R = MSLQ-R = respecified Motivated Strategies for Learning Questionnaire.
RMSEA: .063 CI [.058, .063].
RMSEA: .058 CI [.054, .062].
p < .001.
Having unsatisfactory model fit results, CFA procedures were used to respecify the factorial structure to better account for the observed data (Floyd & Widaman, 1995). First, any scale that loaded on second-order factors at <.5 was removed. Consequently, the following scales were removed: Extrinsic Goal Orientation, Test Anxiety, Peer Learning, and Help Seeking. Second, any item that loaded on first-order factors at <.5 was removed. In the end, there were 48 items across 11 scales that remained after respecification, and a third-order factor structure was retained. As shown in Table 3, the fit indices for respecified MSLQ model, labeled MSLQ-R, were: χ2/df = 1.88, SRMR = .07, CFI = .84, and RMSEA = .06. Except for SRMR, these indices support an adequate but marginal fit (Meyers et al., 2013). In addition, the model comparison fit measures, AIC, BCC, BIC, and ECVI, are all three times smaller for MSLQ-R compared to MSLQ, indicating a substantially improved fit to data.
Invariance across groups
Invariance testing was conducted on the MSLQ-R across distinct groups within the HBCU sample following the procedure from Chen et al. (2005). The analysis used IBM SPSS Amos 23 to evaluate the difference between an unconstrained model, which assumes that the groups are yielding different values of the parameters when the model is applied to the data; and a constrained model, which assumes that the groups are yielding equivalent values of the parameters when the model is applied to the data. The series of tests for multigroup invariance examined six increasingly restrictive hierarchical CFA models. Model 1 was baseline, tested across a group by multigroup CFA and in which simultaneously fit indices for each member were estimated at the same time. The fit to Model 1 served as the baseline or configural model for the groups being considered and had no constraints imposed on any parameter. Therefore, the configural model presented the same structure to each group before deriving fit results to which all other models were compared. Model 2 constrains all factor loadings to be equal across groups. Testing invariance of factor loadings across groups evaluates Δχ2 and ΔCFI generated for the differences between Model 2 and Model 1. Models 3 through 6 apply additional constraints of equality, in hierarchical order, on factor variances (Model 3), factor convariances (Model 4), factor errors (Model 5), and item errors (Model 6). Invariance testing for each of these increasingly more stringent, nested models evaluates the associated Δχ2 and ΔCFI generated on the current and preceding model.
Tests for multigroup invariance were run separately on groups identified by major (STEM = 147, not STEM = 111), gender (female = 173, male = 85), classification (freshman/sophomore = 144, junior/senior = 114), and course-taking (mathematics = 135, science = 123). The MSLQ-R was found to be invariant across major, gender, classification, and course-taking for CFA Models 1 through 5 with all values of Δχ2 nonsignificant and all values of ΔCFI <.01. Table 4 shows fit indices for groups identified by major and is illustrative of the fit outputs for each of the other groups identified within the HBCU sample. For Model 6, the most stringent constraints, even though Δχ2 was statistically significant at p < .05 level for all groups, the values of ΔCFI < .01 for all groups. Therefore, only at the level of item errors (Model 6) is the MSLQ-R only slightly noninvariant for all groups.
Goodness-of-Fit Statistics for Tests of MSLQ-R Multigroup Invariance: STEM/Non-STEM Major

Note. Four groups within the HBCU sample were identified by: major (STEM = 147, not STEM = 111), gender (female = 173, male = 85), classification (freshman/sophomore = 144, junior/senior = 114), and course-taking (mathematics = 135, science = 123). Group invariance results shown in this table are for major (STEM, not STEM). MSLQ-R = MSLQ-R = respecified Motivated Strategies for Learning Questionnaire; CFI = Comparative Fit Index; SRMR = standardized root mean square residual; RMSEA = root mean square error of approximation; CI = confidence interval.
MSLQ-R subscales and latent factors
The 11 scales (48 items) of the MSLQ-R are listed in Appendix B. Correlation between the second-order factors, Motivation-R and Learning Strategies-R, is .59. The Motivation factor consists of Value-R (intrinsic goal orientation [4], Task Value-R [5]) and Expectancy (control of learning beliefs [4], self-efficacy for learning and performance [8]). The Learning Strategies factor consists of Cognitive-R and Resource Management-R scales. Cognitive-R factor consists of rehearsal (4), elaboration-R (5), organization-R (2), critical thinking-R (4), and metacognitive self-regulation-R (8). Resource Management-R factor consists of time and study environment-R (4) and effort regulation-R (2). Note that there were three scales on MSLQ-R that remained identical to the scales of the original MSLQ. Also, organization-R and effort regulation-R scales are specified by only two items each, and they did not cause negative error variances (Heywood cases) on MSLQ-R.
The standardized and unstandardized coefficients for the MSLQ-R are shown in Table 5. The beta weight for self-efficacy for learning and performance at .67 is the lowest in the Expectancy-R factor. The beta weight for Critical Thinking-R at .71 is the lowest in the Strategy Use-R factor. The remaining beta weights are strong. Correlations between latent variables on the MSLQ-R and EOC grades are shown in Table 6. Notable is the Strategy Use-R factor does not correlate with EOC grade.
Standardized and Unstandardized Coefficients for CFA Respecified MSLQ-R

Note. CFA = confirmatory factor analysis; MSLQ-R = respecified Motivated Strategies for Learning Questionnaire.
Bivariate Correlations Between MSLQ-R Latent Variables and EOC Grades

Note. All values are statistically significant at p < .001. N = 233. MSLQ-R = respecified Motivated Strategies for Learning Questionnaire; EOC = end-of-course.
Scale statistics and reliability coefficients for MSLQ-R are shown in Table 7. Scale reliabilities associated with MSLQ-R, range from acceptable to excellent values. The reliabilities for the four latent variables of the MSLQ-R are also included in Table 7. The reliabilities of latent factors Strategy Use-R and Resource Management-R are .88 and .79, respectively, and these are much improved over both of their composite scales. The reliabilities of latent factors Value-R and Expectancy-R are not improved over their composite scales. The reliability for Expectancy-R is worse than its composite subscales control of learning beliefs and self-efficacy for learning and performance. These two subscales are exactly the same as on the original MSLQ and have been shown to be good-performing individually. Therefore, issues remain with Expectancy-R as a latent construct.
Scale Means, Standard Deviations, and Reliabilities for MSLQ-R on HBCU Sample.
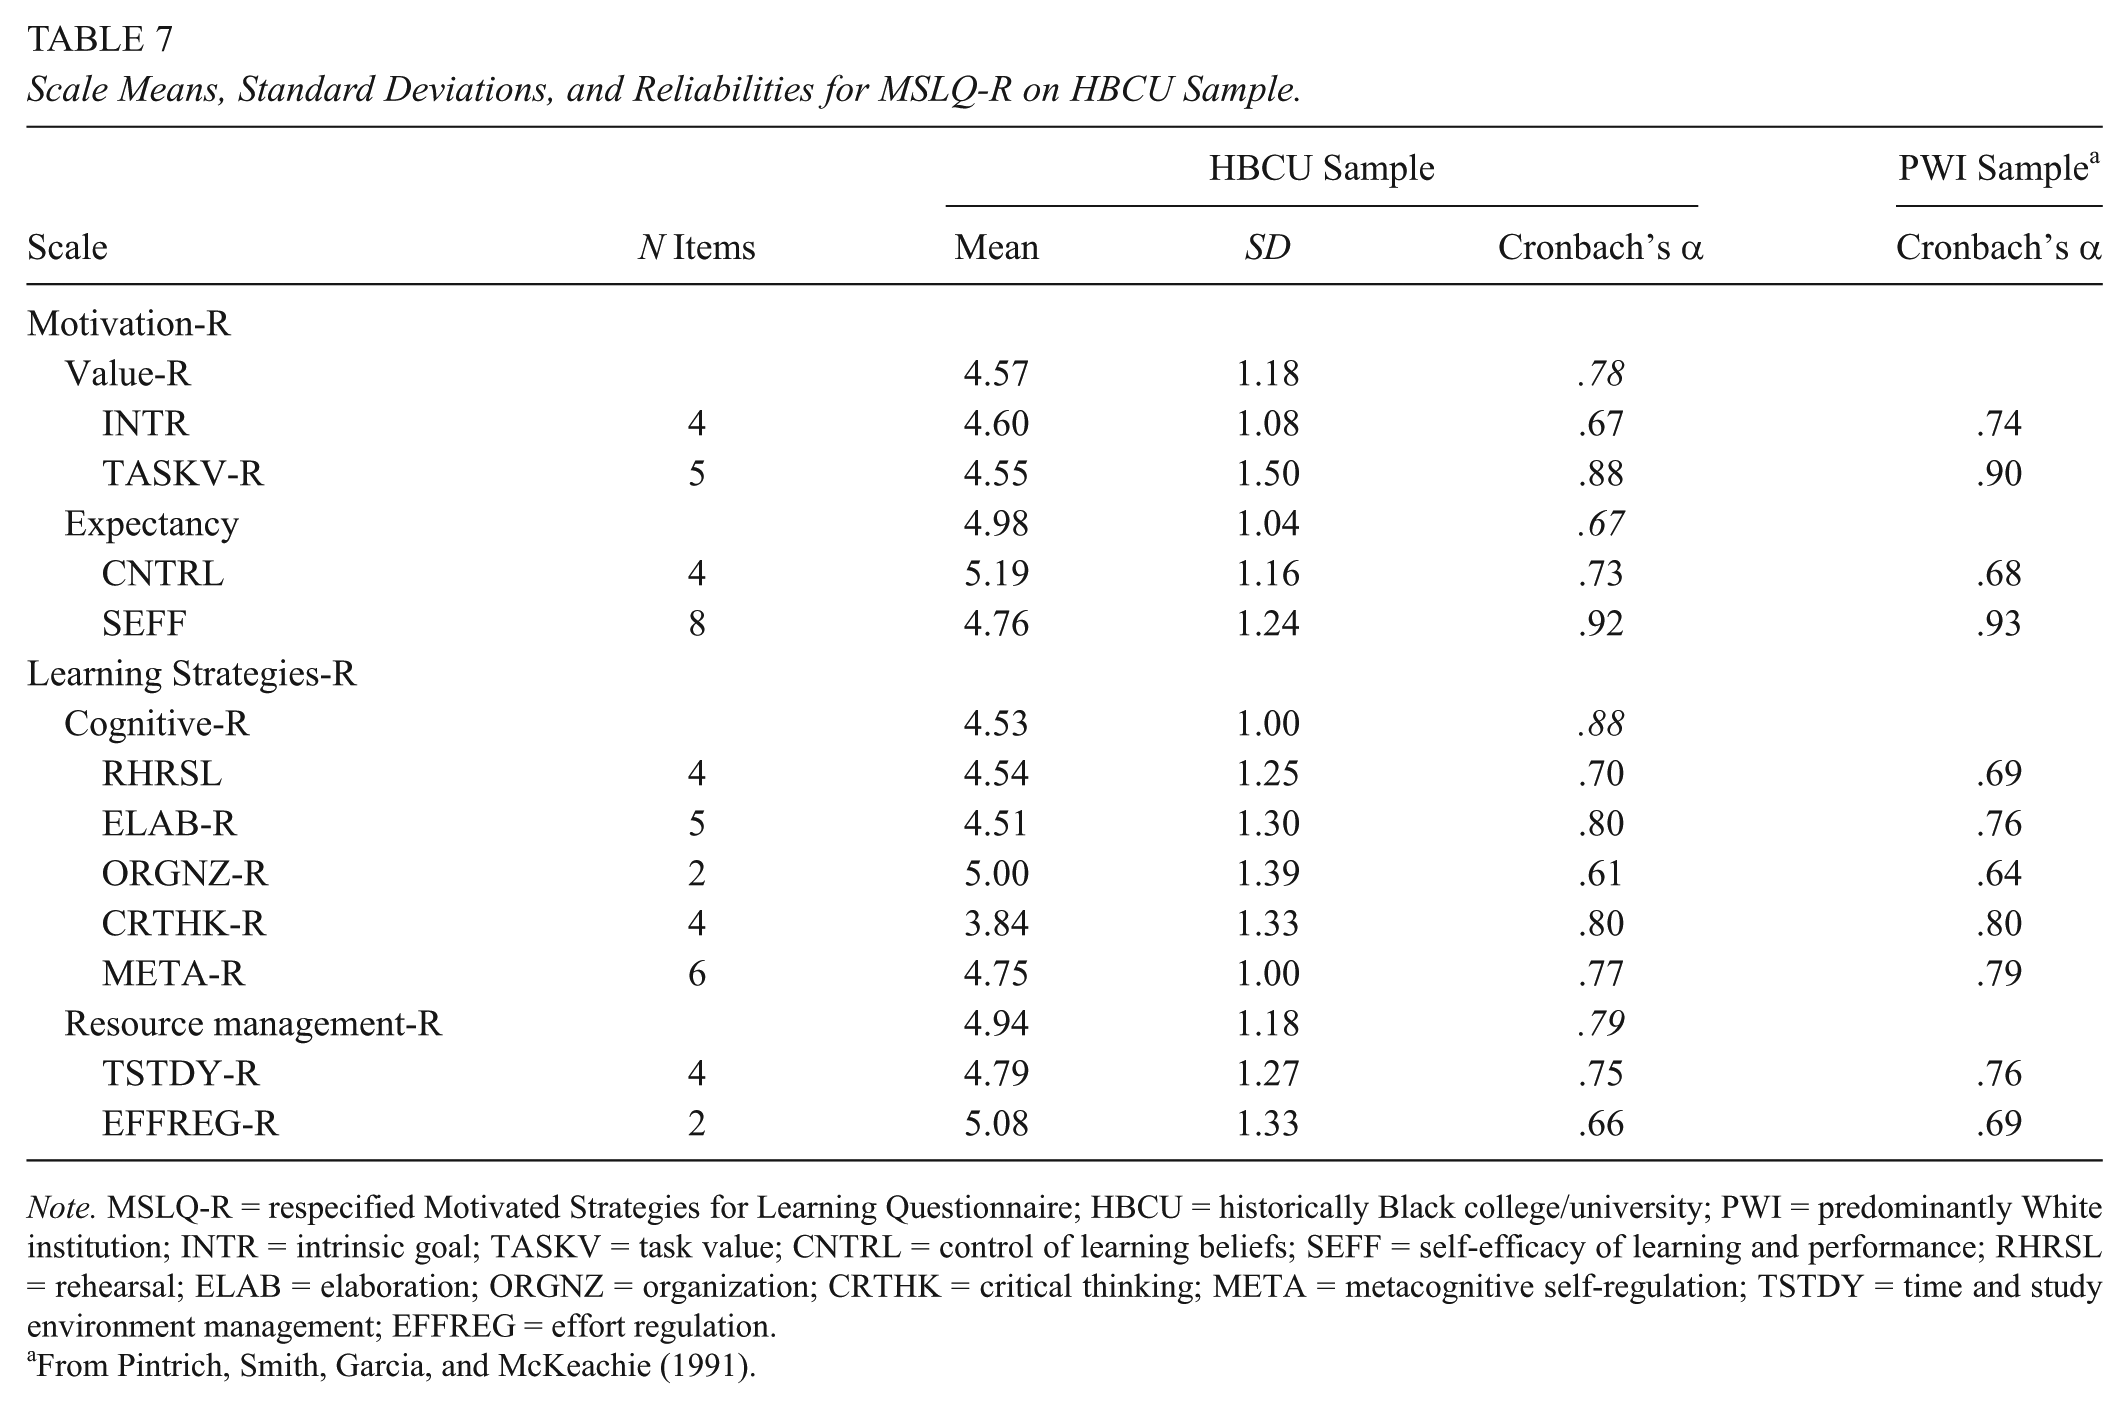
Note. MSLQ-R = respecified Motivated Strategies for Learning Questionnaire; HBCU = historically Black college/university; PWI = predominantly White institution; INTR = intrinsic goal; TASKV = task value; CNTRL = control of learning beliefs; SEFF = self-efficacy of learning and performance; RHRSL = rehearsal; ELAB = elaboration; ORGNZ = organization; CRTHK = critical thinking; META = metacognitive self-regulation; TSTDY = time and study environment management; EFFREG = effort regulation.
Correlations between EOC grades and MSLQ-R scales are shown in Table 8. Scales that reflect self-regulation behaviors include Task Value-R, Self-Efficacy for Learning and Performance, Time and Study Environment-R, and Effort Regulation-R and these have the highest correlations with EOC grade. In addition, Elaboration-R, Organization-R are significantly correlated with EOC grades. Surprisingly, Metacognitive-R is not correlated with EOC grades. A hierarchical regression analysis was conducted to identify combinations of MSLQ-R variables that predict EOC grades while controlling for cumulative GPA of students in HBCU Sample. Only Self-Efficacy for Learning and Performance remained as a predictor of EOC grade when controlling for cGPA and accounts for 4% of variance in EOC grades, ΔR2adj = .04, ΔF(1, 2310) = 23.80, p < .001.
Bivariate Correlations Between MSLQ-R Subscales and End-of-Course Grades for HBCU Sample.

Note. MSLQ-R = respecified Motivated Strategies for Learning Questionnaire; HBCU = historically Black college/university; INTR = intrinsic goal; TASKV = task value; CNTRL = control of learning beliefs; SEFF = self-efficacy of learning and performance; RHRSL = rehearsal; ELAB = elaboration; ORGNZ = organization; CRTHK = critical thinking; META = metacognitive self-regulation; TSTDY = time and study environment management; EFFREG = effort regulation.
p < .05. **p < .01.
Multivariate analysis of variance
The mean cGPA for entire HBCU Sample (N = 258) was M = 2.79, SD = .74. Group comparisons were made between 65 HA students (M = 3.71, SD = .23) and 55 LA students (M = 1.78, SD = .56) from the study sample. With cGPA as a covariate, the multivariate main effect was significant by achievement levels, Wilks’ λ = .69, F(11, 108) = 4.41, p < .001, partial η2 = .31, and observed power = 1.00. This is strong indication that some MSLQ-R scales can discriminate between high and low achievement levels. A summary of univariate ANOVAs is given in Table 9, and the MSLQ-R scale means and standard deviations by achievement level are given in Table 10. Seven MSLQ-R scales show significant differences between achievement groups with the high-achieving group presenting higher mean scores on all of these scales. The Self-Efficacy for Learning and Performance scale has the largest discriminating effect, F(1, 118) = 25.70, p < .001, partial η2 = .18. The scales with the next largest discriminating effect are: Effort Regulation-R, F(1, 118) = 9.90, p < .01, partial η2 = .08; and Time and Study Environment Management, F(1, 118) = 8.36, p < .01, partial η2 = .07. Other research studies have also shown the self-efficacy scale to reveal the largest differences in scores by achievement level (Vanderstoep et al., 1996; VanZile-Tamsen & Livingston, 1999; Zusho et al., 2003). The effort regulation and time and study environment management variables additionally yield significant observable differences by achievement level in the current study.
Summary of Univariate ANOVAs for Achievement Groups on MSLQ-R
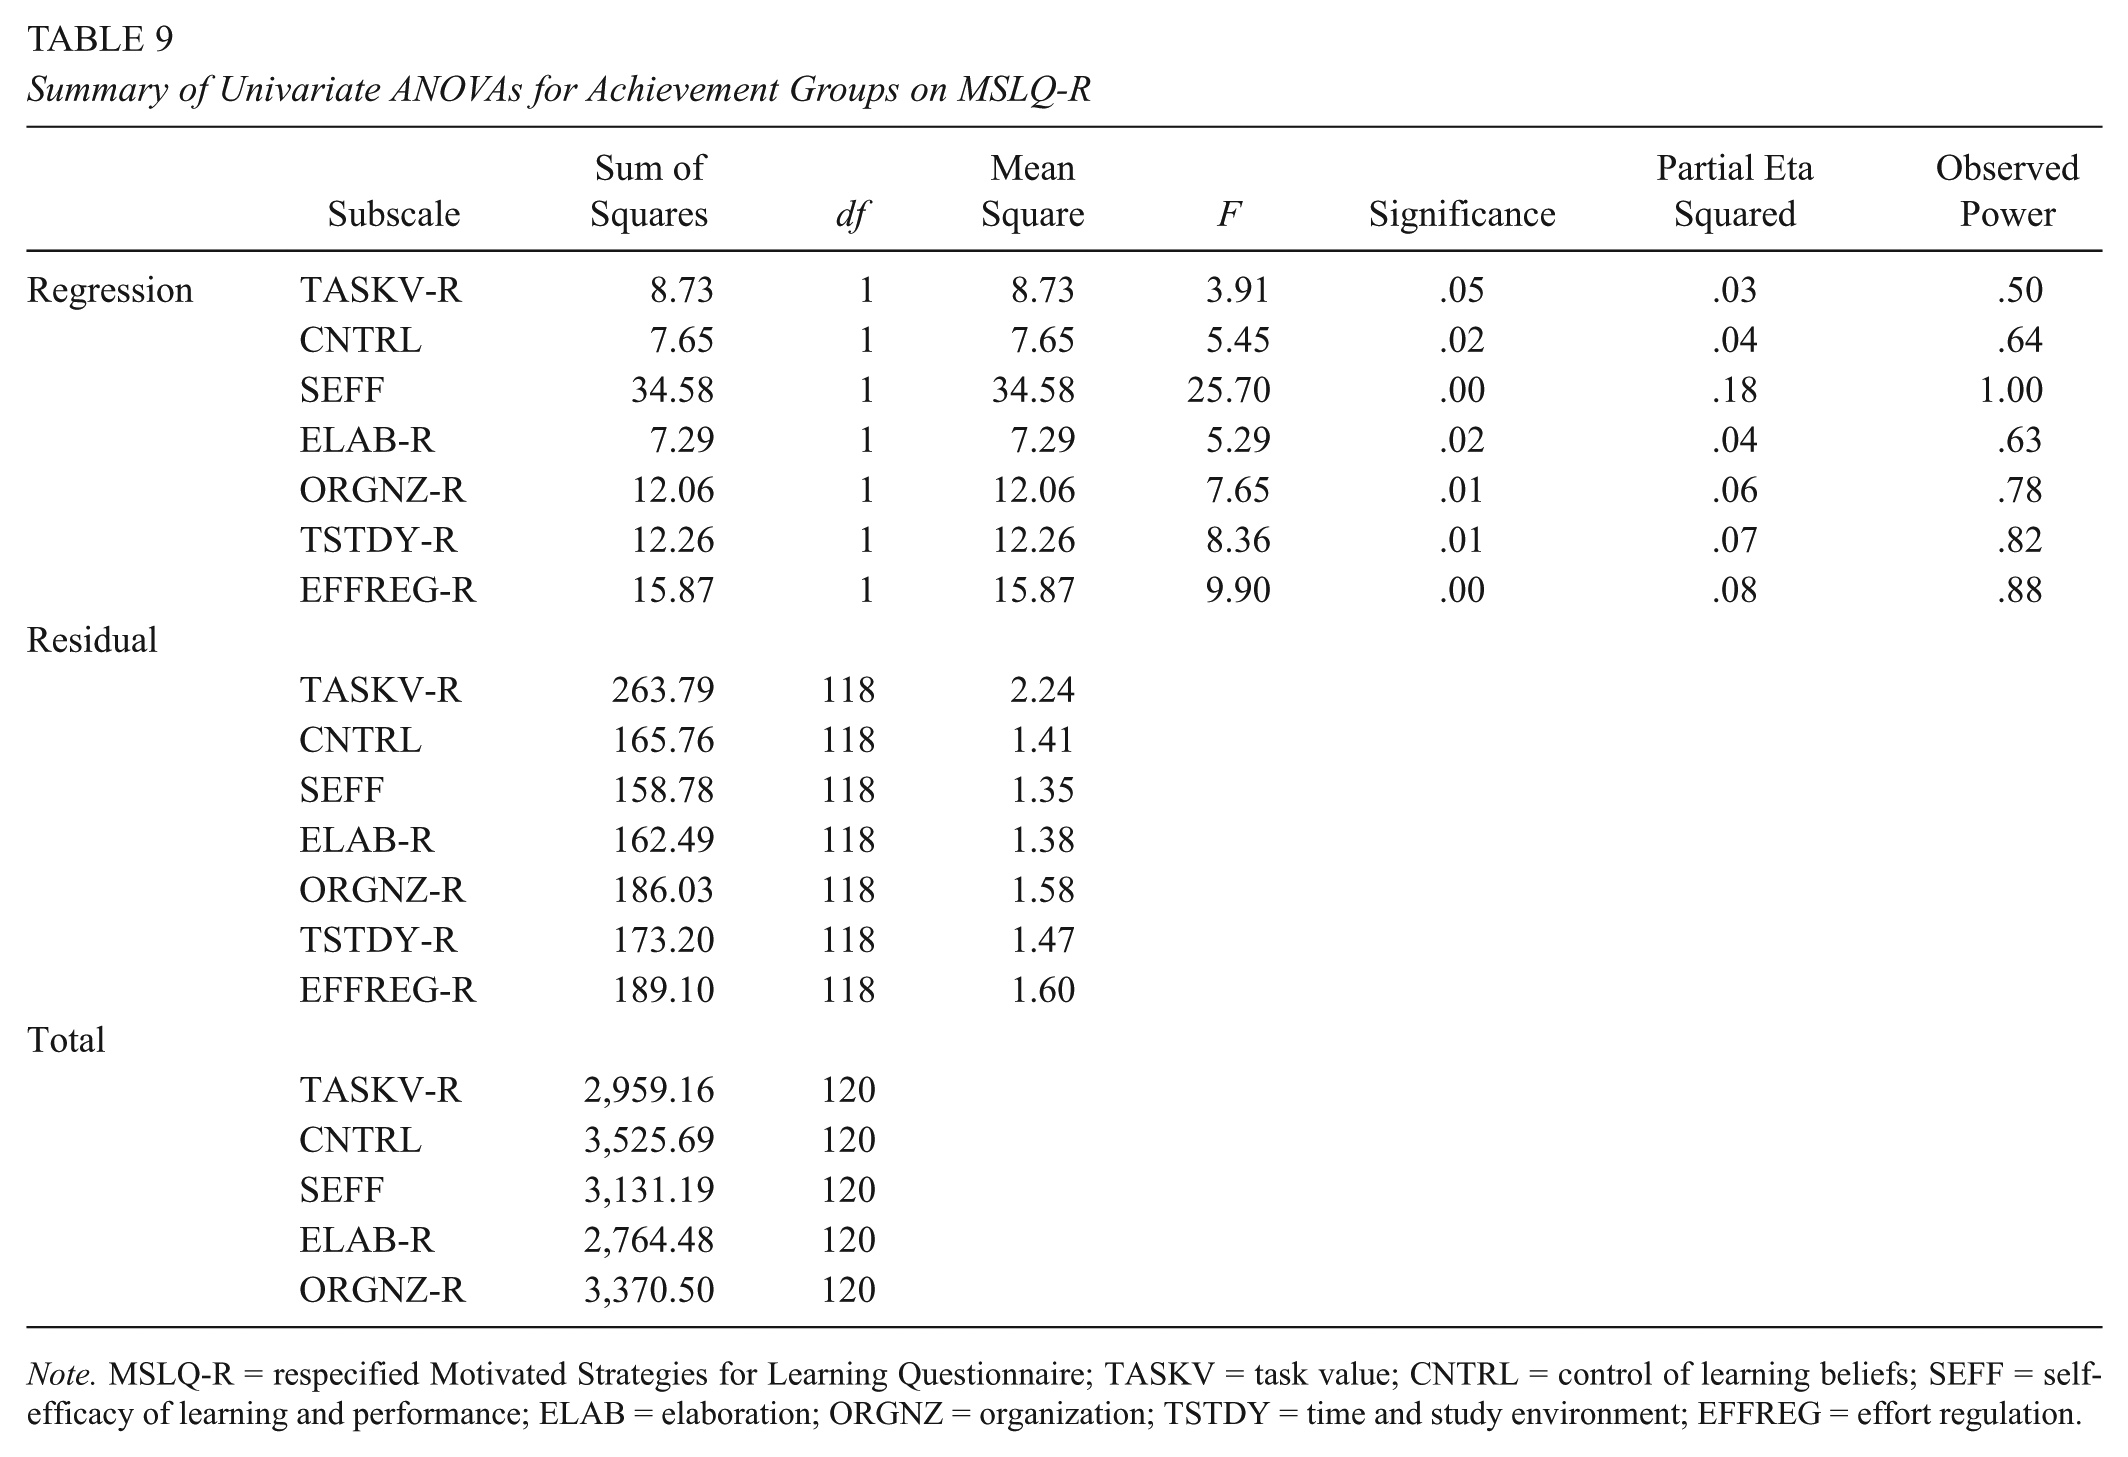
Note. MSLQ-R = respecified Motivated Strategies for Learning Questionnaire; TASKV = task value; CNTRL = control of learning beliefs; SEFF = self-efficacy of learning and performance; ELAB = elaboration; ORGNZ = organization; TSTDY = time and study environment; EFFREG = effort regulation.
Group Means and Standard Deviations of MSLQ-R Subscale Scores by Achievement Level for HBCU Sample

Note. MSLQ-R = respecified Motivated Strategies for Learning Questionnaire; HBCU = historically Black college/university; TASKV = task value; CNTRL = control of learning beliefs; SEFF = self-efficacy of learning and performance; ELAB = elaboration; ORGNZ = organization; TSTDY = time and study environment; EFFREG = effort regulation.
Discussion
Evidence regarding the reliability and validity of the MSLQ for diverse ethnic groups has not been readily available. The current study tested the validity of MSLQ on a sample of college students that was 75% African American who were taking STEM courses at an HBCU. The MSLQ did not fit the sample data; therefore, this work provides additional evidence of psychometric problems with the MSLQ for diverse populations. Unlike previous factor-analytic studies that separately analyzed the Motivation and Learning Strategies sections of the MSLQ, this study analyzed the MSLQ as a third-order factor model inclusive of the entire 81 items and 15 scales and presents a revised instrument that may be a more sensitive measure of self-regulated learning behaviors of the population in the study. A stringent model respecification procedure, including a cutoff for variables loading <.5, subsequently guided removal of some first-order factors, specifically Extrinsic Goal Orientation, Test Anxiety, Peer Learning, and Help Seeking scales. Removal of these specific scales is consistent with several other studies that consistently reported them as not performing well (Credé & Phillips, 2011; Hilpert et al., 2013). Further systematic analysis, including a cutoff for survey items loading <.5, identified removal of survey items on several scales, including Metacognitive Self-Regulation, Effort Regulation, and Time and Study Environment Management scales. The resulting respecified measure, MSLQ-R, consisted of 48 of the original 81 items that were structured in 11 scales, five second-order factors, and two third-order factors while retaining close resemblance to the scale terminology defined by Pintrich and colleagues (1993). An acceptable model fit to the HBCU sample data was achieved for the MSLQ-R as determined by current guidelines for comparison indices in factor analysis. Several subgroups within the HBCU sample that were identified had independent group associations by major, gender, undergraduate classification, and STEM course type. Model invariance testing was carried out, and baseline tests revealed that the same meaning for the MSLQ-R was attributed by each group. Results from more stringent hierarchical tests of measurement invariance showed equivalence of the MSLQ-R across all comparison groups on (a) number of factors in the model, (b) factor loading, (c) item and factor variances and covariances, and (d) factor errors.
Results supported a third-order factor structure for the MSLQ-R (see Appendix C, Figure C1). There were mixed results regarding the four second-order latent constructs of the MSLQ-R (see Table 5). The Value and Resource Management constructs had excellent associations with each of their underlying factors, however the Expectancy construct did not. The Control of Learning Beliefs scale and Self-Efficacy for Learning and Performance scale were both unchanged from the original MSLQ and they comprise the Expectancy construct. Although the association of learning beliefs variable with Expectancy was excellent, there was a poor association of self-efficacy variable with Expectancy. This was unexpected because self-efficacy had the highest reliability and was the strongest predictor of student academic performance. Also, the reliability for Expectancy was more than 8% less than the lowest of the two subscales that comprised this construct (see Table 7). The conclusion is that the self-efficacy and learning beliefs variables, as defined by MSLQ, do not combine well to indicate an expectancy latent construct. There may be a non-unidimensional problem with the 8-item Self-Efficacy for Learning and Performance scale of MSLQ.
For the first-order factors, the reliability coefficients for all 11 of the MSLQ-R scales were at or above acceptable levels (Table 7). Reliability coefficients were excellent for Task Value-R and Self-Efficacy for Learning and Performance scales. Results of MSLQ-R scale correlations with EOC grade (see Table 8) show self-efficacy, task value, effort regulation, and time and study environment management variables as the highest correlates with EOC grades. These findings are consistent with other studies that report one or more of these four motivation and behavioral variables as the highest correlates with EOC grades (Al-Harthy et al., 2010; Credé & Phillips, 2011; Kitsantas et al., 2008; Komarraju & Nadler, 2013; Lynch, 2006; Zusho et al., 2003). For the cognitive strategy use variables, only organization was significantly correlated with EOC grade for the HBCU sample. However, neither metacognitive self-regulated learning nor any of the other cognitive strategy use variables correlated significantly with EOC grade. End-of-course grade may not be a suitable outcome measure for cognitive and metacognitive learning strategies because EOC grades are aggregates of several disparate elements such as homework, lab work, reports, quizzes, and exams, and some or none of the learning strategies as defined by the MSLQ may be effective for each of these tasks.
The respecified MSLQ (MSLQ-R), with 11 scales, appears to be valid and reliable for the HBCU sample. The MSLQ-R appears to be valid and reliable for three latent constructs denoted as: Value-R, Cognitive-R, and Resource Management-R. Two respecified scales, Time and Study Environment-R and Effort Regulation-R describe self-regulation behaviors, comprise latent construct Resource Management-R therefore, Academic Self-Regulation would be a more suitable name for this latent construct.
The current study also examined differences in self-regulated learning propensities by achievement level of students. Large effect differences by achievement levels were observed when measured by MSLQ-R for a motivation variable (self-efficacy) and two self-regulation variables (time and study environment management and effort regulation). Therefore, these scales of the MSLQ-R can distinguish between high- and low-achieving students, as similarly found in other studies (Vanderstoep et al., 1996; VanZile-Tamsen & Livingston, 1999; Zusho et al., 2003). This capacity for differential measurement by academic achievement level is useful for research and practice as a potential diagnostic to target areas of need and to develop and test suitable self-regulated learning interventions.
Limitations of the Study
In the current study, factor structure of the MSLQ was assessed through confirmatory factor analysis. A better model fit to the HBCU sample data was achieved through respecification of the MSLQ, carried out in a systematic way using CFA exploratory techniques, and the results are repeatable and reproducible. However, this procedure may have limited the possibility of finding loadings for new and different factors more compatible with the population, context, and content associated with the study. The sample size precluded the option of conducting a split-sample exploratory factor analysis and follow-on independent sample CFA. Consequently, there was no testing on an independent sample to assess the stability of the respecified MSLQ.
Conclusion
Improving the rate of success for students in STEM gatekeeper courses logically should lead to their persistence in the STEM major and ultimately their degree completion. The academic performance and achievement outcomes that are possible through self-regulated learning resonates with educators and researchers who are committed to producing more underrepresented minorities with STEM degrees. In the current study, testing and adapting a widely used instrument on an under-sampled population revealed some different and similar findings compared to the body of literature on self-regulated learning at the college level. For example, student’s self-efficacy for learning and performance in the course was the only predictor of EOC grade when controlling for cGPA, however no self-regulated learning variables correlated significantly with EOC grade.
Although the static, self-report instrument used in this study does not capture the dynamic self-regulated learning behaviors idealized in the literature (Chemers et al., 2001; Schraw et al., 2006), the power of the instrument is evident in group difference measurements. A snapshot of the self-regulated learning pattern captured on high-achieving students tended toward higher self-efficacy for learning and performing tasks, control of learning beliefs, and task value; and higher regulation of effort, organization, and management of time and study environment (see Table 10). In contrast, perhaps students in the low achieving group, not exhibiting this pattern, come into the course already convinced or conclude later, after failure on an assignment, that they are not effective at STEM learning. If students do not believe that their efforts will lead to success on STEM tasks, then they do not become self-efficacious about their learning strategies. Consequently, these students break from their goals and put their efforts into “just getting through” the task or the class. According to Kaplan (2008), students in this disengagement mode do not adopt learning as their main purpose of engagement and exhibit more “self-regulated achievement” than “self-regulated learning behavior.”
Supplemental Material
DS_10.1177_2332858418809346 – Supplemental material for Validating and Adapting the Motivated Strategies for Learning Questionnaire (MSLQ) for STEM Courses at an HBCU
Supplemental material, DS_10.1177_2332858418809346 for Validating and Adapting the Motivated Strategies for Learning Questionnaire (MSLQ) for STEM Courses at an HBCU by Caesar R. Jackson in AERA Open
Footnotes
Appendix A
Appendix B
Motivated Strategies for Learning Questionnaire (MSLQ) Scales and (Respecified) MSLQ-R Scales

| MSLQ | MSLQ-R | ||||||
|---|---|---|---|---|---|---|---|
| Scale | Subscale | Acronym | Count | Items Comprising Scale | Acronym | Count | Items Comprising Scale |
| Motivation | |||||||
| Value | Value-R | ||||||
| Intrinsic goal orientation | INTR | 4 | 1, 16, 22, 24 | INTR | 4 | 1, 16, 22, 24 | |
| Extrinsic goal orientation | ENTR | 4 | 7, 11, 13, 30 | ||||
| Task value | TASKV | 6 | 4, 10, 17, 23, 26, 27 | TASKV-R | 5 | 4, 17, 23, 26, 27 | |
| Expectancy | Expectancy | ||||||
| Control of learning beliefs | CNTRL | 4 | 2, 9, 18, 25 | CNTRL | 4 | 2, 9, 18, 25 | |
| Self-efficacy for learning and performance | SEFF | 8 | 5, 6, 12, 15, 20, 21, 29, 31 | SEFF | 8 | 5, 6, 12, 15, 20, 21, 29, 31 | |
| Affective | |||||||
| Test anxiety | TANX | 5 | 3, 8, 14, 19, 28 | ||||
| Learning Strategies | |||||||
| Strategy Use | Strategy Use-R | ||||||
| Rehearsal | RHRSL | 4 | 39, 46, 59, 72 | RHRSL | 4 | 39, 46, 59, 72 | |
| Elaboration | ELAB | 6 | 53, 62, 64, 67, 69, 81 | ELAB-R | 5 | 53, 62, 64, 69, 81 | |
| Organization | ORNGZ | 4 | 32, 42, 49, 63 | ORGNZ-R | 2 | 42, 63 | |
| Critical thinking | CRTHK | 5 | 38, 47, 51, 66, 71 | CRTHK-R | 4 | 47, 51, 66, 71 | |
| Metacognitive self-regulation | META | 12 | 33R, 36, 41, 44, 54, 55, 56, 57R, 61, 76, 78, 79 | META-R | 6 | 41, 44, 54, 55, 76, 78 | |
| Resource Management | Resource Management-R | ||||||
| Time and study environment | TSTDY | 8 | 35, 43, 52R, 65, 70, 73, 77R, 80R | TSTDY-R | 4 | 35, 43, 65, 70 | |
| Effort regulation | EFFREG | 4 | 37R, 48, 60R, 74 | EFFREG-R | 2 | 48, 74 | |
| Peer learning | PEERLRN | 3 | 34, 45, 50 | ||||
| Help seeking | HPSEEK | 4 | 40R, 58, 68, 75 | ||||
Appendix C
Author
CAESAR R. JACKSON is professor of physics. His current research is science education research focusing on issues associated with increasing the number of minorities pursuing degrees and careers in STEM.
References
Supplementary Material
Please find the following supplemental material available below.
For Open Access articles published under a Creative Commons License, all supplemental material carries the same license as the article it is associated with.
For non-Open Access articles published, all supplemental material carries a non-exclusive license, and permission requests for re-use of supplemental material or any part of supplemental material shall be sent directly to the copyright owner as specified in the copyright notice associated with the article.