
Abstract
As states continue to implement the Common Core State Standards (CCSS), state educational agencies (SEAs) are providing professional development and curricular resources to help districts and teachers understand the standards. However, little is known about the resources SEAs endorse, the states and/or organizations sponsoring these resources, and how states and organizations are connected. This study investigates the secondary English/language arts resources provided by 51 SEAs (2,023 resources sponsored by 51 SEAs and 262 intermediary organizations). Social network analysis of states and sponsoring organizations revealed a core-periphery network in which certain states and organizations were frequently named as the sponsors of resources, while other organizations were named as resource sponsors by only one state. SEAs are providing a variety of types of resources, including professional development, curriculum guidelines, articles, and instructional aids. This study offers insight into the most influential actors providing CCSS resources at the state level, as well as how SEAs are supporting instructional capacity through the resources they provide for teachers.
Keywords
T
State educational agencies (SEAs) play a key role in fulfilling the promise of greater coherence across the loosely coupled American educational system, especially with the recent passage of the Every Student Succeeds Act (ESSA) returning more control to the state level. Historically, SEAs have focused on compliance and monitoring but increasingly serve as instructional leaders in the era of standards-based reform (Murphy & Hill, 2011). Instructional guidance from SEAs may take many forms, such as providing statewide professional development, creating curricular resources, or vetting external curriculum and professional development resources. In the context of CCSS implementation, SEAs and other organizations are providing professional development and curricular resources to help teachers think about what the CCSS means for classroom instruction. However, little is known about the types of resources SEAs endorse, which SEAs and/or organizations have sponsored these resources, and how SEAs and organizations are connected to each other.
To investigate these issues, we collected over 2,000 curricular and professional development resources for secondary English/language arts (ELA) from the websites of 51 SEAs (50 states and the District of Columbia). We used social network analysis to visualize the relationships between SEAs and the organizations sponsoring these resources. Then, we coded the resources for their category, type, and emphasis in order to understand the kinds of ELA resources that SEAs provided on their websites. We focused our work on ELA because some research finds that the CCSS represent a greater difference from previous state standards in ELA as compared to mathematics (Porter, McMaken, Hwang, & Yang, 2011). Further, although some research has explored the extent to which popular elementary mathematics curricula are aligned with the CCSS (Polikoff, 2015), less is known about the types of ELA resources that exist.
Social network analyses in education are often used to understand school- or district-level relationships among local actors (e.g., Coburn & Russell, 2008; Daly, 2012; Finnigan, Daly, & Che, 2013; Moolenaar, 2012). Researchers have recently used social network analysis to analyze patterns of foundation funding (Reckhow, 2013), CCSS politics (Supovitz, Daly, & del Fresno, 2015), and local-level implementation of the CCSS (Supovitz, Fink, & Newman, 2016). However, this is the first study to use social network analysis to understand the national landscape of CCSS implementation by investigating SEA-provided resources. This work provides an entry point for understanding the types of standards-based curricular resources that SEAs are endorsing for teachers across the country, the connections between SEAs and organizations, and the ways that SEAs are approaching the task of building instructional capacity for new standards.
Below, we describe the policy context for this study, including the CCSS and the federal Race to the Top (RTTT) grants. Then, we describe the literature on the role of intermediary organizations and SEAs in policy implementation. Subsequently, we explain our data and analyses. Finally, we describe our findings about the connections between SEAs and resource providers, and the types of resources SEAs are providing to support standards implementation.
Background
The Common Core State Standards
The CCSS initiative was spearheaded by the Council of Chief State School Officers (CCSSO) and the National Governors Association (NGA) with the goal of creating a common set of standards across states, unlike the state-by-state standards mandated under No Child Left Behind (NCLB). The CCSS, adopted by most states in 2010, are now seen as controversial due to perceived federal overreach, connection to unpopular CCSS tests, concerns about developmental appropriateness, and involvement with for-profit corporations, among other reasons (McGuinn, 2015). However, those involved in the standards effort believe that common standards provide increased coherence and will enable states to deliver a higher quality of education through several mechanisms.
First, standards aligned to expectations of college entrance benefit states, K–12 institutions, and postsecondary institutions by sending clear and consistent signals across states about the knowledge and skills students need for postsecondary success in college or careers. The standards were designed to be back-mapped from expectations for college readiness. Therefore, an important part of the rationale for the CCSS was the increased potential for equitable learning opportunities by providing students with more even access to higher standards. Exposure to higher standards would allow more students to enter college without remediation and be better prepared to successfully enter the workforce.
Common standards could also enable economies of scale in assessments, curriculum, and professional development, which could allow resources to be shared across state lines and provide cost savings for states (Kornhaber et al., 2014). Interviews with CCSS policy entrepreneurs revealed that one of the primary benefits of common standards was that the quality of curriculum and professional development would increase as ideas and resources were shared across states (Kornhaber et al., 2014). Indeed, newspaper reports suggest that districts may be using some curricular materials and professional resources from other states, rather than from textbook publishers (e.g., Heitin, 2015; Monahan, 2015). For example, a recent article in The Hechinger Report describes primary school students in Berkeley, California, coming home with mathematics worksheets from EngageNY, a website sponsored by the New York State Education Department that has a large collection of CCSS resources (Monahan, 2015).
These anecdotal findings of teachers seeking materials from EngageNY in particular have also been confirmed through large-scale national and multistate teacher surveys of CCSS implementation, suggesting that teachers are using materials and resources from outside their own districts and states (Kane, Owens, Marinell, Thal, & Staiger, 2016; Opfer, Kaufman, & Thompson, 2016). The U.S. Department of Education has also encouraged the sharing of instructional resources across state lines through their #GoOpen initiative, in which participating states will create databases of free online materials and participating districts will replace at least one textbook with these resources (Zubrzycki, 2016). Invoking the CCSS theory of action, U.S. secretary of education John King said the resources will “provid[e] all students, regardless of zip code, access to high-quality learning materials that have the most up-to-date and relevant content” (U.S. Department of Education, 2016). Our work engages with this aspect of policy entrepreneurs’ theory of action for the CCSS by gathering and analyzing national-level data; in this paper, we document the states and organizations that provide CCSS materials, illuminating the national landscape of professional development and instructional resources offered at the state level to secondary ELA teachers.
In sum, CCSS proponents believe that having uniform, high standards across states could improve college readiness and the overall quality of education across state lines. In order to support CCSS implementation, many states turned to RTTT.
Race to the Top
RTTT was a federal grant program initiated in 2009 as part of the American Recovery and Reinvestment Act. States competed for a portion of $4.3 billion during a time of recession and budget shortfalls; the 46 states that applied were awarded points in a number of categories focused on adopting particular policies (like college- and career-ready standards and new ways of measuring teacher effectiveness) and creating favorable conditions for policy implementation. For example, states received points for “building strong statewide capacity to implement, scale up, and sustain proposed plans” and “supporting the transition to enhanced standards and high quality assessments” (Federal Register, as cited in Kolbe & Rice, 2012, p. 190). There is debate about the extent to which RTTT induced states to adopt the CCSS; some research indicates states that adopted the CCSS were likely to do so regardless (LaVenia, Cohen-Vogel, & Lang, 2015). Research examining RTTT applications suggests that CCSS states that won RTTT used a portion of the funds to support CCSS implementation (Kolbe & Rice, 2012; Kornhaber, Barkauskus, & Griffith, 2016).
In some states, RTTT grants supported CCSS implementation by funding the creation of CCSS resources. For example, a recent U.S. Department of Education report about the RTTT grant winners praises New York for using their RTTT funds to commission CCSS curriculum materials (U.S. Department of Education, 2015). New York partnered with Expeditionary Learning to create ELA curriculum materials, and indeed, RTTT-winning states often proposed to partner with a variety of nonsystem actors (Russell, Meredith, Childs, Stein, & Prine, 2014).
Russell et al. (2014) also point out that SEAs’ RTTT applications position SEAs to manage and coordinate a network of external organizations. Since this work aims to understand which organizations are in the network of state-provided standards resources, we also draw on the literature on the role of SEAs and the role of intermediary organizations in the policy process.
The Role of SEAs in Policy Implementation
Despite the long tradition of local control over education in the United States, the role of the state has gradually increased since the Elementary and Secondary Education Act of 1965 (Fusarelli & Cooper, 2009). Since the rise of standards-based reform in the 1990s, states have played a key role in building capacity to support local districts’ efforts to implement standards. Massell’s (1998a, 1998b) work on SEAs’ support of standards-based reform documents the ways in which states have gradually assumed greater responsibility for teaching and learning, rather than gathering data and monitoring compliance.
As part of their mission around building instructional capacity, Massell (1998a) describes the states’ role as “building external infrastructure to provide professional development and technical assistance, setting professional development and training standards, providing curriculum materials, and organizing and allocating resources” (p. iv). In addition, Massell (1998b) classifies the strategies that SEAs use to build instructional and organizational capacity, including “brokering information for districts, schools and teachers”; “creating curriculum frameworks and supplementary materials”; and “creating resource banks of curriculum materials and other instructional materials” (p. 3). The extent to which states have the human capital and capacity to fulfill these functions is likely varied. For example, the number of employees in SEAs varies with political administrations, and states generally tend to build instructional capacity by creating networks and regional assistance centers, rather than by expanding the staff in the state department of education office (Massell, 1998b). More recent studies of how SEAs use research to support school improvement also found that economic downturns and budget cuts reduced SEA employees’ capacity to engage with research and increased SEAs’ reliance on external organizations to provide technical assistance to schools (Goertz, Barnes, Massell, Fink, & Francis, 2013).
With the passage of ESSA placing more responsibility at the state level, some news articles have suggested that SEA capacity will be further reduced, particularly given state budget cuts (Burnette, 2016). It is possible that common standards lessen the burden on SEA staff to create resources to support their own state’s standards, meaning that states would not need as many staff members to work on building instructional capacity around standards. In this study, we begin to investigate this issue by examining the proportion of internal versus external organizations to which each SEA linked. In particular, there may be a relationship between states that won RTTT funds and the proportion of ties to internal or external organizations, as those states may also have used their RTTT funds to create CCSS resources. However, we are unable to evaluate the extent to which RTTT is associated with CCSS resource creation, as we analyzed the content of SEA websites after the CCSS was adopted and SEAs received RTTT grants.
SEAs need facility with relevant research, efficient organizational structures, and strategic planning to implement federal reform. However, SEAs typically lack this type of capacity; rather, they are compliance-oriented organizations, characterized by fragmentation and little cross-department communication (Lusi, 1997; Manna, 2006, 2010; Murphy & Hill, 2011). The CCSS has the potential to mitigate some of these silos and information gaps as schools are aiming toward similar end goals, and further, RTTT provided financial resources for SEAs to carry out these capacity-building strategies.
The Role of Curricular and Professional Resources as Tools for Teacher Learning and Standards Implementation
One way that SEAs build instructional capacity at the local level is by providing curricular and professional resources for teachers. A recent multistate survey of educators’ perspectives on the CCSS found that 28% of teachers viewed their SEA website as a valuable source of information in aligning instruction to new standards. SEAs were the third-most-valuable source of standards information that teachers named, following the EngageNY and LearnZillion websites (Kane et al., 2016). Curricular resources, including those provided by SEAs, can serve as tools for translating policy messages into concrete recommendations for instruction (Ball & Cohen, 1996; Coburn & Stein, 2010).
Similarly, curricular resources can help teachers understand theoretical ideas and implement these ideas into pedagogical practices. Grossman, Smagorinsky, and Valencia (1999) argue that tools such as curricular resources can provide teachers with information about teaching practice and help teachers make decisions about their teaching. Grossman et al. suggest that resources can be classified as conceptual or practical. Conceptual resources are tools that provide information about a topic that the individual must then translate into practice within a given situation to develop a full understanding of a particular concept. Practical resources are tools that can be applied to classroom use right away, such as lesson and unit plans. Although Grossman et al. and Smagorinsky, Cook, and Johnson (2003) discuss the role of tools in preservice and new teacher learning, the concept translates well to thinking about how curricular resources might serve as tools for teacher learning within a new policy context, as new policy contexts may suggest new ways of teaching.
Although there is some literature on the importance of curriculum materials that are educative, or those that build teachers’ knowledge (Davis & Krajcik, 2005; Drake, Land, & Tyminski, 2014; Remillard, 2005), it is not clear if SEAs are selecting curricular resources to educate teachers about CCSS as a policy, to support CCSS implementation, or for other reasons. SEA-provided resources can come from several sources: They can be created internally (usually by SEA staff), or SEAs can seek resources externally from other SEAs or from organizations. In recent years, SEAs have increasingly turned to external organizations, as well as cultivated internal networks of expertise (Goertz et al., 2013). CCSS policy entrepreneurs note that common standards allow for more resource sharing (Kornhaber et al., 2014); we seek to understand the extent to which such sharing is happening in CCSS implementation.
The Role of Intermediary Organizations in Education Policy Implementation
As mentioned above, RTTT has galvanized many states into working with intermediary organizations to build capacity around assessments, school improvement, standards, and teacher evaluation (Russell et al., 2014). Following Scott, Lubienski, DeBray, and Jabbar (2014), we use the term intermediary organizations as an umbrella term referring to all nonsystem actors, or groups involved in education that are not districts, states, or the federal government. Intermediary organizations may take the form of research institutes, nonprofits, professional organizations, policy or advocacy organizations, or for-profit providers of supplemental educational services or curriculum materials. Much has been written about the expanded role of intermediary organizations in the wake of NCLB (Burch, 2007, 2009; Lubienski, Scott, & DeBray, 2011; Trujillo, 2014; Trujillo & Woulfin, 2014). In recent years, such organizations have often positioned themselves as helping schools meet external accountability mandates. Other scholars have noted that intermediary organizations, like Achieve and the National Education Association (NEA), encouraged states to adopt the CCSS (McDonnell & Weatherford, 2013b). Less is known, however, about how intermediary organizations may influence CCSS implementation and which states have endorsed materials from various organizations.
Social Network Analysis in Education Research
Schools, by design, are social institutions, and social network analysis has been increasingly used to study the relationships between educational actors. Contemporary education researchers have used social network analysis to study teacher and school capacity (e.g., Coburn & Russell, 2008; Daly & Finnigan, 2010, 2011), teacher collaboration (Moolenaar, 2012), and organizational change (Krackhardt, 2001; Mohrman, Tenkasi, & Mohrman, 2003; Tenkasi & Chesmore, 2003). Researchers have also employed social network analysis to understand the interpersonal dimension of educational reform (Frank, Zhao, & Borman, 2004; Penuel, Sun, Frank, & Gallagher, 2012). For example, teachers implementing instructional reform are more likely to maintain and deepen implementation if they are situated in networks with expertise (Coburn, Russell, Kaufman & Stein, 2012; Frank, Zhao, Penuel, Ellefson, & Porter, 2011).
Social network analysis is also useful for visualizing other types of relationships relevant to educational policy (e.g., Reckhow, 2013; Russell et al., 2014; Song & Miskel, 2007). For example, Reckhow and Snyder (2014) applied social network analysis to the relationships between foundations and grant recipients to understand how patterns and purposes of foundation funding for education reform have changed over time. Social network analysis is particularly illuminating for policy implementation because implementation relies on social interactions between actors embedded in organizations of different types at the national, state, and local levels. Social networks may connect actors to both reform-related knowledge and resources (Frank et al., 2004; Penuel et al., 2012). For example, Russell and colleagues (2014) noted that states created large implementation networks to carry out work included in RTTT applications. As discussed above, SEAs are historically insular organizations. Yet, one of the key theories of action embedded in the CCSS is the sharing of resources and increased collaboration within and between states. Thus, social network analysis can be used to understand how SEAs rely on organizational resources to implement the CCSS. In this study, we attempt to disentangle the relationships between SEAs and organizations that are providing ELA resources for CCSS implementation.
Research Questions and Hypotheses
We offer the following research questions and hypotheses for investigation:
1. How might we characterize and describe the network of SEAs and resource providers?
Within this main question, we examine three subquestions about the network. First, we ask, “How we might characterize the full, national-level network?” How many different resource providers are there across all 51 SEAs? What proportion of these providers is linked to by just one state? Are resources that SEAs provide created by the SEA or by an external SEA or organization? We hypothesize that whether or not a state has adopted the CCSS may be associated with the extent to which SEAs link to external resources (those created by other states or outside organizations).
Next, we ask, “How might we characterize and describe the network connections between the most central SEAs and organizations?” Who are the primary organizations and SEAs to which other SEAs turn? We hypothesize that organizations that are closely tied to the development of the standards, such as the CCSSO, NGA, Achieve, and Student Achievement Partners, will be the most central organizations in the network.
Finally, we ask, “How might we characterize and describe the network connections between SEAs?” We investigate the degree to which SEAs are endorsing the materials of other SEAs. Which SEAs are linking to materials from other SEAs? Which SEAs are linked to by other SEAs? We hypothesize that a higher proportion of both CCSS states and RTTT states will be connected to the state-to-state network.
2. What types of resources are states providing on their websites to support college- and career-ready standards?
States may provide concrete resources that teachers can use directly in the classroom, or states may provide articles and other materials with the goal of building teachers’ knowledge about what the standards mean for classroom instruction. We hypothesize that SEAs will provide a variety of different types of resources. Further, we hypothesize that the types of resource SEAs are providing may vary by state attributes (e.g., CCSS status and RTTT status).
Data and Methods
Sample and Data Collection Procedures
This study includes the instructional and curricular resources aimed toward secondary ELA teachers available on 51 SEA websites (50 states and the District of Columbia). Our goal was to code the pages that provided instructional or curricular resources for college- and career-ready standards for ELA—pages whose likely audience would be secondary ELA teachers. To determine (a) which pages on SEA websites and (b) which items on those pages should be included in the analysis, the research team completed the following procedures.
To identify webpages, we went to the homepage of each SEA website (often indicated by .gov extensions), and looked for subheadings such as “Standards,” “Educator Resources,” and/or “Professional Development.” Then, we identified ELA-specific collections of pages under these headings. In the ELA-specific sections of SEA websites, we looked for page titles like “Instructional Resources,” “Classroom Resources,” “Tools for Teachers,” “Curriculum Units,” “Model Curriculum,” “ELA/Literacy Resources,” or “CCSS Professional Development.” Because our focus was on instructional resources, we did not code pages focused on state assessments (PARCC, Smarter Balanced, Florida Standards Assessment, etc.). We also did not code pages that were located on state-sponsored external databases, such as TNCore.org, rather than on the SEA website. We named SEA webpages containing resources “parent pages” and recorded these pages in a spreadsheet. Then, we transferred information about each hyperlinked resource located on the parent page into the spreadsheet of resources (see online Appendix A for the number of parent pages included from each state and the number of resources coded on each parent page; see online Appendix B for a list of the weblinks to each state’s parent pages).
Some states did not organize their resources by discipline (i.e., there was no ELA-specific set of pages relating to standards, curriculum, or instruction). In those cases, we found the pages on SEA websites with information about new standards and, if possible, resources for curriculum and instruction related to the standards. If the state had only a single page related to the standards, we included that page in our analysis. If the state had separate pages for information about the standards and another page giving resources for instruction related to the standards, then we coded the “Resources” page but not the page titled “Standards.” Our rationale was to include the information that is most relevant to the classroom—resources for curriculum and instruction—and to include whatever page(s) are closest to this.
Recall that the purpose of this paper is to understand the resources SEAs are targeting toward secondary ELA teachers to provide guidance on curriculum and instruction that the state perceives as in line with the CCSS or state standards. For this reason, we coded each hyperlinked resource on each identified parent page, with a few exceptions: We did not code K–5 resources (because they were not secondary focused); resources clearly related to providing information about a state/consortium assessment (because they were not instructionally focused); resources that were explicitly for science, social studies, or other non-ELA areas (because they were not ELA focused); and/or resources whose title or description clearly indicated that their audience was not teachers (because they were not teacher focused).
Data collection and coding occurred between August 2015 and March 2016. This one-time snapshot does not allow us to ascertain if SEAs were connecting to similar resources prior to CCSS implementation; thus, we do not claim CCSS caused SEAs to endorse these particular resources. In addition to the web links and resource attributes logged, we archived copies of all state websites to have a record of all resources on state sites during the period of data collection. At the end of our data collection, we logged 2,023 resources from 121 SEA webpages; however, we could not identify the sponsoring organizations for 22 resources, giving us a total of 2,001 resources in the social network analysis. Because some resources were sponsored by multiple organizations, these resources represent 2,644 ties to sponsoring organizations. For the resource type analysis, 23 resources were uncodable due to broken web links, leaving us with a total of 2,000 codable resources. 2
Data Analysis
Social Network Analysis
To complete the social network analysis, we began by logging each resource in our spreadsheet. We recorded the link itself, the hyperlinked text, the sponsoring organization, and the author of the resource. We coded each resource for any organization listed as its sponsor. Therefore, one resource may have been tied, or connected, to multiple organizations. For example, the Publisher’s Criteria document was sponsored by five organizations: CCSSO, NGA, Achieve, the Council of Great City Schools, and the National Association of State Boards of Education. If an SEA provided a link to the Publisher’s Criteria, that resource received five ties, or connections, in the sociogram.
After collecting and logging the resources from SEA websites, we modeled the connections between states and states, and between states and the organizations (Scott, 2000; Wasserman & Faust, 1994). Our purpose in using social network analysis was not only to visualize the network structure but to examine the centrality of the organizations sponsoring the professional resources, the tie strength between states and states (to learn if states were turning to one another as resources), and the tie strength between states and organizations. Tie strength and the number of links from SEA websites to particular organizations approximate the relative influence of various organizations on CCSS implementation. These representations were created using the UCINET and Netdraw software package (Borgatti, Everett, & Freeman, 2002).
Resource Type Analysis
To understand the types of resources that SEAs provide, we coded each resource concurrently along three dimensions: category, type, and emphasis. When coding for the first dimension, category, we broadly considered the purpose of the resource. Consistent with our theoretical framework about the use of practical and conceptual tools for ELA instruction (Grossman et al., 1999), we coded resources in one of four ways: as conceptual, practical, both conceptual and practical, or other.
Resources coded as conceptual provided information about the CCSS but could not be applied directly to classroom instruction. An example of a conceptual resource is Appendix A, a supplement to the CCSS that includes research to support “key elements” of the standards, such as text complexity. This document includes a rationale for complex texts and provides a framework as to how a teacher might select such texts; as a result, this document helps build teacher understanding about text complexity but is not a resource to be immediately used in the classroom.
Resources coded as practical were immediately usable, meaning that the SEA was providing curricular materials or instructional strategies that could be directly applied for the classroom. For example, Hawaii provided a series of units around different types of expository writing, which included sequences of lessons and activities that a teacher could use with students. We also included the code of both to capture other resources that were not clearly conceptual or practical but were a combination. Finally, we included the category of other to capture items like standards documents, because lists of standards by themselves do not provide information about instruction.
The next facet of resource coding was a more fine-grained categorization of resource type: article/report, curriculum guideline, student work, standards document, professional development, instructional aid–large, instructional aid–small, and so on. Drawing on Applebee’s (1994) notion of curriculum as a broad set of interrelated learning experiences, we made a particular distinction between small and large instructional aids because large instructional aids have the potential to create more coherent curriculum, helping teachers and students understand not only what they are doing but why they are doing so.
The final dimension of resource coding was categorizing the content-area emphasis of each resource: reading, writing, speaking and listening, general ELA, or non-ELA (the resource focused on literacy across the content areas or not on ELA). To respond to our research question about the types of resources states provide, we conducted descriptive analyses, examining the proportion of resources by our three coding dimensions of resource category, type, and emphasis. 3
Findings
In this section, we describe the findings from our analyses. This section provides an introduction to the overall sociogram and then relates back to our research questions to examine the state-to-state and state-to-organization linkages and then the types of resources provided.
Interpretation of the Network
The sociogram depicted in Figure 1 shows 51 SEAs (50 states and D.C.) and their ties to sponsoring organizations as well as each other (see online Appendix C for a key to all SEA and organization abbreviations used in the sociograms). The 51 SEAs in the ELA network link to a total of 313 distinct organizations (including other SEAs). Circular nodes represent the SEAs; white indicates that the state is a CCSS adopter and black represents a state that never adopted or retreated from the CCSS (Alaska, Indiana, Nebraska, Oklahoma, South Carolina, Texas, and Virginia). Gray squares represent the intermediary organizations sponsoring resources. Finally, the nodes are connected by lines or “edges,” indicating that an SEA has linked to a resource from a particular organization. The thickness of the edge represents tie strength, or the number of times an SEA has provided a resource sponsored by a particular SEA/organization. A thicker tie means that an SEA has multiple links to an SEA/organization. Figure 1 is a directed graph, with the directionality from SEAs to SEAs/organizations. The node size (for both SEAs [black and white circles] and organizations [gray squares]) captures indegree centrality, a measure indicating how many SEAs have linked to that particular SEA or organization. In other words, the node size approximates how central each SEA/organization is to this network. However, tie strength and node size are separate features of this sociogram; the thickness of the tie measures the number of resources an SEA endorses from an organization, but the tie from state to organization counts as only one in-tie in determining the organization’s node size.

Sociogram of all SEAs and ELA resource providers.
Network Composition and Diversity
Figure 1 displays all 313 SEAs and organizations included in this analysis. This sociogram illustrates a core-periphery network, meaning that there are a group of highly connected actors in the center of the network and a group of actors on the outside of the network who are not connected to each other, or directly to the central actors. In this sociogram, 51 organizations are SEAs and 262 are intermediary organizations. Of these SEAs/intermediary organizations, 227 (or 72.5%) are named as the sponsor of a resource by only one SEA. These organizations with a single state tie, known as pendants, can be seen on the periphery of the sociogram.
Some of the pendants represent a state or local organization included on an SEA website as a CCSS resource even if it is only tangentially related to the CCSS. For example, Arkansas provided a link to the Hemingway-Pfeiffer Museum, an Arkansas museum located in the family home of Ernest Hemingway’s second wife, Pauline Pfeiffer. However, pendant status does not necessarily mean that the organization is not influential within a particular state—just that it is not influential in the network as a whole because that organization has not been named by multiple SEAs. This network also includes a visualization of tie strength, or the number of times an SEA links to a particular organization. Arkansas, for example, has created a number of CCSS professional development videos for ELA teachers; seven of the 40 links the Arkansas Department of Education provides are to the Arkansas Educational Television Network. Similarly, Tennessee links to the TNCore.org website, an organization connected to the Tennessee Department of Education that stores many of its CCSS resources.
In addition to the pendants, there are several SEAs on the periphery of the sociogram. New Mexico and Mississippi are both isolates on this sociogram. These CCSS states do not have ties to any other organizations on the sociogram; however, this does not mean that these SEAs do not have ELA resources posted on their websites. Instead, it means that all posted resources are internally generated. There are a few isolated dyads and triads on the sociogram—Alabama, Florida, Indiana, Michigan, and South Carolina. These SEAs are connected to one or two organizations but are not connected to influential organizations in the network.
Recall that this sociogram includes CCSS and non-CCSS states. Unsurprisingly, there are two non-CCSS states that are isolated triads—Indiana and South Carolina—that connect only to state organizations and are not otherwise connected to other states and organizations in the network. However, five of seven non-CCSS states—Alaska, Nebraska, Oklahoma, Texas, and Virginia—are connected to the sociogram. These non-CCSS states are connecting to one or more organizations that are also named by CCSS-adopting states. Some non-CCSS states connect to resources that are clearly CCSS related. For example, Alaska provides a link to the Publisher’s Criteria for the CCSS, which is sponsored by the NGA, CCSSO, Achieve, the Council of Great City Schools, and the National Association of State Boards of Education. Other non-CCSS states are connecting to resources that are not explicitly CCSS related. For example, Nebraska connects to the readingrockets.org website, which is a site sponsored by WETA (the Washington, D.C. public broadcasting station) that contains a variety of general literacy resources. The CCSS states of Alaska, Arizona, Colorado, Missouri, and Oklahoma also link to Reading Rockets.
Although this sociogram represents centrality and connectivity, it does not quantify the frequency of interactions or the extent to which an SEA provides links to its own resources (or self-loops). Table 1 quantifies these interactions, illustrating how many of these ties result from SEAs posting resources they have created (internally generated) and how many ties result from SEAs posting resources created by other organizations (externally generated). On average, SEAs have 51.8 total ties; of these, 24.6 are internally generated and 27.2 are externally generated. This pattern differs by CCSS status. Although non-CCSS and CCSS SEAs have roughly equal numbers of internal connections (22.7 and 25.0, respectively), their external connections differ. Non-CCSS SEAs have an average of 13.7 external connections compared to 29.3 for CCSS SEAs. In sum, CCSS states provide more links to external organizations than non-CCSS states.
State Educational Agencies Internal Versus External English/Language Arts Ties

Note. States are listed by their two-letter postal abbreviation plus DOE (Department of Education). Non-Common Core State Standards states are italicized; Race to the Top winners from Rounds 1, 2, and 3 are bolded.
Figure 2 represents the main components of the social network. In this sociogram, we removed all isolates, isolated dyads and triads, and pendants, allowing the reader to see the center of the map more clearly. Figure 2 offers the advantage of visualizing the most central relationships in the network, as compared to Figure 1, which represents the full network. 4 Like Figure 1, Figure 2 is a directed graph, with directionality from SEA to organization/SEA. Any SEA or organization remaining in this sociogram has at least two ties (either in-ties or out-ties). In this sociogram, 39 states are represented; three of these states—Oklahoma, Nebraska, and Alaska—are non-CCSS states yet are still among the main components of the network.

Main components sociogram of English/language arts resource providers.
Ties Between Central SEAs/Organizations
Although Figure 2 allows the reader to visualize the connections between SEAs and the most central organizations/SEAs, it does not quantify the number of SEAs that link to these organizations. Therefore, Table 2 displays a list of the most central organizations/SEAs in the network in order of influence, highlighting the number and proportion of SEAs linking to these organizations. Of note, some of the most central organizations are education policy membership organizations (e.g., CCSSO, NGA), several are general membership organizations (e.g., NEA, ASCD), and two are membership organizations focused on literacy (e.g., International Literacy Association and National Council of Teachers of English [NCTE]). SEAs are represented (New York, Delaware, Kansas, North Carolina, Louisiana) as well as one school district (New York City). Other organizations (e.g., OER Commons, EngageNY) provide databases of resources. Two are for-profit corporations (Metametrics and LearnZillion), although both companies also offer free tools/resources for teachers. Others are organizations aiming to build the instructional capacity of teachers (e.g., Teaching Channel, Student Achievement Partners).
SEAs and Organizations Most Commonly Named as Sponsors of CCSS Resources
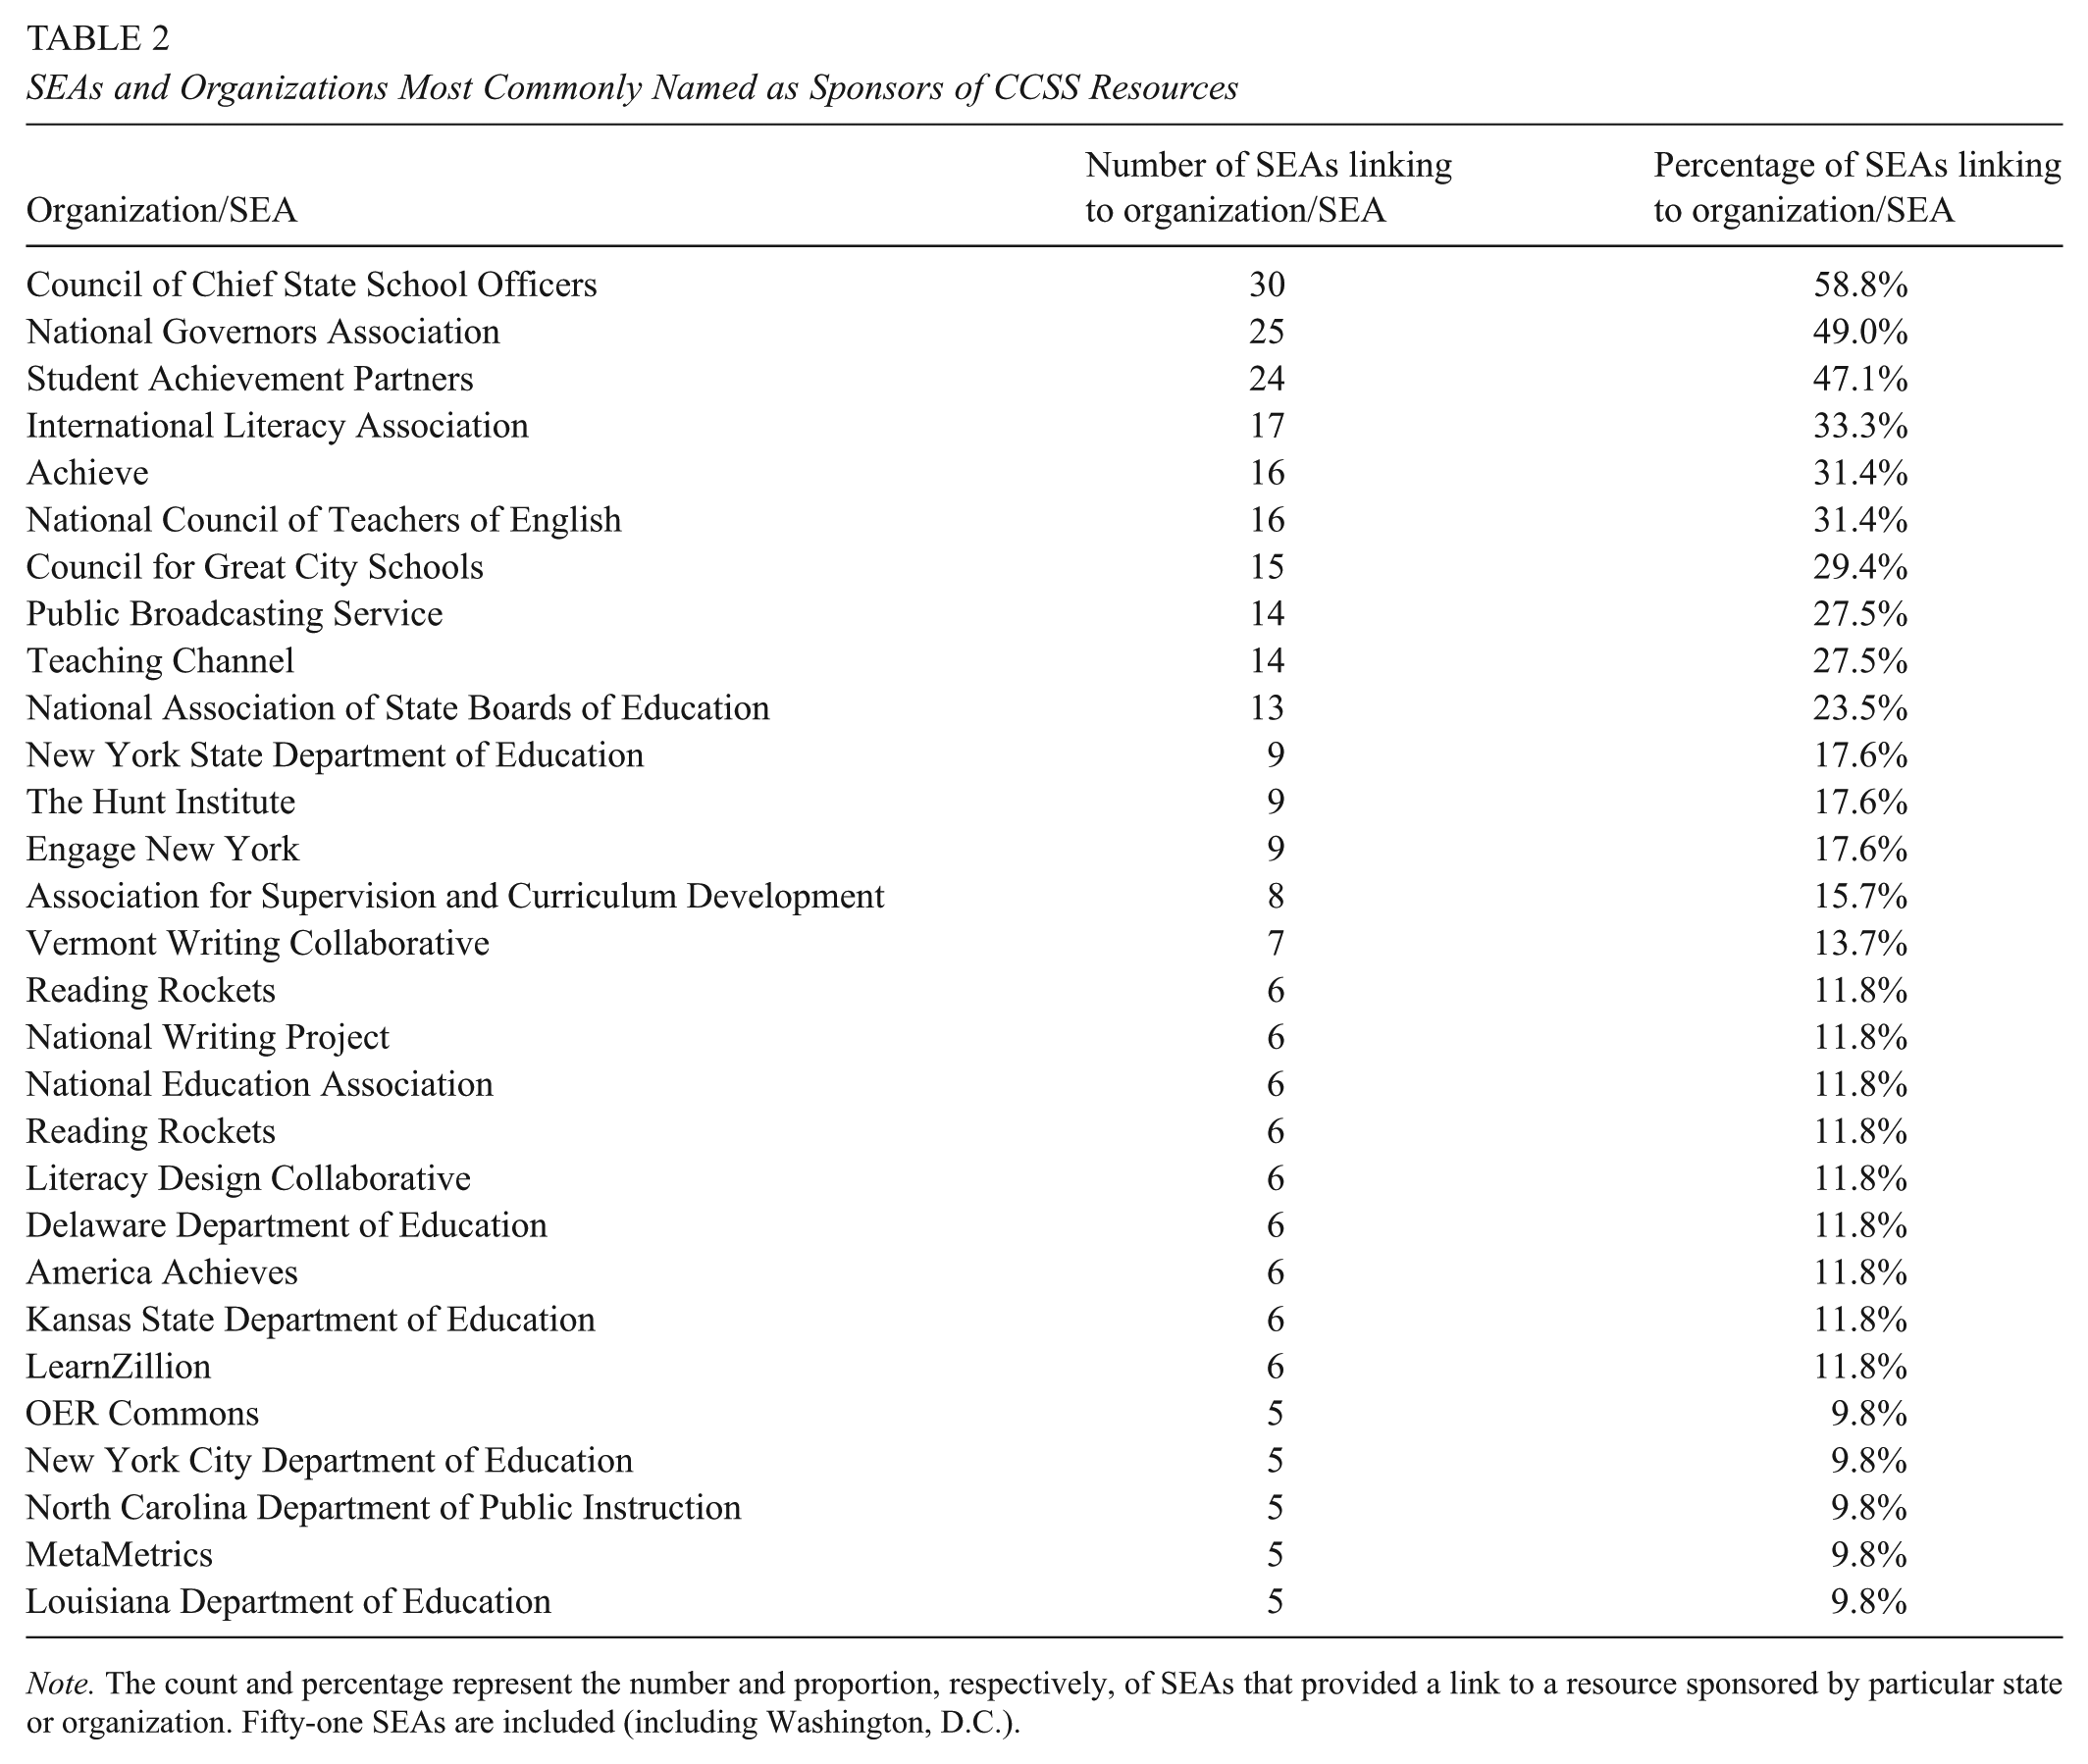
Note. The count and percentage represent the number and proportion, respectively, of SEAs that provided a link to a resource sponsored by particular state or organization. Fifty-one SEAs are included (including Washington, D.C.).
Thirty SEAs connected to the CCSSO, which was the organization with the largest number of states linking to its resources. Similarly, 25 SEAs linked to the NGA. Both of these organizations are tied to state government and are the official sponsors of the Common Core Initiative (Common Core State Standards Initiative, 2015). Twenty-four SEAs linked to Student Achievement Partners. This organization was not an official sponsor of the CCSS but was founded by three of the lead authors. Across all states, 17 linked to the International Literacy Association, and 16 linked to the National Council of Teachers of English. To provide a few examples of the resources from these organizations, Arkansas, Colorado, Connecticut, Georgia, and Maine linked to the homepage of the lesson database Read-Write-Think, which is cosponsored by the two literacy organizations. California, Delaware, and Oregon all linked to a four-page document, “Literacy Implementation Guidance for the ELA Common Core State Standards,” sponsored by the International Literacy Association’s CCSS Committee. Arizona, Arkansas, Idaho, Oregon, and Washington linked to Achieve’s collection of materials on the Educators Evaluating the Quality of Instructional Products (EQuIP) rubrics.
State-to-State Ties
Recall that key to the theory of action in the CCSS is SEA collaboration. Because common standards enable common resources, it is possible that SEAs may be sharing materials with each other. Although we cannot evaluate whether or not states are sharing materials with each other more than before the adoption and implementation of the CCSS, we can describe the extent to which CCSS-adopting states were linking to one another’s materials during the period of data collection. We hypothesized that a higher proportion of CCSS-adopting states would be connected to the state network than non-CCSS adopting states. Figure 3 shows the extent to which SEAs are connecting to resources sponsored by other SEAs. Of the 51 SEAs, 29 are connected to one another (27 CCSS states and two non-CCSS states). Therefore, a higher proportion of CCSS states (61.4%) are providing resources from other states relative to non-CCSS states (28.6%). Although SEAs on the periphery of this sociogram appear isolated, they may still be connected to the larger network through organizational connections, just not through other SEAs.

State educational agencies (SEAs) sociogram.
The sociogram also depicts indegree centrality as indicated by node size—the larger the node, the more central the SEA and the larger the number of in-ties from other states. From this sociogram, the most central SEAs are the CCSS states of New York, Kansas, Delaware, North Carolina, Ohio, and Louisiana. New York was the SEA with the largest number of in-ties, with nine other states connecting to resources created or sponsored by the New York State Education Department. These ties were mostly to EngageNY, the collection of CCSS instructional materials and professional development resources created by New York with its RTTT funds. In contrast, Oregon was the SEA with the largest number of out-ties to other SEAs, connecting to resources from eight other SEAs. Resources on its webpage included a link to model curricula from Ohio, explanations and examples of each standard from North Carolina, and translations of each standard into “know/understand/do” objectives from Kentucky.
We also hypothesized that RTTT-winning states may have used RTTT funds to develop and share CCSS materials and may therefore have more in-ties from states that did not win RTTT. 5 Indeed, 68.8% of all state-to-state ties were to RTTT-winning SEAs, whereas only 31.3% of state-to-state ties resulted from RTTT-winning states linking outside the state. Figure 3 illustrates that of the 19 states winning RTTT, 14 states (73.7%) are connected to the SEA-to-SEA network (only Florida, Maryland, New Jersey, Pennsylvania, and Tennessee are not connected). Although disconnected states did not link to other SEAs’ materials, several have internal databases of resources or provide collections of curriculum units. It is possible that RTTT-winning states used those funds to create CCSS resources, and if so, those states may have a higher number of internal ties due to creating resources within the SEA rather than linking to external resources. The average number of internal ties differs by RTTT status. RTTT-winning states generated and posted resources with an average of 32.5 internal ties, whereas non-RTTT states had 20.0 internal ties on average.
We caution, however, against seeing the number of internal ties as a measure of capacity or quality, as this study does not examine the content of the resources or the motivations behind the number of internal ties. The higher proportion of in-ties to RTTT-winning states may indicate that SEAs who did not win RTTT are trying to capitalize on the resources created by states that did win. However, we are unable to assess the ways that state-provided resources may have changed before and after RTTT, as the period of data collection was only after RTTT grants were awarded. States winning RTTT grants may already have had many internally generated resources. In addition, regardless of RTTT status, states where the political climate has been anti-CCSS, for example, might have political motivations to generate resources internally rather than link to national-level CCSS resources.
Types of Resources SEAs Are Providing
In order to understand the kinds of resources to which SEAs link, we coded resources descriptively across three dimensions: category, type, and emphasis (see Table 3). When coding for category, resources were classified as practical (immediately usable in a classroom), conceptual (informational resources that build understanding about concepts within standards), both (practical and conceptual), or other. The largest category was resources coded as conceptual, with over half the resources focused on building overall understanding or providing information about the CCSS (53.8%). The next-largest category was resources coded as both practical and conceptual, totaling about 18.4% of resources. Resources coded as practical made up 17.5% of the sample. The final category, other, totaled 10% of the sample; these resources were mostly lists of standards.
Resource Category, Type, and Emphasis for All Resources
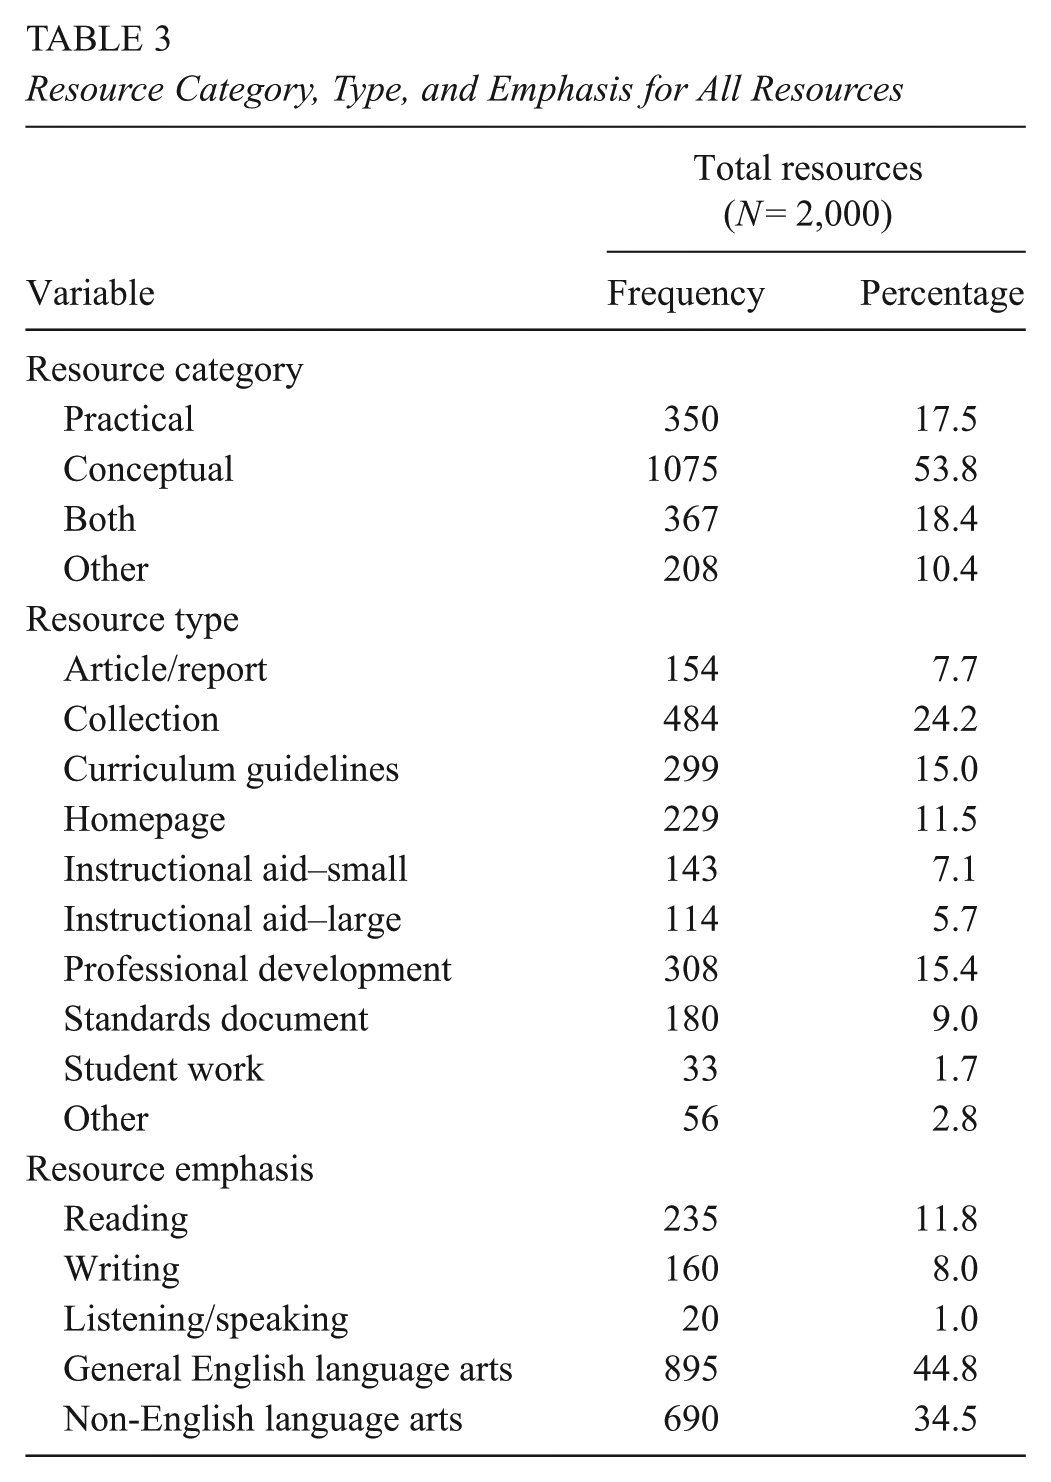
To understand resource type, we created 10 codes. The largest type of resource endorsed by SEAs was coded as collection (24.2%). This category captured resources that provided a set of links or group of resources that was too large to be coded individually. One example of a collection linked to by multiple SEAs was a collection of Achieve’s EQuIP materials/rubrics for evaluating instructional materials’ alignment to the CCSS. Resources coded as curriculum guidelines accounted for 15.4% of the resources. Common resources here included the Publisher’s Criteria and the CCSS Appendix B, which provides text exemplars. Professional development resources accounted for 15% of total resources. The majority of resources coded as professional development seemed to be generated within SEAs; thus, there were not many examples that were linked to by multiple SEAs. The category of homepage accounted for 11.5% of total resources. Some of the more-commonly-linked-to homepages included the homepage for Student Achievement Partners (www.achievethecore.org, linked to by 11 SEAs), the homepage for the National Council for Teachers of English (www.ncte.org, linked to by five SEAs), and the homepage for the Teaching Channel (www.teachingchannel.org, linked to by five SEAs).
Finally, we coded for the emphasis of the resources in order to learn whether resources were focused on a particular aspect within ELA (e.g., writing instruction). Overall, 44.9% focused on general ELA, meaning that there was no clear emphasis within ELA and that the resources focused on ELA broadly. The next largest category was coded as non-ELA, meaning that 34.5% of resources found on state ELA pages were not actually focused solely on ELA—instead, these resources included topics such as literacy in the content areas or sometimes resources for other disciplines (e.g., science). Notably fewer resources focused on only one domain of ELA, such as reading (11.8%), writing (8.0%), or listening/speaking (1.0%).
To understand the relationship between CCSS status and resource type, we cross-tabulated these variables (see Table 4 for full results). CCSS and non-CCSS states had a few notable differences in the types of resources they provided to teachers. CCSS states provided a higher percentage of resources coded as professional development (17% of resources from CCSS states vs. 1.9% of resources from non-CCSS states). Many of these resources were developed by SEAs, such as a series of modules from Rhode Island that focused on academic vocabulary, text complexity, and argument writing.
Common Core Status by Resource Type
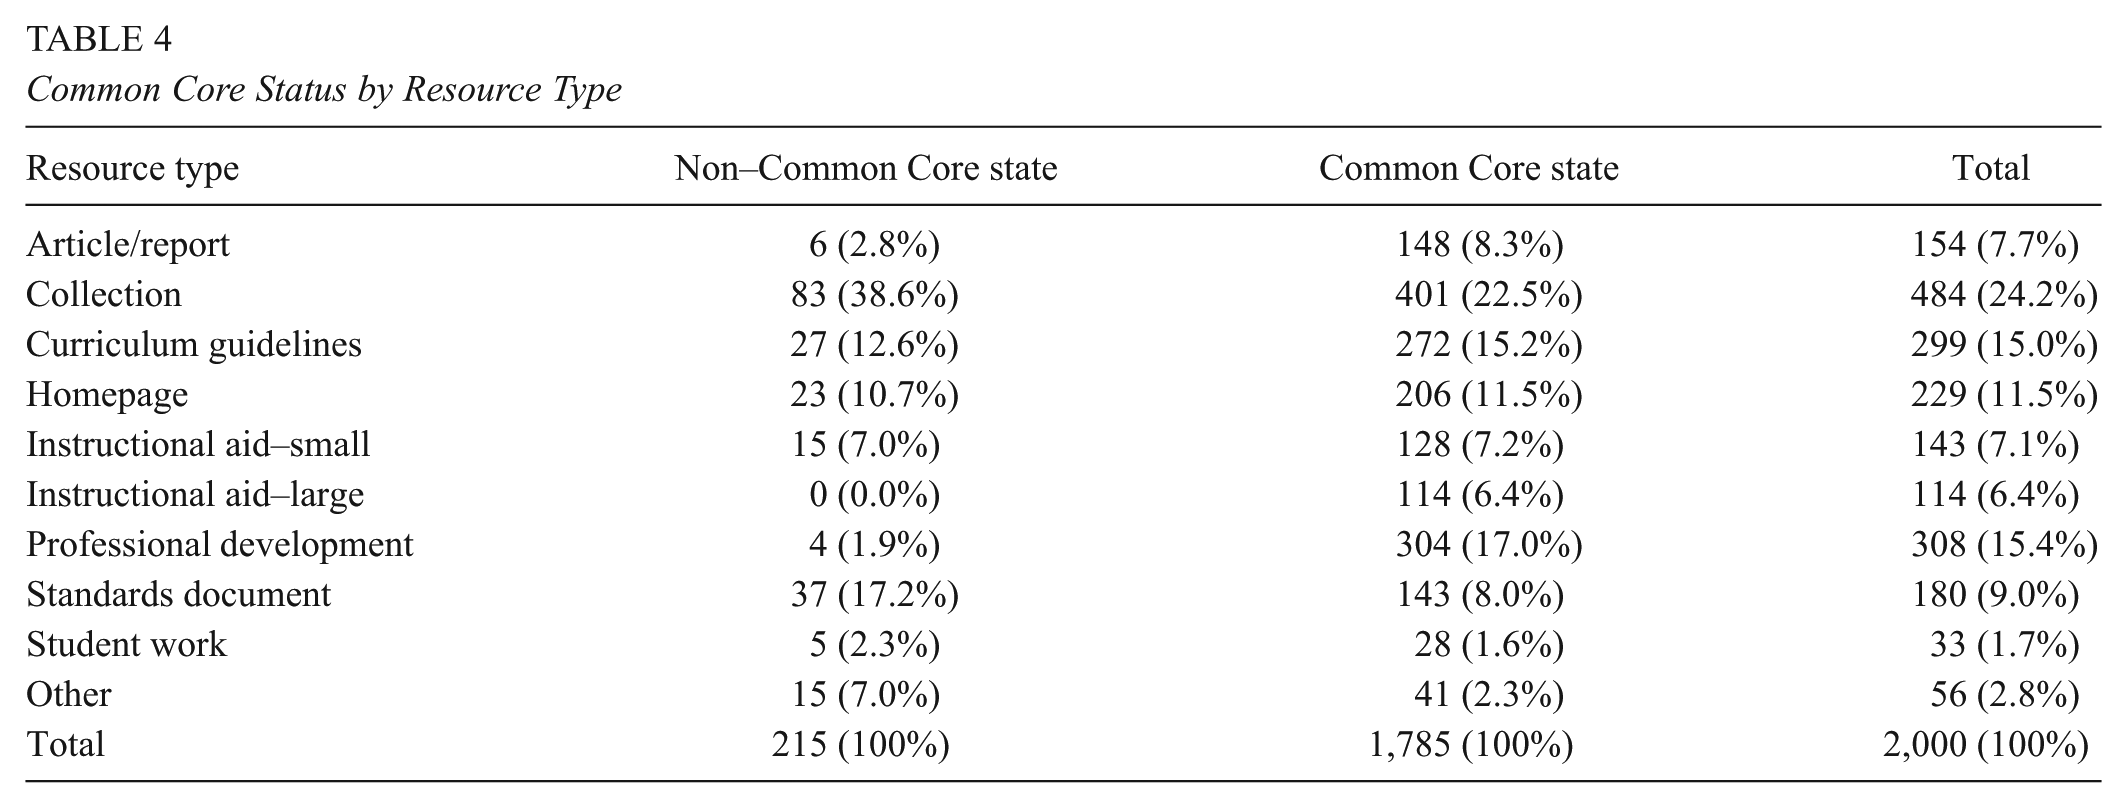
Although CCSS and non-CCSS states provided roughly the same proportion of small instructional aids (e.g., individual lesson plans or activities), CCSS states provided a higher percentage of large instructional aids (6.4%) than non-CCSS states, which did not provide any instructional units. Maryland and Louisiana provided the largest number of large instructional aids (24 and 35, respectively). For each grade level, Maryland provided four thematic units, developed by teams of Maryland educators. Each unit had suggested texts, lists of standards with a template for monitoring students’ progress toward meeting those standards, and lesson plan outlines. Units were organized around essential questions, like “What is the basis for the belief that justice will ultimately prevail in American society?” (Grade 10) and “What can be learned about the search for identity from the journeys and struggles of literary characters?” (Grade 6). Louisiana’s sample units (five per grade level) also had lists of texts and standards as well as sample assessment tasks.
Finally, non-CCSS states provided a larger share of collections (38.6%) than non-CCSS states (22.5%). Virginia, for example, provided a number of professional development collections focused on understanding the Virginia Standards of Learning as well as collections of instructional resources for vocabulary and reading.
We also cross-tabulated RTTT status by resource type, with similar findings. RTTT-winning states provided a higher proportion of large instructional aids (10.1% vs. 2.4% from non-RTTT states). Non-RTTT states provided a higher share of collections (28.4% vs. 18.6%). One difference was that unlike CCSS versus non-CCSS states, which provided similar proportions of curriculum guidelines, RTTT-winning states provided a higher proportion of curriculum guidelines than states that did not win RTTT (21.9% vs. 9.8%). For example, Maryland provided 52 distinct curriculum guidelines for reading, writing, and speaking and listening across multiple grade levels.
Discussion
Summary of Findings
In sum, the national network of ELA resources provided by SEAs (Figure 1) includes resources sponsored by 262 organizations and all 51 SEAs. The majority of organizations in the network are pendants, meaning that only one SEA provided a resource sponsored by that organization. This network also shows SEAs taking dramatically different approaches to supporting standards implementation. For example, some SEAs provide primarily external links, whereas others link to internally generated resources.
One might expect CCSS states to be linked to the network and non-CCSS states to be disconnected. CCSS states do have a higher average number of external ties to other states or organizations than non-CCSS states, indicating that CCSS-adopting states are looking for resources outside their state. However, most non-CCSS states link to at least one organization also linked to by a CCSS state.
The most central organizations in the national network are a mix of membership organizations, literacy organizations, SEAs, for-profit companies, and instructional capacity organizations—some predate the CCSS, whereas others were founded specifically to support the CCSS. Literacy organizations are not the most central to the network, but two professional literacy organizations appear within the 10 most-central organizations.
A higher proportion of CCSS states provide resources created by other states, as shown in the state-to-state network (Figure 3). Both CCSS and RTTT states are more likely to be connected to the state-to-state network. Several SEAs were commonly cited as the sponsors of state-provided resources: New York, Kansas, Delaware, North Carolina, and Louisiana.
Finally, the analysis of resource types shows that over half of all resources SEAs are providing are informational—resources like articles or curriculum guidelines that serve as conceptual tools to build understanding about ideas in standards but not as practical resources that can be directly applied in the classroom. Almost a quarter of all resources are collections (a link to a set of materials or other links).
Resources were also coded for the domain within ELA on which they focused (reading, writing, speaking/listening, ELA in general, or not on ELA at all). Nearly half (44%) of resources focused on ELA in general, and 34.5% of resources did not focus specifically on ELA. CCSS states and RTTT-winning states both provided a higher proportion of large instructional aids for teachers to use in the classroom than states that did not adopt the CCSS or win RTTT. CCSS states also provided a greater share of professional development materials than non-CCSS states.
Implications of the Network Analysis
If a potential benefit of the CCSS is that states can collaborate more easily due to common standards, we see evidence of that happening. However, this connectivity is uneven and varies greatly from state to state. We can imagine how collaboration and connections could help states with limited capacity, but without knowing the vision or mission of the organizations or the content of the resources, it is difficult to know if having more connections is beneficial. At the end of our work, we are not sure if there is an SEA that exemplifies “ideal” connectivity. It makes sense that SEAs should meet their needs of the teachers within their states, and a variety of approaches could accomplish this.
However, in the context of common standards, we do think that it would benefit SEAs to be connected to the network in some way. Seven states on our map were not well connected to the map as islands or isolates. Connection within the network implies the sharing of ideas and resources; disconnection provides the possible danger of having a narrow, insular view of instruction under the CCSS. A variety of perspectives seems like a natural safeguard against a vision of CCSS instruction that could be too narrow or limited, such as an approach to “close reading” that is overly reliant on a New Criticism philosophy (Gewertz, 2012). Likewise, states linking only to resources created internally may limit teachers’ access to the other ideas circulating in the network as a whole.
The diversity of resources provided and the lack of common patterns across states make it difficult to know much about the intentionality behind SEAs’ approaches to resource collection. Were these resources a result of an Internet search? Were they recommended or vetted by teachers? Without knowing more about SEAs’ goals or the decision making behind resource selection, it is impossible to evaluate these approaches. Follow-up work conducting interviews with SEA officials could better unpack the thinking that goes into resource selection and dissemination.
Although there may be no “ideal” approach to finding resources for teachers, we see organizations such as NCTE, International Literacy Association (ILA), or National Writing Project as well positioned to provide resources. These organizations are composed of researchers and literacy educators who are committed to research and best practices around literacy instruction, rather than committed to particular policy reform. Thus, we would like to see even higher representation of national literacy organizations in state-provided resources.
Implications of the Resource Type Analysis
States provided a wide variety of resources for teachers. The majority of these resources were conceptual resources, such as articles, professional development, and curriculum guidelines. There is value to this type of resource; conceptual resources are important because they can help build a teacher’s understanding of the CCSS, which seems important when the standards are said to be quite different from earlier standards (Porter et al., 2011). However, conceptual resources often do not show what the CCSS might look like when enacted in the classroom. Practical resources, like lessons or unit plans, help provide this clarity and were less frequently provided. Our network map suggests that there may be a hunger for practical resources, as indicated by the large number of connections to New York’s EngageNY site.
A greater number of practical resources, especially full-fledged units, would help provide a big-picture sense of what the standards look like and help teachers enact new standards. Of the practical resources in our database, few were units, and many were piecemeal graphic organizers or single-day lesson plans. Similarly, other kinds of resources seemed less helpful for teachers, such as the large number of collections in our sample. On one hand, this may mean that teachers can be directed to collections and sift through many possible resources to determine what is best for them. On the other hand, these large collections may make it difficult for teachers to find what they need because they may take a great deal of time to navigate.
Finally, more than a third of the resources labeled by the SEA as “English language arts” resources were not specific to ELA, such as resources focused on content area reading or sometimes on other disciplines, like history. These types of resources are certainly valuable and make sense when connected to other strands of ELA (e.g., reading and writing); however, if resources from other disciplines are categorized under ELA, they may be difficult for teachers from those disciplines to find and use.
Implications for Policy
Implications for resource selection
SEAs’ capacity to support CCSS instruction and other initiatives has become an even more salient issue with the reauthorization of the Elementary and Secondary Education Act, the ESSA. Particularly because of state budget cuts during the 2008 recession, many SEAs will be asked to take on more leadership around assessment and instruction but with fewer resources in terms of human capital (Burnette, 2016). These conditions may lead SEAs to continue to partner with external organizations and/or to seek expertise externally, which may have several important implications.
First, although our current work cannot assess the intentionality of resource selection by SEAs and ELA coordinators, it is important that these actors are purposeful in their resource selection. SEAs should select resources that are coherent and that represent a balance of resource types that meet the needs of the districts, schools, and students whom they serve. Furthermore, we suggest that state-level employees who are in charge of disseminating these resources think carefully about the ease with which teachers can find the resources. We recommend organizing resources in ways where teachers can easily locate what is most helpful.
Second, we think it is important that SEAs consider the organization and/or author behind different resources. Standards can be interpreted in various ways; it is important to reflect on whether resource sponsors or authors may have a particular educational or political agenda in their interpretation of the standards (Hodge & Benko, 2014). For example, Student Achievement Partners (founded by the CCSS lead authors) provides numerous materials to support ELA instruction. Resources from Student Achievement Partners often emphasize the CCSS “instructional shifts”: complex text and academic vocabulary, textual evidence, and informational text (Student Achievement Partners, 2013). These instructional priorities are not part of the standards themselves but represent an interpretation of how key features of the standards translate into curriculum and classroom instruction. In contrast, resources from NCTE and ILA may be more focused on general literacy practices that represent professional consensus rather than on interpreting one set of standards, as their missions are more generally to help teachers provide high-quality literacy education to all students. Given that a variety of resources is provided by a variety of organizations with different goals, we encourage SEAs to interrogate organizations’ goals before endorsing particular resources.
Implications for resource creation and dissemination
First and foremost, our work suggests that there are already many materials available for secondary ELA around the CCSS. However, the resources are skewed to general ELA rather than a particular facet of the discipline, like reading or writing. In particular, research demonstrates that writing is underemphasized in schools (National Commission on Writing, 2003). Thus, new standards provide an opportunity for organizations to improve the teaching of writing by providing more high-quality writing resources.
Second, the large number of states linking to resources through EngageNY suggests that there is a need for free, comprehensive resources that address both practical and conceptual concerns. Literacy organizations seem like natural groups to take the lead in the creation and dissemination of such resources. It seems critical that these resources be shared across organizations; however, this is sometimes difficult if an organization is trying to promote only its own materials or if resources are password-protected. If an end goal is for teachers to have access to high-quality resources, it may mean that organizations and states collaborate to find ways to promote materials and ensure that some resources are available to those outside of the organization.
Furthermore, states and organizations devoted to supporting CCSS implementation can amplify high-quality resources by providing them on their websites. Our work suggests that other than the standards and appendices, there is no one “set” of resources that is most prominent within this network. For example, EngageNY is the only “curriculum” that receives multiple links. EngageNY is certainly not the only comprehensive curriculum resource available—Hawaii, for example, provided a set of writing units that represented a collaboration between local teachers and university professors, but these resources are linked to by no one other than Hawaii. Perhaps instead of creating new resources, policy entrepreneurs, foundations, and organizations might consider getting a better handle on the landscape of resources and helping to highlight some of the excellent resources that are available but lesser known.
In addition, foundations, CCSS policy entrepreneurs, or national-level organizations could play a critical role in bringing a degree of coherence to this vast landscape of resources by promoting better cooperation and collaboration between SEAs. SEAs are traditionally siloed organizations (Murphy & Hill, 2011). We wonder what communication structures currently exist for SEA officials to share their resources. Conferences, shared resource databases, webinars, or other opportunities could help states to become aware of the resources that currently exist from other states as well as organizations. National-level organizations, like the CCSSO, NGA, or other organizations that can bring SEAs together, might be in a position to invest in the in-person social network of SEA officials so that the vision of the CCSS can be realized in a more productive way.
Limitations and Next Steps for Research
We recognize, of course, that this work has limitations. Although this analysis cannot describe the messages sent about CCSS instruction, prior research suggests that there are multiple messages about CCSS instruction in popular CCSS professional development texts (Hodge & Benko, 2014). Further, that many states link to a particular organization is not necessarily an indicator of the quality of that organization’s resources. At the onset of this investigation, we wondered which organizations’ voices were amplified through the professional resources provided by SEAs and what messages were sent about CCSS instruction. Future research might examine resources presented by these organizations to analyze the degree to which messages about CCSS instruction in ELA may vary by organization or represent the research on literacy and ELA instruction.
This work does not capture all possible resources provided by SEAs, which is a limitation of this study. Some states, like Oklahoma, have gone outside the official state site to provide resources through a Wordpress site. Some states have invested time and money into creating databases of standards resources, such as TNCORE.org or EngageNY.org. Other states may be using communication channels like e-mail listservs that were not visible with our approach to data collection and analysis. Because coding was determined, in large part, by the organization of the SEA websites, there may be resources that were not coded. States that have created state-sponsored databases of CCSS materials and have organized their sites so that CCSS resources appear only on those databases will be underrepresented on these sociograms. These databases were not coded because they were usually independent sites that were separate from the SEA websites. However, another study could more closely examine resources on state-sponsored databases.
SEAs tend to have limited capacity in terms of their staff (Lusi, 1997); therefore, it is essential that they take their role as knowledge brokers around new standards seriously. Although research suggests that teachers do use resources from SEA websites (Kane et al., 2016), it is unclear how teachers may be taking up these tools in the classroom, or where else they might find tools for classroom use. However, investigating teachers’ selection of materials and information seeking is beyond the scope of this particular study. Future research might also consider how such resources are implemented at local levels.
Finally, SEAs seem to take a variety of approaches to the ways that they provide resources for teachers. However, from our analyses, we cannot understand what guides SEA officials’ approaches to resource selection and dissemination. Because SEA sensemaking about resources seems like an important part of understanding the landscape of CCSS resources as a whole, future research might study how and why SEA officials make decisions about resources that they recommend for teachers.
This work offers a national-level analysis of CCSS resources provided by all 51 SEAs and depicts the varied ways in which states are connecting to resources to support college- and career-readiness standards. Although the current study does not investigate the content of the messages being produced by these different organizations, it is clear that there are many voices involved in the discussion of what CCSS instruction is and should be. As a result of the vast number of resources and voices available about the CCSS, it is not possible to know the extent to which there is coherence about messages for CCSS instruction or the usefulness of these resources within classrooms. At the end of our work, we are left wondering, “Where does expertise about ‘Common Core instruction’ come from? Who are the authors behind these resources? Whose views do they represent?” Continuing to interrogate these issues, as well as examining classroom instruction in the context of the CCSS, represent the next challenge for researchers who want to better understand interactions between educational policy, actors who influence policy implementation, and ways that educational policies are enacted in classroom settings.
Footnotes
Acknowledgements
The authors would like to thank Rebecca Brown, Alexandra Earle, Tyler Oswald, Taylor Shewman, and Kelly Venezia for their capable research assistance.
1.
2.
Note that the number of resources varies in the social network analysis compared to the resource analysis due to different types of missingness (i.e., unidentifiable organizational sponsors for the social network analysis vs. broken web links for the coding of resource types).
3.
In this analysis, we are not using inferential statistics because we have the entire population of SEA-provided ELA resources meeting our inclusion criteria.
4.
See, for example, Borgatti, Everett, and Johnson (2013) for a discussion of how to visualize large networks.
5.
Across three rounds, Race to the Top–winning states were Arizona, Colorado, Delaware, Florida, Georgia, Hawaii, Illinois, Kentucky, Louisiana, Massachusetts, Maryland, New Jersey, New York, North Carolina, Ohio, Pennsylvania, Rhode Island, Tennessee, and Washington, D.C.
Authors
EMILY M. HODGE is an assistant professor of educational leadership at Montclair State University. Her research focuses on understanding the intended and unintended consequences of equity-oriented educational policy from the national level to the classroom level.
SERENA J. SALLOUM is an assistant professor of educational leadership at Ball State University. Her research examines how school context promotes educational outcomes; in particular, she focuses on how organizational culture and structure promote equity in high-poverty schools.
SUSANNA L. BENKO is an assistant professor of English at Ball State University. Her research interests center on writing instruction, teacher education, and educational policies that influence the teaching of writing.
References
Supplementary Material
Please find the following supplemental material available below.
For Open Access articles published under a Creative Commons License, all supplemental material carries the same license as the article it is associated with.
For non-Open Access articles published, all supplemental material carries a non-exclusive license, and permission requests for re-use of supplemental material or any part of supplemental material shall be sent directly to the copyright owner as specified in the copyright notice associated with the article.