
Abstract
The underrepresentation of women in science, technology, engineering, and mathematics (STEM) is often explained by women’s greater likelihood to leave STEM at each key juncture from elementary school into the workforce. It is important to examine this more closely and look for points in the pipeline where gender equity exists. This study uses nationally representative data from a recent cohort of college students to investigate thoroughly gender differences in STEM persistence. Results indicate that no significant gender differences in persistence exist. This finding holds among those in computer science, engineering, mathematics, and physical science, and for those in life science. Additionally, the results are unchanged if the sample is limited to degree earners and are robust to the inclusion of individual and institutional variables. Although it is clear that women are less likely to choose certain STEM majors, those who do are no less likely to earn a STEM degree.
Background
Within the literature on gender inequality in STEM fields, there are conflicting results about gender differences in college STEM persistence. Some prior literature finds that women in STEM have lower college persistence rates than male STEM students. For example, in their well-known study of STEM attrition, Seymour and Hewitt (1997) found evidence that among their analytic sample of students with high SAT scores from seven universities, women were more likely than men to leave STEM majors. In an investigation at a single elite research university, Ost (2010) found a similar pattern but concluded that the gender gap was driven almost entirely by differences in the physical sciences. Several additional studies that involve samples with high-achieving students have found that women are less likely than men to persist in STEM majors (Strenta, Elliott, Adair, Matier, & Scott, 1994; Ware & Dill, 1986). The generalizability of these patterns to a national scale is unclear due to their selective samples of either individuals or institutions.
Studies using national data have produced conflicting results. Using data from the 1982 cohort of High School and Beyond, Xie and Shauman (2003) found no gender gap when measuring persistence to a STEM degree from the end of students’ sophomore year. However, using data from the National Longitudinal Study of Freshman and the National Education Longitudinal Study of 1988 (NELS:88), Griffith (2010) found that female STEM majors were less likely to persist than male STEM majors. Additionally, Chen (2013) examines STEM attrition and finds that women are more likely than men to switch out of STEM majors. Yet, as with Xie and Shauman, these later studies consider all STEM fields in the aggregate, therefore potentially masking differences that exist between the life sciences and computer science, engineering, mathematics, and physical science (CEMP). In sum, the conflicting results obtained in past studies demonstrate the need for a more detailed analysis of current patterns.
What Should We Expect to Find?
Departures from STEM are common; some studies estimate 45% to 50% of students who enter STEM never earn a STEM degree (Chen, 2009; Daempfle, 2002). However, it is not clear whether males and females leave these majors at similar rates. Chen’s (2009) study using data from the 1996-to-2001 cohort of Beginning Postsecondary Students Longitudinal Study (BPS) found that 47% of STEM students either withdrew from school or switched to a non-STEM major, and he indicated that “no gender difference was evident” (p. 14).
Perhaps some of the factors contributing to the low persistence rate observed in STEM affect males’ and females’ decisions about persistence similarly. Past research suggests that a unique culture exists in many introductory-level mathematics and science courses, sometimes referred to as weed-out or gatekeeper courses (Barnes, 1997; Cairney, Hodgdon, & O, 2008; Gasiewski, Eagan, Garcia, Hurtado, & Chang, 2012). These courses are known for having large numbers of students, lecture-based teaching, a competitive environment and for assigning low grades (Achen & Courant, 2009; Brainard & Carlin, 1998; Seymour & Hewitt, 1997). Furthermore, the dominant philosophy of grading used in these courses is one in which students are ranked against one another according to the normal curve, thus ensuring that not all students are successful (Kulick & Wright, 2008; Tobias, 1990). Many scholars have critiqued this approach to learning in STEM, arguing it leads to high rates of departure among both male and female students (Daempfle, 2002; Gasiewski et al., 2012; Seymour & Hewitt, 1997).
Others have argued that the environment in the college classroom is not the same for men and women. Sandler and Hall (1982) coined the term “chilly climate” to describe the differential treatment of women in the classroom. This treatment can range from more overt behavior, such as encouraging women to switch majors or discrediting women’s intellectual abilities, to less overt behaviors, such as interrupting women when they speak or calling on males more often (Sandler & Hall, 1982). Despite decreases in overt sexism over the past few decades, women continue to be subject to subtler forms of gender biases (Moss-Racusin, Dovidio, Brescoll, Graham, & Handelsman, 2012; Spence & Hahn, 1997).
Many studies have examined whether the chilly climate affects women’s decisions to switch out of STEM majors. Morris and Daniel (2008) found that women were more likely to find the climate chillier than men, but this was not related to their intention to leave the field. Similarly, Seymour and Hewitt (1997) found the women in their study were subject to subtle behaviors indicating they were not welcome in the major, but they concluded, “This kind of behavior appeared to make women more determined not to be driven away” (p. 247). Women who enter STEM fields have already gone against typical gender norms and may not be influenced by differential treatment once in a STEM major (Riegle-Crumb, King, & Moore, 2016). Furthermore, STEM fields are highly valued and often lead to high-paying, high-status jobs (Clark-Blickenstaff, 2005; Staniec & Ordovensky, 2004). So whether or not STEM fields are chilly, women may have added incentives to remain in the field.
In some cases, the gender bias may not be visible but nonetheless might be a contributing factor in decisions to leave the field. Moss-Racusin et al. (2012) conducted a study in which science faculty were asked to rate male and female students’ applications for employment as a lab manager. Despite the fact that the male and female applications were identical, male students were rated more favorably, and males were given higher starting salaries and more career mentoring. This form of hidden bias places female students at a disadvantage in STEM majors, and therefore may lead to lower persistence rates.
The Present Study
Data from the most recent nationally representative study designed to follow students throughout the college years, the BPS:04/09, are used to investigate gender differences in the within-field persistence rates of students who initially major in STEM. The study addresses the limitations of previous research in several ways. First, subfields within the broad category of STEM are considered. Several past studies have emphasized the need to look at subfields of STEM separately when examining gender differences (Chen, 2013; Ost, 2010; Tai, Lui, Maltese, & Fan, 2006). Given that enrollment patterns by gender in life science majors are equitable, whereas males continue to be overrepresented in CEMP (National Science Board, 2008), it is important to examine these fields separately.
Additionally, to ensure that the results hold with different analytic sample specifications, analyses including and excluding non–degree earners are examined. Past research has documented that men are more likely to leave college without earning a degree than their female counterparts (Buchmann & DiPrete, 2006). Aud et al. (2013) found that among first-time, full-time undergraduates who began their studies at a 4-year degree-granting institution, 56% of men and 61% of females earned a college degree within 6 years. Since males are more likely to leave college without a degree, it is necessary to also consider patterns among only those students who earn a degree. The decision to limit the sample to degree earners is common in previous studies (Seymour & Hewitt, 1997; Sonnert, Fox, & Adkins, 2007) perhaps because the reasons for leaving college and switching majors are not the same (Buchman & DiPrete, 2006). Finally, as men and women who select STEM majors may differ from one another in a variety of ways, the study considers whether patterns of persistence are robust to the inclusion of individual and institutional characteristics.
Method and Results
The BPS:04/09 was designed by the National Center of Education Statistics for the U.S. Department of Education. BPS is the most recent data set including information on a nationally representative sample of students focused on the college years. It was designed with the specific intention of informing educational policies related to college persistence and completion. All respondents were first-time college students during the 2003–2004 academic year in the United States or Puerto Rico and were eligible for the 2003–2004 National Postsecondary Student Aid Study (NPSAS:04). BPS used a two-stage design whereby institutions were selected in the first stage, and eligible students within these institutions were selected in the second stage. Student interviews were conducted via the web, telephone, or in the field, and students were offered a small monetary incentive to participate. Eighty-two percent of the eligible sample participated in the study (Wine, Janson, & Wheeless, 2011).
Respondents were interviewed at the end of their first academic year (2003–2004), with follow-up surveys conducted in 2006 and 2009. Between the waves of data collection, a proportion of the original sample was excluded from additional data collection. This was frequently due to survey nonresponse or evidence that the student did not attend a postsecondary school in 2003–2004. In addition to the student interviews, postsecondary transcripts were collected. At least one transcript was received for 92% of the sample. The transcripts provided information about students’ degrees and majors, courses, dates of college attendance, and standardized test scores. Last, information about each institution submitting transcripts was collected, such as enrollment size and selectivity of the school.
Due to the two-stage sampling design, the unequal probability of attrition from the sample, and missing or incomplete transcript data, all analyses were completed using the WTB000 weight. This weight was created by BPS staff, and it is recommended for use in analyses involving both survey and transcript data (Jagešić, 2015; Wine et al., 2011). Using the weight helps ensure that the sample of students selected for this study from the NPSAS:04 are indeed representative of all students in the NPSAS:04. For more information on the weighting procedure used in BPS, see chapter 6 of Wine et al. (2011). All missing data from the student interviews were imputed by BPS staff using weighted hot-deck imputation (Wine et al., 2011). In the hot-deck procedure, a relatively homogenous group of observations is identified, and a single observation is selected at random and used to impute the missing data point. The small amount of missing data found on some of the transcript variables used in this study was imputed using the imputation command in Stata, college STEM grade point average (GPA; 3%), highest math course taken (4%), high school GPA (9%), and SAT scores (10%).
The analytic sample for this study included 1,694 students who attended a 4-year institution and reported during the 2003–2004 interview that their initial college major was in a STEM field. In this article, two subfields of STEM were considered, CEMP, which included 65.1% of the sample, and the life sciences. CEMP includes students from computer and information sciences (22.3%), engineering and engineering technologies/technicians (34.8%), mathematics and statistics (3.8%), and physical science (4.7%). The life sciences include students from biological and biomedical sciences (30.4%), agriculture and related sciences (2.1%), and natural resources and conservations (2.2%). Ideally, each major within CEMP and the life sciences would be investigated individually; however, due to the small number of male and/or female students found within many of these majors, and even smaller numbers who persist, such analyses would be unreliable. Among the sample of students who intended to major in STEM, males (63.6%) outnumbered females (34.4%). This discrepancy is even more substantial when considering that 56% of the students from BPS who attended a 4-year institution were female (Berkner & Choy, 2008). Within STEM subfields, the gender gap varies significantly. Female STEM majors are more likely to enter the life sciences, whereas male STEM students are more likely to enter CEMP. As a result, women accounted for 61.5% of the students intending to major in the life sciences but only 20.0% of those who intended to major in CEMP.
Dependent Variable
The outcome variable in this study measures whether or not a student persists within his or her initial field of study and earns a bachelor’s degree. This variable was constructed using the response to a survey question in the first wave of data collected during students’ freshman year asking them to state their intended major. To persist, students must earn a degree within 6 years of beginning school in the same STEM subfield as their intended major. For example, if a student’s intended major is mathematics, to be considered as persisting, he or she must earn a degree within 6 years in a major within CEMP. Two ways of measuring nonpersistence are considered. In the first, all STEM students who either do not earn a degree or earn a degree outside of their original subfield are included as nonpersisters. In the second, students who do not earn a degree are removed from the analytic sample, resulting in a comparison between students who persist and students who switch fields and earn a degree in another area.
Looking at persistence among all students who intended to major in STEM, 34.8% of males and 37.7% of females earn a STEM degree within 6 years of beginning school. A t test revealed that this small difference was not significant, indicating that male and female STEM students persist at statistically equivalent rates (Mmen = 0.348, SDmen = 0.468; Mwomen = 0.377, SDwomen = 0.501), t(767) = −0.89, p = .373.
To further examine whether a gender gap in persistence exists, the broad category of STEM was broken down to examine persistence rates separately for students in CEMP and the life sciences. Looking at the persistence rates within each STEM subfield (see the first portion of Figure 1), it is clear that women do not have lower persistence rates in either CEMP or the life sciences. In CEMP, 31.4% of males, compared to 36.3% of females, persist. In the life sciences, 31.5% of males and 32.6% of female persist. T tests confirm that the observed differences are not statistically significant in CEMP (Mmen = 0.314, SDmen = 0.460; Mwomen = 0.363, SDwomen = 0.499), t(561) = −1.01, p = .311, or the life sciences (Mmen = 0.315, SDmen = 0.450; Mwomen = 0.326, SDwomen = 0.478), t(413) = −0.26, p = .798.
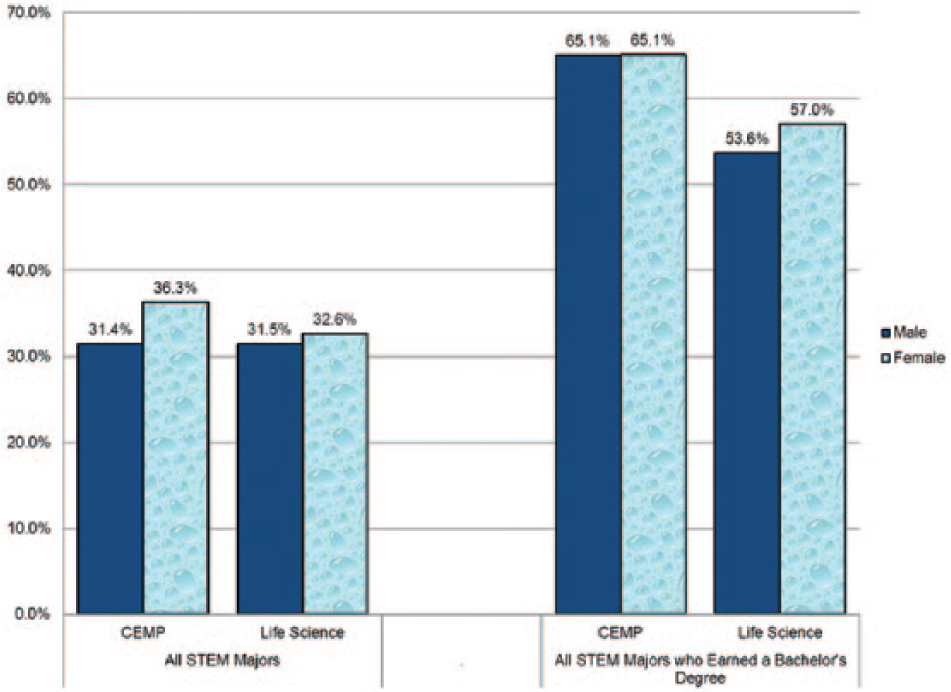
Percentages of students persisting within original field by gender. The first portion of the graphic shows the persistence rates among all students who declare a major in science, technology, engineering, and mathematics (STEM) separated into students in computer science, engineering, mathematics, and physical science (CEMP) and those in life science. The second portion of the figure shows the persistence rates for only those students who earn a bachelor’s degree, also separated into CEMP and life science students. Data obtained from the Beginning Postsecondary Students Longitudinal Study (BPS:04/09).
Male college students are more likely to leave school without a degree than female college students (Buchmann & DiPrete, 2006). Berkner and Choy (2008) found that among students in BPS who started at a 4-year institution, 22% of males compared to 17.1% of females had left school without a degree before June 2006. Therefore, to ensure that these results are not sensitive to the specification of the analytic sample, the analyses are repeated excluding students who leave school without earning a degree. The latter portion of Figure 1 displays the persistence rates by gender when students who leave college without a degree are removed from the sample. Again it is clear that men and women in CEMP and the life sciences persist at similar rates. In CEMP, both men and women persist 65.1% of the time, whereas women’s persistence rates are slightly higher, 57.0% compared to 53.6%, in the life sciences.
In exploratory analyses, the dependent variable was constructed so that students who persisted must earn a degree in the same area as their intended major. For example, a student who majors in computer science is considered as persisting only if his or her degree was awarded in computer science. Defining persistence in this way resulted in substantively similar results. Most notably, there were no significant gender differences in persistence.
Background, Preparation, and College Characteristics
In the multivariate models that follow, measures of social class background, academic preparation, and college characteristics that are likely related to persistence are included. This better ensures that the relationship observed between gender and persistence in college STEM majors is robust to the inclusion of such factors. Measures of social class background have been identified in the literature as influencing students’ initial choice of major and/or degree attainment (Dowd, 2004; Fischer, 2007; Xie & Shauman, 2003) and are thus included in the multivariate models. Social background variables used in this study include family income (logged), parent education level (measured ordinally in terms of the highest level completed by either parent), and race/ethnicity (measured as a series of dummy variables for Black, Asian, Hispanic, and Other compared to the reference category, non-Hispanic White). The average family income (not logged) was $40,135, and the average parent education level in the sample fell between earning an associate’s degree and attending college for more than 2 years without earning a degree. The race/ethnicity of students in the sample was 62.9% non-Hispanic White, 13.9% Black, 10.8% Hispanic, 8.2% Asian, and 4.1% Other.
Given the importance of high school performance in predicting college persistence, several high school variables related to course taking, test scores, and grades are included (Bonous-Hammarth, 2000; Ewert, 2010). Official math and verbal SAT scores, as well as students’ self-reported cumulative high school GPA are included. GPA was coded by BPS using the following scale: 1 (below 0.9 average on a 4-point scale), 2 (1.0–1.4 average), 3 (1.5–1.9 average), 4 (2.0−2.4 average), 5 (2.5−2.9 average), 6 (3.0−3.4 average), and 7 (3.5–4 average). Course taking is measured using two variables, the highest math course taken and the number of advanced placement (AP) credits earned in mathematics. Highest math course is an ordinal variable and is measured as 0 (less than Algebra 2), 1 (Algebra 2), 2 (Trigonometry), 3 (Precalculus), and 4 (Calculus). Students’ educational expectations are also accounted for using a series of dummy variables for master’s degree and doctoral or professional degree compared to the reference category, bachelor’s degree or lower.
On average, students from this sample had SAT scores of 1054, had a cumulative high school GPA of approximately 3.5, and earned less than one half of a AP math credit, and the highest math course taken was between Trigonometry and Precalculus. In regard to their educational expectations, 33% of the students said they expected to earn a doctoral or professional degree, 39% a master’s degree, and 28% a bachelor’s degree or less. Previous studies with nationally representative data have shown that students in STEM are more academically prepared than students in other fields of study (Chen, 2009; King, 2015).
College Characteristics and Achievement
Additional control variables are considered to further ensure that the association between gender and persistence in college is not confounded by characteristics of the colleges that students attend as well as their academic experiences and performance while in college (Buchmann & DiPrete, 2006; Chen, 2013; Tinto, 1993). At the institutional level, college enrollment size and selectivity were controlled for (Smyth & McArdle, 2004). College selectivity was measured using categories created by BPS that take into account the number of applicants and number admitted, the 25th and 75th percentiles on ACT and/or SAT scores, and whether test scores were required. Nationally, as college selectively increases, so does the likelihood of students’ earning a bachelor’s degree (Bowen, Chingos, & McPherson, 2009). Four categories were constructed for college selectivity: open (28%), minimum selectivity (8%), moderately selective (40%), and very selective (24%).
As for students’ experiences in college, social and academic integration variables provided in BPS and students’ college GPA in STEM were used. Tinto’s (1975) college retention theory cites social and academic integration as central in the decision to remain in college. Furthermore, Pascarella and Terenzini (1983) found that social integration was more predictive of persistence among women, whereas academic integration was more predictive for males. More recently, using data from BPS, Ishitani (2016) found that academic integration was effective in predicting 1st-year persistence. The academic integration variable includes how often the student participated in study groups, had social contact with faculty, met with an academic advisor, or talked with faculty about academic matters outside of class, and the social integration variable measures how often the student participated in school clubs, attended fine arts activities, or participated in intramural or varsity sports. These questions refer to students’ overall college experience and are unfortunately not specific to STEM courses. The possible responses for each item were 0 (never), 1 (sometimes), or 2 (often). BPS averaged the responses in each category and then multiplied the average by 100 so the possible scale on these variables is from 0 to 200.
Many studies have documented the strong relationship between college grades and college persistence (Hu, McCormick, & Gonyea, 2011; Sabot & Wakeman-Linn, 1991). The grades in STEM fields are generally lower than those awarded in other fields of study (Kokkelenburg & Sinha, 2010; Rask, 2010), and the relationship between grades and persistence is particularly high for students in CEMP (King, 2015). As a result, it was important to include a measure for students’ college STEM GPA in the multivariate models. STEM GPA was coded on a 4-point scale, and the average across the sample was 2.71.
Gender Differences
Table 1 shows descriptive statistics for the control variables included in the multivariate analysis by gender and STEM subfield. To determine whether significant gender differences existed on the continuous variables, t tests were used. For all other variables, chi-square tests were used to determine if a relationship between a given variable and gender exists. Among students whose initial major is in CEMP, there are no significant gender differences on measures of academic preparation. This holds even on the measure of math SAT, in which college males, on average, outperform college females, and on high school GPA, in which college females, on average, outperform college males (Riegle-Crumb, King, Grodsky, & Muller, 2012). Regarding high school preparation, the males and females who enter CEMP are much more similar than is the case when looking at college students in general. In the life sciences, the only significant gender difference in academic background is a female advantage on high school GPA. Female life science students reported higher GPAs (M = 6.70, SD = 0.56) than did male life science students (M = 6.32, SD = 0.94), t(273) = −3.19, p < .01.
Descriptive Statistics for Independent Variables

Note. Sample includes all students who intended to major in science, technology, engineering, and mathematics (STEM) and earned a bachelor’s degree. Means are shown for continuous variables; otherwise percentages are shown. An asterisk indicates that the male mean is different from the female mean. AP = advanced placement; CEMP = computer science, engineering, mathematics, and physical science; GPA = grade point average.
Pearson’s chi-square test revealed a significant relationship between the given variable and gender.
p < .05, **p < .01, ***p < .001.
Pearson’s chi-square tests revealed a relationship between race and gender in CEMP, χ2(4) = 26.29, p < .001, but not in the life sciences, χ2(4) = 3.31, p = .507. Although it is important to consider the intersection of gender and race/ethnicity, the small number of students in this sample who enter STEM majors from certain racial/ethnic-by-gender subgroups limits the ability to complete such analyses. A chi-square test also revealed a significant relationship between educational expectations and gender among students in the life sciences, χ2(2) = 10.59, p < .01.
With regard to gender differences on college variables, female CEMP majors compared to male CEMP majors have significantly higher scores for academic integration (Mwomen = 90.3, SDwomen = 35.5; Mmen = 79.9, SDmen = 39.0), t(347) = −2.79, p < .01, and higher scores for social integration (Mwomen = 71.0, SDwomen = 54.5; Mmen = 57.9, SDmen = 39.0), t(347) = −2.19, p < .05. Men and women in CEMP have statistically similar college STEM GPAs, whereas in the life sciences, female students have higher college STEM GPAs (Mwomen = 3.0, SDwomen = 0.6; Mmen = 2.8, SDmen = 0.66), t(273) = −2.65, p < 0.01.
Multivariate Results
The dependent variable in this study has two categories. Therefore, logistic regression analyses were utilized to predict the likelihood that students persist and earn a degree in their initial field of study versus earning a degree in another field. The analyses are run separately for students in CEMP and the life sciences. The results are displayed as average marginal effects, which correspond to the expected change in the probability of the outcome associated with a one-unit change in the predictor, averaged across all observations (Hoetker, 2007; Mood, 2009). In Table 2, the first model shows results that are consistent with those seen in Figure 1. The results show that in both CEMP and the life sciences, gender is not a significant predictor of persistence. In Model 2, background and high school preparation variables are added, and in Model 3, college characteristics and experiences are included. The female coefficient is not significant in any model, and this holds among students in both STEM subfields. Therefore, adjusting the models to consider male and female STEM majors comparably on an extensive range of factors does not change the key finding of gender equality in persistence.
Average Marginal Effects on the Probability of Persisting Within One’s Initial Field of Study Versus Earning a Degree in Another Field
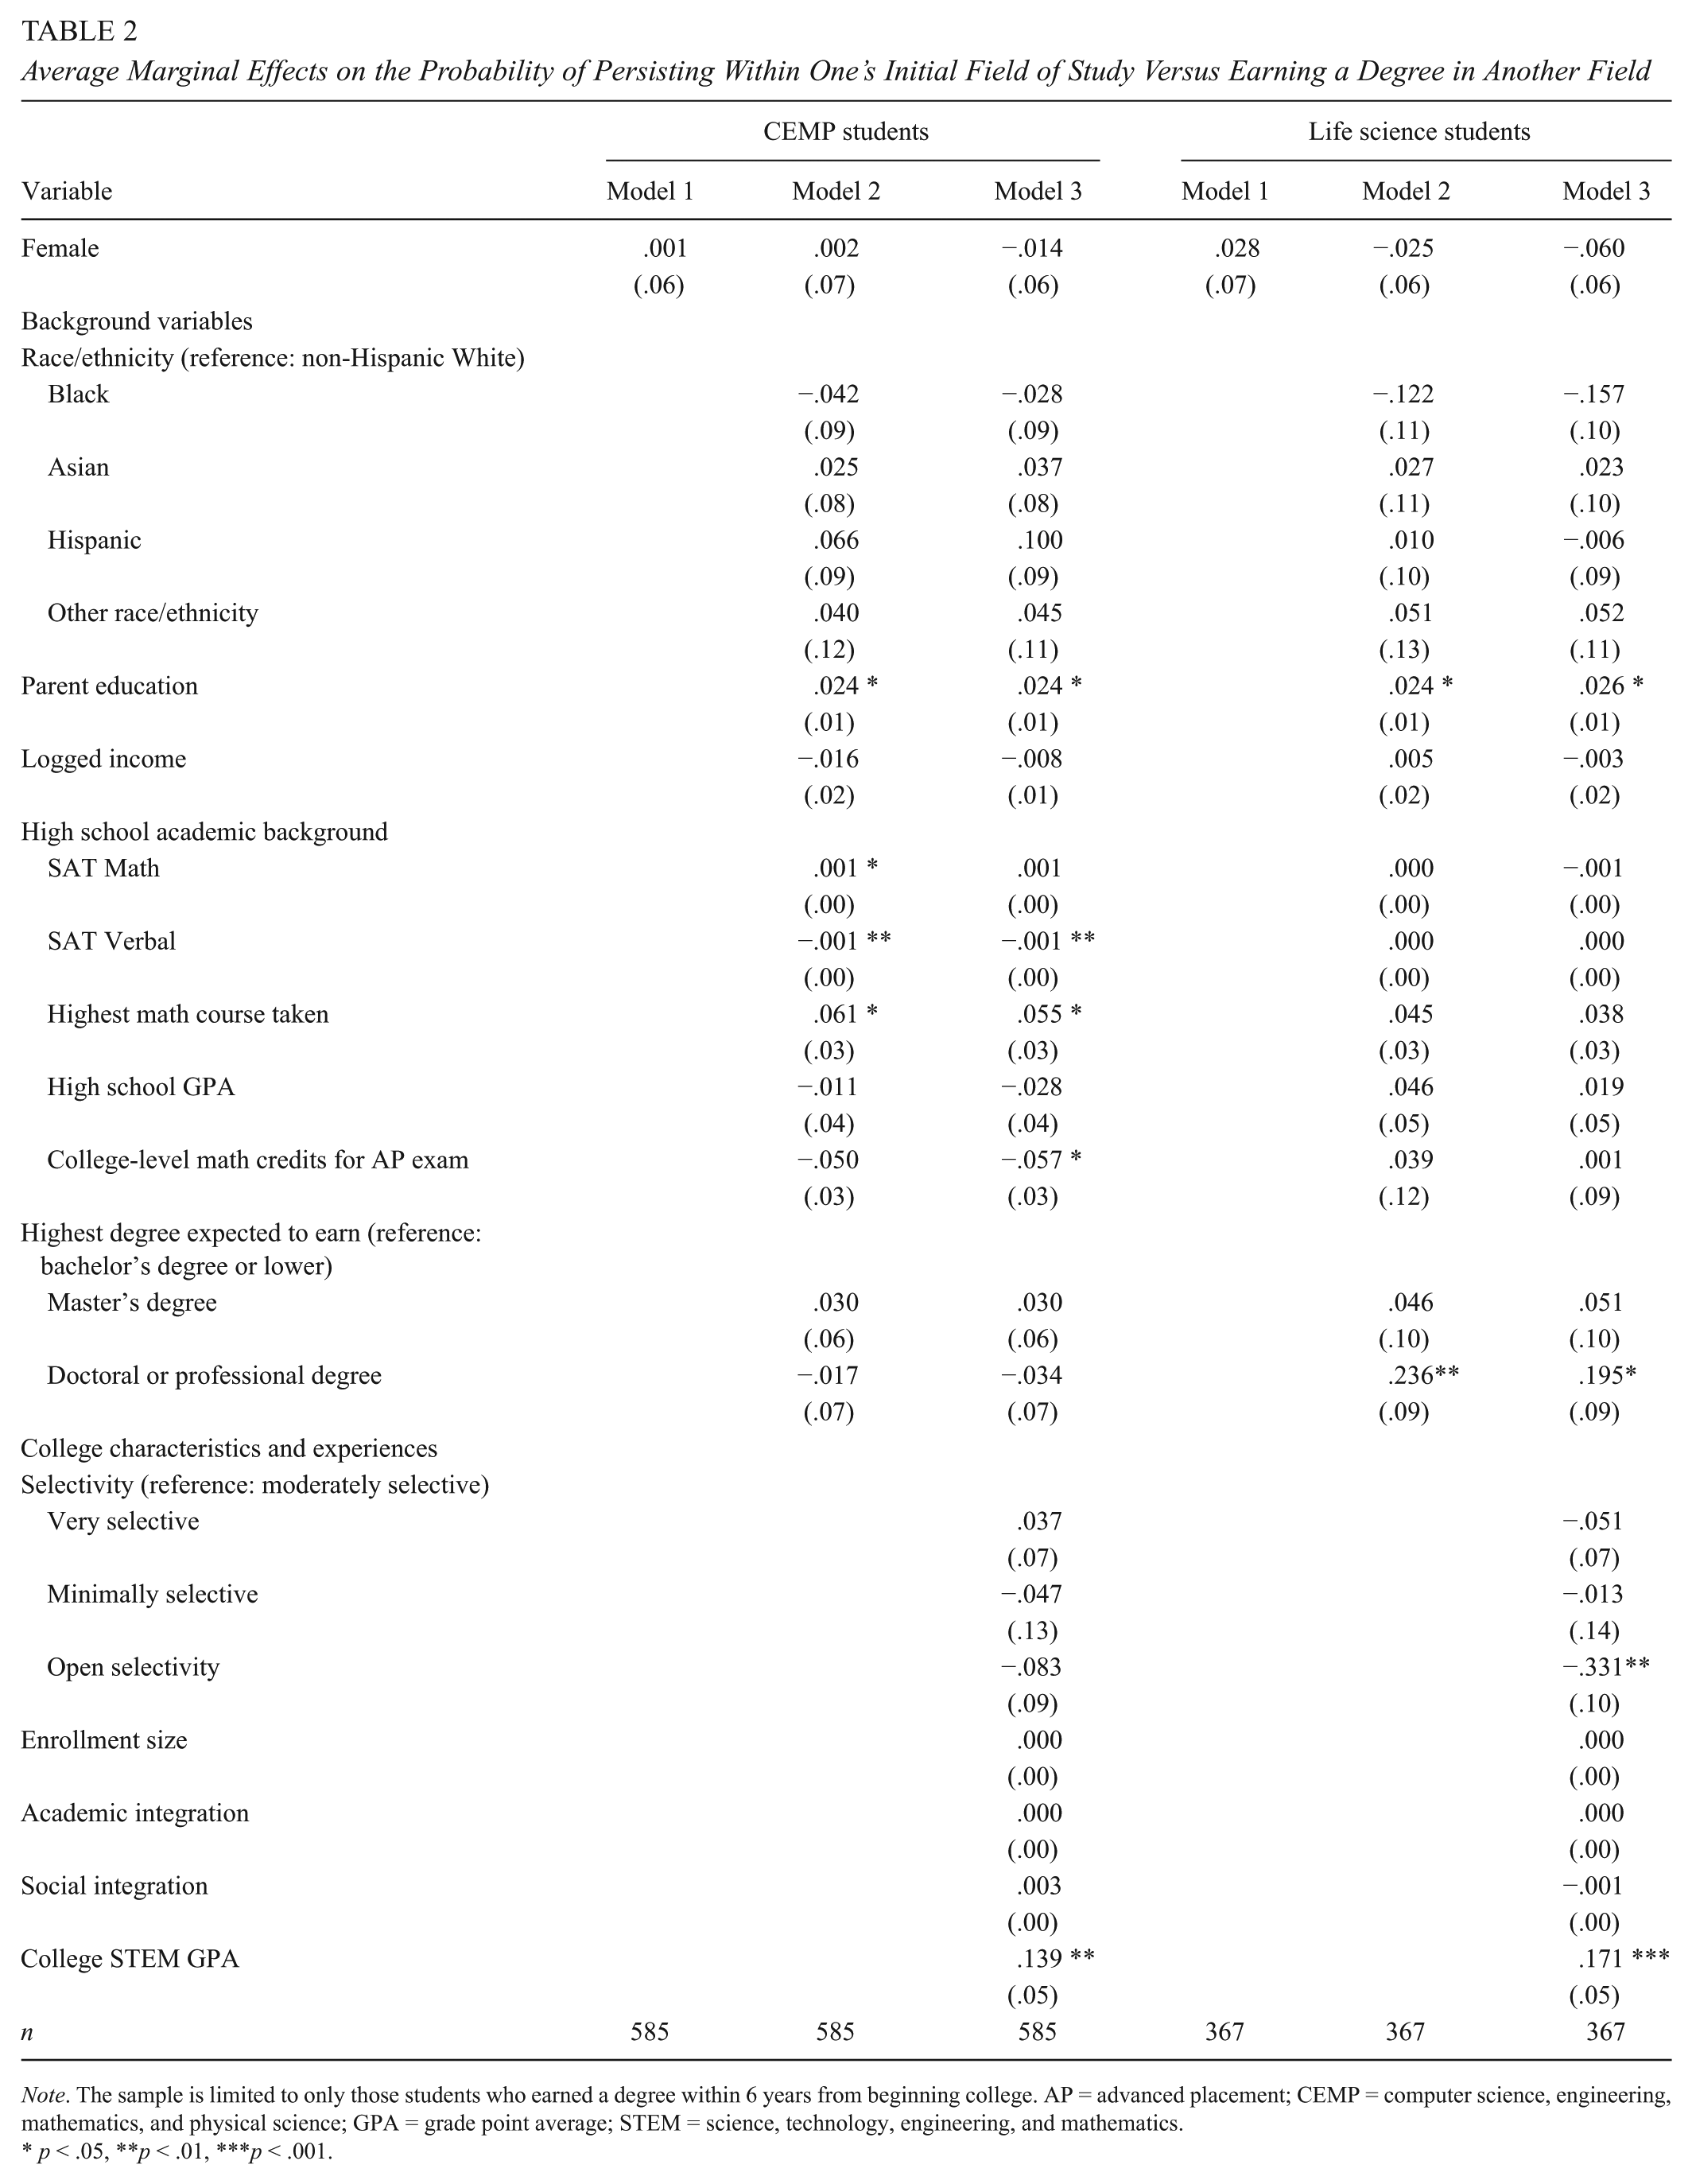
Note. The sample is limited to only those students who earned a degree within 6 years from beginning college. AP = advanced placement; CEMP = computer science, engineering, mathematics, and physical science; GPA = grade point average; STEM = science, technology, engineering, and mathematics.
p < .05, **p < .01, ***p < .001.
To ensure that the key findings related to gender equality were not the result of running separate analyses for students in CEMP and the life sciences, an additional regression analysis was completed with the entire sample (results available upon request). This analysis included an interaction term between gender and subfield of STEM in each of the three models. Gender and subfield of STEM were not significant in any model, nor was the interaction term. These results further support the finding of gender equality in persistence.
In the final model shown in Table 2, there are significant relationships between several control variables and within-field persistence that are worth noting. Among students intending to major in CEMP, parent education level, SAT Verbal test scores, and highest math course taken in high school were each positively associated with persistence. Although AP math credits are negatively and significantly related to persistence, this is the case only when students’ SAT Math scores (which are positively correlated with AP math credits) are also in the model. Students’ GPA in STEM courses while in college was also significantly related to persistence. On average, a one-point change in college STEM GPA was associated with an approximately 14-percentage-point higher probability of persistence in CEMP. A similar relationship was found among students in the life sciences, where having a one-point higher college STEM GPA results in an approximately 17-percentage-point higher probability of persistence. For students in the life sciences, parent education, expecting to earn a doctoral or professional degree compared to expecting to earn a bachelor’s degree or lower, and attending a moderately selective school versus an open-selectivity school are significant predictors of persistence. For example, students who expect to earn a doctoral or professional degree have a 20-percentage-point higher probability of earning a life science degree compared to students who expected to earn a bachelor’s degree or lower.
Last, it is worth noting the nonsignificant racial/ethnic coefficients found in both models. These results show that Black, Asian, Hispanic, and students of other races/ethnicities persist at statistically comparable rates as students in the reference category, non-Hispanic White. Although there is a great deal of research indicating that Black and Hispanic students persist in college at lower rates than non-Hispanic Whites (Cole & Espinoza, 2008; Kao & Thompson, 2003), these results show that among students who earn a bachelor’s degree, Black and Hispanic students who intend to major in either STEM subfield are as likely as their non-Hispanic White peers to remain in the major and earn a degree.
Discussion
Using recent, nationally representative data, this study finds that women are as likely as men to persist in a college STEM major. This is true in CEMP, where women are significantly underrepresented, and in the life sciences, where women are equally represented. Additionally, the gendered patterns are the same regardless of whether or not non–degree earners are included in the sample and are robust to the inclusion of individual and institutional characteristics. Although it is possible that men and women may choose to persist (or not) for different reasons, it is clear that after selecting a STEM major, gender is not predictive of college persistence.
Although the results show women persist in STEM at the same rate as men, they do not disprove the possibility that many STEM classrooms are chilly places for women. It may still be the case that women face obstacles that are not present for male students, but perhaps the women who choose to enter STEM fields are particularly resilient to such obstacles. Or it may be that the incentives to persist, such as a career in a high-status field, may offset the obstacles women may encounter in the STEM classroom. Unfortunately, current nationally representative data sets, like BPS, do not provide the opportunity to examine how these factors are related to men’s and women’s pathways through college STEM majors.
Women continue to be underrepresented in doctoral degree attainment and in the STEM workforce (Beede et al., 2011; National Science Board, 2016). Because these outcomes are often dependent on earning a bachelor’s degree in STEM, the underrepresentation of women is due in large part to the fewer number of women making the choice to pursue a STEM major in college (Clark-Blickenstaff, 2005). However, there is evidence that even among STEM bachelor’s degree earners, women are less likely to earn a STEM doctoral degree or enter the STEM workforce. For example, in mathematics, women earn 44.9% of the bachelor’s degrees awarded in the United States but only 29.6% of the doctoral degrees (Hill, Corbett, & St. Rose, 2010). Although a similar pattern holds in some areas of STEM, including the life sciences, in computer science, women earned 20.5% of the bachelor’s degrees and 21.3% of the doctoral degrees. In the workforce, only 25% of the STEM jobs are held by women, despite the fact that women make up 50% of the total workforce in the United States. Beede et al. (2011) find that 40% of men who earn STEM degrees enter the STEM workforce compared to 26% of female STEM degree earners.
The results in this article demonstrate the need to reexamine patterns of STEM inequality to identify points in the pipeline where gender equality exists. If popular wisdom, as well as academic literature, continues to promote the inaccurate notion that women are more likely to leave STEM majors, this will likely discourage young women who are interested in pursuing a STEM degree but are concerned about their chances for success. Furthermore, holding on to ideas that college STEM females are less successful than STEM males may have repercussions for the women who choose to enter these majors. As an example, professors may invest more time in male students, including taking time to mentor them in the graduate school or workforce application process, based on the false notion that men are more likely to eventually earn a STEM degree.
In conclusion, it is crucial to recognize those instances in the STEM pipeline when there is evidence of gender similarities rather than disparities. Such information can be used to guide the development of programs and policies designed to bring more women into STEM by targeting students before entering college as well as work to help women who earn a STEM bachelor’s degree transition into the STEM workforce. These results can help diminish stereotypes about who can be successful in college STEM majors, potentially opening the doors to STEM degrees for more women.