
Abstract
In a recent paper, Reardon found that the relationship between family income and children’s academic achievement grew substantially stronger in the 1980s and 1990s in the United States. We provide an international context for these results by examining the income–achievement association in 19 other Organisation for Economic Co-operation and Development countries using data from the Progress in International Reading Literacy Study and the Programme for International Student Assessment. First, we calculate and compare the magnitude of “income achievement gaps” across this sample of countries. Second, we investigate the association between the size of a country’s income achievement gap, its income inequality, and a variety of other country characteristics. We find considerable variation across countries in income achievement gaps. Moreover, the U.S. income achievement gap is quite large in comparison to this sample of countries. Our multivariate analyses show that the income achievement gap is positively associated with educational differentiation, modestly negatively associated with curricular standardization, and positively associated with national levels of poverty and inequality.
Specifically, we address two questions in the current paper. First, we investigate whether income is equally determinative of academic achievement across countries. We use data from the Progress in International Reading Literacy Study (PIRLS) and the Programme for International Student Assessment (PISA) to estimate the magnitude of the “income achievement gap” between children from high- and low-income families in 20 Organisation for Economic Co-operation and Development (OECD) countries. Second, we investigate the association between the size of a country’s income achievement gap, its poverty and inequality levels, and a variety of other country characteristics, including welfare policies, parental support policies, and the degree of differentiation and standardization of national school systems. Here we hypothesize (a) that poverty and inequality are positively associated with the strength of the relationship between income and achievement; (b) that social welfare policies are negatively related to the income achievement gap; (c) that differentiation within the school system—in the form of curricular tracking and size of the private sector—is positively associated with the strength of the relationship between income and achievement; and (d) that standardization of the school system—indicated by the use of centralized examinations—is negatively associated with the strength of the relationship between income and achievement.
To date, there has been little comparative cross-national research investigating the association between family income and student achievement in different countries, in large part because family income data are rarely available in cross-national studies of student achievement, such as PISA, Trends in International Mathematics and Science Study (TIMSS), and PIRLS. In 2001, however, the PIRLS parent survey did ask respondents to report their household income. Likewise, in 2006, 2009, and 2012, the PISA study administered a parent survey that included a household income item in a limited set of countries. We make use of these data to compute income achievement gaps across the participating countries and to compare them to the magnitude of income achievement gaps in the United States.
The Income–Achievement Association in the United States
Reardon (2011), using data from 12 nationally representative samples of U.S. students tested in reading and math from 1960 through 2006, shows that the income achievement gap grew rapidly in the United States among cohorts of students born in the mid-1970s through 2000. Reardon measures the income achievement gap by estimating the average difference in test scores between students with family income at the 90th percentile of the income distribution and those with family income at the 10th percentile of the income distribution. This “90/10 income achievement gap” was roughly 0.85 to 0.90 standard deviations among cohorts of students born in the mid-1970s and roughly 1.20 to 1.25 standard deviations among those born in the mid-1990s, an increase of roughly 40% over 20 years. More recent data suggest that the gap declined by 15%, however, in the subsequent decade (Reardon & Portilla, 2015). A similar trend holds for the income achievement gap in math.
Reardon (2011) describes several other key features of the income achievement gap in the United States. First, the gap does not grow larger as children progress in school. In longitudinal studies, the income achievement gap is large when children enter kindergarten or elementary school and remains roughly the same size through elementary and secondary school. This finding suggests that schooling alone is not a primary cause of the gap (because the gap is present when children enter formal schooling). Second, most of the growth of the 90/10 income achievement gap in the United States resulted from the growth in the achievement gap between children with family incomes between the 90th and 50th percentiles of the income distribution; the achievement gap between children with family incomes between the 50th and 10th percentiles was unchanged in reading and grew only very slightly in math. Third, the trend in the income achievement gap is much steeper than the corresponding trend in the “parental-education achievement gap” (the achievement gap between children with highly and less educated parents. This difference in the income and education achievement gap trends suggests that—in the United States at least—family income is not identical to parental education in its relationship to children’s achievement over time. The explanation for this difference is not clear, however.
The reasons for the growth in the income achievement gap in the United States are also unclear. Certainly, the gap has grown at the same time that income inequality has grown, but the mechanisms linking this to the achievement gap are not obvious. If the ways that families use their income (and other income-related resources) to develop their children’s academic skills were constant over time (that is, if the cognitive returns to family income were constant), rising income inequality would lead, mechanically, to growing income achievement gaps. But achievement gaps might change as well because of a change in the returns to family income. If the ways that high- and low-income families use their economic, educational, and social resources have changed differently over time, then the association between income and academic performance might change differently than implied mechanically by changes in income inequality. The income achievement gap might also change because of changes in the correlation between family income and other resources that matter for children’s cognitive development. Reardon (2011) notes that family income has become more correlated with both parental education (because of the rising economic returns to education and because of increased marital homophily) and with the income of one’s neighbors (Bischoff & Reardon, 2014; Owens, 2015), both of which may affect children’s educational performance (Chetty, Hendren, & Katz, 2015; Reardon, 2011).
Reardon (2011) finds that the growth of the income achievement gap does not map well onto the growth of income inequality (income inequality among families with children in the United States grew most rapidly between families at the 50th and 10th percentiles of the income distribution in the 1970s and 1980s, but the achievement gap grew most rapidly between children born in the 1980s and 1990s in families at the 90th and 50th percentiles of the income distribution). In addition, the gap appears to have narrowed in recent years, even as income inequality continued to grow (Bassok & Latham, 2014; Magnuson & Duncan, 2014; Reardon & Portilla, 2015). These patterns suggest that the changes in the income achievement gap in the United States are not driven solely by mechanical effects of changing income inequality.
Nor is it clear that the growth of the gap can be attributed to the U.S. schooling system. The fact that the income achievement gap is very large as early as age 5 or 6 suggests that the gap has grown more because of early childhood experiences than because of elementary or secondary schooling. Likewise, the decline in the income achievement gap in recent years is driven by changes in gaps in school readiness when children enter kindergarten (Bassok & Latham, 2014; Magnuson & Duncan, 2014; Reardon & Portilla, 2015), a change that cannot be directly attributed to effects of schooling.
Nonetheless, the fact that the descriptive evidence in the United States does not clearly point to either rising income inequality or features of the educational system as the source(s) of changes in the income achievement gap does not mean that inequality and education may not contribute to the achievement gap in more complex ways. Inequality may increase parents’ status anxiety and lead to changes in how much time and resources they invest in their children’s education. Those with more resources can invest more in their children than those with fewer resources, particularly if the social welfare system is too weak to support low-income families. The growing importance of standardized testing in U.S. schooling may lead parents and schools to focus increasingly on school readiness and test performance. And in a decentralized educational system like that of the United States, family resources may affect the quality of schooling available to children. Indeed, Owens (2015) suggests that parental focus on schooling, coupled with rising income inequality, has led to growing economic segregation both among neighborhoods and schools. Thus, income inequality, coupled with weak social welfare systems, high levels of income segregation, and a decentralized schooling system, will likely produce relatively large achievement disparities between children from rich and poor families. In the remainder of this paper, we use cross-national comparisons to investigate this possibility.
The Income–Achievement Association in Cross-National Comparison
In this paper, we focus on two main sets of national characteristics that may be associated with the strength of the income–achievement association: (a) broad social factors associated with educational (in)equality, including income inequality levels, poverty rates, school segregation, and equity-enhancing social welfare policies, and (b) features of the educational system that may affect educational inequality, including structural differentiation of the schooling system and standardization of the curriculum.
Social Factors Associated With Educational Inequality
As noted above, there is little cross-national research on the income–achievement association; there is, however, a great deal of research on the SES–achievement association. Much of this research is based on the student-reported socioeconomic background variables in the PISA studies, which included parents’ educational attainment, parents’ occupations, and an inventory of home possessions. The OECD combined these responses to create an index of economic, social, and cultural status (ESCS; OECD, 2009a, 2010a). Many secondary analyses of the PISA data sets use the ESCS index to capture students’ SES, whereas some others use parent education, occupation, or the component possessions scales. Research using TIMSS or PIRLS often uses parent education or books in the home (which are student reported in TIMSS and parent reported in PIRLS) as a measure of SES.
Previous cross-national research using PISA, TIMSS, and PIRLS has not found a strong relationship between income inequality and SES achievement gaps. Several authors, as well as the OECD’s PISA reports, have found a very weak or no relationship between income inequality and SES achievement gaps (Dupriez & Dumay, 2006; Duru-Bellat & Suchaut, 2005; Marks, 2005; OECD, 2010a). Chudgar and Luschei (2009) found that there is more variation in test scores between schools in countries with high income inequality than in those with lower inequality. This suggests that income inequality may be associated with—and perhaps operate through—between-school segregation and/or resource differences between schools.
Indeed, increasing income inequality has been shown to be associated with increasing income segregation of neighborhoods, particularly, segregation of high-income families and families with children, at least in the United States (Owens, 2015; Reardon & Bischoff, 2011). If neighborhood segregation results in greater income segregation of schools, this could also drive socioeconomic disparities in achievement, especially those at the high end of the SES scale. Likewise, income inequality in wealthy countries is associated with high levels of poverty (conditional on per capita GDP); poverty rates may be predictive of income achievement gaps, particularly, achievement gaps between low- and middle-income students. In this paper, we measure income inequality directly, using the Gini index, but we also create a more general index of poverty and inequality. In developed countries, income inequality is strongly correlated with child poverty rates (because high poverty rates in a rich country implies substantial income inequality) as well as other sequelae of poverty and inequality, such as high rates of teen childbirth, high rates of low birthweight, and high levels of segregation by income among schools.
Finally, income inequality and poverty may matter less than social welfare policies and supports for families with children. Countries with a strong social safety net, generous social welfare policies, and publicly funded early childhood educational programs may have much lower educational inequality than countries with less effective social welfare regimes, even if both have the same level of income inequality and poverty.
Features of the Educational System Associated With Educational Inequality
Typologies of the institutional structures of educational systems focus on two key dimensions: differentiation and standardization (Allmendinger, 1989; Shavit & Müller, 1998; Van de Werfhorst & Mijs, 2010). Differentiation, when students are placed in different curricular tracks on the basis of ability or prior achievement, can reproduce social class differences if lower-SES students are overwhelmingly assigned to lower tracks (either because of low prior performance or discrimination), where educational quality is much lower. On the other hand, standardization of resources and curricula may produce greater homogeneity of educational quality across schools.
Differentiation
Most international research on the topic of differentiation defines tracking in terms of overarching programs that determine course work in all subjects and are usually located in separate school buildings. Such tracking is widely practiced in Europe, in contrast with the within-school, subject-specific tracking common in the United States (Chmielewski, 2014). Although within- and between-school tracking have similar achievement gaps between tracks, between-school tracking is more predictive of SES achievement gaps because it is typically more socioeconomically segregated (Chmielewski, 2014). Among countries with some between-school tracking, the degree of differentiation varies according to how early tracking begins and the number of distinct tracks. A large body of literature has found that SES gaps are larger in countries with more differentiated school systems (Ammermüller, 2005; Bol, Witschge, Van de Werfhorst, & Dronkers, 2014; Brunello & Checchi, 2007; Causa & Chapuis, 2009; Dupriez & Dumay, 2006; Duru-Bellat & Suchaut, 2005; Field, Kuczera, & Pont, 2007; Horn, 2009; Marks, 2005; Marks, Cresswell, & Ainley, 2006; Schütz, Ursprung, & Wößmann, 2008; Schütz, West, & Wößmann, 2007) and in regions within countries with greater differentiation (Bauer & Riphahn, 2006; Mühlenweg, 2007; Wößmann, 2007). However, two studies have cast some doubt on these findings by noting that the stronger relationship between SES and achievement in more differentiated countries was also evident in primary school math and reading tests before tracking had begun (Jakubowski, 2010; Waldinger, 2006). On the other hand, Schubert and Becker (2010) found that SES gaps did increase in Germany (which has a highly differentiated system) between the fourth grade and age 15. A further attribute of country school systems that characterizes the degree of differentiation is the prevalence of grade repetition. This could exacerbate socioeconomic inequalities in achievement if disadvantaged students tend to disproportionately repeat grades, thus progressing through school at a slower pace and being exposed to less advanced curricular content. Dupriez and Dumay (2006) found that, as part of index along with tracking, grade repetition was associated with larger SES gaps.
Another important characteristic related to differentiation is the size of the private school sector. The OECD’s initial results using PISA found that private schooling overall is not associated with inequality in achievement (OECD, 2007), but other authors later pointed out that it was important to take into account that in some countries, privately managed schools are privately funded, whereas in others, they are publicly funded (Alegre & Ferrer, 2010). When these two types are separated, private funding of schools is associated with greater SES gaps, whereas private management is associated with weaker SES gaps (Ammermüller, 2005; Schütz et al., 2007, 2008).
Tracking and private schooling are both theorized to increase socioeconomic achievement gaps because they segregate students of different social class backgrounds. Indeed, a number of comparative studies have found that tracking is associated with socioeconomic segregation between schools (Causa & Chapuis, 2009; Demeuse & Baye, 2008; Jenkins, Micklewright, & Schnepf, 2006; Willms, 2010). Private schooling may also be associated with greater segregation, although again this appears to depend on whether funding is public or private (Alegre & Ferrer, 2010; Jenkins et al., 2006). More generally, when schools are allowed to practice selective admissions, they tend to be more segregated (Alegre & Ferrer, 2010; Demeuse & Baye, 2008; Field et al., 2007; Jenkins et al., 2006; West, 2006), although evidence on the relationship between greater school choice by parents and segregation is mixed (Alegre & Ferrer, 2010; Demeuse & Baye, 2008; Field et al., 2007; Gorard & Smith, 2004). Another country factor that could contribute to school segregation is residential segregation, which is far higher in the United States than in Europe (Musterd, 2005). Perhaps the most general formulation of the idea of the effects of differentiation on inequality in achievement would be that greater socioeconomic segregation in a school system results in greater socioeconomic achievement gaps.
Standardization
The second dimension used to describe school systems is standardization. The hypothesis here is that standardization of national curriculum and exams should reduce SES achievement gaps, whereas decentralization of the school system should increase SES gaps. Furthermore, disparities in resources, such as those created by regional or local funding systems (Field et al., 2007) or variation in teacher quality (Chiu & Khoo, 2005), could disadvantage low-SES students. Most recent research on the impact of standardization on SES achievement gaps defines standardization either in terms of the presence of curriculum-based external exit exams and/or in terms of school autonomy over curricular and/or budgetary decision making. Curriculum-based external exit exams for secondary schools are defined by Bishop (1997) as exams that (a) have real consequences for students; (b) are defined relative to an external, centralized standard; (c) are tied to course curricula; (d) signal multiple levels of achievement, rather than merely pass/fail; and (e) are taken by almost all secondary school students. On the basis of these criteria, he classified countries into those with or without centralized exams in secondary school. Research on school autonomy often uses information from PISA principal questionnaires reporting school control over curriculum, assessment, budgetary allocation, and hiring of teachers. Findings on standardization are mixed, depending on the country, time period, and exact measure of standardization used. Greater school autonomy appears to be associated with greater SES gaps, as expected (Horn, 2009), but this may be only for autonomy in hiring teachers and establishing salaries and not for curriculum or budget (Schütz et al., 2007). Regarding centralized exams, Park (2008) found that, as part of an index along with a standardized national curriculum and textbooks, exams were associated with smaller SES gaps, but other authors found no significant association between centralized exams and SES gaps (Horn, 2009; Wößmann, 2005), and some even found a positive association between centralized exams and greater SES gaps (Bol et al., 2014; Muller & Schiller, 2000; Schütz et al., 2007). Stevenson and Baker (1991) found that a standardized national curriculum was related to weaker effects of student and teacher characteristics on implemented curriculum, but Westbury and Hsu (1996) argued that this was actually conditional on between- and within-school tracking, which illustrates the complex, interdependent relationship between differentiation and standardization. Two sets of authors have found evidence for this proposed interaction effect between differentiation and standardization. Comparing the United States and Israel, Ayalon and Gamoran (2000) found that in the United States, greater within-school differentiation (math tracking) was associated with more inequality in achievement, whereas in Israel, which has a standardized national exam system, the opposite was true. For 36 countries participating in PISA 2009, Bol et al. (2014) found that the positive association between tracking and SES achievement gaps was weaker in systems with centralized exams.
Aside from differentiation and standardization, systems with a higher level of quality overall could also equalize opportunity by exposing even-lower-SES students to a high minimum standard of education. Educational expenditure is not associated with SES gaps (Schütz et al., 2008), nor are average length of school day and official school starting age (Schütz et al., 2008), but higher average instructional time is associated with smaller SES gaps (Ammermüller, 2005). Higher participation in childcare or preschool is associated with smaller SES gaps (Causa & Chapuis, 2009; Field et al., 2007; Schütz et al., 2008). Average educational quality could also be related to country level of wealth. Heyneman and Loxley (1983) found that the SES effect on achievement is stronger in wealthier countries, whereas the school quality effect is stronger in developing countries; but in a later study, Baker, Goesling, and LeTendre (2002) found that the SES effect has grown stronger even in developing countries as school resources have become more standardized worldwide. Schütz et al. (2008) found no association between gross national income per capita and SES gaps.
SES Gaps Versus Income Gaps
All of the literature described above focuses on the relationship between achievement and SES, as measured by parent education, parent occupation, or home educational possessions, such as books. Our focus in the present study, in contrast, is on a relationship that has received little attention in international education research: the relationship between academic achievement and family income. Given that income and parental education differ in their relationships to achievement in the United States (and these relationships exhibit different trends over time, as shown by Reardon, 2011), it is not clear that previously studied cross-national patterns of the SES (parent education, occupation, and possessions)–achievement gradient are identical to cross-national patterns of the income–achievement gradient. They may differ because the correlations between household income and other dimensions of SES differ across countries or because the independent effects of income relative to parental education differ among countries. Indeed, there is some evidence that income and wealth both operate differently in the United States than in many other countries. Compared to most European countries, the United States (and to a lesser extent the United Kingdom) have higher educational mobility but lower income mobility, most likely due to the strong associations between educational attainment and income in the United States and United Kingdom (Breen & Jonsson, 2005). In a sensitivity analysis of various constructions of the PISA ESCS index, Nonoyama-Tarumi (2008) found that home wealth-related possessions (dishwasher, cars, cellular phones) have additional predictive power for achievement over and above parent education, occupation, and home cultural possessions only in the United States and a very small set of other countries (all located in Latin America and Asia).
If the relationships between country characteristics and income achievement gaps differ from the relationships between those characteristics and SES achievement gaps, it points to the importance of material, and not only cultural, resources. Private schooling is perhaps the clearest example of the importance of material resources if private schools charge tuition that low-income families cannot afford. Material resources may also be particularly important in systems with decentralized funding, where schools in low-income regions or neighborhoods tend to have inadequate resources. Income segregation between schools and policies that facilitate segregation, such as tracking and school choice, can also allow for differentiation of educational resources between high- and low-income schools.
Data and Sample of Countries
Sample of Countries
We use data from the 2001 PIRLS and the 2006, 2009, and 2012 PISA studies. PIRLS tested fourth-grade students in reading and administered a background survey to their parents. PISA tested 15-year-old students in reading, math, and science, and a small set of participating countries administered parent surveys. Not all countries administered the household income item in the parent surveys. Income responses are available for 22 countries for PIRLS 2001, 15 countries for PISA 2006, 14 countries for PISA 2009, and 10 countries for PISA 2012. We limit our sample to wealthy OECD member countries (defined as those with GDPs per capita of at least $20,000). 1 This is consistent with the prior research on socioeconomic achievement gaps reviewed above, which has typically focused on developed countries. Additionally, data for country characteristics used in models were unavailable for many non-OECD members, as many of them were obtained from OECD publications. Furthermore, household income data were often low quality in these countries, leading to unreliable estimates of income achievement gaps. We also excluded two countries that met other sample criteria; we excluded the Czech Republic because its income achievement gaps were estimated with very large standard errors, and we excluded Chile because, as a recent addition to the OECD, it did not have available data for centralized exams. 2 About 4,000 students were sampled in each PIRLS country and about 4,500 in each PISA country, and after exclusions, this resulted in a total sample size of 48,074 students in 12 countries for PIRLS 2001, 3 38,434 students in eight countries for PISA 2006, 4 36,355 students in seven countries for PISA 2009, 5 and 25,443 students in five countries for PISA 2012. 6 Table 1 lists the countries in our sample.
Income Data Availability in Sample Countries, PIRLS 2001, PISA 2006, 2009, and 2012

Note. PIRLS = Progress in International Reading Literacy Study; PISA = Programme for International Student Assessment.
The Czech Republic was excluded for unreliable income data. Its 90/10 income achievement gap was estimated with a very large standard error, resulting in a confidence interval for the gap ranging from 2 standard deviations to less than 0.
In both PISA and PIRLS, parents reported annual household income before taxes in six categories based on country currencies. In PISA, the categories were equivalent to (a) less than 0.5 times median income, (b) 0.5 times median or more but less than 0.75 times median income, (c) 0.75 times median or more but less than median income, (d) median or more but less than 1.25 times median income, (e) 1.25 times median or more but less than 1.5 times median income, and (f) 1.5 times median income or more. 7 In PIRLS, the categories were not explicitly defined in terms of national medians; category income ranges in national currency are reported in a supplement to the PIRLS 2001 User Guide (Gonzalez & Kennedy, 2003). In many countries, a moderately large amount of income data was missing because parents either did not complete the background survey or did not respond to the household income item. The percentage of missing income data for each country is reported in Table 1. We imputed missing data for each country using multiple imputation, using the iterated chained equations method. The results of all analyses reported below use imputed data, and all standard errors reflect uncertainty due to imputation.
We examine PIRLS reading scores and PISA reading, math, and science achievement scores. PIRLS reading score was based on performance on an International Association for the Evaluation of Educational Achievement–developed assessment of reading literacy that requires students to retrieve information, make inferences, interpret, and evaluate texts that are literary or informational (Campbell, Kelly, Mullis, Martin, & Sainsbury, 2001). PISA reading score was based on performance on an OECD-developed assessment of reading literacy that requires students to retrieve information and interpret, reflect on, and evaluate texts that are literary, expository, and practical (e.g., charts, forms, and advertisements; OECD, 2006, 2009b, 2013). PISA 2009 and 2012 also included electronic texts (OECD, 2009b, 2013). PISA math score was based on performance on an OECD-developed assessment of mathematical literacy in the areas of quantity, space and shape, change and relationships, and uncertainty (OECD, 2006, 2009b, 2013). PISA science score was based on performance on an OECD-developed assessment of science literacy in the areas of physical systems, living systems, earth and space systems, and technology systems (OECD, 2006, 2009b, 2013).
Because the United States did not participate in the parent income survey in PISA, we estimate the income achievement gap using data from the Early Childhood Longitudinal Study–Kindergarten Cohort (ECLS-K). ECLS-K tested a nationally representative sample of U.S. third graders in reading and math in 2002 and again when they were eighth graders in 2007. The ECLS-K sample is therefore roughly the same birth cohort as the PIRLS and PISA 2006 and 2009 cohorts.
Measuring Income Achievement Gaps
We estimate the income achievement gap using the methods described in Reardon (2011; see Table A2 in the appendix). In brief, this method requires (1) standardizing test scores within each country, (2) estimating the mean standardized test score of students in each family income category within a country, (3) assigning each student an income percentile that corresponds to the middle percentile of his or her income category, (4) fitting a cubic function via weighted least squares (with an adjustment to account for nonlinearity) that describes the association between test scores and family income percentile, (5) using the fitted curve to estimate the difference in average test scores between students at the 90th and 10th percentiles of the income distribution, (6) using the estimated variance-covariance matrix of the estimates to compute a standard error for this difference, and (7) adjusting the estimated gaps to account for measurement error in the test scores and measurement error in family income. 8 These methods allow us to compute the average difference in test scores between students at the 90th and 10th percentiles of the household income distribution within their respective country and cohort (the 90/10 income achievement gap) as well as the standard error of this estimated gap. We also compute the 90/50 and 50/10 income achievement gaps (by repeating Steps 5 through 7 above using the appropriate percentiles) to allow us to investigate whether income is more strongly related to achievement at the high or low end of the income distribution. We compute these gap estimates and standard errors for each test subject in each country and year in which household income data are available (19 countries, 32 country-by-year estimates, 72 country-by-year-by-subject estimates. Adding the U.S. data, this becomes 20 countries, 34 country-by-year estimates, 75 country-by-year-by-subject estimates).
Measures of National Characteristics
We construct a set of four primary indices of national characteristics: (a) poverty/inequality, (b) social welfare policies, (c) parental support, and (d) educational differentiation; and obtain a fifth measure, for curricular standardization, from the literature.
Poverty/inequality index
This index measures the level of socioeconomic inequality in a country. It is constructed as the first principal component of the Gini index of income inequality, the child poverty rate, the level of between-school income segregation, the low-birthweight rate, and the adolescent fertility rate (eigenvalue 2.90; explains 58% of the variance of the five items). We initially considered including the income segregation measure in the index of educational differentiation (described below), but it loaded much more strongly on the poverty/inequality dimension, likely because it is correlated with residential segregation, which is driven in part by income inequality (Reardon & Bischoff, 2011). The index is standardized to have a mean of 0 and a standard deviation of 1 among the 20 countries in our sample.
We obtain Gini coefficients for most countries from the Luxembourg Income Study (2009), supplemented by the World Bank Factbook (World Bank, 2012) and the OECD (2011a), and we interpolated missing years and then averaged over the years from birth to the test year. The percentage of children under 18 in poverty was measured in 1995 and 2008 and was obtained from the OECD Family Database (OECD, 2011b); we interpolated between these years and then averaged over the years up until each cohort was tested. The percentage of low-birthweight births and the adolescent fertility rate (births per 1,000 women ages 15 to 19) were obtained for the birth year of each cohort from the World Bank Factbook (World Bank, 2012). We compute income segregation as the segregation between students from families with above-median income (within their country) and students from families with below-median income. To compute this, we use methods similar to those described in Reardon and Bischoff (2011), estimating the segregation at each ordinal income category threshold and then interpolating (using a quadratic function fitted via weighted least squares) to estimate the segregation between above- and below-median income students. 9 We compute U.S. income segregation for primary school from ECLS-K data from the kindergarten wave, as students may have changed schools by third grade, when we estimate income achievement gaps. We compute U.S. secondary school segregation from the Education Longitudinal Study, which has income data for a nationally representative sample of 10th-grade students in 2002.
Social welfare policy index
This index measures social welfare spending in a country. It is constructed as the first principal component of public health expenditures, public spending on family benefits in cash, public spending on family benefits in services, and preprimary school enrollment rates (eigenvalue 2.06; explains 52% of the variance of the four items). Public spending on family benefits in cash and in services consisted of support exclusively for families (e.g., child payments and allowances, parental leave, and childcare) in 2007 as percentages of GDP, obtained from the OECD Family Database (OECD, 2011b). The percentage of the age cohort enrolled in preprimary education (gross) was averaged for the years from birth to age 5 for each cohort and was obtained from the World Bank Factbook (World Bank, 2012). Public health expenditure as a percentage of total health expenditure was averaged over the years from birth to testing for each cohort and was obtained from the World Bank Factbook (World Bank, 2012). We considered including per-pupil expenditures on primary and secondary school in the index, but this item was not correlated with the other measures or the constructed index (r = −0.1). The index is standardized to have a mean of 0 and a standard deviation of 1 among the 20 countries in our sample.
Parental support index
This index measures (albeit crudely) the extent to which a country requires paid parental leave following the birth of a child. We would like a more general measure of early childhood support—an index that would measure social policies that support families with young children and that provide educational opportunities for young children—reasoning that countries with stronger early childhood support policies would have smaller income achievement gaps because more children would have parents at home during infancy and more educational opportunities prior to enrolling in primary school. However, the only policy measures we were able to obtain were measures of parental leave policy. This index is constructed as the first principal component of the maximum number of weeks of leave for mothers (maternity leave plus parental or prolonged leave), the number of weeks of paternity leave for fathers (including parental or prolonged leave), the paid-leave full-rate equivalent pay for mothers (weeks of leave multiplied by rate of wage replacement), and the paid-leave full-rate equivalent for fathers (eigenvalue 2.27; explains 57% of the variance of the four items). All parental leave measures used in the parental support index are from 2007 or 2008 and were obtained from the OECD Family Database (OECD, 2011b). We considered including preprimary enrollment rates in this factor, but that item loaded much more heavily on the social welfare policy index and so was included in that factor. The index is standardized to have a mean of 0 and a standard deviation of 1 among the 20 countries in our sample.
Educational differentiation index
This index measures the extent to which the educational system is structured to provide highly differentiated learning environments for students. We reason that a more differentiated system—one with high levels of tracking and a large private school sector—may lead to greater stratification of students both between and within schools. If this stratification is associated with family socioeconomic background (as it generally is), more differentiation may contribute to widening academic achievement disparities.
The index is constructed as the first principal component of the proportion of students in private schools, the proportion of secondary school students in vocational tracks, the number of distinct tracks in secondary school, and the age at which students are first tracked (with lower ages implying greater differentiation; eigenvalue 2.50; explains 63% of the variance of the four items). Age of track selection and the number of tracks were taken from the PISA 2009 international report (OECD, 2010b). The percentage of secondary school students in the vocational track and the percentage of students enrolled in privately managed schools were obtained from the World Bank Factbook (World Bank, 2012). We used values for the year in which students were tested; for private schooling, we used primary school values for PIRLS and secondary school values for PISA. We considered including the between-school income segregation in this factor, but it loaded weakly on this factor and much more strongly with the poverty/inequality items above. The index is standardized to have a mean of 0 and a standard deviation of 1 among the 20 countries in our sample.
Curricular standardization
We use the existence of curriculum-based external exit exams in secondary school as a proxy for curricular standardization. This measure was first created by Bishop (1997) for the 39 countries that participated in TIMSS 1995 using comparative education studies and encyclopedias and interviews with embassy personnel to classify systems according to his five criteria that we summarize in the previous section. The measure is primarily dichotomous, as he classified most countries as either having (1) or not having (0) centralized exams, but a small number of countries with state or provincially based education systems were assigned decimal values reflecting the proportion of students in regions subject to centralized exams. This measure has since been updated for 2003 data by Wößmann, Lüdemann, Schütz, and West (2009) and for 2009 data by Bol et al. (2014). We use the values from Wößmann et al. (2009), which pertain separately to secondary school math exams and science exams, and take the value for Slovenia (which was missing from Wößmann et al., 2009) from Bol et al. All other values are identical to those from Bol et al. for the countries in our sample. Following prior literature, to create a country-level measure of curricular standardization across all subjects and grade levels, we take the average of the math exam and science exam indicators and apply these values at both the primary and secondary levels. We standardize this measure to have a mean of 0 and a standard deviation of 1 among the 20 countries in our sample.
Table 2 reports the bivariate correlations among the four indices we constructed and the centralized exams measure. Note that the educational differentiation index and centralized exams are only weakly correlated with one another and with the parental support index but are moderately positively correlated with the social welfare policy index and moderately negatively correlated with the poverty/inequality index. The parental support index is moderately correlated with the social welfare policy index and with the poverty/inequality index. The social welfare policy and poverty/inequality indices are moderately negatively correlated with one another. The fact that most of these correlations are relatively low suggests that multicollinearity is not a concern when including them together in regression models.
Correlation Matrix of Constructed Educational and Social Indexes

Note. Degrees of freedom for all correlations = 18.
p < .05. **p < .01. ***p < .001.
Analysis
We are interested first in describing the magnitude and variation in the size of the income achievement gap across countries. Because the gaps are estimated with error, we use a random-effect model to estimate the mean and variance of the true gaps. Specifically, we fit the model

where Ĝ ci is the estimated gap in country c in study-year-subject i (we have multiple observations within a country because some countries are observed in multiple years and because multiple tests are given each year in the PISA countries), µ is the mean of the true gaps, τ is the between-country variance of the true gaps, σ2 is the true within-country variance of the gaps (between studies, subjects, and years), and ω ci = var(Ĝ ci ) is the sampling variance of Ĝ ci , which we compute using the squared standard error of Ĝ ci . Fitting this model via maximum likelihood produces estimates of µ and τ, the mean and variance of the income achievement gaps across countries.
We are next interested in the association between a set of country-level characteristics and the size of the income achievement gap. For this we fit models of the form

where
The relatively small number of countries (20 countries; 75 total observations) limits the number of covariates that can be included in the vector
Results
Comparing Income Achievement Gaps Across Countries
Figure 1 shows the estimated income reading 90/10 achievement gaps for each of the countries in our sample, and Table A1 in the appendix reports estimated 90/10, 90/50, and 50/10 gaps for all subjects.
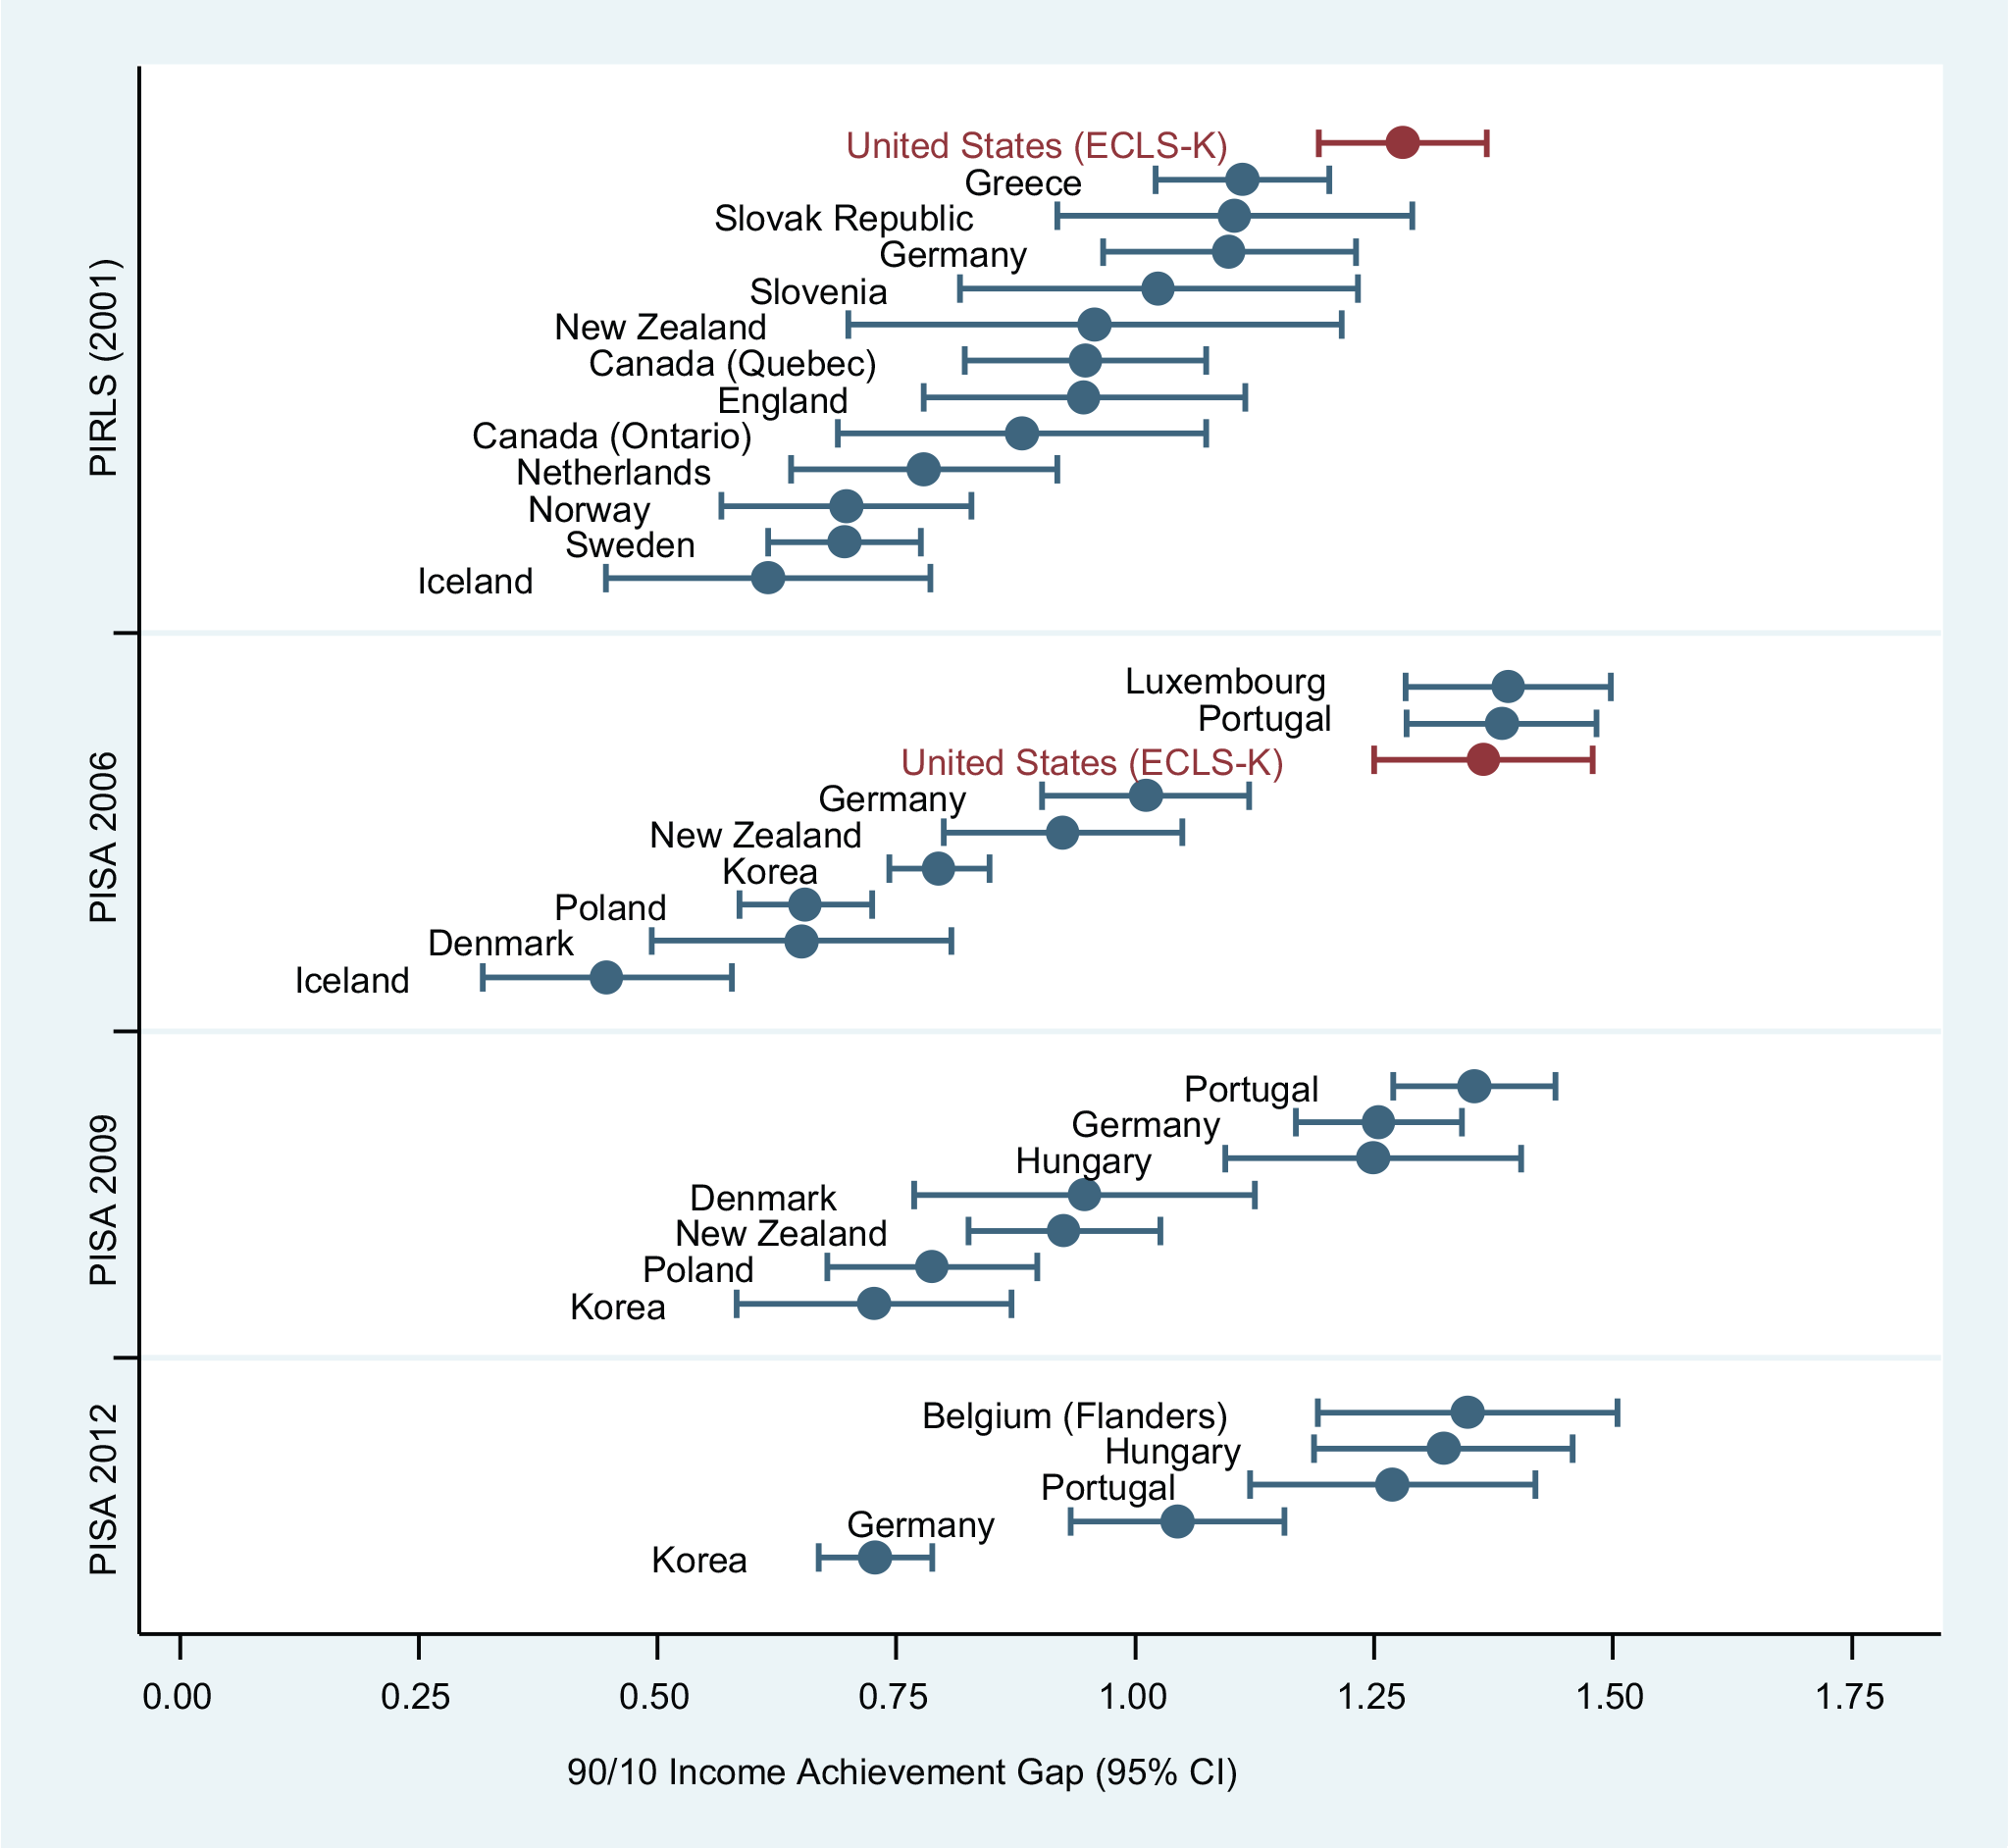
Estimated 90/10 income achievement gaps, reading, Progress in International Reading Literacy Study and Programme for International Student Assessment.
The 90/10 income achievement gaps for reading average around 1.0 standard deviation. Notably, the size of the gaps varies substantially across the countries in our sample, ranging from 1.39 standard deviations in Luxembourg in 2006 to 0.45 standard deviations in Iceland in 2006. With gaps of 1.28 standard deviations in elementary school and 1.36 standard deviations in high school, the United States ranks among the highest in the distribution of the size of income achievement gaps across countries. Gaps in the United States are comparable in size to those of Luxembourg, Portugal, Belgium (Flanders), and Hungary. The income achievement gaps also vary somewhat by test subject. Although the correlation between gaps in different test subjects is over 0.9 in every wave of PISA, average gaps are roughly 5% to 10% larger for the math tests than the reading and science tests, a finding consistent with the evidence on the size of the math and reading income achievement gaps in the United States (Reardon, 2011). The mean 90/50 income achievement gaps average around 0.58 standard deviations, while the mean 50/10 gaps average around 0.47 standard deviations. The slightly larger 90/50 gaps are also consistent with Reardon’s (2011) finding that the 90/50 gaps in the United States are approximately 10% larger than the 50/10 gaps. Table A2 in the appendix reports the estimated means and standard deviations of the income achievement gaps across the countries in our sample.
The estimated gaps for PIRLS tend to be somewhat smaller than those for PISA for the 90/10, 90/50, and 50/10 gaps. However, this may be an artifact of our samples of countries for each study. There are very few overlapping countries across PIRLS and PISA; the only three countries in our sample for which we have data for both studies are Germany, Iceland, and New Zealand. In these three countries, the relative size of the PIRLS and PISA income gaps are inconsistent: In Germany, the PISA 2009 gap is larger than the gaps from PIRLS, PISA 2006, and PISA 2012; in Iceland, the gap is smaller in PISA 2006 than in PIRLS; and in New Zealand, the gaps are the roughly the same in PIRLS, PISA 2006, and PISA 2009. In general, there is no evidence of a strong trend in the size of the gaps across the three countries for which we have both PIRLS and PISA estimates.
Bivariate Associations Between Income Gaps and Country Characteristics
Before turning to our model-based estimates, we present a set of descriptive figures showing the bivariate associations between income achievement gaps and country characteristics. Figures 2 through 6 plot the 90/10 income achievement gaps in each country against the four indices we constructed—poverty/inequality, social welfare policy, parental support, and educational differentiation—as well as our measure of curricular standardization based on centralized exams. To make each figure, we pooled the estimated 90/10 gaps in all available subjects from PIRLS and PISA within each country to construct a single precision-weighted estimate of the gap in each country. For those indices that are time varying, we averaged the index across years to get an average index for each country. In each figure, the size of the circle indicates the precision of the 90/10 gap estimate, with the larger circles indicating the most precisely estimated gaps.

Association between income achievement gap and poverty/inequality index, wealthy Organisation for Economic Co-operation and Development countries, 2001 to 2012 (pooled Progress in International Reading Literacy Study and Programme for International Student Assessment data).

Association between income achievement gap and parental support index, wealthy Organisation for Economic Co-operation and Development countries, 2001 to 2012 (pooled Progress in International Reading Literacy Study and Programme for International Student Assessment data).

Association between income achievement gap and social welfare index, wealthy Organisation for Economic Co-operation and Development countries, 2001 to 2012 (pooled Progress in International Reading Literacy Study and Programme for International Student Assessment data).

Association between income achievement gap and differentiation index, wealthy Organisation for Economic Co-operation and Development countries, 2001 to 2012 (pooled Progress in International Reading Literacy Study and Programme for International Student Assessment data).

Association between income achievement gap and centralized exams, wealthy Organisation for Economic Co-operation and Development countries, 2001 to 2012 (pooled Progress in International Reading Literacy Study and Programme for International Student Assessment data).
Each of Figures 2 to 6 includes three fitted lines. The thick solid line is the precision-weighted regression line through the 20 data points. Because the United States has extreme values of some of the indices (particularly, the poverty/inequality and social welfare policy indices) and because the achievement gap data for the United States come from the ECLS-K data rather than PISA and PIRLS, we also fit precision-weighted regression lines that exclude the United States in order to examine whether the fitted lines are heavily influenced by the presence of the United States in the sample. The estimates based on these regressions are shown as thinner solid lines in each figure. Finally, we also include a fitted line based on an unweighted regression to examine the sensitivity of our estimates to the precision weights. In most cases, the fitted lines are relatively insensitive to whether the United States is in the sample and to whether we use precision weights or not.
In general, all of the associations with the country characteristics are in the expected directions. The 90/10 gaps are most strongly associated with the poverty/inequality index, r(18) = .64, p = .002, and centralized exams, r(18) = −.64, p = .002, and are least strongly associated with the social welfare policy index, r(18) = −.30, p = .19; the educational differentiation index, r(18) = .25, p = .28; and the parental support index, r(18) = −.21, p = .37. Figures for the five separate components of the poverty/inequality index (income inequality, income segregation, child poverty rate, low-birthweight rate, and teenage birth rate) are presented in Appendix Tables A1 through A5.
Multivariate Associations Between Income Gaps and National Characteristics
Table 3 presents the results of fitting various versions of Equation (2) above to predict the 90/10 income achievement gap. We begin with a null model (Model 0), which includes only a set of dummy variables indicating which study, year, and subject was tested. 10 In this model—which, by construction, explains none of the between-country variance in gaps—the between-country variance of achievement gaps in our sample is .065 (corresponding to a standard deviation of 0.25). In Model 1, we include the four indices and centralized exams in the model. Recall that the indices are standardized, so the coefficients can be interpreted as the difference in the size of the 90/10 income achievement gap associated with a 1-standard-deviation difference in the index, conditional on the other variables in the model.
Estimated Multivariate Associations of Country Characteristics With 90/10 Income Achievement Gap
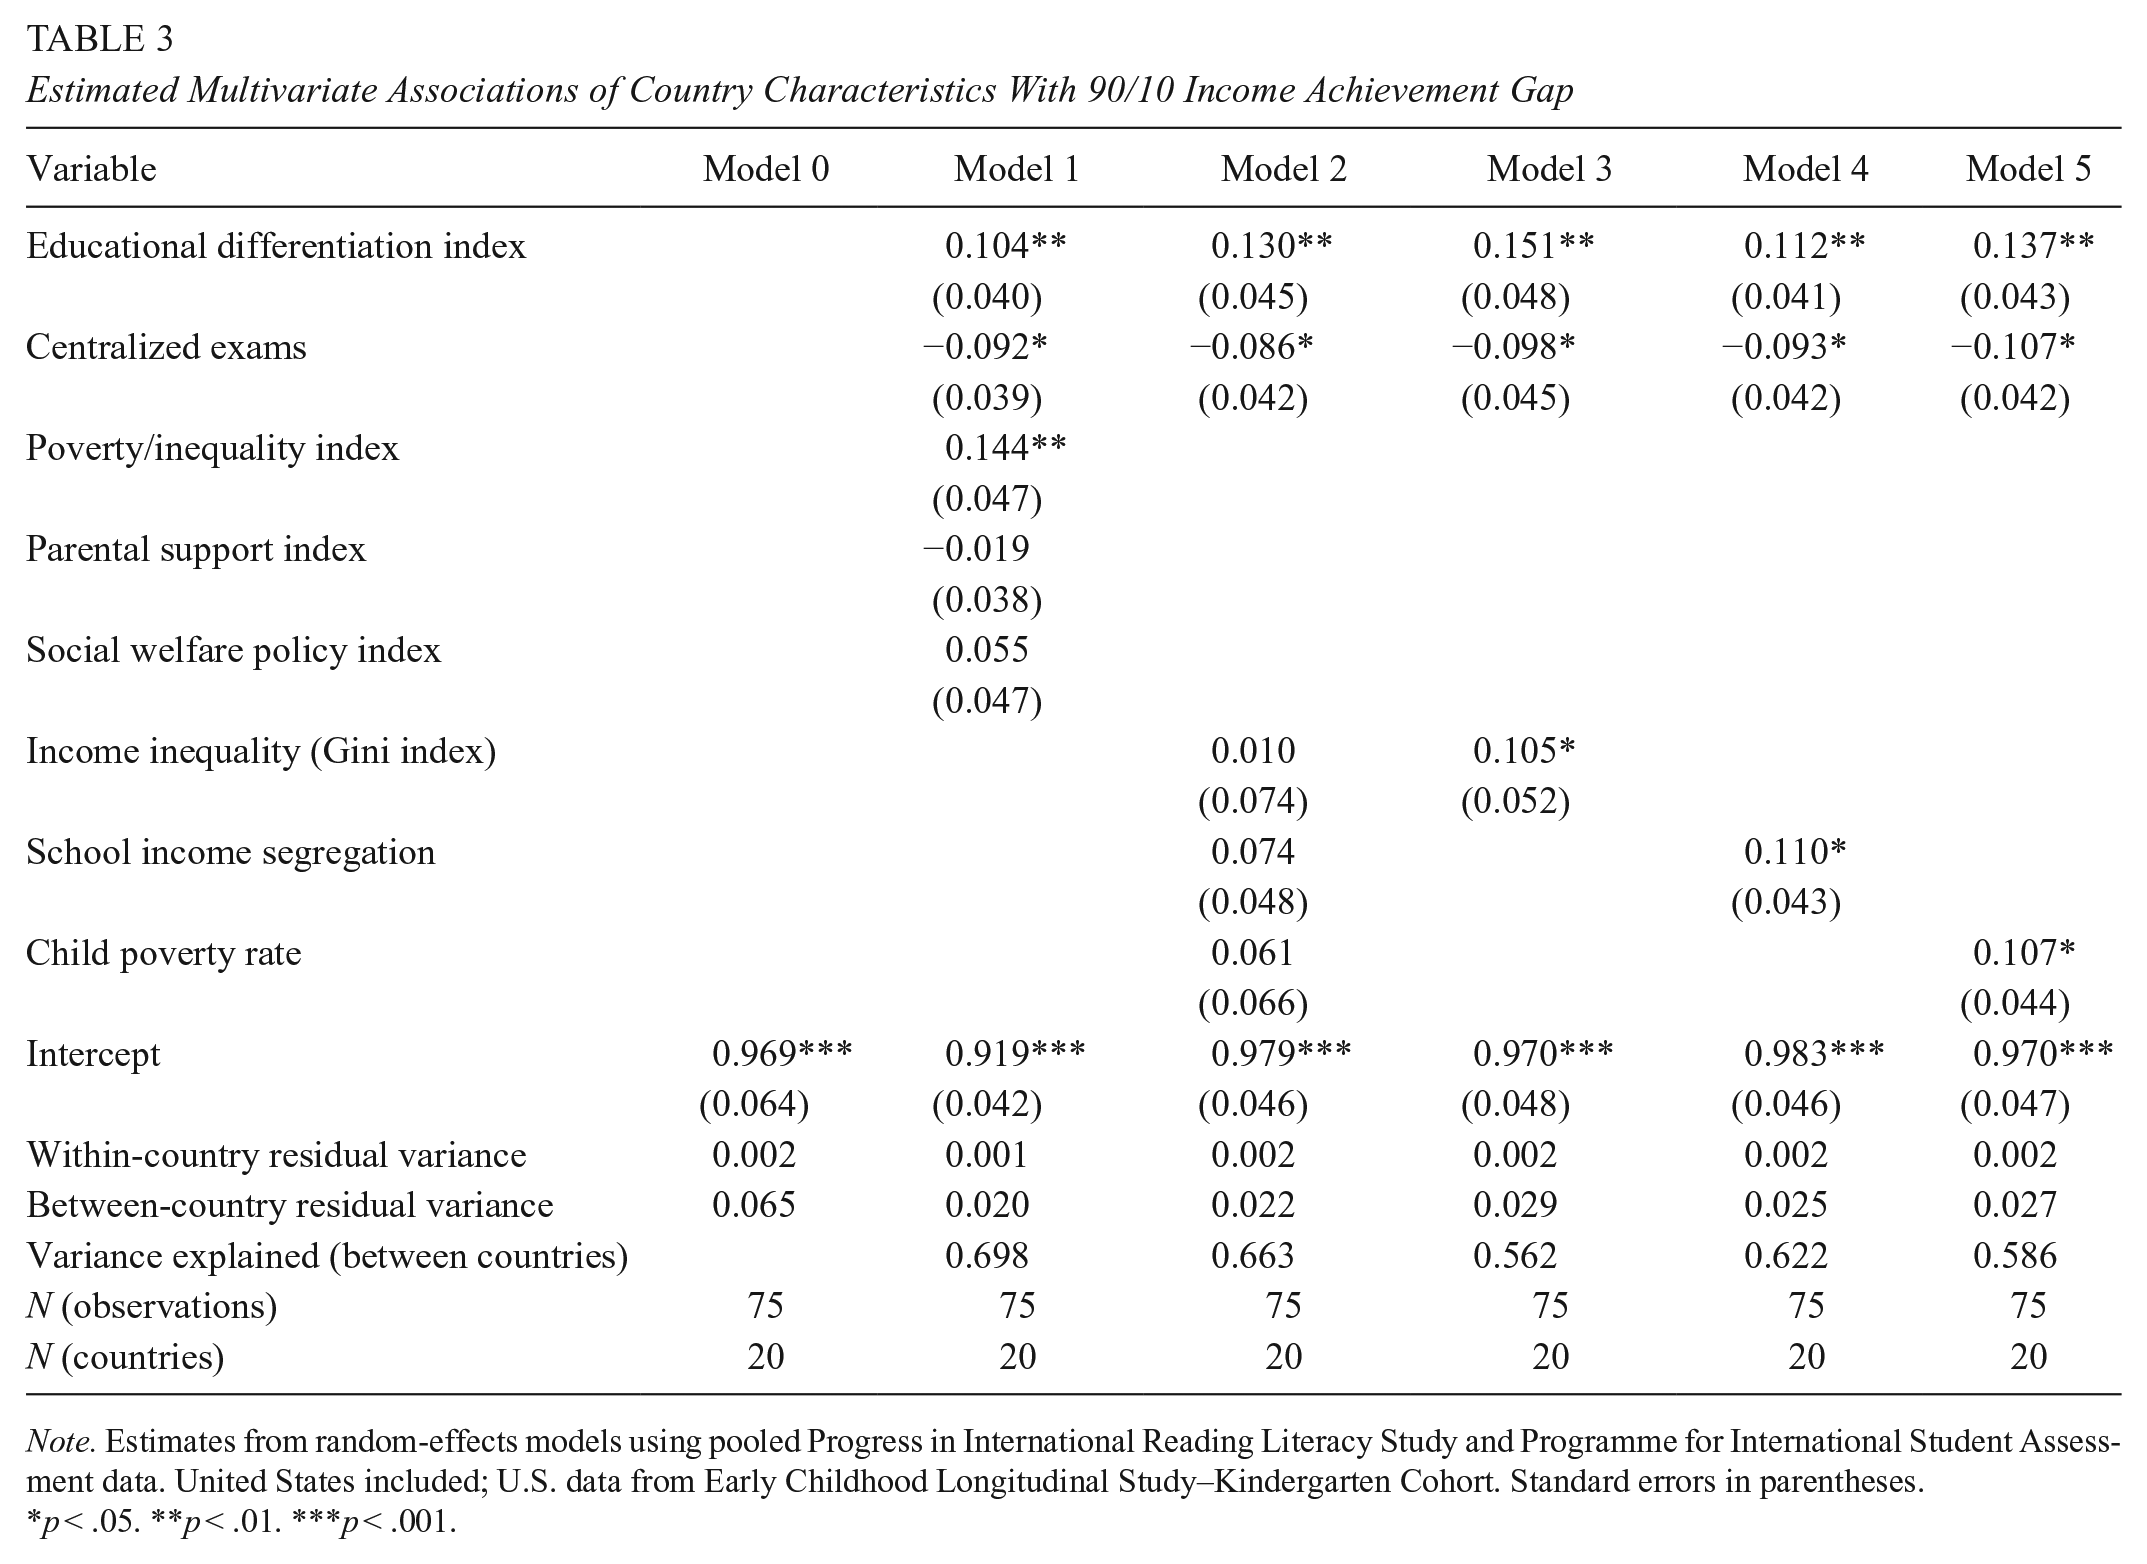
Note. Estimates from random-effects models using pooled Progress in International Reading Literacy Study and Programme for International Student Assessment data. United States included; U.S. data from Early Childhood Longitudinal Study–Kindergarten Cohort. Standard errors in parentheses.
p < .05. **p < .01. ***p < .001.
Income achievement gaps are larger in countries with higher degrees of educational differentiation and smaller in countries with centralized exams, as predicted. The poverty/inequality index is very strongly associated with the 90/10 achievement gap, whereas the social welfare policy and parental support indices are not significantly associated with achievement gaps, conditional on the poverty/inequality level. Based on this finding, we drop the social welfare policy and parental support indices from subsequent models. Model 2 then replaces the poverty/inequality index with three of its component items (Gini index, school income segregation, and the child poverty rate). 11 For ease of interpretation, we divide these variables by their standard deviation in the sample of 20 countries so that the coefficients can be compared to those of the four indices and centralized exams. With all three component variables in the model, none is significantly associated with achievement gaps. Because child poverty and the Gini index of income inequality are highly correlated, r(18) = .80, p < .001, their associations with income achievement gaps are difficult to separate, and including both in the model leads to inflated standard errors on both coefficients. Income segregation is also quite highly correlated with both child poverty and income inequality, r(18) = .59, p = .006, and r(18) = .56, p = .01, respectively. In Models 3 through 5, then, we enter each of the three variables separately and find that each of them is significantly associated with the income achievement gap when the others are not in the model. Educational differentiation remains strongly associated with income achievement gaps in all models, and centralized exams remain strongly negatively associated with gaps in all models. Overall, Models 3 through 5 yield results consistent with our expectations. As we predicted, income achievement gaps are larger in countries with higher levels of income inequality and child poverty, in countries with higher levels of income segregation, and in countries with higher levels of educational differentiation and are smaller in countries with centralized exams. 12 Of the five models explored, Model 1 fits the data best, explaining 70% of the variance in achievement gaps across countries.
We fit the same set of models to predict both the 90/50 and 50/10 income achievement gaps (Model 1 for all three types of gaps is presented in Table 4). In many ways, the results are quite consistent with the models predicting the 90/10 gaps, albeit with several interesting differences. First, educational differentiation is associated with significantly larger 50/10 gaps but not 90/50 gaps, which suggests that low-income students may be more likely than middle- and high-income students to be placed in the low track. Second, centralized exams are associated with significantly smaller 90/50 gaps but not 50/10 gaps, which suggests that standardization may be particularly beneficial to middle-income students (or detrimental to high-income students, although prior literature has mostly found that centralized exams are associated with higher average achievement [Fuchs & Woessmann, 2007], a finding that we do not test here). Third, the poverty/inequality index is associated with significantly larger 50/10 gaps but not 90/50 gaps. We also ran models entering income inequality, income segregation, and child poverty separately (not shown). Note that in these models, we use segregation of high-income students (above the 75th percentile) to predict 90/50 gaps and segregation of low-income students (below the 25th percentile) to predict 50/10 gaps. Both income inequality and child poverty significantly predict 50/10 gaps, whereas only income segregation significantly predicts 90/50 gaps. The differing results for child poverty are consistent with what we might expect, as it is plausible that child poverty most strongly affects gaps at the bottom of the income distribution (the 50/10 gap). However, the differing results for income segregation and income inequality were unexpected.
Estimated Multivariate Associations of Country Characteristics With 90/10, 90/50, and 50/10 Income Achievement Gaps

Note. Estimates from random-effects models using pooled Progress in International Reading Literacy Study and Programme for International Student Assessment data. United States included; U.S. data from Early Childhood Longitudinal Study–Kindergarten Cohort. Standard errors in parentheses.
p < .05. **p < .01. ***p < .001.
Finally, we ran two additional sets of analyses to confirm the robustness of our results. First, because we are concerned that our results may be influenced by the presence of the United States in the sample (recall that the test scores for the United States are based on ECLS-K rather than PISA and PIRLS and that some of the measures of U.S. characteristics, like school income segregation, are taken from different sources than in the other countries), we reran all the analyses in Tables 3 and 4 excluding the United States. The pattern of results (the magnitude and direction of signs as well as statistical significance) is largely unchanged with the United States excluded from the sample (results not shown). Last, because we are concerned that our results may be influenced by the restricted sample of 20 countries with available income data, we also computed gaps for the full population of OECD member countries. As household income data were unavailable in these additional countries, we computed gaps based on two other SES variables: highest parent educational attainment (available in both PISA and PIRLS) and ESCS (available only in PISA). Multivariate models predicting parent education gaps for the original restricted sample are presented in Appendix Table A3, and models predicting parent education and ESCS gaps for the full OECD population are presented in Tables A4 and A5 (ESCS models cannot be run for the restricted sample, as ESCS is unavailable in PIRLS). Results differ very little between the restricted sample and the full OECD population, but compared to the models predicting income gaps, the associations with income inequality (Gini coefficient) and educational standardization (centralized exams) are weaker and generally nonsignificant. Thus, we tentatively conclude that the restricted sample does not bias our results extremely and that differences between our results for income and those previously published using other SES measures may be due to substantive differences in the relationship between family income versus other family socioeconomic characteristics and student achievement. These findings are discussed in further detail below.
Discussion
There is considerable variation across our sample of OECD countries in the strength of the association between family income and academic achievement, but the size of the gap is only modestly associated with national income inequality. The achievement gap between high- and low-income students is, on average, about 1.0 standard deviation, but this varies widely across countries. The income achievement gap in our sample of countries is largest in Portugal, Luxembourg, the United States, Belgium (Flanders), and Hungary. Some of these countries, notably, the United States and Portugal, have very high levels of income inequality; others, such as Luxembourg and Belgium (Flanders), however, have moderately low levels of income inequality. The countries with the smallest income achievement gaps are Iceland, Norway, Sweden, Poland, and Denmark, most of which are Scandinavian countries with low levels of inequality. Poland, however, has both moderately high income inequality and low income achievement gaps. Our calculations of international income achievement gaps provide some valuable context for the findings on the U.S. income achievement gaps. The U.S. income gap is quite large, particularly at the primary school level, where it is larger than all of those that we estimated for PIRLS.
The second part of our analysis here focuses on investigating whether and how the income achievement gap is associated with a set of country characteristics, including poverty rates and inequality, social welfare policy, parental support policy, educational differentiation, and curricular standardization. Although evidence of cross-national associations between national characteristics and academic achievement gaps in cross-sectional data is certainly not sufficient to identify the extent to which the gaps are caused by the factors we investigate, evidence of associations is suggestive and may help guide theory and future research.
In exploring these associations, we hypothesized that countries with higher income inequality would have larger income achievement gaps. We found a modest positive association between the two in bivariate analyses, and this association remained evident when we included other covariates in a multivariate model. Prior studies have found no clear association between socioeconomic achievement gaps and measures of economic inequality, and our supplementary analyses for SES gaps (reported in Tables A3 through A5) also find no significant association with income inequality. That we find such an association when predicting income achievement gaps suggests that in countries with high income inequality, income may be particularly salient in shaping students’ educational opportunities (compared to other measures of family SES, such as parental education and occupational status). This finding is consistent with a story by which income inequality leads to wider income achievement disparities largely through its effects on income segregation and child poverty rates. Our finding that both income inequality and child poverty are more strongly related to 50/10 than to 90/50 gaps points to the negative consequences of poverty for educational opportunity.
One consistent pattern in all of our analyses is that the extent to which students are segregated among schools by income is strongly related to the magnitude of achievement gaps. This finding is evident in our univariate analyses and in all of our multivariate models predicting 90/10 gaps. Moreover, this finding persists even after controlling for the income inequality, child poverty rates, the differentiation of the schooling system (which includes measures of tracking and private school enrollment rates), and the standardization of the schooling system. Notably, the pattern persists even after the United States is excluded from the sample, an important finding, given that its income segregation measure is very high relative to the other OECD countries.
Although the strong association of income segregation and the income achievement gap is clear, the mechanisms that produce this association are not. Because residential segregation and school segregation are generally correlated, it is not clear how much to think of this association as reflecting school segregation (and inequalities in school quality associated with segregation) or residential segregation (and inequalities in environment and opportunities associated with residential segregation). The finding that, after controlling for other country characteristics, the segregation of high-income students significantly predicts 90/50 gaps, whereas the segregation of low-income students does not significantly predict 50/10 gaps, suggests that 50/10 gaps are better accounted for by poverty, inequality, and educational differentiation.
In addition to examining income inequality per se, we also explored the association of income achievement gaps with other aspects of social inequality, including social welfare policy, parental support policy, and other measures of childhood disadvantage, such as low-birthweight rates and teenage childbearing rates. In general, each of these was associated with achievement gaps in the predicted direction, but most were not strongly associated with achievement gaps after controlling for other factors. We are not confident, however, that the social welfare policy and parental support indices were sufficiently well defined to capture the true relationship of social policies to income achievement gaps. With only 20 countries, a poorly measured construct may not yield particularly reliable estimates of these associations.
Finally, we explored the association of income achievement gaps to two features of national education systems—structural differentiation and curricular standardization. Differentiation was positively associated with income achievement gaps, regardless of what other variables were in the model, suggesting that tracking regimes and private school enrollment may operate to exacerbate income achievement disparities. Our finding that differentiation is more strongly associated with 50/10 gaps than with 90/50 gaps is consistent with the possibility that tracking may be particularly harmful to low-income students. In all of the countries in our sample, the academic track comprises the majority of students rather than an elite few. Thus, if tracking results in a disproportionate share of low-income students being placed in lower-quality schooling, it may exacerbate achievement gaps between low-income students and their middle- and high-income peers.
Curricular standardization, indicated by the use of centralized examinations, was consistently negatively and significantly associated with income achievement gaps, in line with the hypothesis that standardization promotes greater homogeneity of quality across schools. Previous research has found inconsistent results for the association between socioeconomic achievement gaps and centralized exams, and our supplementary analyses for SES gaps (reported in Tables A3 through A5) also find no significant association with centralized exams. The strong and significant negative association for income gaps may indicate that in countries with low levels of curricular standardization, school quality is more strongly related to income than to SES more broadly. Moreover, our finding that standardization significantly predicts smaller 90/50 gaps but does not predict 50/10 gaps suggests that greater variation in school quality may provide relative benefits to high-income students over both middle- and low-income students.
In sum, then, we find that there is a great deal of variation among wealthy countries in the extent to which children from richer and poorer households do well on standardized tests. Both this wide variation and the fact that the income achievement gap is strongly related to features of the educational system (as well as to broader social inequality and segregation) suggest that the income achievement gap is affected by social conditions and public policy decisions.
Our additional analyses of gaps based on other family socioeconomic characteristics (reported in appendix Tables A3 through A5) suggest that income achievement gaps may be substantively different from SES gaps. Unlike income gaps, SES gaps are not significantly related to income inequality or to centralized examinations. The possible finding of larger income-achievement gaps (but not larger SES-achievement gaps) in countries with higher income inequality parallels prior research finding lower income mobility (but not lower educational mobility) in countries with higher income inequality (Breen & Jonsson, 2005; Corak, 2013) and merits further research. Although we did not investigate patterns of social mobility here, our findings on cross-national differences in income achievement gaps may help to illuminate one mechanism underlying the association between income inequality and income mobility documented by Corak (2013). If school performance (as proxied by performance on standardized tests) is an important mechanism for upward mobility, then we might expect the income students ultimately attain as adults to be more strongly correlated with parental income in countries with large income achievement gaps. Clearly, more research investigating the role of educational inequality in patterns of social mobility is needed.
Because our findings are based on cross-sectional correlational patterns, they do not provide strong evidence regarding the causal processes underlying these associations. Yet they are consistent with the argument that broad societal inequality as well as features of the schooling system may play important roles in shaping patterns of educational inequality. To establish causal relationships, it would be preferable to observe how income achievement gaps change over time within countries as social and economic conditions and policies change.
Unfortunately, such a design is not currently possible with PISA and PIRLS data. Collection of household income data in international large-scale assessments is limited and declining. Income items were removed from the PIRLS parent survey after 2001, and the number of countries administering income items in the PISA survey has declined each year since 2006. This significantly limits the potential of countries to monitor trends in income achievement gaps and the potential of scholars to investigate their causes, consequences, and remedies. Because our results suggest that achievement gaps based on household income differ from gaps based on other family socioeconomic characteristics, the SES measures widely collected in studies like PIRLS and PISA may be insufficient to fully characterize socioeconomic disparities in school performance. More and better international data on household income are essential for cross-national research on educational inequality.
Footnotes
Appendix
Estimated Multivariate Associations of Country Characteristics With 90/10 ESCS Achievement Gap (Full OECD Population; All Years of PISA)

| Variable | Model 0 | Model 1 | Model 2 | Model 3 | Model 4 | Model 5 |
|---|---|---|---|---|---|---|
| Educational differentiation index | 0.094*** | 0.050 | 0.108*** | 0.044 | 0.102*** | |
| (0.022) | (0.030) | (0.032) | (0.024) | (0.028) | ||
| Centralized exams | −0.006 | 0.016 | 0.005 | 0.012 | 0.010 | |
| (0.023) | (0.024) | (0.030) | (0.023) | (0.028) | ||
| Poverty/inequality index | 0.127*** | |||||
| (0.023) | ||||||
| Parental support index | 0.026 | |||||
| (0.022) | ||||||
| Social welfare policy index | 0.046 | |||||
| (0.025) | ||||||
| Income inequality (Gini index) | −0.017 | 0.052 | ||||
| (0.045) | (0.033) | |||||
| School ESCS segregation | 0.098*** | 0.107*** | ||||
| (0.027) | (0.025) | |||||
| Child poverty rate | 0.034 | 0.062* | ||||
| (0.042) | (0.029) | |||||
| Intercept | 1.099*** | 1.103*** | 1.113*** | 1.100*** | 1.113*** | 1.099*** |
| (0.033) | (0.022) | (0.023) | (0.028) | (0.023) | (0.028) | |
| Within-country residual variance | 0.004 | 0.004 | 0.003 | 0.004 | 0.003 | 0.004 |
| Between-country residual variance | 0.030 | 0.011 | 0.014 | 0.021 | 0.014 | 0.020 |
| Variance explained (between countries) | 0.623 | 0.539 | 0.290 | 0.529 | 0.333 | |
| N (observations) | 437 | 437 | 437 | 437 | 437 | 437 |
| N (countries) | 30 | 30 | 30 | 30 | 30 | 30 |
Note. OECD = Organisation for Economic Co-operation and Development; PISA = Programme for International Student Assessment; ESCS = PISA index of economic, social, and cultural status. Estimates from random-effects models using pooled PISA (2000, 2003, 2006, 2009, 2012) data. United States included; U.S. data from PISA 2000 to 2012. Standard errors in parentheses.
p < .05. **p < .01. ***p < .001.
Authors’ Note
An earlier version of this paper was prepared for the conference “Income, Inequality, and Educational Success: New Evidence about Socioeconomic Status and Educational Outcomes,” supported by the American Educational Research Association, Stanford University, May 15 to 16, 2012.
1.
We obtain GDP per capita from the World Bank Factbook (World Bank, 2012). We use the 2012 value converted to constant 2011 international dollars using purchasing-power parity rates.
2.
We check the robustness of our results by loosening these exclusion criteria and rerunning multivariate models for as many countries as possible. Due to the large amount of missing data for country covariates, the only two countries with complete covariate data that we could include in our models are the Czech Republic and Mexico, both Organisation for Economic Co-operation and Development (OECD) member countries with low-quality income data, resulting in very large standard errors on their estimated income achievement gaps. Results for models including these two extra countries are nearly identical to our main results for the sample of 20 countries. This is unsurprising because gaps with larger standard errors contribute less in our precision-weighted models.
3.
Canada (Ontario), Canada (Quebec), England, Germany, Greece, Iceland, the Netherlands, New Zealand, Norway, the Slovak Republic, Slovenia, and Sweden.
4.
Denmark, Germany, Iceland, Korea, Luxembourg, New Zealand, Poland, and Portugal.
5.
Denmark, Germany, Hungary, Korea, New Zealand, Poland, and Portugal.
6.
Belgium (Flanders), Germany, Hungary, Korea, and Portugal.
7.
In practice, it does not appear that the income categories were always defined this way in each country in the Programme for International Student Assessment (PISA) study. If they were defined this way, then the income categories in each country would span most of the income distribution (three categories above the median income and three below), but several countries have very large proportions (sometimes close to half) of the sample with incomes reported in the highest or lowest categories. The proportions of incomes reported in the highest and lowest categories are reported for each country in ![]() .
.
8.
As described in Reardon (2011), the adjustment amounts to dividing each gap estimate (and the corresponding standard error) by
9.
We use the segregation between above- and below-median income students in the poverty/inequality index. In some of the models described later, however, we also use measures of the segregation between students from households with incomes above and below the 75th percentile and of the segregation between students from households with incomes above and below the 25th percentile.
10.
In a fully unconditional model (with no test or subject dummies), about 7% of the variance in gaps is within countries, and 93% is between countries.
11.
Based on exploratory analyses, we did not include the low-birthweight rate or the teenage childbearing rate as they were not as strongly associated with the achievement gaps as these three items.
12.
We also ran models examining the different variables composing the differentiation, parental support, and social welfare indices separately, controlling for poverty/inequality and all other indices. In the differentiation index, the variables related to tracking (especially the age of track selection and the number of tracks) are more strongly associated with gaps than was the share of private school enrollment. In the parental support index, none of the variables is strongly associated with gaps. In the social welfare policy index, the only variable strongly associated with gaps is public spending on family benefits in cash, but this association is positive rather than negative as hypothesized.
Authors
ANNA K. CHMIELEWSKI is an assistant professor of educational leadership and policy at the Ontario Institute for Studies in Education (OISE) of the University of Toronto, 252 Bloor Street West, Toronto, ON M5S1V6, Canada;
SEAN F. REARDON is the endowed professor of poverty and inequality in education and is a professor (by courtesy) of sociology at Stanford University, 520 Galvez Mall, CERAS building, Stanford, CA 94305-3084;