
Abstract
International Large-scale Student Assessments are the most prominent example of internationalization processes in education. A number of studies have analysed the policy reactions to such studies, particularly to the Organisation for Economic Co-operation and Development (OECD) Programme for International Student Assessment (PISA) study. PISA and comparable projects have also raised concerns of a feared increase of assessments and accountability procedures. So far, systematic empirical evidence that could corroborate such concerns has been scarce. In this paper, we examine the prevalence of assessment and accountability practices at secondary education level as well as changes in these practices over time. We explicitly focus on changes over time by drawing on data from PISA 2000 to PISA 2015. Analyses over time are not straightforward with PISA, as the questionnaires change between survey rounds. This leads to different coverage of specific indicators over time. We present descriptive analyses for 20 OECD countries. The results show an increasing trend for the vast majority of the generated indicators, indicating that assessments and the use of assessments for purposes of accountability increased within the larger part of the OECD during the last 15 years. Likewise, more horizontal, peer-oriented evaluation procedures focusing on organizational learning gained importance. A cluster analysis based on selected indicators of 2015 revealed that there are four distinct groups of countries, which are mainly distinguished by different levels of the prevalence of assessment, accountability and evaluation practices.
Introduction
In contemporary knowledge-based economies, the production of human capital through schooling is a crucial growth factor and a tool for adapting to external changes. The increasing importance of education as a means of productivity, along with the global norm of securing equity in education, creates an urgent demand for effectiveness and efficiency of national education policies (Kamens, 2013: 120). In search of best practices in schooling, international large-scale student assessments (ILSAs) became more and more popular during the last decades. According to Heyneman and Lee (2014), the number of international testing projects in education increased from 34 surveys between 1960 and 1989 to 152 surveys between 2000 and 2008.
Even though the first international studies of the International Association for the Evaluation of Educational Achievement have been implemented already, in the 1960s, currently the most prominent example of these testing projects is the Organisation for Economic Co-operation and Development (OECD) Programme for International Student Assessment (PISA). PISA has become a symbol for the rise of a new testing and ranking culture and is deemed to be the ‘main engine in the global accountability juggernaut’ (Meyer and Benavot, 2013: 9).
It is plausible to assume that the application and promotion of one uniform assessment across different countries and the dissemination of universal policy recommendations foster the emergence of a relatively homogenous worldwide model of education (Meyer and Ramirez, 2000). In other words, it is likely that education production processes converge and become more similar (Drezner, 2001; Jakobi and Teltemann, 2011). In fact, a growing body of literature is devoted to analysing policy reactions to PISA and other ILSAs, often with a critical stance. A number of studies show how the results of international comparisons are used during the implementation of educational reform (Breakspear, 2012; Dobbins and Martens, 2012; Egelund, 2008; Ertl, 2006; Grek, 2009; Takayama, 2008). A main focus of recent educational reform projects that is particularly promoted by PISA is the targeted use of regular assessment and test-based accountability measures in schools and education systems (Meyer and Benavot, 2013; Scheerens, 2007). The OECD’s and PISA’s focus on regular assessments as a means of quality assurance also raised serious concerns. It is feared that an increase in tests at school has negative consequences for learning (through teaching to the test, a streamlining of curricula, etc. (Lingard et al., 2013)) and might create an unproductive self-sustaining cycle: The increasing societal importance of education triggers educational reform, which in turn increases the need for testing – which again leads to reform (Baker and LeTendre, 2005). To some researchers and stakeholders, this dynamic appears as an ‘epidemic of education policy’ (Levin, 1998), a ‘tyranny of testing’ (Mansell, 2007) or a ‘testing juggernaut’ that has to be slowed down (Andrews, 2014). Some scholars identify a ‘global panopticism’ (Lingard et al., 2013) fostered by an ‘infrastructure of accountability’ (Anagnostopoulos, 2013). Yet, systematic empirical evidence that could substantiate the discourse is scarce. Further, the debate misses conceptual clarity: which kinds of testing and assessments are (potentially) ineffective and what does (the new) accountability actually involve?
In this paper, we seek to examine the prevalence of assessment and accountability practices at secondary education level as well as changes in these practices during the last 15 years. For both research questions, we explicitly focus on the changes over time by drawing on data from PISA 2000 to PISA 2015. Further, we take a closer look at changes in how PISA collects data on assessments, and accountability practices at school. We are interested in the various aspects of school evaluation which are covered in the questionnaires and in the correspondence between theoretical models of accountability and items surveyed in PISA.
The remainder of this paper is structured as follows: in the next section we provide an overview of concepts and definitions of assessments and accountability in education and summarize current trends in this area. The third section illustrates possibilities of analysing assessments and accountability practices across countries and time with data from the OECD PISA surveys. In section four, we delineate the data collection of the PISA surveys in the thematic fields of assessments and accountability. Before presenting our results based on descriptive analyses at the country level and on cluster analyses, we briefly describe the applied methods. The paper ends with a discussion and an outlook for further research.
Assessments and accountability in education – concepts and trends
The monitoring of students’ learning progress (through testing) and its evaluation through grades is a genuine feature of modern schooling. Although the terms assessment and evaluation are often used interchangeably, assessment is generally used to refer to the collection of evidence of students’ knowledge, skills and aptitudes, whereas evaluation often refers to the collection of evidence about systems, programmes, procedures and processes (Rosenkvist, 2010). Assessments can take various forms (e.g. standardized or unstandardized) and serve different purposes. A common distinction is made between summative and formative assessments. Whereas the latter refers to more interactive forms of assessing students in order to determine learning progress and learning needs and to adapt teaching strategies, the former often has ‘higher stakes’ and may serve to promote, select or certificate students. Another aspect of the purpose of assessment and evaluation is their accountability function. Accountability describes a reciprocal relationship in which one party is expected to produce a desired outcome, thereby gaining some benefit, and the other party has some capacity to affect the benefits of the performing party (Stecher and Hanser, 1992). Such a relationship requires a monitoring of the desired outcome. Ideally, this monitoring provides useful information for the parties involved on how best to act in order to produce the desired outcome (Perie et al., 2007). Traditionally, the level and unit of accountability in schools are the students, mainly for the purpose of accreditation, in order to meet the selection function of modern education systems (Parsons, 1959).
Summative assessments, however, can also be used to hold teachers and schools (and even education systems) accountable for meeting educational goals (Rosenkvist, 2010). This purpose of assessments in education has become more important during the last decade, which has seen wide transformations of educational governance. Several authors have described how decision-making processes in education have shifted from ‘idea based’, deliberative and proactive procedures, to evidence-based, reactive governance (Grek, 2013; Marttila, 2014). This shift involves the transition from ‘input oriented’ to ‘output oriented’ steering processes. Output orientation, however, involves a need for detailed information about the output (of education systems), for example, from assessment data. The change in educational governance does not only imply a change of political decision-making processes in many countries. Sahlberg and Hargreaves (2011) further enumerate standardized teaching and learning with common criteria for measurement, a focus on literacy and numeracy, and market-oriented reforms as elements of the ‘Global Education Reform Movement’ (GERM). With this thematic alignment, the GERM corresponds to what is generally referred to as the ‘New Public Management Paradigm’ (Mons, 2009). Market orientation in education involves decentralization and increased school autonomy, as well as an expansion of school choice (Teltemann and Windzio, 2018). An increased scope for decision-making at the level of schools, however, requires ensuring that standards are still met, thus test-based accountability procedures are likely to become more frequent (Hannan and Freeman, 1989; Wößmann, 2004). Further, choosing a school on a market requires information as a basis for decision-making, which means that performance indicators of schools have to be accessible (‘Monitoring’, (Figlio and Loeb, 2011)).
The different levels and purposes of accountability have been systematized in models of accountability (Rosenkvist, 2010; Stufflebeam 2001). For example, Lindberg (2013) presents a synthesis of different typologies of accountability and distinguishes between internal and external control, high and low strength of control, as well as vertical upward, vertical downward and horizontal directions of accountability, thereby generating a typology of 12 different models of accountability. Taking a more specific view on education, Scheerens et al. (2003: 6) present an overview of types of monitoring and evaluation in education. They distinguish data sources (e.g. assessment data, administrative data), functions (accountability, improvement, accreditation) and objects (e.g. system, school, student) of monitoring and evaluation in education.
Against these models, the ‘new accountability’ in education involves a shift of the levels of accountability (from student to schools and education systems) and new consequences (e.g. in terms of resource allocation or salaries) (O’Day, 2002). Further, as the new accountability has a clear focus on standards-based assessments, it can be described as a form of external (bureaucratic or hierarchical) accountability. In contrast to external, top-down accountability, internal accountability is enacted via peer review and professional standards and focuses on improving learning (Wyatt-Smith et al., 2014). However, it is an open empirical question whether both forms of accountability have become more prevalent during recent educational reform projects or whether they are competing with each other. This is one of the questions we are analysing in this paper.
Analysing assessments and accountability across countries and time
The aim of this paper is to examine changes in assessment, accountability and evaluation practices in secondary education over time and in different countries. So far, no international longitudinal survey on school assessment practices exists. However, ILSAs like the OECD PISA surveys do not only assess students’ literacy but also collect data on student background characteristics and on teaching and learning contexts. While studies like TIMSS and PIRLS are being implemented every four and five years, respectively, PISA provides indicators on a three-yearly basis. The currently available public datasets cover six cycles over the range of 15 years (2000 to 2015). For our analyses, we accordingly draw on PISA as the most frequent assessment. In the first place, PISA surveys reading, mathematics and science literacy of 15-year-old students in OECD countries and a number of partner countries. One of the aims of PISA is to relate variations in literacy to the learning context of students. Therefore, additional information is collected from students, parents and school heads (Kuger et al., 2016). The school level questionnaires, for example, survey the school’s general situation and cover aspects of assessments and evaluation in schools. The questionnaires are based on a theoretical framework developed by expert groups. The framework guides the selection of indicators in the respective rounds of assessment. Even though the frameworks of different survey rounds do build up on one another to a certain degree, they focus on different policy and research topics defined continually by the expert groups, the participating countries and the OECD secretariat (Jude, 2016).
Whereas the comparison of literacy measures over time has been a goal of PISA from the beginning, less systematic effort has been put into the comparability of background or context information collected in PISA. Consequently, the comparison of data from PISA context questionnaires is hampered by the fact that questions as well as wording and the scaling of answering categories for similar questions in PISA often change between the different survey rounds (Jude, 2016). Nevertheless, the political and scholarly interest in comparing potential determinants of literacy over time has increased during recent years. For example, after four rounds of PISA, the OECD (2009: 150) stated that ‘PISA can not only compare the trends in achievement over almost a decade for many countries, but also attempt to relate those trends to changes in policies, practices, and student populations.’ Without a detailed collection of context data and the possibility to compare these data over time, PISA would certainly not have become such a stable part of accountability for educational policy makers in participating countries. However, trend analyses of PISA data have to be handled with caution (Jerrim et al., 2017; Rutkowski and Rutkowski, 2016). This holds especially for context indicators, which are not implemented systematically over time, as shown in Table 1.
Questions and items on assessments and accountability in the Programme for International Student Assessment.
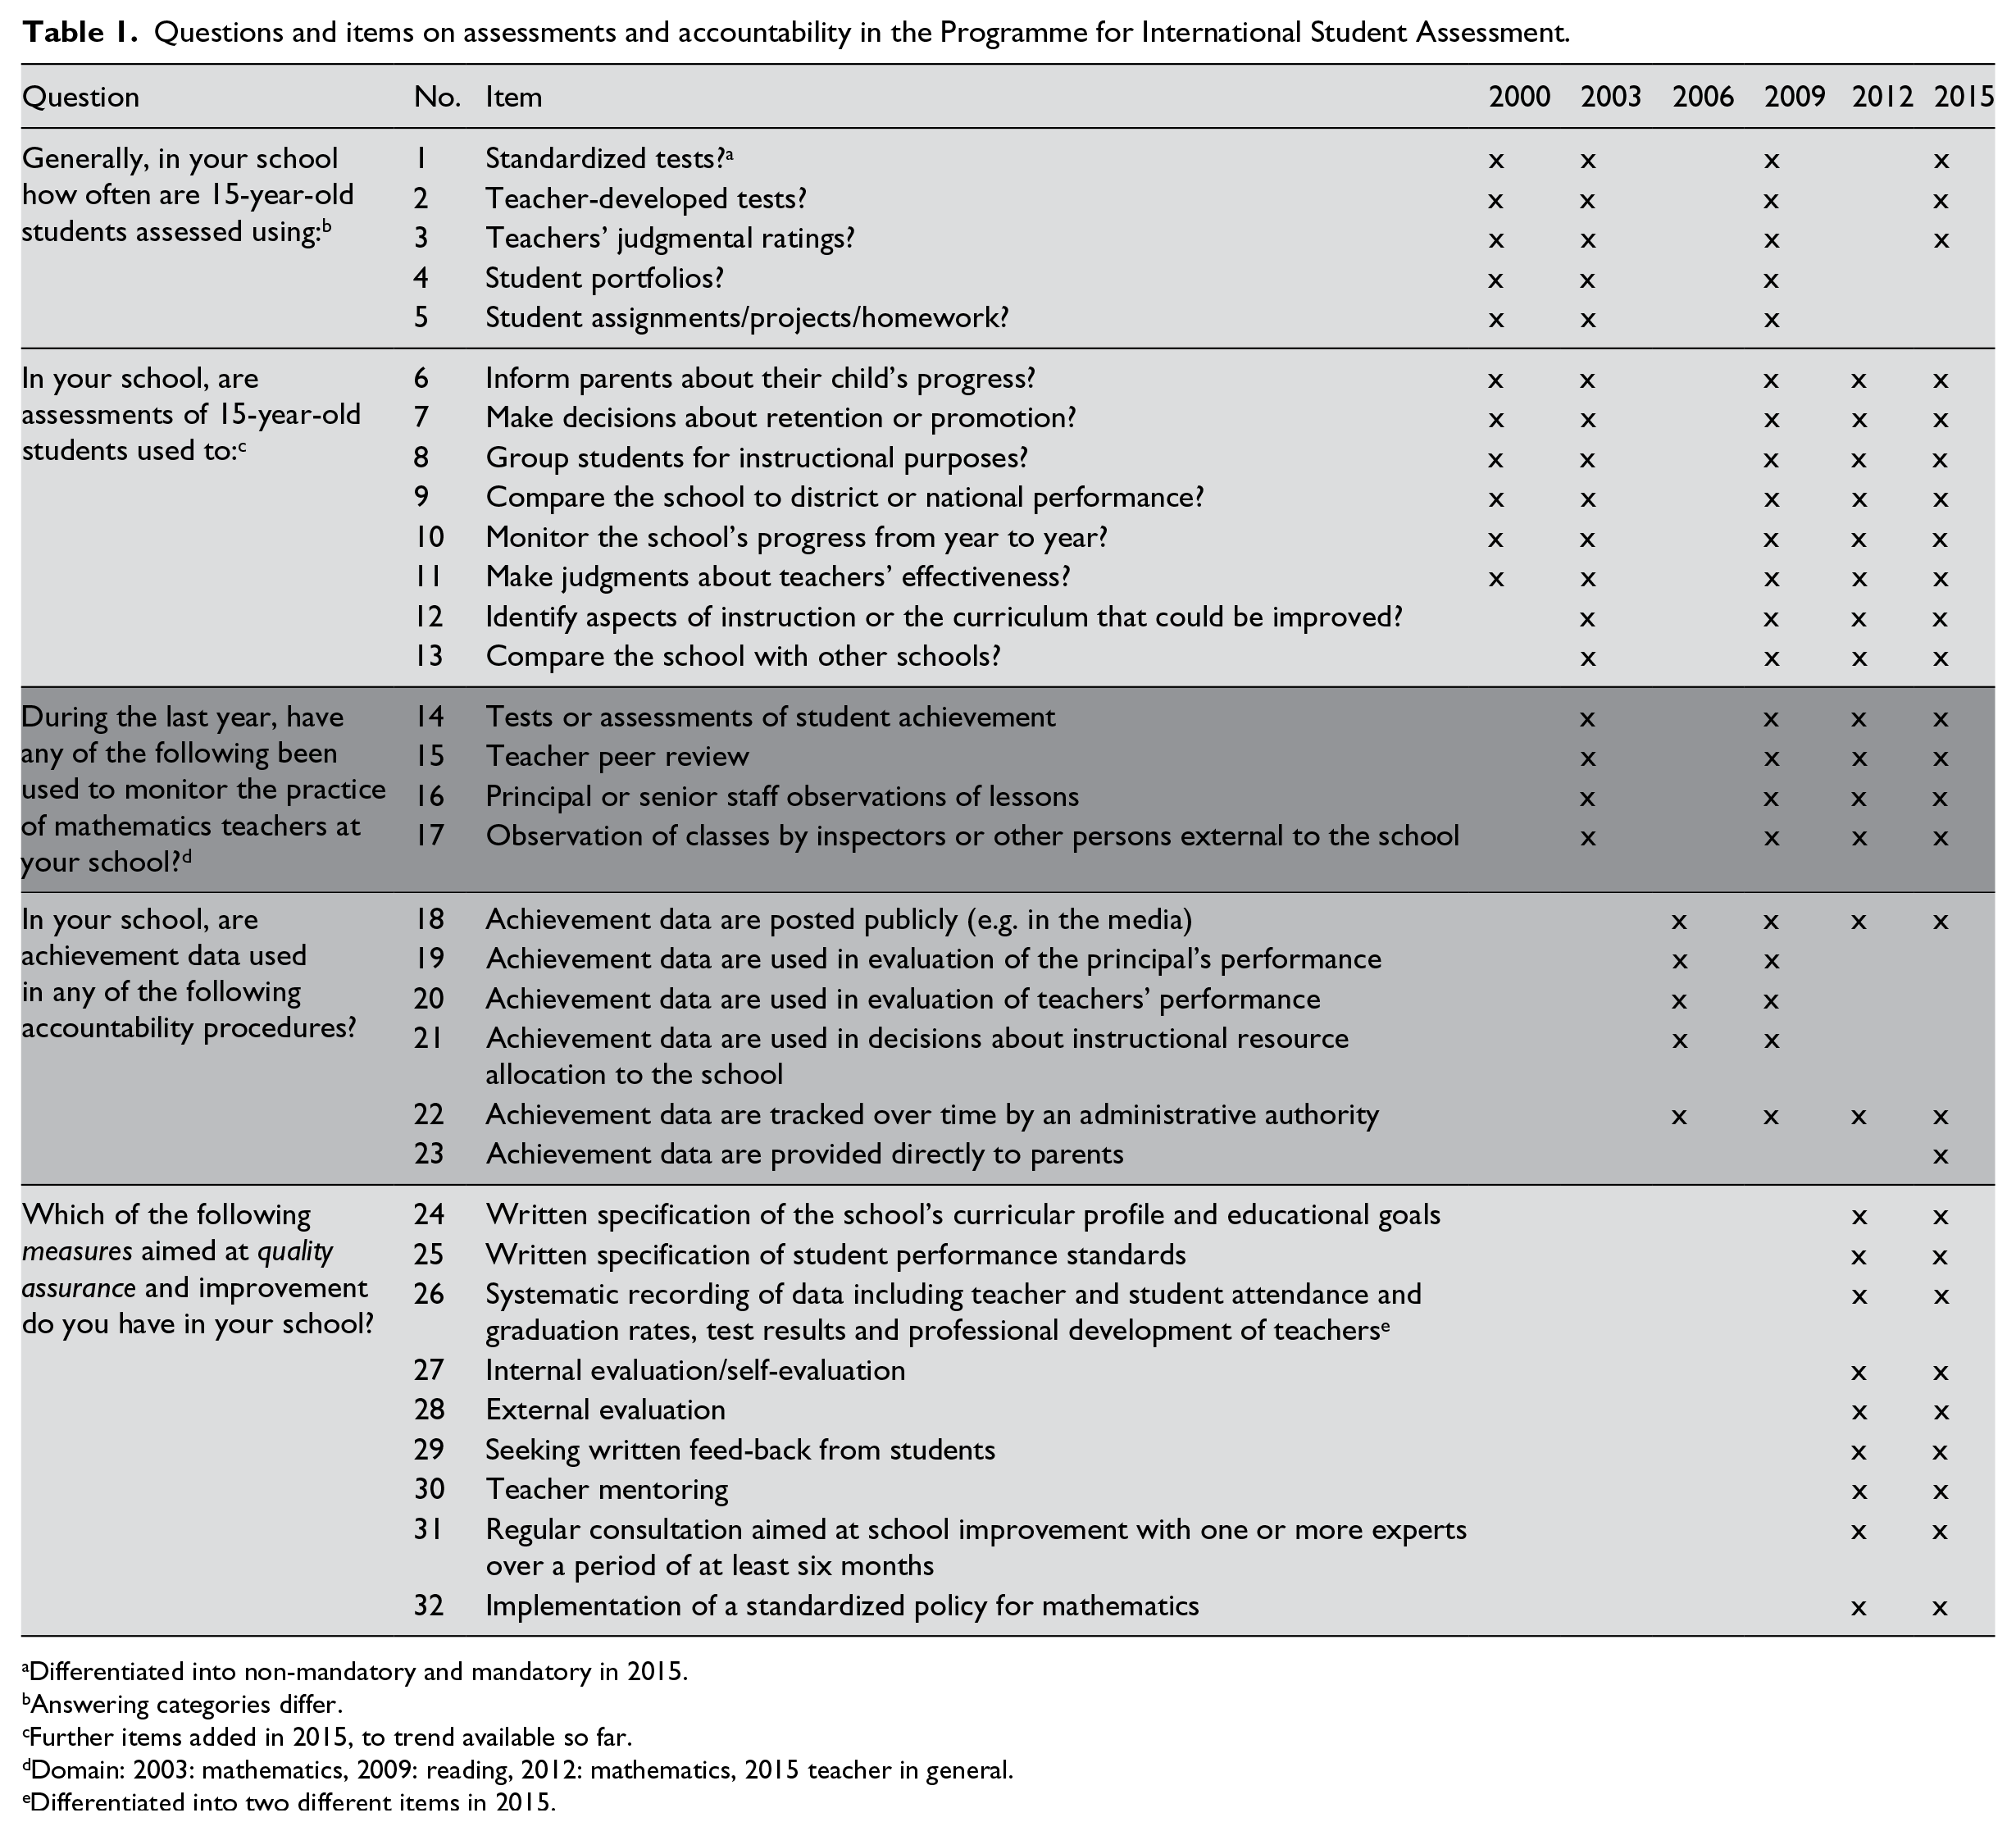
Differentiated into non-mandatory and mandatory in 2015.
Answering categories differ.
Further items added in 2015, to trend available so far.
Domain: 2003: mathematics, 2009: reading, 2012: mathematics, 2015 teacher in general.
Differentiated into two different items in 2015.
Conceptualizing assessments and accountability with indicators from PISA
In PISA, assessment and accountability practices of schools are addressed in the school questionnaires, which are administered to school leaders. A comparison of the six school level questionnaires of the studies between 2000 and 2015 reveals that the questions and items focusing on assessments and accountability practices do not appear consistently in all questionnaires (see Table 1). While some items have been surveyed in five of the six rounds of PISA between 2000 and 2015, others have been included only once.
Table 1 illustrates that the number of items focusing on assessment and accountability increased over time, already indicating a growing significance of these aspects of schooling. While the forms and purposes of standardized assessment have been addressed since the beginning of PISA in the year 2000, other topics, such as teacher evaluation, have been included in later cycles, with the topic of quality assurance in educational systems being surveyed only since 2012. The items allow for a distinction on the different levels of education systems, that is, the student, the school and the state. The functions of accountability, however, can only be differentiated since PISA 2012. The framework for context questionnaires in PISA 2012 distinguishes assessment and feedback at the classroom level, evaluation at the level of the schools, and accountability and evaluation policies at the system level (OECD, 2017: 175). Consequently, additional indicators have been introduced in the 2012 assessment, focusing on quality assurance measures. The context questionnaires in PISA 2015 explicitly addressed the topics of assessment, evaluation and accountability, due to the fact that this area was rated as being of high importance to policy makers of the participating countries (Bayer et al., 2017). Accordingly, the theoretical framework distinguishes standardized and less standardized practices, internal and external evaluations as well as means of quality management in schools, such as teacher evaluation (Klieme and Kuger, 2016). Furthermore, across these measures, purposes, practices and the use and consequences of assessment, evaluation and accountability are described. The PISA 2015 database includes measures on general assessment practices and results, external evaluation and teacher evaluation, which have been used in previous cycles, in order to report trends. In addition, indicators on internal school evaluation and formative, classroom-based assessment have been included.
Given the change in topics and foci over time, it is difficult to assign the PISA items to existing theoretical models or conceptualizations of assessments and accountability, as we have presented them in the second section above. Following the classification of data sources, functions and objects of monitoring and evaluation (Scheerens et al., 2003), it is mostly possible to identify the respective object of monitoring and evaluation which is addressed in the questions. Further, with regard to data sources, PISA provides information on data collected through tests and assessments and through systematic inquiry and review, but does not cover the utilization of administrative data and statistics. Most significantly, Table 1 shows that the majority of items cannot be distinguished according to the function of monitoring and evaluation. Scheerens et al. (2003) differentiated three different purposes: accountability, improvement and accreditation. Only for items 6, 7, 8, 12, 18, 19, 20 and 23 listed in Table 1 it is possible to determine a purpose; however, often there is no clear distinction between the purpose of accountability and the purpose of improvement.
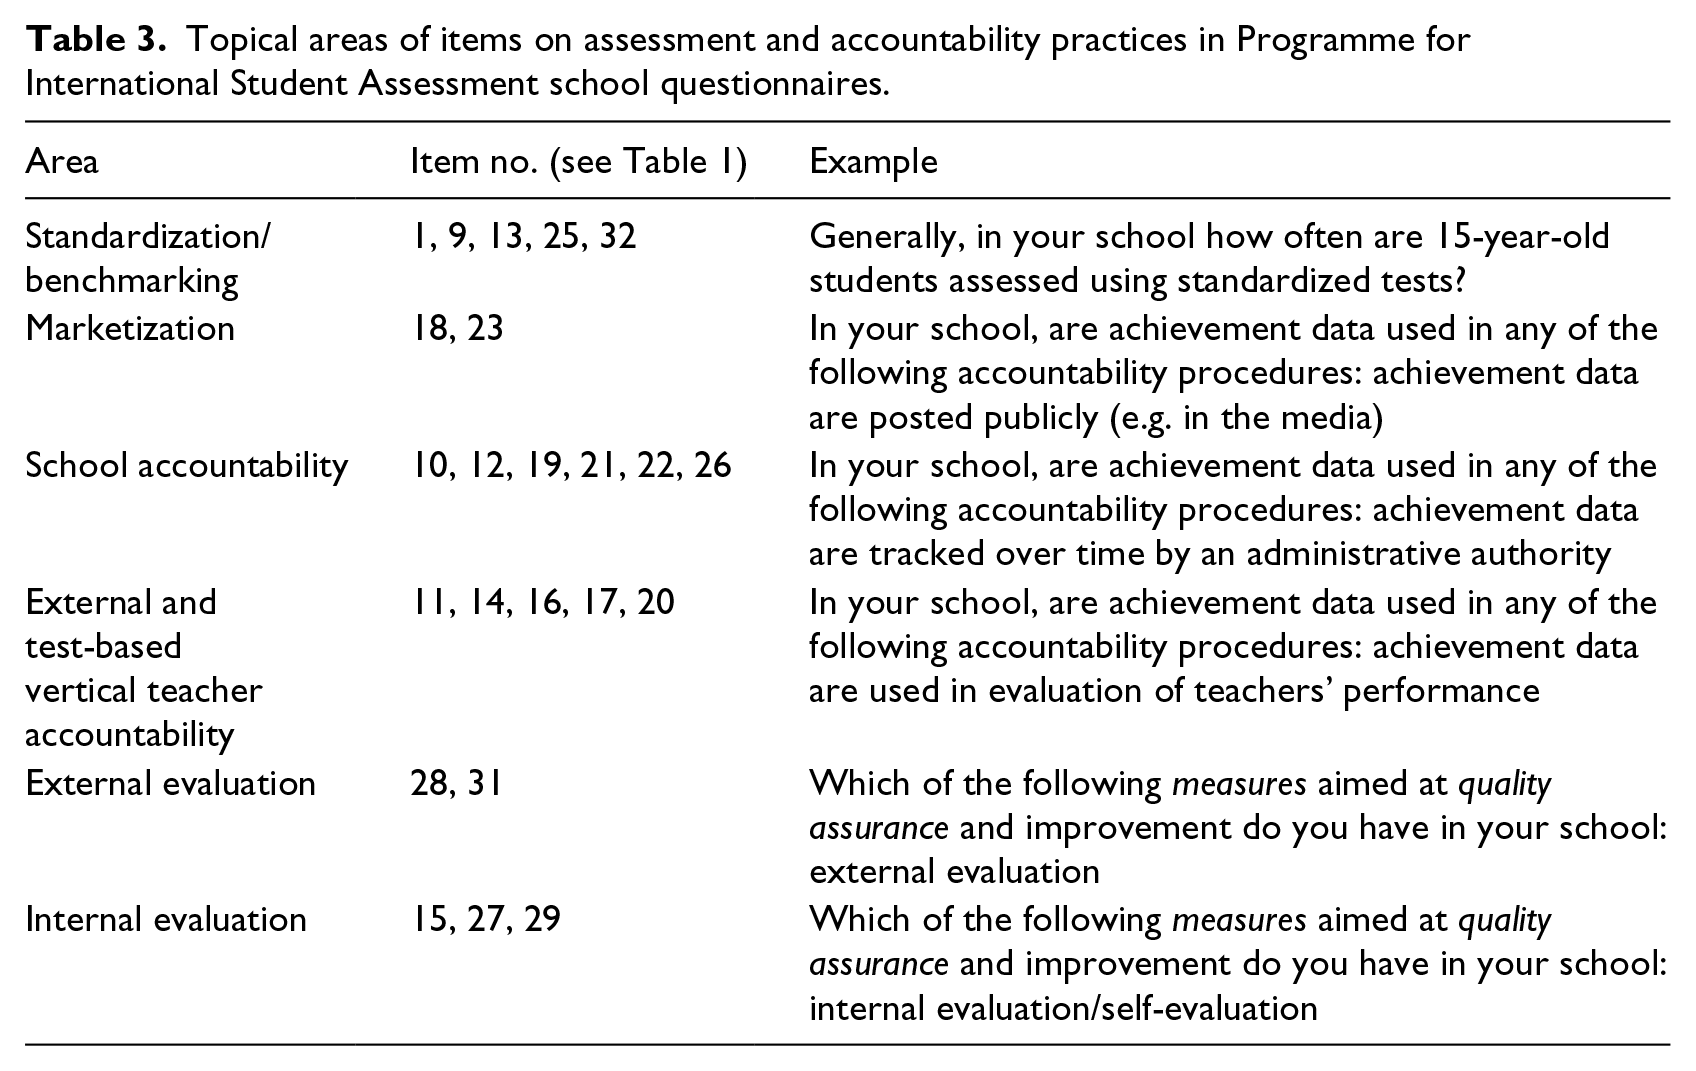
Although it is not possible to categorize the PISA items on assessments and accountability according to existing theoretical concepts, we grouped the items into six different topical areas. We distinguish between items focusing on standardization and benchmarking policies, items reflecting processes of marketization, items describing accountability at the school level, items measuring (vertical) teacher accountability, and items focusing on internal and external evaluation, respectively. Table 2 shows the classification of the items.
Results of international trend analyses.
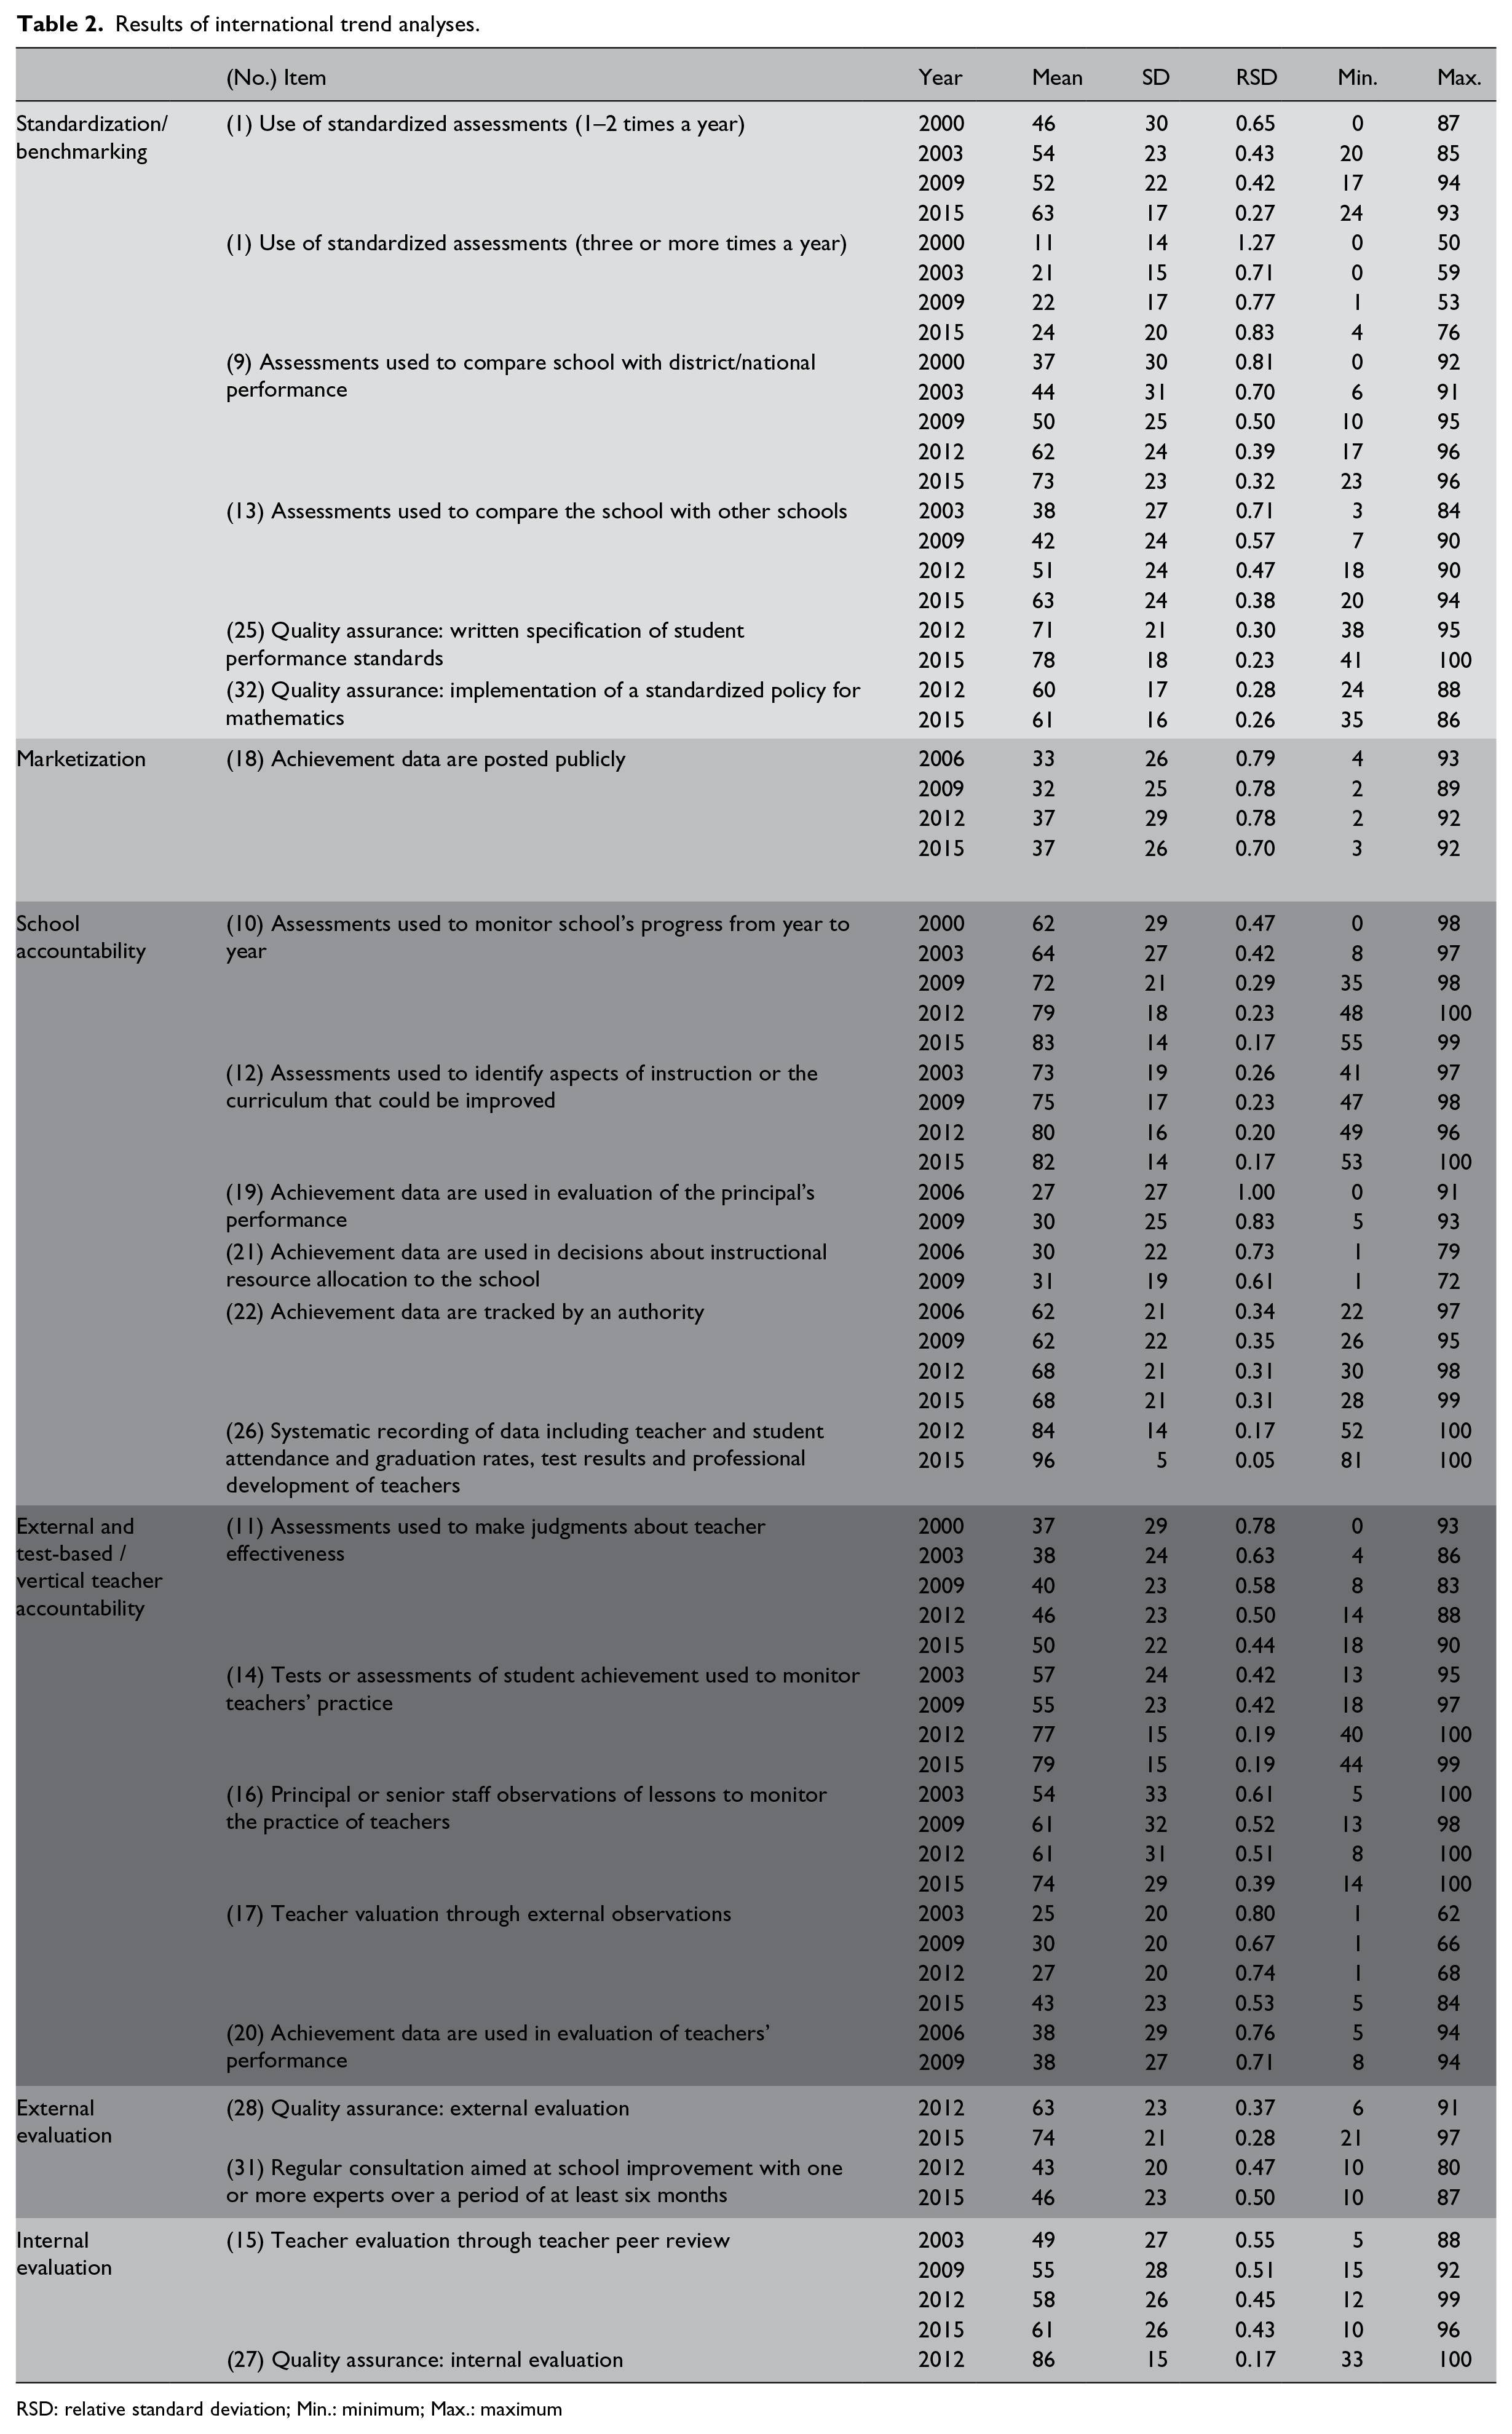
RSD: relative standard deviation; Min.: minimum; Max.: maximum
For our next analyses on changes in assessment and accountability practices, we excluded items 2 to 8 as they represent rather traditional features of schooling and student accreditation which are not relevant when assessing the ‘new’ levels and purposes of assessments and accountability in education. Also, items 24 and 30 do not relate to evaluation and accountability in our sense and are left out in the following.
Methodological approaches
For the following analyses, we draw on indicators derived from the PISA school questionnaires of the years 2000, 2003, 2006, 2009, 2012 and 2015. For the calculation of the indicators, the school level datasets have been merged with the student level data into a hierarchical structured dataset (in which students are nested in schools, which are nested in countries). Just as the PISA competence scores are aggregated at the country level in order to build league tables, information from the context questionnaires can be aggregated at the country level in order to generate indicators of national education systems. For example, students have been asked whether they attended preschool. Building on this variable, it is possible to compute the proportion of students that attended preschool in a country – as an indicator of the prevalence of pre-primary education. To give a second example: school heads have been asked whether their school is public or private. From this variable we can compute the percentage of students attending a private school in a country – as an indicator of institutional privatisation.
Since PISA’s sampling strategy results in a representative sample for 15-year-old students in a country, the aggregation has to be done with the student level data. Further information on sampling can be found in the technical reports for each cycle (OECD, 2014).
Two steps have to be carried out before performing the aggregation: first, in order to enable comparisons over time, some of the items have to be recoded. For example, in 2000 the answering categories for item number 1 on the use of standardized assessments were: Never, Yearly, 2 times a year, 3 times a year, 4 or more times a year. In 2003, 2009, 2012 and 2015 the categories were: Never, 1 or 2 times a year, 3 to 5 times a year, monthly, more than once a month. After recoding, three different categories remain: Never, 1 or 2 times a year, 3 or more times a year. In a second step, this recoded variable with three different values has to be transformed into three dummy variables in order to calculate the (weighted) average of these dummy variables per country. These average values indicate the proportion of students in a country attending schools which have implemented a respective practice (e.g. conducting standardized assessments one or two times a year). In order to interpret them as percentages, we multiplied these values by 100.
The aggregated variables derived from the school level questionnaires represent meaningful indicators of education systems and their characteristics because they reflect actual practices, whereas formal policy statements might not ‘arrive’ in schools. Depending on the proliferation of a certain practice across schools in a country (e.g. school autonomy), our indicators can be interpreted as implemented national policy.
While we needed the student level data for aggregating the country level indicators, we ignored the student and school level information for our comparative analyses, for which we only used the indicators measuring the percentage of students in a country attending schools with a specific practice in place. Based on the country level data, we computed mean values across 20 OECD countries 1 with valid measures for every year in which a respective indicator has been surveyed. We also report standard deviations, relative standard deviations, and minimum and maximum values, in order to assess the variation of assessment and accountability practices across our sample. For more in-depth analyses, we selected one indicator of each of our six thematic areas and plotted its values for every country. The plots contain the country level measurements for 2015 as well as the difference between the value of 2015 and the respective first measurement for each indicator (e.g. 2000). This difference can be interpreted as a change score, indicating the magnitude of increases or decreases of a certain assessment or accountability practice in a country. Further, we conducted a hierarchical cluster analysis with the six indicators of 2015 and their respective change scores. The cluster analysis helped to identify groups of countries exhibiting a similar pattern of (change in) assessment and accountability practices.
Results
Table 2 shows the mean values and standard deviations per year. A change in mean and standard deviation can be interpreted in such as way that there has been an increase or decrease in the prevalence of a respective practice (mean value) and that there has been a trend towards more or less similarity between countries (standard deviations). For example, the mean values for the use of standardized assessments show that the average proportion of students attending schools using standardized assessments one or two times a year increased across the 20 OECD countries between 2000 and 2015 (from 46% to 63%). At the same time, the standard deviation decreased, indicating a trend of convergence among the countries in our sample with regard to this indicator. The relative standard deviation gives the extent of variability in relation to the mean, with larger values indicating larger variability.
Table 2 reveals that of 22 indicators, 21 show a trend of more homogeneity across countries, as the (relative) standard deviations decreased. With regard to the average values, only one indicator (number 20, teacher accountability, measured in 2006 and 2009) shows a stable trend for the mean value; all other indicators are increasing. The minimum values likewise show increasing trends over time for all but three indicators. The largest increase in terms of average prevalence can be observed for indicators 9 and 13, that is, the use of assessment data for comparisons with other schools or with regional/national performance. Likewise, some indicators for teacher education show substantially increasing trends.
Figure 1(a) to (c) illustrates the change in terms of average prevalence (mean values) for all indicators graphically. For these graphs, the indicators have been sorted according to their size, starting with the least prevalent practices (Figure 1(a)). Figure 1(a) shows that in 2015, the least prevalent practice was the ‘use of standardized assessments 3 times or more often a year’; this practice has increased since the year 2000 from 11% to 24%. What is apparent is that all lines are steadily rising, except for the indicator ‘Achievement data are posted publicly’, which had a slightly higher value in 2012 than in 2015. The figure also shows the stable trend for teacher accountability by achievement data.
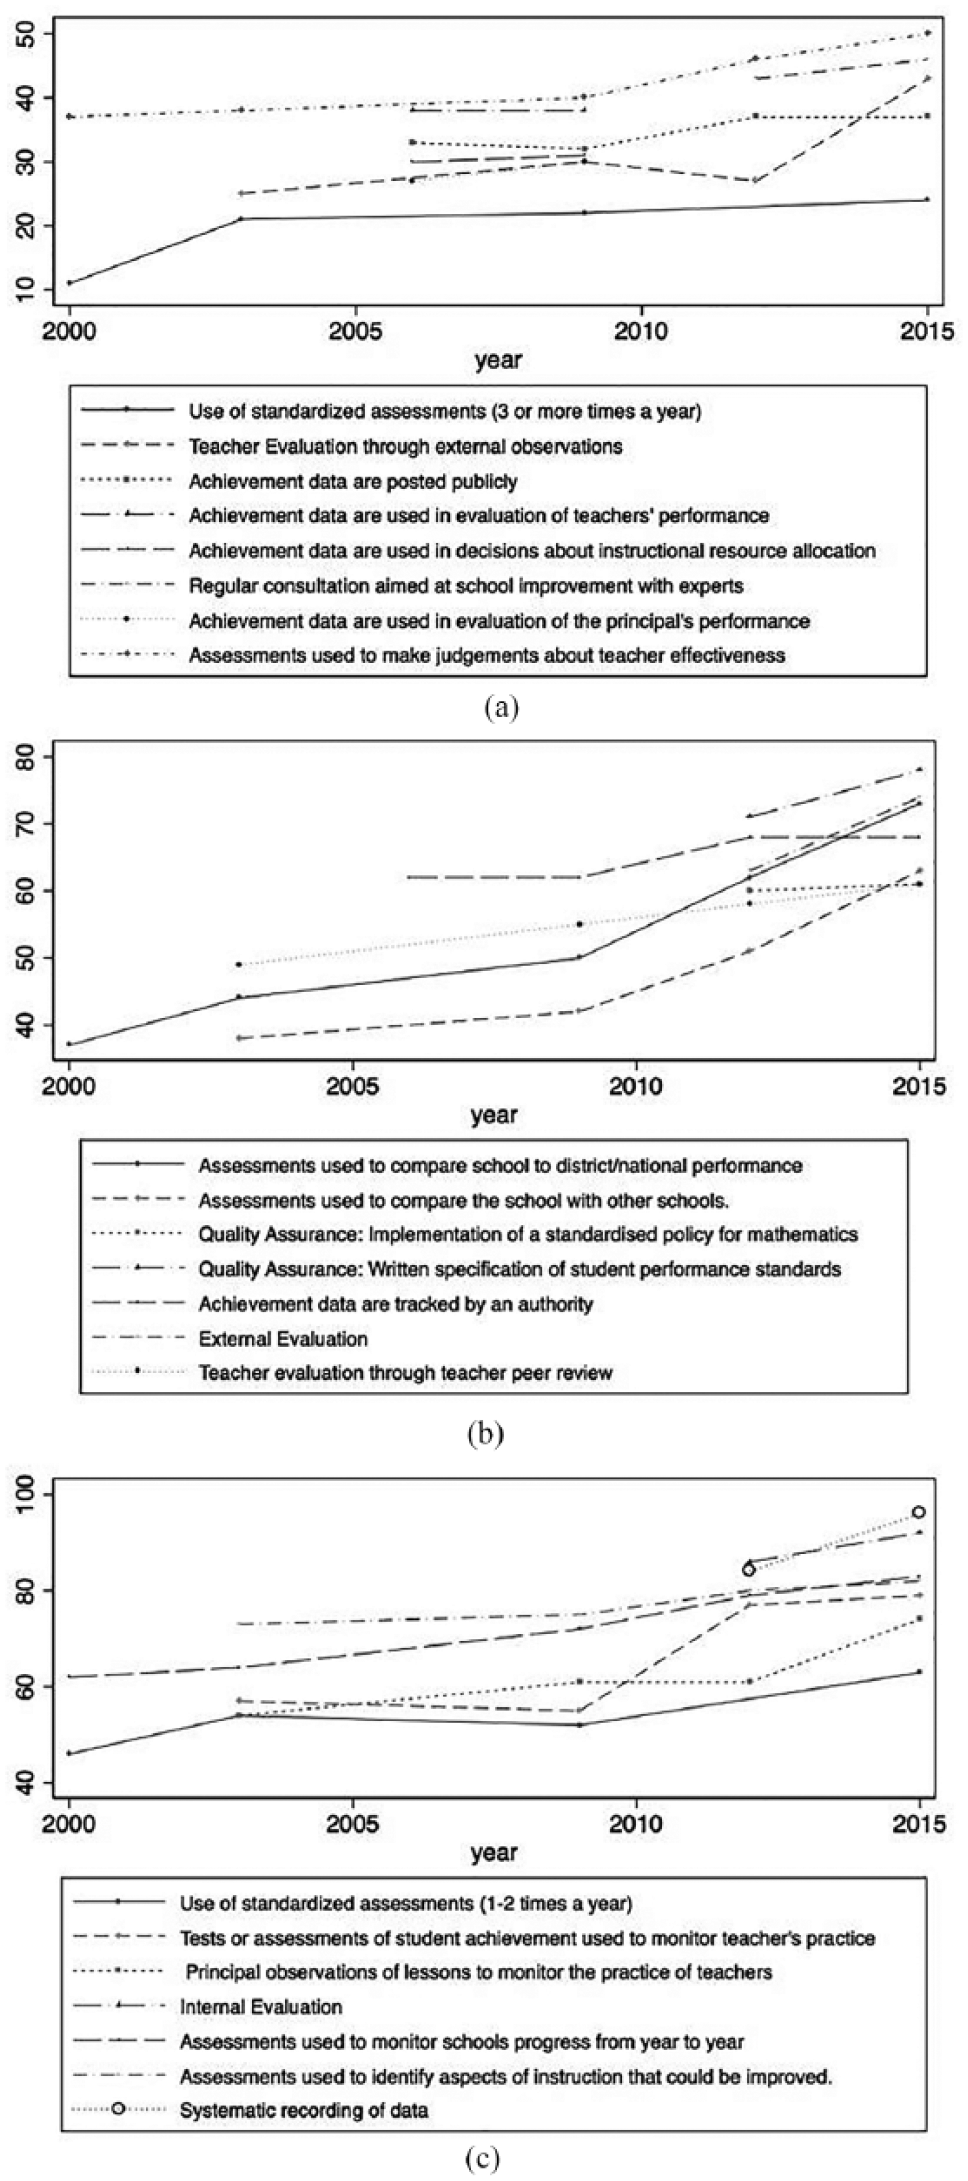
Change of assessment and accountability practices in OECD.
Figure 1(b) illustrates the trend of the moderately prevalent practices. All lines increase steadily with a rather stable trend since 2012 for the indicator ‘Achievement data are tracked by an authority’. Quality insurance in terms of a standardized policy for mathematics shows only a small change between its two measurement points.
Figure 1(c) finally depicts the trend of the most prevalent practices in 2000. All lines show a steady increase, only ‘use of standardized assessments 1 or 2 times a year’ and ‘use of assessment data to monitor the practice of teachers’ had lower values in 2009 than in 2003 but have increased since then.
In the following paragraphs we take a closer look at selected indicators in order to assess variability across countries. We chose one typical indicator for every domain, as shown in Table 3.
Topical areas of items on assessment and accountability practices in Programme for International Student Assessment school questionnaires.
Standardization
Data on educational outcomes are often measured in relation to national educational standards, which represent educational goals in a country and define the knowledge that students are expected to have acquired at a specific stage of their education (Koeppen et al., 2008; Shepard, 2006). Figure 2 illustrates the practice of using school level assessment data for comparisons with regional or national performance. We interpret this variable as an indicator of standardization in a country. The figure shows the absolute values for PISA 2015 for every country in our sample (dark bars), as well as the difference between the respective value in 2015 and the first measurement of this indicator in PISA 2000 (light bars).
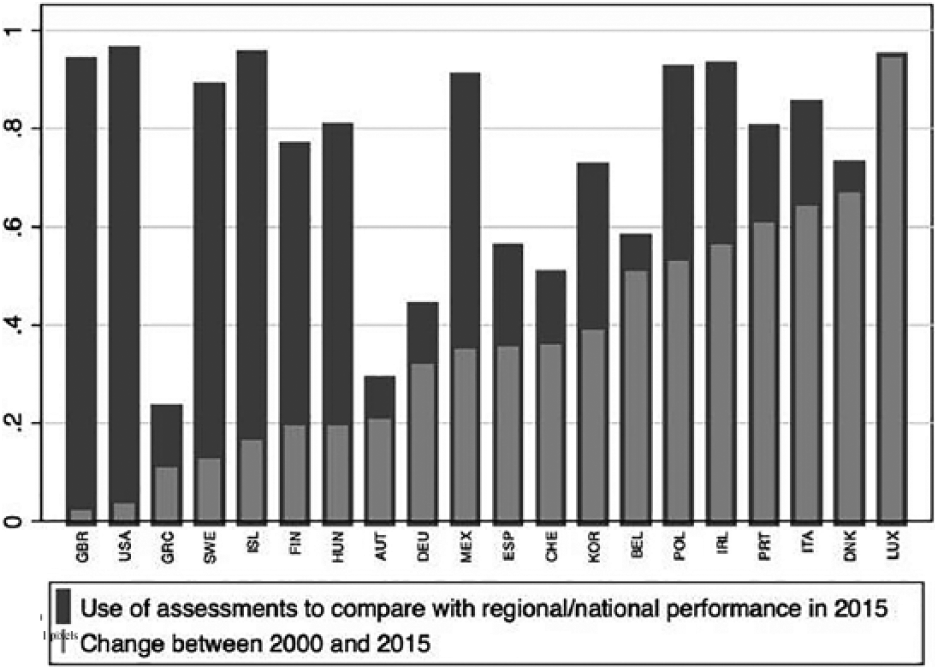
Assessments used for comparisons with regional or national performance, 2015 and change score.
The graph in Figure 2 shows that all 20 countries of our sample had higher values for using assessment data to compare with national performance in 2015 than in 2000. Table 2 has already displayed the substantial variation across countries of the absolute values, Figure 2 now also illustrates the variation in change rates. In some cases, countries with low values in 2000 also show high increases (e.g. Luxembourg, Denmark), and countries with high values in 2000 show only small increases (e.g. UK, USA), but there are also countries with rather low values still in 2015 and only moderate increase (e.g. Greece). In Luxembourg, almost every school uses assessments for comparisons, in Greece this is only the case for slightly more than every fifth school.
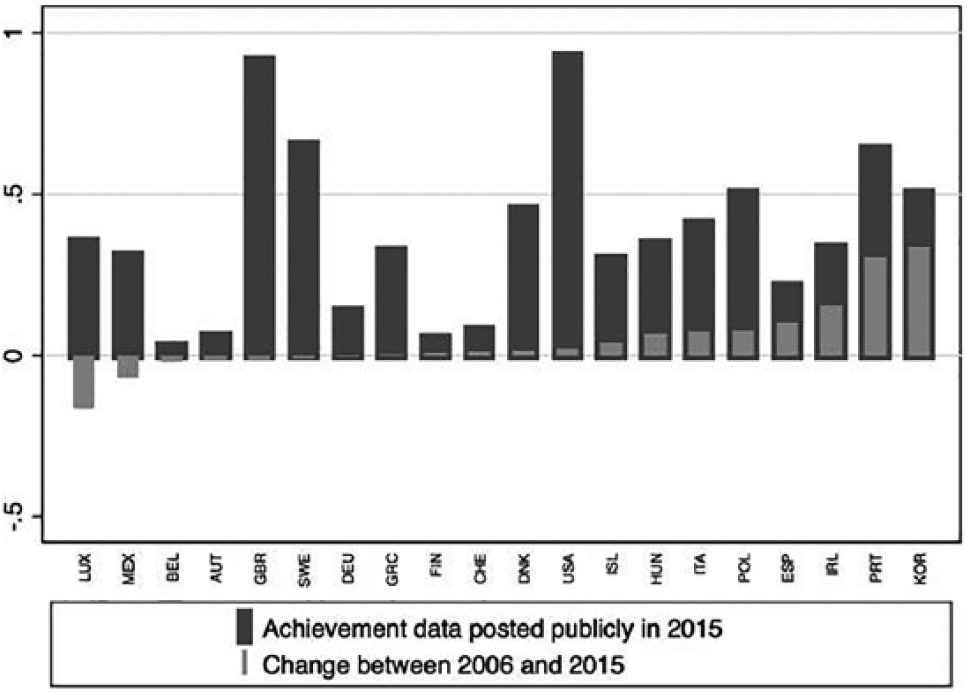
Marketization
The public posting of achievement data of schools reflects the degree of marketization and transparency of school performance in a country. For this indicator, the observed time span is only nine years. The pattern of change across countries is more diverse for this indicator, as we found some countries which decreased marketization practices in this respect, although the average across all countries increases over time. Comparing change rates and absolute values in 2015 reveals that lower starting values do not correspond with higher increases, as Belgium and Finland, for example, had relatively low values in 2006 and do not show substantial change over time. Also, Switzerland had comparably low values in 2006 and exhibits only very small increases. There is no country in which all schools report to post their achievement data; the highest prevalence of this practice is measured in the USA (92%), the lowest in Belgium (3%).
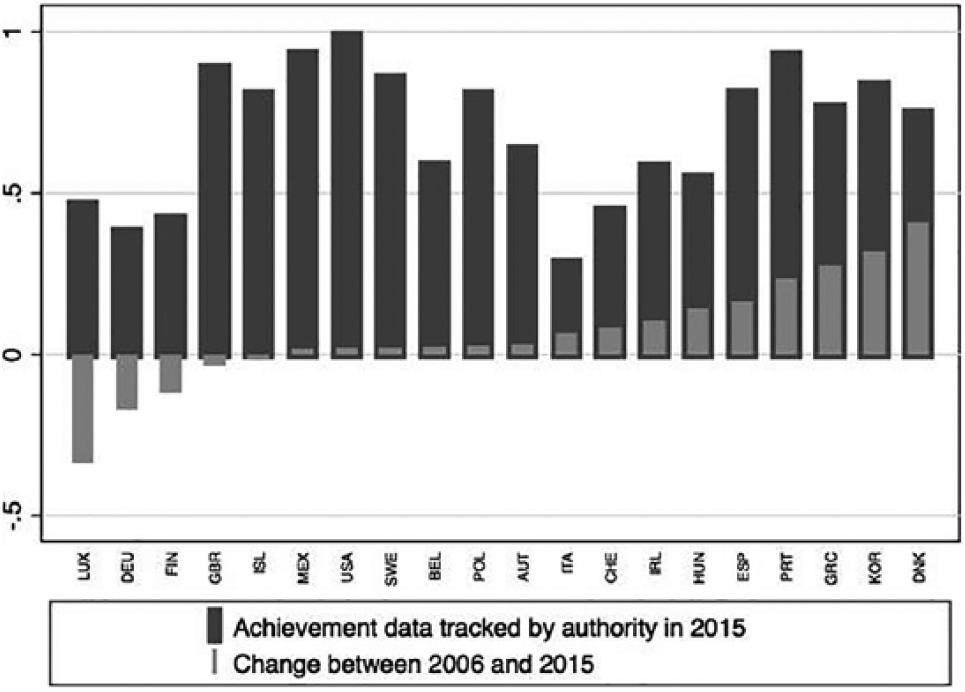
School accountability
As an indicator for school accountability we assessed the monitoring of school achievement data by educational authorities. Here, about half of the countries show only small change rates, and the relation between declines and rises is more balanced. Reflecting the overall increase, some countries with already relatively high values in 2006 experience rather substantial increases (e.g. Portugal and Korea). In the USA, every school is monitored by educational authorities, whereas schools in Italy are seldom monitored in this respect.
Teacher accountability
With regard to teacher accountability, Italy is an interesting case, with substantially lower values in 2015 than in 2000; however, it is not the only country which has reduced this form of accountability. Luxembourg by contrast exhibits the largest increase in relation to its values in 2000. In the UK, this form of accountability is most prevalent. Germany is the country with the lowest figure. Overall, teacher accountability is a less prevalent accountability practice.
External evaluation
In contrast to teacher accountability, the use of external evaluation as a means for quality assurance at schools is a comparatively widespread phenomenon. Almost all countries show increasing rates between 2012 and 2015, the only two years for which measurements are available. Greece is the country with the lowest prevalence of external school evaluation (21%), Portugal has the highest rate in this respect (97%). Again, Luxemburg shows the largest increase.
Internal evaluation
Internal evaluation is a less control-driven form of accountability, which is more related to improvement and organizational learning. The graph in Figure 3 shows the country values for the prevalence of teacher peer review. Iceland has the lowest values in 2015 and experienced a decreasing trend since 2000. Finland, the country with the highest PISA scores in 2000 but since then decreasing student outcomes, shows a decreasing trend, too.
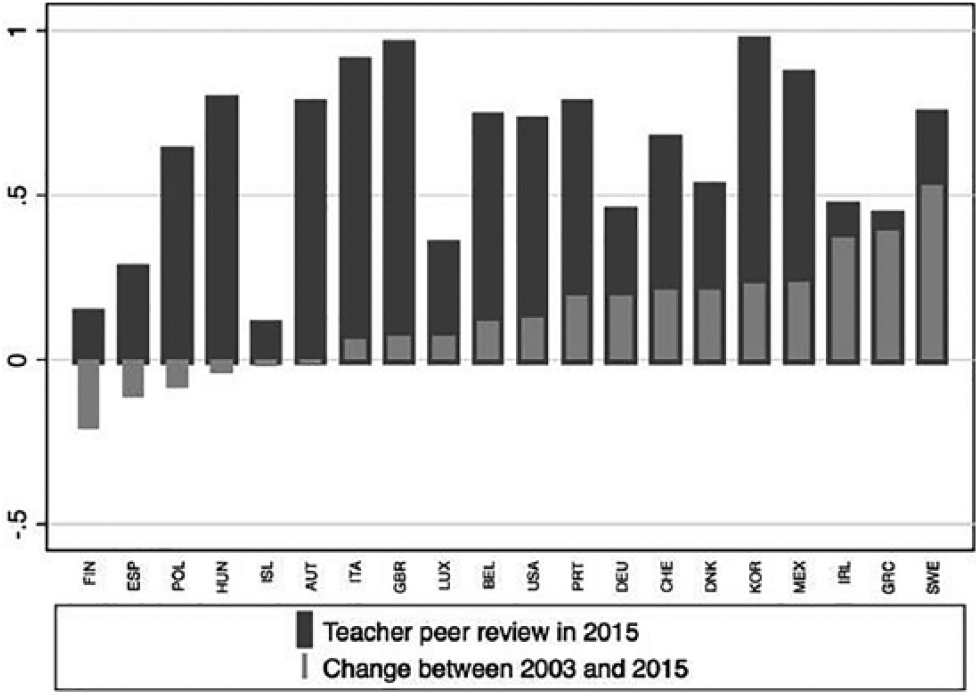
Teacher peer review.
In comparison, teacher peer review is fully established in Korea, where this practice was already very common in 2003. The biggest increase is observable for Sweden.
Cluster analyses
In a last step, we conducted a hierarchical cluster analysis 2 using the six selected indicators from Figures 2 to 7 and their respective values from 2015 to examine similarities of the 20 countries within our sample. We applied Ward’s Linkage procedure and the Duda–Hart Je(2)/Je(1) stopping rule (Duda and Hart, 1973) to determine the number of clusters. The cluster analyses revealed four clusters of countries with similar patterns of assessment and accountability practices. Table 4 gives an overview about the classification of countries across the four clusters. Figures 2 to 7 help describe the characteristics of the clusters.
Public posting of school achievement data, 2015 and change score.
Monitoring of achievement data.
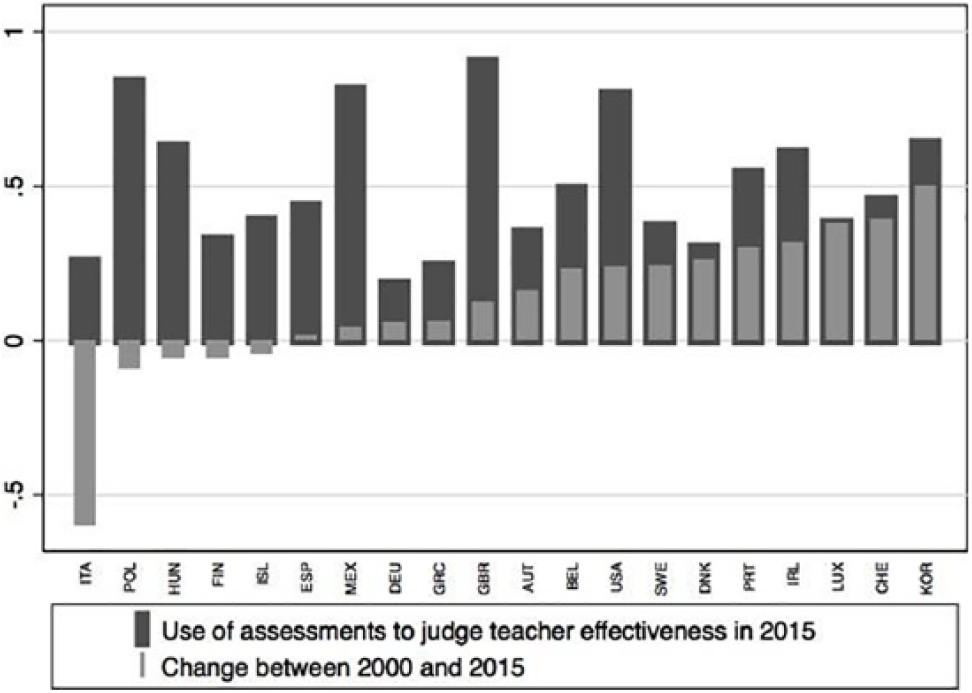
Teacher accountability.
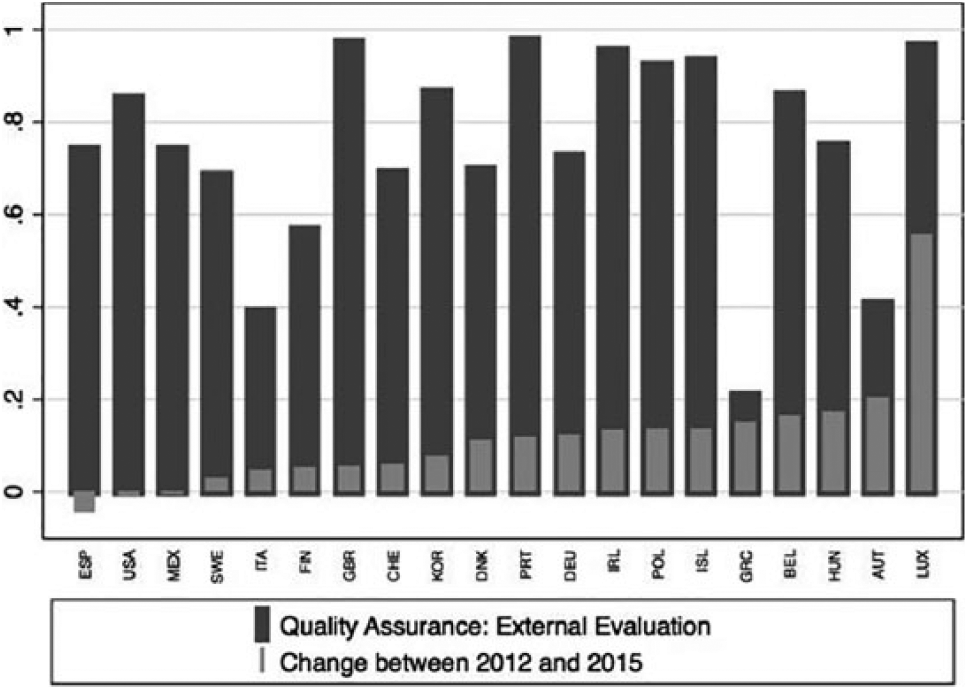
External valuation as a means of quality assurance.
Clusters of assessment and accountability practices.
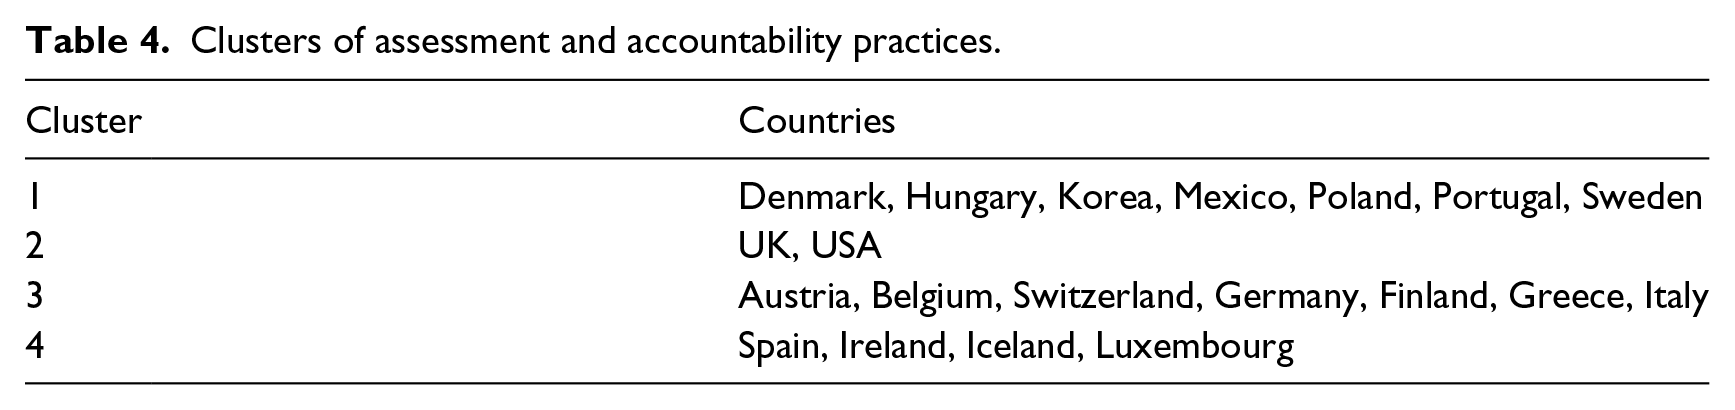
Cluster 1 is the largest cluster, with seven rather diverse countries. It is characterized by comparably high average values for all indicators, except for standardization and external evaluation. This cluster thus seems to have established comprehensive evaluation and accountability measures, but less strict external standards and control mechanisms. Cluster 2 consists of two liberal welfare states, the UK and the USA. Taken together, these two countries exhibit the highest values on all selected indicators. This is not surprising, given that liberal welfare states have a long tradition of marketization and decentralization, and accordingly have well-established strategies of exerting control and implementing standards. Several works have assessed accountability policies in these two countries (see, for example, Cumming, 2012; Scoppio, 2012). For both countries, educational reforms implemented in the 1980s and 1990s focused on effectiveness and accountability measures, which might be seen in the current results: the current level of assessment is high, while the change in these policies over time is comparably small.
Cluster 3 mainly includes the continental welfare states (Ebbinghaus, 2012) but also Finland, Italy and Greece. The average values of this cluster are the lowest for all but one indicator (internal evaluation). It is again not surprising that continental welfare states show lower values on our indicators of assessment and accountability practices, as the idea of marketization, choice and autonomy is less prevalent in public institutions in these states. However, our analyses showed that these countries also experienced increases in assessment and accountability practices. In Austria, Switzerland and Germany, the publication of TIMSS 1997 and PISA 2000 results was followed by thorough educational reforms which included standards-based accountability measures on different levels (Bieber, 2014; OECD, 2017). Accordingly, the increase in accountability measures over time is rather high in these countries.
The fourth cluster consists of Spain, Ireland, Iceland and Luxembourg. It is characterized by rather low values for all indicators, but differs from Cluster 1 in terms of higher values for standardization and external evaluation. Thus, countries in this cluster experience stricter control in terms of external standards.
Overall, the cluster analysis does not suggest that clusters are identified due to specific constellations of our indicators (e.g. high marketization and low internal evaluation). Rather, differences in the overall levels of assessment and accountability practices seem to distinguish the four clusters. With the exception of standardization and external evaluation, the other areas (marketization, school accountability, teacher accountability and internal evaluation) seem to be interrelated.
Results beyond OECD countries
We limited our country sample to those countries which had valid measures on all indicators and years of measurement. These countries are all OECD countries, as only these participated in all PISA survey rounds. However, one could ask whether our findings are generalizable beyond OECD countries. In order to approach this question, we selected six further, non-OECD, countries which participated in PISA 2000, 2009, 2012 and 2015. These countries are Bulgaria, Brazil, Hong Kong, Indonesia, Latvia and Thailand. We repeated our analyses with this smaller sample and time span and found comparable results. Of the 19 indicators which are available for the four years, we found that 17 showed an increasing trend of the average prevalence and a decreasing trend of heterogeneity between countries.
Discussion
In this paper, we have presented an approach to analysing trends in assessment and accountability practices in education across countries and time with data from the OECD PISA study. It has to be noted that analyses over time are not straightforward with PISA, as the questionnaires change between PISA cycles. This leads to different coverage of specific indicators across all survey rounds. However, our approach of harmonizing PISA items from different questionnaires still provides the most comprehensive time-series indicators on assessment and accountability practices at secondary school level available so far. Our descriptive analyses for 20 OECD countries showed an increasing trend for the vast majority of the generated indicators, indicating that assessments and the use of assessments for purposes of accountability, but also the implementation of more horizontal, qualitative evaluation procedures increased within the larger part of the OECD during the last 15 years.
This finding supports the hypothesis that the significant public attention that was raised by ILSA results at the beginning of the 21st century might have increased the legitimacy of evidence-based policy-making and accountability in education. The presentation of PISA results in the form of league tables evokes a competition for the ‘best education system’. In search of examples of best practices and efficient policies, elements from the New Public Management Paradigm infiltrated into education policy making (Sahlberg and Hargreaves, 2011). When countries tried to adopt educational reform projects in this direction, they often referred to results of PISA and comparable projects in order to legitimate the reforms (Feniger and Lefstein, 2014; Heyneman and Lee, 2014; Sellar and Lingard, 2013). These reforms called for an evaluation of their success, thereby inducing pressure for further assessments. Further, new technical solutions of data processing and data management facilitated more sophisticated assessment and monitoring procedures (Anagnostopoulos, 2013). Taken together, these developments resulted in an increase of assessment, accountability and evaluation at secondary school level, as our results have shown. PISA, the OECD or other testing projects alone are certainly not the primary causes of these trends. Rather, PISA is a symptom of a new international governance – or even a world polity (Meyer and Ramirez, 2000) – in education. The results for non-OECD countries also support this notion, as they exhibit the same trends.
Further, our cluster analyses revealed that more vertical, control-driven forms of assessments and accountability do not seem to crowd out more peer-oriented forms of evaluation for improvement. Rather, both practices increased over time, reflecting an increased pressure on education systems to raise quality and efficiency. Further research should thus examine which forms of assessments and evaluation are related to educational outcomes. The discourse on the effects of ILSAs and a ‘new accountability regime’ could be substantiated, if results would show that certain assessment and accountability practices are ineffective or actually harmful in terms of learning outcomes. The longitudinal analyses of PISA data as we have suggested in this paper also bear the potential to overcome problems of conventional, cross-sectional analyses of educational outcomes and their determinants (Teltemann and Schunck, 2016).
Footnotes
Declaration of conflicting interests
The author(s) declared no potential conflicts of interest with respect to the research, authorship, and/or publication of this article.
Funding
The author(s) received no financial support for the research, authorship, and/or publication of this article.