
Abstract
I present new evidence on the effects of having a same-sex or same-race teacher on two salient outcomes: teacher expectations for postsecondary attainment and teacher recommendations for advanced courses. My identification strategy conditions on all subject-invariant student traits to provide causal estimates of the effects using data from the Educational Longitudinal Study of 2002. Across the full sample, there is little evidence of an effect of having a same-sex or a same-race teacher on expectations or recommendations. However, I find surprisingly large effects for Black students on teacher expectations. For these students, the effect of a same-race teacher on teacher expectations to complete more than high school is between 11 and 17 percentage points. This effect is at least 70% of the White–Black race gap in teacher expectations.
Keywords
I present evidence based on a quasiexperimental research design in which I condition on all subject-invariant traits specific to each student. I use a nationally representative data set, the Educational Longitudinal Study of 2002 (ELS:02), which consists of a sample of 10th graders in 2002. At baseline, for each sampled student, a teacher survey was given to the student’s math teacher and to the student’s English teacher. The survey included two items that asked how far the teacher thought the student would go in school and whether the teacher had recommended the student for advanced courses. Thus, for each student, I have two contemporaneous observations that can be compared using a first-difference (FD) approach. This approach is akin to a twin design and allows me to ask how the characteristics of two different teachers influence their expectations and recommendations of the same student. In brief, I find no effects on expectations or recommendations for the full sample. However, I find a large and statistically significant effect of having a same-race teacher for Black students on teacher expectations for postsecondary attainment.
Background, Literature, and Theoretical Context
There are a number of mechanisms by which assignment to a same-sex or same-race teacher could influence a student’s outcomes, and the following theories I discuss are neither mutually exclusive nor exhaustive. First, sex and race congruence may function through indirect channels, such as role-modeling and stereotype threat (Adair, 1984; Graham, 1987; Steele & Aronson, 1995; Stewart, Meier, & England, 1989). In the former, students may react to being with a demographically similar teacher by increasing their attitudes, working harder, or raising their own expectations in the presence of a teacher who models positive behaviors. In the latter, theory suggests that students fear that how they perform in school will confirm a negative stereotype about a social group to which they belong and that this anxiety will lead to lower performance. Both of these channels can be thought of as “passive” channels through which demographic congruence between students and teachers may operate.
More “active” channels have also been suggested, and these channels may take the form of taste-based or statistical discrimination. Taste-based discrimination is discrimination that is born out of personal views and preferences about certain social groups, whereas statistical discrimination comes from using a group’s average behavior to evaluate an individual belonging to that group when faced with uncertainty (Becker, 2010). According to the theory, statistical discrimination may cause inequalities to exist even in the absence of prejudice. For example, whether a student will graduate from college is uncertain; therefore, if teachers believe Asian students are more likely to graduate from college, they may use that information when forming an expectation about an individual student. Research does suggest that teachers base expectations in part on student conduct, attractiveness, sex, race, and social class in addition to prior academic achievement (Dusek & Joseph, 1983; Jussim, 1989; Tenenbaum & Ruck, 2007). For example, in terms of race, teacher expectations are higher for Asian and White students than for Black and Hispanic students. Furthermore, although the literature is sparse, some research shows that teacher characteristics are likely to influence subjective teacher evaluations (Cooper & Tom, 1984; Ehrenberg, Goldhaber, & Brewer, 1995). It is possible for such biases to influence student outcomes, whether unintended or not.
The present study contributes to the growing body of literature on how demographic congruence between students and teachers affects student outcomes by providing evidence about the effects of congruence on teacher expectations and recommendations for advanced courses. As I describe below, the study contributes to a mixed literature by rigorously estimating congruence effects and investigating outcomes that are understudied or nonexistent in the literature. To start, despite the mounting literature on congruence effects, rigorous evidence on the outcomes studied in this article is thin, as experimental and quasiexperimental studies have instead focused on outcomes such as test scores, subjective evaluations of ability, and subjective evaluations of behavior. In the first experimental analysis on this subject, Dee (2004) leveraged the random assignment in Tennessee’s Project STAR to credibly analyze the effect of being assigned to a same-race teacher on test scores for students in Grades K–3. The author found significant increases for Black and White students in math and reading achievement. Similar positive effects of race congruence on achievement were found using fixed-effects models and administrative data sets in North Carolina (Clotfelter, Ladd, & Vigdor, 2007), Florida (Egalite et al., 2015), and an unnamed community college (Fairlie, Hoffmann, & Oreopoulos, 2011). In regard to sex congruence, Dee (2007) used a within-student identification strategy and found positive effects on achievement of having a same-sex teacher for eighth graders in the National Educational Longitudinal Study of 1988 (NELS:88). Conversely, mixed or null findings appear in a number of other studies. Ehrenberg et al. (1995) looked at achievement gains between eighth and 10th grade also using the NELS:88 and found no evidence of race-matching effects on achievement, although omitted ninth-grade teacher characteristics could be a source of bias. Antecol, Ozkan, and Ozbeklik (2012) and Winters, Haight, Swaim, and Pickering (2013) both investigate sex congruence and find little evidence of an effect on achievement. Using a randomized experiment on the Teach for America program, Antecol et al. find no effects on either math or reading achievement for males and no effects on reading for females. They do find differential effects of being assigned female math teachers for female students, depending on the strength of the teacher’s math background. Winters et al. use a series of fixed-effects models and administrative data from Florida and find no relationship between being assigned a same-sex teacher and achievement at the elementary school level but do find a small effect for middle and high school students.
The literature has also investigated the effect of demographically similar teachers on other outcomes besides achievement, such as teacher perceptions of student performance and behavior. In an influential paper by Dee (2005) using data from NELS:88, the author estimates the effect of demographic congruence by leveraging the fact that two teachers of each sampled student are given a survey in which they assess the student. Using a student fixed-effects strategy, Dee finds that being assigned to a race-incongruent teacher increases the likelihood that the teacher perceives the student as frequently inattentive, frequently disruptive, and less likely to complete homework. Another rigorous study uses the Early Childhood Longitudinal Study–Kindergarten (ECLS-K) cohort and applies a student-and-teacher fixed-effects design to estimate the effect of having a same-race teacher on the teachers’ assessments of student performance (Ouazad, 2014). The author finds positive and persistent effects of being assessed by a same-race teacher. Using the same data set, Bates and Glick (2013) compare the ratings of up to four teachers on the same child and find that when Black students have a Black teacher, relative to a non-Hispanic White teacher, their assessments of externalizing behaviors are better. Last, in a less rigorous study that uses multivariate regression, McGrady and Reynolds (2012) use the ELS:02 to look at teacher perceptions of student performance and behavior. They find that White teachers are more likely to view Asian students positively and Black students negatively.
As noted earlier, very few studies look at demographic congruence in relation to teacher expectations, and none that I am aware of investigate teacher recommendations. Using a matching strategy, Pigott and Cowen (2000) examine the effects of teacher–child racial congruence on teacher ratings of academic expectations for kindergarten through fifth-grade students. They find no student–teacher interaction effect on academic expectations of students. Similarly, using baseline data on eighth-grade students from NELS:88 and a student fixed-effect approach, Soland (2013) does not find evidence that race or sex congruence between students and teachers matters for teachers’ postsecondary expectations for students. Although observational, several studies find that Black teachers are more likely than White teachers to (a) think Black students will enroll in or complete college, (b) be optimistic about Black students’ future academic careers, and (c) see future educational potential in Black students (Beady & Hansell, 1981; DeMeis & Turner, 1978; Ehrenberg et al., 1995). Overall, there is some evidence of positive congruence effects for achievement and behavior, although the literature is somewhat mixed, even across rigorous studies. In terms of teacher expectations, the literature is very sparse and mostly observational, with only one study attempting to estimate causal effects using a student fixed-effects design. Not only does my study contribute to the mixed literature on the effects of demographic congruence between teachers and students, but it also provides causal estimates of such effects on understudied outcomes. 1
The present study offers new evidence about the effect of having a demographically similar teacher on teacher expectations for postsecondary attainment and teacher recommendations for advanced courses. These outcomes are important for a number of reasons. First, research suggests that it is possible for teacher expectations to influence how a teacher teaches, which in turn can affect student outcomes (Cooper & Tom, 1984; Jussim & Harber, 2005; McKown & Weinstein, 2002; Rist, 1970; Rosenthal & Jacobson, 1968; Sewell & Hauser, 1972). Once a teacher forms academic expectations for students, he or she may teach in a way that is consistent with those expectations; thus, if differential expectations result in differential treatment, there is the potential for such treatment to result in differential student learning and achievement. Indeed, in their famous study, Rosenthal and Jacobson (1968) provided teachers with false information on student ability, and the students whom teachers thought to be “growth spurters” gained significantly more IQ points during the year. Though nonexperimental, other studies have shown that teacher perceptions of ability in kindergarten can influence achievement in later grades (Rist, 1970), that perceiving strong teacher encouragement leads to additional years of higher education (Sewell & Hauser, 1972), and that stigmatized groups are more likely to confirm negative teacher expectations (McKown & Weinstein, 2002). These studies and others highlight the potential for teacher expectations to lead to self-fulfilling prophecies. A self-fulfilling prophecy is “a false definition of the situation evoking a new behavior which makes the originally false conception come true” (Merton, 1948). In their 2005 review, Jussim and Harber conclude that self-fulfilling prophecies are real and are typically small, although they can sometimes be quite large, especially for stigmatized social groups. Furthermore, such self-fulfilling prophecies could lead to a reproduction of inequality if teachers are forming their expectations on the basis of negative stereotypes.
Although teacher expectations might be instrumental in influencing student outcomes through the self-fulfilling prophecy framework, a more direct route for influencing outcomes is through course recommendations. Being recommended for advanced courses is likely to influence subsequent enrollment in advanced courses, although no studies of which I am aware have investigated this relationship. The ELS:02 data set does ask students about enrollment in Advanced Placement (AP) and International Baccalaureate (IB) courses (which are not offered by all high schools), but they do not ask about enrollment in other honors or advanced courses. Furthermore, the questions are asked in 10th grade (many AP and IB classes are junior- and senior-level classes), and the survey questions are not subject specific. Given those caveats, there is a positive correlation of 0.21 between recommendations and AP/IB enrollment in my analytical sample, and 38% of students who were recommended for advanced courses by their math or English teacher were ever enrolled in either AP or IB classes through their sophomore year. In some schools, teachers can clearly influence enrollment in advanced courses because they are gatekeepers for the courses and students must obtain permission in order to enroll (Hoyt & Sorensen, 2001). Enrolling and completing advanced courses has a potentially powerful impact on whether and where students are admitted to college. In 2000, a survey of 962 public and private colleges and universities revealed that AP course enrollment was one of the top five factors in college admissions (Breland, Maxey, Gernand, Cumming, & Trapani, 2002). To the extent that postsecondary schooling affects adult outcomes, bias in teacher recommendations for advanced courses in high school could also perpetuate inequality in longer-term outcomes.
This study makes several important contributions to the literature. First, it uses ELS:02, a relatively recent and nationally representative data set. Thus, the study is more externally valid than studies using administrative data and is also more recent than studies that used other nationally representative data sets (e.g. NELS:88, ECLS-K). Second, it investigates whether student–teacher race and sex congruence influence teacher expectations and also whether such congruencies influence teacher recommendations for advanced courses. Teacher recommendations are practically relevant for future student outcomes and have not been studied as outcomes in the context of K–12 American education. 2 The combination of the sample of 10th graders from 2002 and the outcomes I investigate allow this study to contribute uniquely to the literature. Finally, the evidence from this study comes from a quasiexperimental research design with strong causal warrant that is not threatened by typical nonrandom student–teacher assignments because it compares two teachers’ assessments of the same student.
Data
This article uses data from the base year of the ELS:02, a study designed to monitor the transition of youth from high school to postsecondary education and/or work. To conduct the ELS:02, the National Center for Education Statistics surveyed a nationally representative sample of students in 10th grade beginning in 2002. Those students were then followed through multiple survey waves, the most recent of which was collected in 2012. This study uses the base year survey, which includes survey responses from students, parents, math and English teachers, school administrators, and school librarians, as well as the results of study-administered math and reading student assessments.
A two-stage sampling design was employed for ELS:02 in which schools were selected first, followed by students within those schools. A national sample of schools was selected based on size and stratified by region and metropolitan status. Of the 1,221 selected schools, 580 public schools and 172 private schools agreed to participate, for a total of 752 schools. With the use of a stratified sampling design to make sure the sample was representative by race, 26 tenth graders within each school were randomly selected. For each student in the sample, surveys were given to both his or her math teacher and English teacher.
The ELS:02 student data set contains 15,362 students, but to construct the analytic data file for this article, a number of restrictions are implemented. First, I restrict the data to public school students only, which excludes 3,323 students from the data set. I focus on public schools because their similar governance and regulations allow for a cleaner interpretation and discussion of the effects and policy implications. Second, I limit the sample to Black, White, Hispanic, or Asian students and teachers. American Indian and multiracial students are unlikely to have a same-race teacher, and the exclusion of these categories again allows for a cleaner interpretation of the same-race effects. No students are missing data on race; however, some teachers are missing these data due to nonresponse or when no sampled teacher was identified because the student was not taking a math and/or English course. There are 706 American Indian and multiracial students who are dropped, 356 who are dropped because their teacher is American Indian or multiracial, and an additional 3,353 students who are dropped because there is missing information about teacher race. Similarly, some teachers are missing data on gender, so they are dropped. Once the exclusion on race has been made, the exclusion on gender drops an additional 48 students. Last, the model used in this study requires that each student have a response from both his or her English teacher and math teacher. Since I am interested in two separate questions, this results in a different sample for each question. Out of the 7,576 students in the sample with demographic information for both teachers, 6,321 students have responses from both teachers for the question related to how far the teacher expects the student to go in school, and 5,736 have responses from both teachers for the question regarding whether the teacher has recommended the student for advanced classes. When using student–teacher pairs as the unit, there are 12,642 and 11,472 observations for each survey question, respectively. The restrictions I have made to create the final analytic sample affect the external validity of my results. In particular, of public school students, the students in the sample are more likely to have a higher socioeconomic status, to have higher test scores in math and reading, and to be White.
There are three outcome measures that come from two different survey questions. The first question asks, “How far in school do you expect this student to get?” The response options are less than high school graduation, high school graduation or GED only, attend or complete 2-year college or school, attend 4-year college but not complete, graduate from college, obtain master’s degree or equivalent, and obtain PhD, MD, or other advanced degree. For ease of model interpretation and because recent policy discussions are focused on postsecondary attainment and college degree completion gaps, I code this question into two separate binary variables. The first variable is for whether the teacher thinks the student will complete more than high school, and it takes on a value of 1 if the teacher expects the student to go further than high school (attend or complete a 2-year college or beyond) and a 0 if the teacher expects that student to not graduate high school or graduate high school only. The second variable is for whether the teacher thinks the student will graduate from college or more, and it takes on a value of 1 if the teacher expects the student to graduate college, obtain a master’s degree or equivalent, or obtain a PhD, MD, or other advanced degree (the last three categories) and a 0 otherwise. The second survey question asks, “Have you recommended this student for academic honors, advanced placement, or honors classes?” This question is simply coded as a 1 if the teacher responded yes and a 0 if the teacher responded no. Besides the outcome variables and the same-race and same-sex variables, my models also include additional student and teacher controls that are available in the data set. Specifically, I use teacher experience, educational attainment, and type of teacher certification. Teaching experience is the total number of years spent teaching in a K–12 classroom, including the current year. Teacher educational attainment is captured by a binary variable that takes on a value of 1 if the teacher has any degree higher than a bachelor’s degree and a 0 if not. I also use a binary variable indicating whether the teacher has state certification (versus probationary, temporary, or no certification) in his or her subject. Finally, students took study-administered math and English tests in the spring of 2002, which are included in the preferred model.
Table 1 shows the descriptive statistics for the analytic sample of 10th-grade students and their teachers. Over three quarters of students have teachers who think they will complete more than high school, and about 50% have teachers who think they will graduate college or more. Fewer than one fifth of the students are recommended for advanced courses. Half of the sample has a same-sex teacher, and two thirds of the sample has a same-race teacher. Unsurprisingly, the majority of teachers are female (around 67%) and White (89%). In terms of student demographics, the analytic sample is roughly 60% White, 15% Hispanic, 15% Black, and 10% Asian. Importantly, the effects identified in this article leverage variation in gender and race congruence within a student across teachers. For example, only the students who have one male and one female teacher are contributing to the estimates of the same-sex parameter. The last two rows of Table 1 show how common it is to have one congruent teacher and one incongruent teacher. Roughly 45% of students have one gender-congruent teacher and one gender-incongruent teacher, and around 11% of students are in this scenario with regard to race.
Descriptive Statistics for the Analytic Sample

Note. Sample includes public school students and teachers who indicated they are Asian, Black, Hispanic, or White. HS = high school; AP = advanced placement.
Table 2 provides information on the same-sex and same-race indicators for subgroups of the analytic sample. As expected, a higher proportion of female students have a same-sex teacher since the majority of teachers are female. Analogously, White students are more likely to have a same-race teacher since most teachers are White. Across math and reading, the proportions of same-sex and same-race are similar. In regard to variation in congruence, Black and Hispanic students are more likely to have one race-congruent and one race-incongruent teacher than are Asian and White students.
Descriptive Statistics for the Analytic Sample by Subgroup

Note. Sample includes public school students and teachers who indicated they are Asian, Black, Hispanic, or White.
Method
Empirical Strategy
The structure of the ELS:02 data allows me to compare teacher expectations of the same student for two teachers both teaching that student. This within-student comparison conditions out all observed and unobserved subject-invariant student characteristics, allowing me to estimate the effect of having a same-race or same-sex teacher on teacher expectations and recommendations for advanced courses. To implement this within-student approach, I use an FD specification, following Dee (2005). Such a specification is preferred to simple cross-sectional analyses, which may suffer from bias due to typical nonrandom sorting of students to teachers. Other types of sorting can bias the FD model, and these potential threats are discussed in the Robustness Checks section.
The FD specification comes from differencing two cross-sectional models in which teacher expectations or recommendations for advanced courses are a function of student characteristics, teacher characteristics, and whether the student and teacher share the same race and sex. Such a specification is shown in Equation (1), where
The same equation applies for the expectations and recommendations of English teachers:

If I attempted to estimate the parameters of interest,

Now, using Equation (3), I can estimate
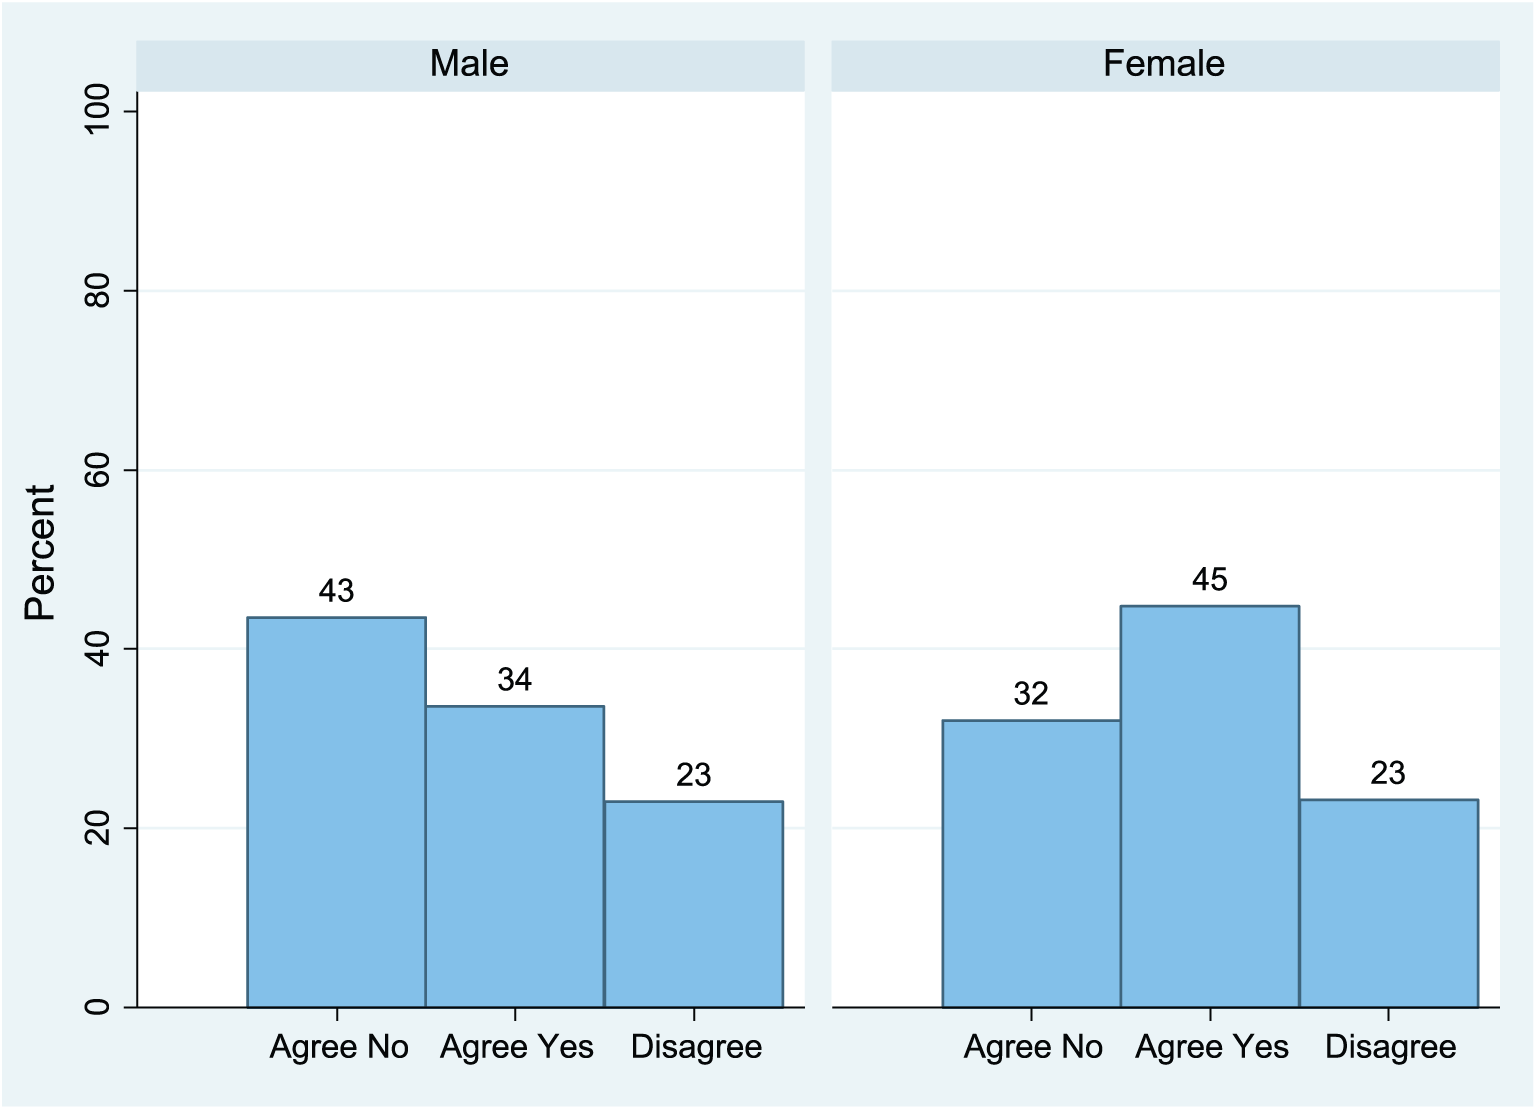
In this model, the intercept controls for level differences in teacher expectations and recommendations across math and English. The dependent variables of interest in Equations (1) and (2) are binary, so their values in Equation (3), the FD specification, can be only −1, 0, or 1. For example, a value of −1 means that the math teacher did not think the student would graduate college or more, but the English teacher did. A value of 0 signifies that the two teachers agreed, which means they both thought the student would graduate college or more, or they both thought the student would not. Finally, a value of 1 means that the math teacher thought the student would graduate college or more, but the English teacher did not. Figures 1 through 6 show the variation in agreement rates between teachers for the three outcomes of interest by student sex and race. For example, for males in the sample, 64% of teacher pairs agreed that the student would complete more than high school, 15% agreed that the student would not go further than high school, and 21% disagreed. It should be underscored that this approach does not rely on how teacher characteristics influence teacher expectations and recommendations of different students. I am relying on variation by teacher characteristics of their expectations and recommendations of the same student.

Agreement rate of teacher pairs about whether a student will complete more than high school, by student sex.

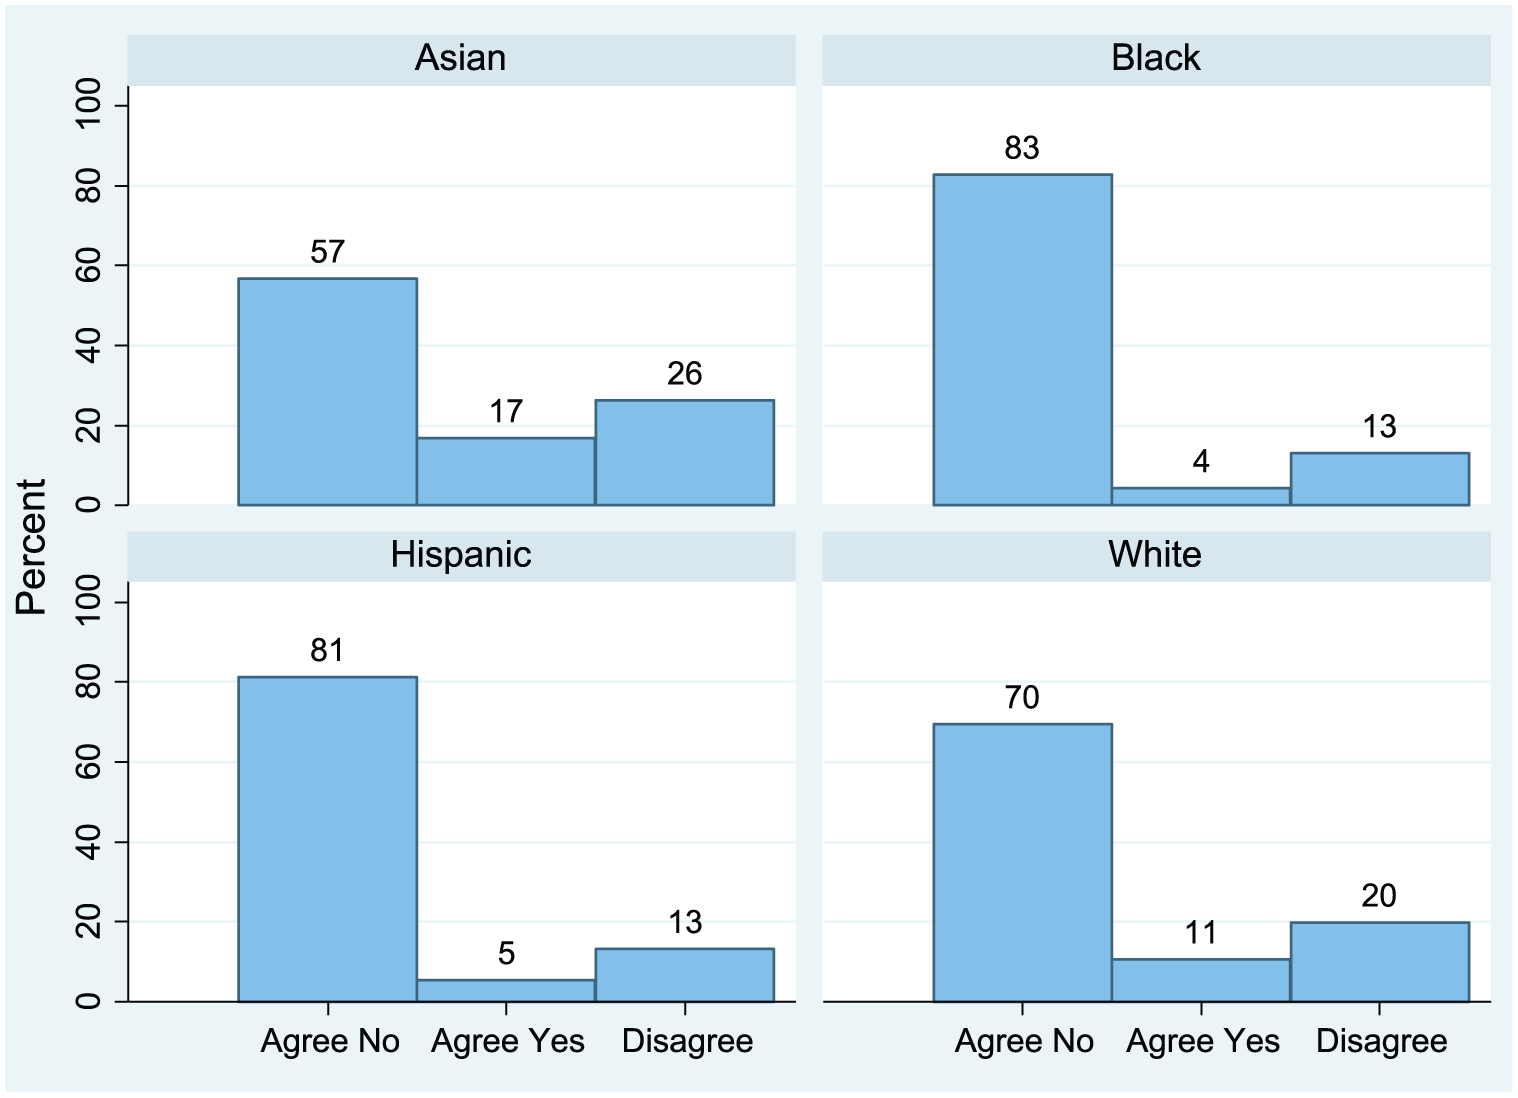
Agreement rate of teacher pairs about whether a student will complete more than high school, by student race.
Agreement rate of teacher pairs about whether a student will graduate college or more, by student sex.

Agreement rate of teacher pairs about whether a student will graduate college or more, by student race.

Agreement rate of teacher pairs about recommending a student for advanced courses, by student sex.
Agreement rate of teacher pairs about recommending a student for advance courses, by student race.
The FD specification (Equation [3]) is estimated using ordinary least squares and acknowledges the nested structure of the data by allowing for heteroskedasticity clustered at the school level. This results in larger standard errors than clustering at the student level and is thus a more conservative approach. 3
Robustness Checks
The model described above has strong causal warrant but could still suffer from bias. The within-student identification strategy controls only for nonrandom sorting of students to teachers that is subject invariant. Thus, internal validity threats to this design would have to come from nonrandom sorting that varies by subject. In other words, students would need to have subject-specific propensities for generating higher or lower expectations that are related to their propensity of being assigned a same-race or same-sex teacher. Threats do not come from teachers having higher expectations for females, for example. One possibility that could create a legitimate source of bias is if males who are somehow more likely to generate low expectations in a given subject are more likely to be assigned to a male teacher of that subject. This type of sorting would lead us to underestimate the effects of a same-sex teacher. Conversely, if females who are more likely to generate lower expectations in a given subject are more likely to be assigned to a male teacher of that subject, we might overestimate the effects of the same-sex teacher.
Although I cannot test whether male teachers in a given subject are assigned female students who are lower performing in that subject, for example, I can test the robustness of the model to the inclusion of subject-specific student test scores. Ideally, I would control for pretreatment measures of ability, but the test scores available in the data set are measured near the end of 10th grade and could therefore have been affected by students’ exposure to their 10th-grade teachers. Nonetheless, this check is important because achievement is highly correlated with teacher expectations and recommendations, and student differences in aptitude for different subjects could be related to how students are sorted to teachers. Controlling for these objective measures of performance helps to ensure that any observed congruence effects are not simply due to variation in student achievement across subjects.
Another form of bias could come from omitted variables that vary within students and across their two teachers. For example, teachers with more experience are more likely to have higher schooling expectations for their students, so if there is purposive assignment of students to more experienced teachers in a given subject, my results could be biased. If female teachers (or teachers of a given race) are more likely to have more experience, and I do not control for this in the FD specification, I could be overstating the extent to which female teachers (or teachers of a given race) have higher expectations for their students. I can test whether this type of sorting might be occurring by estimating auxiliary regressions in which the dependent variable is a measure of teacher background and the independent variables are the same-sex and same-race indicators. For teacher experience, having a graduate degree, and having a state certification, none of the same-sex or same-race parameters are significantly different from zero, providing evidence that students are not being differentially sorted to teachers on those dimensions. Nonetheless, I add these three teacher controls to the model. Although nonrandom subject-specific sorting of students to teachers and classrooms may bias the results, the inclusion of subject-specific student achievement and teacher traits helps to mitigate this concern.
Findings
My findings show how student and teacher characteristics affect how far a teacher thinks a given student will go in school and whether that teacher recommends the student for advanced courses. The results from the FD specification (Equation [3]) for each of the three outcomes are shown in separate panels in Table 3. As a comparison point, I present possibly confounded results that stack Equation (1) and Equation (2) in Appendix Tables A1, A2, and A3. For teacher expectations, there is no statistically significant effect of being assigned a demographically similar teacher. There is a small and marginally significant (at the .10 level) effect of having a same-sex teacher on being recommended for advanced courses. However, the statistical significance of this effect is not robust to a conditional fixed-effect logit specification.
Estimates of the Determinants of Teacher Expectations and Recommendations

Note. Parameter estimates for each panel come from a separate first-difference regression. Controls include teacher race, whether the teacher has a graduate degree, years of teaching experience, whether the teacher is state certified, and student achievement test scores. Standard errors are clustered at the school level.
p < .05. **p < .01. ***p < .001.
The results presented thus far come from the full ELS:02 sample (with the restrictions documented in the Data section), meaning they assumed that the effects of same-race and same-sex teachers were the same across all students; however, it might be the case that such effects differ for students of different sexes and races (e.g., Jussim, Eccles, & Madon, 1996). To examine the potential heterogeneity of effects, I follow Dee (2005) and present estimates from the FD models separately by subgroup. 4
Table 4 presents the coefficients on same-sex and same-race teacher for each outcome and subgroup separately. The models include teacher race, teacher experience and credentials, and student achievement. The same-race teacher effects for Blacks and Hispanics are relative to White teachers, and the same-race teacher effects for White students are shown relative to Black teachers and Hispanic teachers separately. There is a large and significant effect of having a same-race teacher on expectations to complete more than high school for Black students. Black students with a Black teacher are 14.3 percentage points more likely to be expected to complete more than high school than if they have a White teacher. The next panel shows that for expectations to graduate college or more, the same-race effects are positive 13.5 and 11.3 percentage points for Black and Hispanic students, respectively. None of the point estimates are statistically significant at the .05 level for recommendations for advanced courses.
Estimates of the Determinants of Teacher Expectations and Recommendations Separately by Subgroup

Note. Parameter estimates in each column and panel come from a separate first-difference regression. The effect of a same-race teacher for the Black and Hispanic subgroups are both relative to a White teacher. The same-race effects for White students are shown relative to Black teachers and Hispanic teachers separately. Controls include teacher race, whether the teacher has a graduate degree, years of teaching experience, whether the teacher is state certified, and student achievement test scores. Standard errors are clustered at the school level.
p < .05. **p < .01. ***p < .001.
The results in Table 4 show positive and statistically significant findings for Black and Hispanic students, but when the models are run separately by subgroup, it is no longer possible to separate the effect of a same-race teacher with the effect of a given-race teacher. For example, when the sample is limited to only Black students, indicators for same-race and Black teacher become collinear. Thus it is possible that the 14.3 percentage point effect for Black students in Table 4 could simply be due to having a Black teacher, not the interaction effect of a Black student having a Black teacher. One way to assess this concern is to compare the results for Black students to those of White students. We see that White students also get a boost from having a Black teacher relative to a White teacher (4.6 percentage points), but this point estimate is much lower than for Black students, suggesting there is something unique to the Black student–Black teacher interaction.
More formally, the difference between these subgroups can be tested by estimating a model using the stacked data set that interacts the race and sex of the student with the race and sex of the teacher. The omitted categories are male–male and White–White. Table 5 shows that Black teachers, relative to White teachers, are 11.1 percentage points more likely to think a Black student will complete more than high school relative to a White student. One way of understanding the magnitude of this effect is to benchmark it against the expectations gap that we see in the data. For example, the cross-sectional results from Appendix Table A1 (column 3) indicate that Black students are 15.2 percentage points less likely to be expected to complete more than high school than are White students. Thus, the implied effect of a same-race teacher is over 70% of this race gap.
Estimates of the Determinants of Teacher Expectations and Recommendations Relative to Omitted Category: White Student, White Teacher

Note. The parameter estimates in each panel come from a separate regression using the stacked data set in which student and teacher race are interacted. Controls include teacher race, whether the teacher has a graduate degree, years of teaching experience, whether the teacher is state certified, and student achievement test scores. Standard errors are clustered at the school level.
p < .05. **p < .01. ***p < .001.
In the next outcome, however, the effect of a Black teacher with a Black student on expectations to graduate college or more is not significant in the interaction model. This suggests that the results for Black students shown in Panel 2 of Table 4 may have been driven mostly by Black teachers generally having higher expectations than White teachers (as evidenced in Appendix Table A2). The same-race effect for Hispanic students on expectations to graduate college or more remains statistically significant in the interaction model; however, the statistical significance of this finding is not robust to the conditional logit specification.
Although the interaction model helps to disentangle teacher effects from congruence effects, it raises another issue. It is possible that the schools in which Black students have teacher race variation are different from schools in which White students have teacher variation in ways that influence the congruence effect estimates. In other words, there may be unobservables that are correlated with teacher race that are different across the types of schools that create different amounts of bias. To assess this concern, I check whether the estimates are similar for two separate samples. The “overlap” sample is made up of students in schools where there is at least one Black and one White student with teacher race variation, and the “non-overlap” sample is made up of students in schools where this is not the case. I create the samples separately for Black and White students and for Hispanic and White students. Table 6 shows the results. The same-race effect for Black students in the overlap sample is 16.7 percentage points for expectations to complete more than high school. For the non-overlap sample, the point estimate is less than half the size and not significant. Thus, in schools where there are both Black and White students with Black and White teachers, there is a positive effect on expectations for Black students who have Black teachers, but the results cannot reveal why this is different in schools without overlap. For expectations to graduate college or more, the same-race effects for Hispanics are similar and large for both samples but are not statistically significant due to the decreased sample size.
Estimates of the Determinants of Teacher Expectations and Recommendations Relative to Omitted Category (White Student, White Teacher) for Overlapping and Non-Overlapping School Samples

Note. Each parameter comes from a separate regression using the stacked data set in which student and teacher race are interacted. The overlap sample for the Black-Black parameter includes Black and White students with Black and White teachers in schools where there is at least one Black and one White student with teacher race variation. The non-overlapping sample is the complement of the overlapping set of schools. Controls include teacher race, whether the teacher has a graduate degree, years of teaching experience, whether the teacher is state certified, and student achievement test scores. Standard errors are clustered at the school level.
p < .05. **p < .01. ***p < .001.
Conclusion
This article started by noting that student–teacher interactions may affect teacher expectations and recommendations, which might, in turn, be instrumental in influencing student outcomes. Teacher expectations are especially salient given their potential to become self-fulfilling, and recommendations for advanced courses are relevant given their potential to influence student course taking and the Obama administration’s emphasis on college readiness. This study therefore sought to examine two key determinants of teacher expectations and recommendations: sex and race congruence of the student and teacher. Using the ELS:02 data set, I address typical nonrandom sorting of students to teachers by comparing two different teachers’ expectations and recommendations for the same student.
Across the whole sample, there is little evidence that having a same-race or same-sex teacher increases the likelihood of being expected to complete more schooling or being recommended for advanced courses. The subgroup analyses reveal surprisingly large and statistically significant effects on expectations for Black students that are robust to many different specifications. Specifically, the same-race effect for teacher expectations to complete more than high school ranges from 11 to 17 percentage points.
Importantly, although my estimates have a strong causal warrant, they cannot reveal why or how demographic match between students and teachers influences expectations for educational attainment. Teachers may simply have unintended biases in their relationships with students that could possibly be attenuated through teacher training and professional development initiatives. Another potential explanation is that students behave or perform differently when they are assigned a same-race teacher, in which case recruiting and retaining underrepresented teachers may be a partial solution. More research on racial interactions within classrooms is needed to disentangle the potential mechanisms and thus more clearly guide policy aimed at improving equity in educational outcomes.
Footnotes
Appendix
Estimates of the Determinants of Teacher Recommendations for Advanced Courses

| Cross-sectional estimates |
First-difference estimates |
|||||
|---|---|---|---|---|---|---|
| Independent variable | (1) | (2) | (3) | (4) | (5) | (6) |
| Same-sex teacher | −0.006 | −0.002 | −0.001 | 0.021* | 0.019* | 0.015 |
| (0.008) | (0.008) | (0.008) | (0.009) | (0.009) | (0.009) | |
| Same-race teacher | −0.001 | 0.011 | 0.010 | 0.015 | 0.017 | 0.017 |
| (0.015) | (0.015) | (0.016) | (0.019) | (0.020) | (0.020) | |
| Asian teacher | −0.036 | −0.008 | 0.005 | −0.030 | −0.038 | −0.031 |
| (0.043) | (0.047) | (0.049) | (0.045) | (0.048) | (0.049) | |
| Black teacher | −0.037* | −0.070*** | −0.065** | −0.007 | −0.001 | −0.001 |
| (0.018) | (0.021) | (0.022) | (0.025) | (0.027) | (0.026) | |
| Hispanic teacher | 0.012 | −0.017 | −0.002 | −0.015 | −0.017 | −0.014 |
| (0.029) | (0.027) | (0.028) | (0.025) | (0.026) | (0.027) | |
| Female teacher | 0.030** | 0.022 | 0.023 | 0.024* | 0.025* | 0.023* |
| (0.011) | (0.012) | (0.012) | (0.012) | (0.012) | (0.012) | |
| Asian student | 0.097*** | 0.083** | 0.082** | |||
| (0.025) | (0.027) | (0.026) | ||||
| Black student | −0.091*** | −0.126*** | −0.124*** | |||
| (0.017) | (0.017) | (0.017) | ||||
| Hispanic student | −0.085*** | −0.092*** | −0.091*** | |||
| (0.019) | (0.021) | (0.022) | ||||
| Female student | 0.077*** | 0.068*** | 0.067*** | |||
| (0.009) | (0.009) | (0.009) | ||||
| Graduate degree | 0.031* | 0.022 | 0.023 | |||
| (0.013) | (0.013) | (0.013) | ||||
| Teacher experience | 0.002*** | −0.001 | −0.000 | |||
| (0.001) | (0.001) | (0.001) | ||||
| State certification | 0.007 | −0.009 | −0.015 | |||
| (0.017) | (0.016) | (0.016) | ||||
| Student achievement | 0.007*** | |||||
| (0.001) | ||||||
| Constant | 0.178*** | 0.453*** | 0.424*** | −0.053*** | −0.050*** | −0.054*** |
| (0.020) | (0.020) | (0.026) | (0.009) | (0.009) | (0.009) | |
| N | 11,472 | 11,472 | 11,149 | 5,736 | 5,435 | 5,435 |
| School fixed effect | No | Yes | Yes | — | — | — |
| Student fixed effect | No | No | No | Yes | Yes | Yes |
Note. Standard errors are clustered at the school level.
p < .05. **p < .01. ***p < .001.
Acknowledgements
Preparation of this manuscript by Lindsay Fox was supported in part by the Institute FOR Education Sciences (IES), U.S. Department of Education, through grant #R305B090016 to Stanford University. The author wishes to thank Tom Dee, Sean Reardon, and Susanna Loeb for their valuable feedback on earlier versions of this paper. Please direct all questions to
Notes
Author
LINDSAY FOX is a doctoral candidate in the Economics of Education program and an Institute of Education Sciences fellow at Stanford University’s Center for Education Policy Analysis. Her research interests include teacher labor markets and effectiveness, inequality, and methods for causal inference.