
Abstract
Current spread in cochlear implants (CIs) degrades spectral resolution and speech perception by broadening neural excitation. Asymmetric pulses have been proposed to mitigate this issue; however, their practical application in CI strategies remains challenging owing to the potential temporal overlap between pulses from adjacent channels. In the present study, we employed a computational model to evaluate the effects of charge-balanced asymmetric pulses with varying second-phase durations on the spread of neural excitation (SOE) and neural activation. The SOE was assessed under different electrode–auditory nerve fiber (ANF) distances to explore the interaction between the pulse configuration and the neural interface. At greater electrode–ANF distances, increasing the second phase lowers the stimulation thresholds effect. However, at shorter distances, a prolonged second-phase duration induces neural inhibition and degraded neural activity patterns. Therefore, the efficacy of asymmetric pulses in reducing the SOE depends on the electrode position. Furthermore, a moderate increase in the second-phase duration may offer a promising direction for optimizing CI stimulation and enhancing speech perception.
Introduction
Cochlear implants (CIs) restore auditory perception in individuals with severe-to-profound sensorineural hearing loss. An array of electrodes in the CI directly stimulates the auditory nerve to elicit an auditory perception. Although speech perception with CI has significantly improved, there are still differences in performance between individuals (Won et al., 2007). Current spread within the cochlea degrades spectral ripple discrimination, and remains an important limitation in current CIs (Bierer, 2010; Jones et al., 2013; Yang et al., 2020). This current spread results in the unintended spread of neural excitation (SOE), or reduced/masked neural responses due to current spread, resulting in overlapping excitation and channel interactions among auditory nerve populations. Thus, SOE causes poor spectral sensitivity and reduces the overall speech perception.
Previous studies indicate that neural excitation during biphasic stimulation is influenced by the amplitude and duration of individual phases rather than by phase order under certain conditions, with longer, lower-amplitude phases often serving a charge-balancing role to prevent tissue damage (Frijns et al., 1996; Merrill et al., 2005; Shepherd & Javel, 1999). Although CI systems predominantly use charge-balanced symmetric biphasic pulses to stimulate the auditory nerve fiber (ANF) to ensure stimulation efficacy and tissue safety, variations in pulse configurations have been studied to overcome the current spread issue. Prior studies have demonstrated that manipulated pulses showing variations in polarity (anodic- vs. cathodic-leading), rate, and phase duration influence neural responses, resulting in lower threshold (T) and comfortable (C) stimulation levels compared to symmetric biphasic pulses, as evidenced by previous physiological investigations of electrically stimulated ANFs (Miller et al., 2001; Shepherd & Javel, 1999) and psychophysical assessments in CI users (Carlyon et al., 2015; Chatterjee & Kulkarni, 2014; Macherey et al., 2008; van Wieringen et al., 2008). Frijns et al. (1996) previously used a computational model of an implanted cochlea to show that asymmetric pulses improved spatial selectivity compared to symmetric biphasic pulses. Prior study has also shown that asymmetric pulses reduce neural activation in the auditory cortex, indicating a reduction of channel interaction as a potential approach (Adenis et al., 2024).
Asymmetric pulses with a prolonged second phase may help to limit the spread of excitation, reduce channel interactions, and improve channel selectivity in CI. However, most studies have assessed the threshold and channel interactions using a single-pulse paradigm. Incorporating asymmetric pulses into the speech-coding strategies of CI devices, including the continuous interleaved sampling (Wilson et al., 1991) and the advanced combination encoder (ACE) (Vandali et al., 2000) strategies, remains challenging because the prolonged second phase can temporally overlap with the subsequent pulses at each channel. Therefore, characterizing the relationship between speech stimuli using asymmetric pulses and their impact on the spatial selectivity and speech perception of CI users is essential.
We used a computational model to investigate how asymmetric pulses, implemented in a CI speech processor, influence the SOE. The current spread was systematically controlled by adjusting the electrode–ANF distance, and the impact of the second-phase duration on the SOE was assessed accordingly. Cochlear implant performance can be effectively evaluated using a multifaceted stimulus paradigm that captures the physiological encoding of auditory signals and the relevant processing of complex acoustic inputs. The combined use of constant-amplitude pulse trains and speech stimuli offers complementary insights into the assessment of CI function. Constant-amplitude pulse trains facilitate a controlled and systematic investigation of ANF responses, thereby enabling a detailed analysis of temporal and spatial excitation patterns (Matsuoka et al., 2000; Miller et al., 2008). Speech stimuli reflect real-world listening conditions and can be used to assess the perceptual relevance of neural activation patterns (Runge et al., 2018). Employing these stimulus strategies further provides a comprehensive framework for understanding the influence of the electrode–neuron interface and the pulse shape on SOE in CIs. Accordingly, in the present study, the SOE was quantified by simulating aggregate neural activity elicited by both constant-amplitude pulse trains and speech stimulation across a population of modeled ANFs. For the constant-amplitude pulse train condition, the responses of the neighboring ANFs to the spread current were computed, and the SOE was quantified as the area under the distance-response function. In the speech stimulus condition, neural activity patterns across ANFs were simulated, while the SOE was assessed by evaluating their similarity under conditions with and without current spread. This combined approach enables the quantitative evaluation of CI performance and provides optimization strategies for stimulation parameters. These results have potential implications for fine-tuning CI stimulation strategies to improve speech perception and spectral resolution at the individual level.
Materials and Methods
Simulation of the ANF Response Using an Electrode–Neuron Interface Model
Figure 1(b) presents a schematic overview of the ANFs and stimulation electrodes used to simulate the proposed computational model. The stimulation electrode was modeled based on the Nucleus CI24RE CI (Cochlear Ltd.). The interelectrode distances ranged from 0.4 mm at the apical end to 0.8 mm at the basal end, with an overall electrode array length of 11.7 mm. Each electrode was modeled as a hemispherical structure with a radius of 0.18 mm, thus providing a contact surface area of 21 mm2. A total of 151 ANFs were positioned uniformly at 0.1 mm intervals along with the 15 mm cochlear region covering the electrode array. This ANF interval was selected to provide sufficient spatial resolution to estimate the SOE between the electrodes while maintaining computational efficiency. The stimulation electrodes were placed above the 9th active node of the ANF along with the y-axis. The electrode-ANF distance was defined as the distance between the center of the stimulation electrode and the surface of the 9th active node of the ANF. The distance of de,f was systematically varied along with the z-axis at (0.23, 0.68, 1.18, 1.68, and 2.08) mm to investigate its influence on the ANF responses to asymmetric pulses. These variations were implemented to examine the impact of the electrode–neuron interface on the speech perception performance.
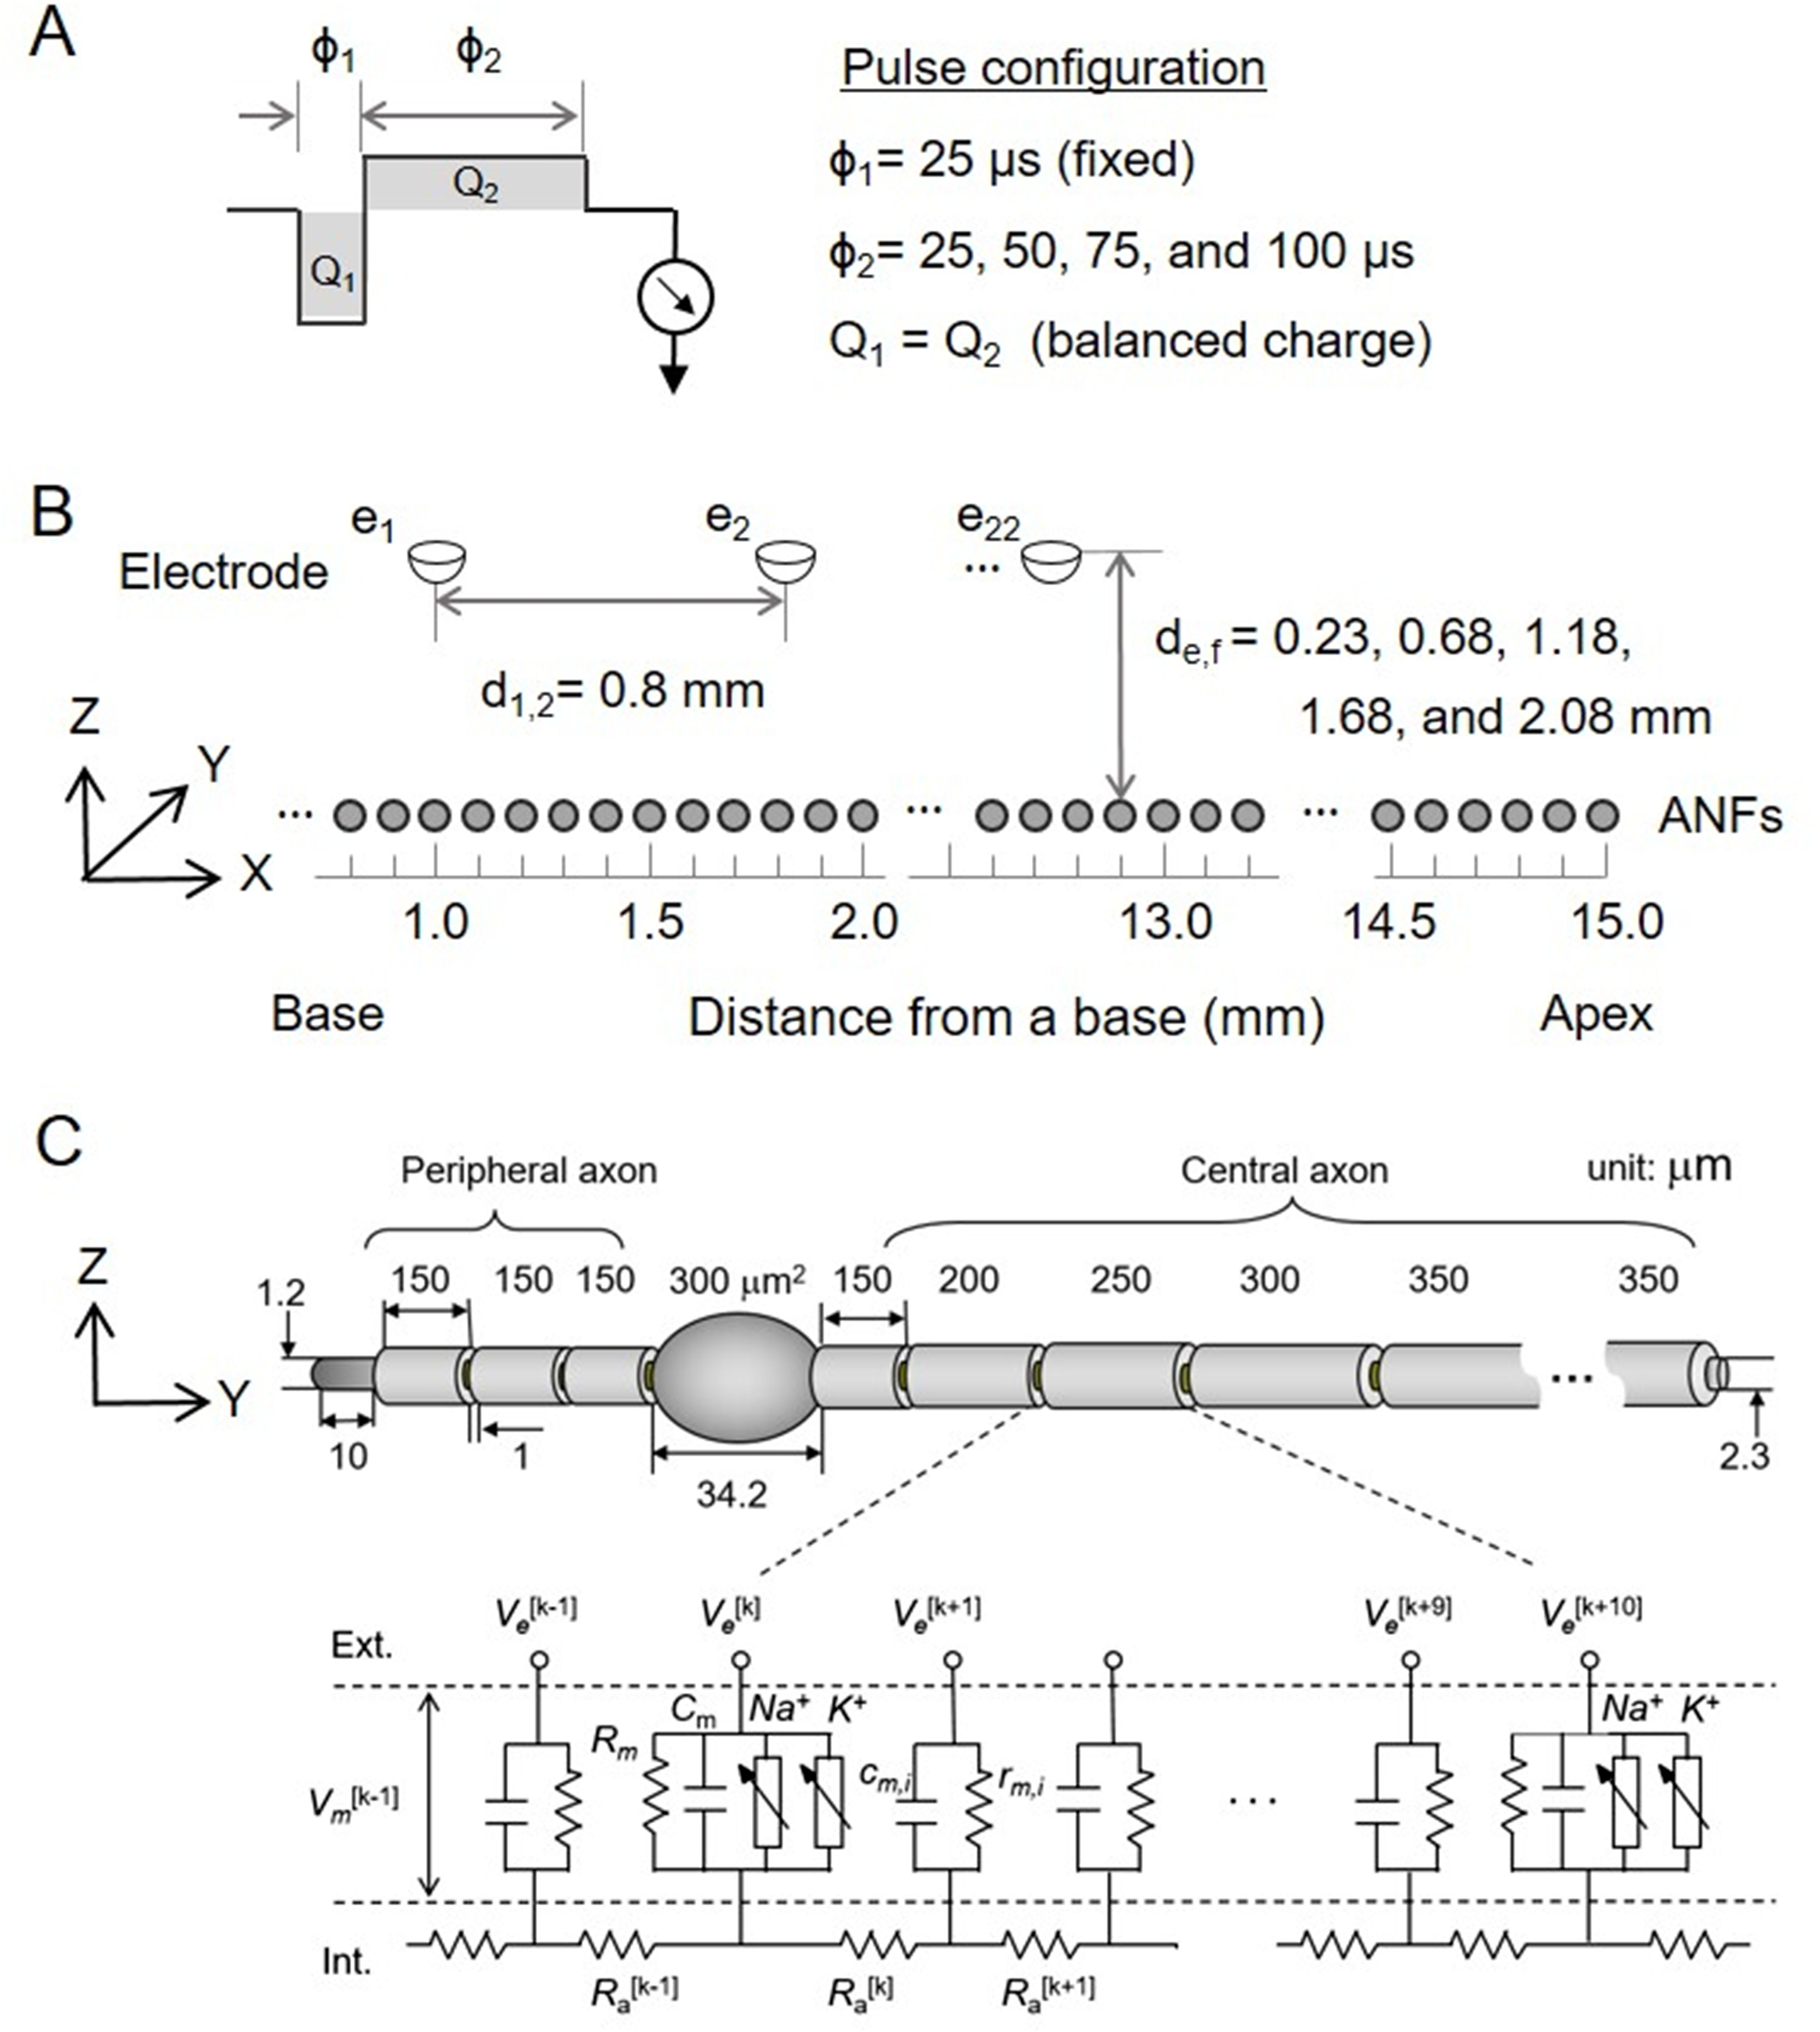
Schematic representation of the electrode–neuron interface of the computational model. (A) Pulse configuration of cathodic-leading biphasic pulses. (B) Diagram of the auditory nerve fibers (ANFs) and stimulation electrodes used in the computational model. The 151 ANFs were uniformly spaced along with the x-axis, with interelectrode intervals ranging 0.4–0.8 mm, based on the Nucleus CI24 implant configuration. (C) Anatomical features of the ANF model, comprising a peripheral axon, cell body, and central axon, with voltage-dependent ion channels located at the nodes of Ranvier. The circuit diagram at the bottom illustrates the nodal components, including the extracellular potential computation.
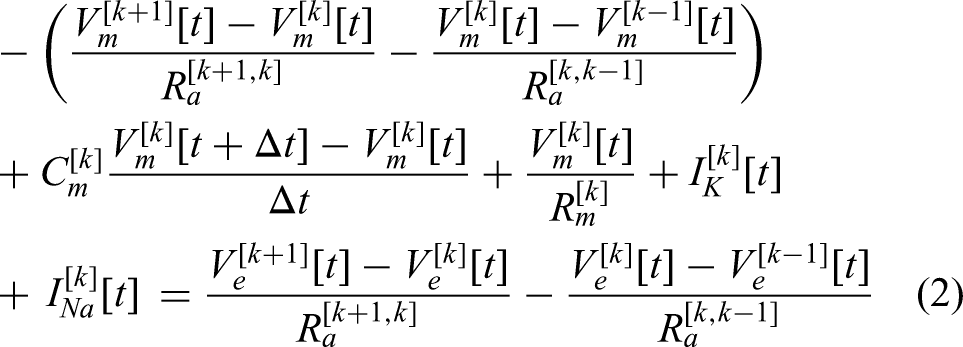
Each ANF response was measured using a computational ANF model developed by Woo et al. (2009, 2010). Figure 1(c) presents an overview the ANF computer model, which can be briefly summarized as follows: Each ANF model is composed of a peripheral axon with three internodes, the cell body, and the central axon with 20 internodes. Each internode includes voltage-dependent N+ and K+ ion channels, and the neural adaptation component is incorporated into the K+ channel. The current at node k of the ith ANF compartment at time t was calculated by summing the spread currents, as follows:


Pulse-Train Stimulus Paradigm and SOE Index
Auditory nerve fiber responses were obtained using two types of sustained stimulus paradigms that can explore the neural integration effect of electrical stimulation. Table 1 summarizes the two relevant paradigms: constant-amplitude pulse trains and spoken word stimuli. In the pulse-train paradigm, constant-amplitude pulse trains of 200 ms duration were presented at a rate of 900 pulses per second (pps). Pulse trains consist of cathodic-first asymmetric charge-balanced biphasic pulses. The duration of the first cathodic phase (ϕ1) of the biphasic pulses was fixed at 25 µs, while the duration of the second anodal phase (ϕ2) was varied between values of 25, 50, 75, and 100 µs (Figure 1(a)). The amplitude of the second anodal phase was adjusted for charge balancing (Q1 = Q2), so that the cathodic phase has a higher amplitude and the anodic phase has a longer duration to maintain the overall charge balance with the second-phase duration of 50, 75, and 100 µs. The amplitude of the pulse trains indicates that of the first cathodic phase.
Summary of the Stimulus Protocols Used in This Study.

ACE = advanced combination encoder.
Two sustained stimulation were used: Constant-amplitude pulse trains and a spoken word “choice.”
To ensure sustained electrical stimulation, it is essential to consider temporal neural integration. To assess the effects of neural adaptation, the neural excitation function across ANF positions was evaluated at two temporal intervals: The ANF responses to a 900 pps pulse train were evaluated in an early onset window of 0–12 ms, as well as a later steady-state window of 100–200 ms after pulse train onset (Zhang et al., 2007). Each response curve was normalized to the peak response of the central ANFs, rather than by the response area associated with loudness. Peak-based normalization emphasizes spatial current spread and unintended neural excitation relative to the center (target) nerve population across stimulation conditions. The SOE was quantified by computing the area under the normalized neural excitation function across the ANF positions, referred to as the SOE index. The normalized neural excitation function and corresponding SOE index were computed for each interval. A larger SOE index indicates a broader excitation due to current spread and is therefore less specific.
Spoken Word “Choice” Stimulus Paradigm and Neurogram Similarity
For the spoken word stimulus paradigm, the 8-of-22 ACE strategy at a rate of 900 pps per channel (pps/ch), a common sound processing strategy in Cochlear™ devices, was employed to compute the electrical pulse trains. The word “choice” was selected as a spoken word stimulus because it contains diverse phonetic features, such as an affricate, a mid-back diphthong, and a voiceless fricative, enabling assessment across a broad speech-spectral range. Its pronounced spectral fluctuations further make it particularly suitable for evaluating how variations in the electrode–ANF distance and stimulation-pulse asymmetry influence the neural responses of the ANF population.
The T and C current levels, which are essential for ACE strategy implementation, were set to cover the (10%–70%) range of the stimulus–response function, which was comparable to the psychophysical loudness scaling of T (level 1 out of 10 possible levels) and C (level 7 out of 10 possible levels) used in clinics (Wolfe, 2017). The stimulus-response function was further derived from the onset (0–12) ms of a single ANF stimulated by a pulse train at 900 Hz (Miller et al., 2008; Woo et al., 2010).
Figure 2(a) and (b) shows an example of the spectrogram of the spoken word “choice,” and the corresponding electrodogram (a two-dimensional time-electrode representation that is constructed by combining current levels from 22 electrodes), respectively. The electric current over time for each of the 22 electrodes is calculated using the ACE strategy. Figure 2(c) presents an example graphical neural discharge pattern generated based on a post-stimulus time histogram, with a bin width of 4 ms and 30 repetitions. The ordinate and abscissa denote the electrode number (left, in which a lower number is responsible for a higher frequency; and right, the distance from the cochlear base) and the time after word onset, respectively. This two-dimensional graphical representation of the neural response rate in color is referred to as a neurogram.

Spectrogram, electrodogram, and neurogram of the spoken word “choice.” (A) The spectrogram of the spoken word “choice.” (B) The corresponding electrodogram, showing the electrical pulse sequences across 22 electrodes using the advanced combination encoder (ACE) strategy. (C) The neurogram generated from post-stimulus time histograms (PSTHs), with the neural response rate represented by color intensity. The reference neurogram was derived from symmetric biphasic pulse stimulation by the current spread-off model.
The SOE in response to the spoken word “choice” stimulus was quantitatively evaluated by comparing a test neurogram generated under different conditions with the reference (ideal) neurogram. This reference neurogram contains the excitation pattern generated using a symmetric biphasic pulse with a 25-µs phase duration, with a minimum electrode–ANF distance of 0.23 mm, and no current spread condition. The “no current spread condition” model was implemented by constraining equation (1) such that activation occurs only when j = i. This ensures that each stimulus electrode influences only the directly underlying ANF, not the adjacent ANFs.
To quantify how a test neurogram (testN) is similar to the reference neurogram (refN), neurogram similarity (NSIM) was computed based on the structural similarity index using image-based metrics of luminance (l) and contrast (s) as follows (Hines & Harte, 2012; Yang et al., 2016):

where µ and σ are the mean and standard deviation of 1 × 3 Gaussian-weighted windows, respectively, and the constants are defined as C1 = (0.01 L)2 and C2 = (0.03 L)2/2, where L is the intensity range of the neurograms. The NSIM index ranges from 0, indicating that the two neurograms are dissimilar, to 1, indicating that the two neurograms are identical. Therefore, a higher NSIM between a test neurogram and a reference neurogram indicates that a test stimulus condition with a specific pulse configuration and neuron interface results in a more confined current spread.
Results
Threshold and Comfortable Level
Figure 3 presents the T and C levels as functions of the second-phase duration across the four electrode–ANF distances of (0.23, 0.68, 1.18, and 2.08) mm. The general linear model analysis revealed significant effects of both second-phase duration and electrode–ANF distance on T levels. Increasing second-phase duration was associated with a significant reduction in T-levels [β = −0.029, p < .001] and C levels [β = −0.035, p < .05], whereas increasing electrode–ANF distance resulted in a significant elevation of T levels [β = 9.45, p = .05] and C levels [β = 9.12, p < .001]. No significant interaction was observed between second-phase duration and electrode–ANF distance on T (p = .84) and C (p = .97) levels. The T and C values were subsequently employed to simulate the ANF response to electrical stimulation with changes in the parameters in this study.

Threshold (T) (gray circle) and comfortable (C) (open circle) current levels as a function of second anodic phase duration across different electrode–ANF distances of d = (2.08, 1.18, 0.68, and 0.23) mm. T and C levels were computed using a computational ANF model stimulated with a 900 Hz biphasic pulse train with a 25 µs cathodic-leading first phase. ANF = auditory nerve fiber.
The SOE Index: Constant-Amplitude Pulse Train
The effect of current spread on constant-amplitude pulse trains was examined by calculating the SOE index. Figure 4 presents an example of the excitation spread due to the current spread and plots the ANF responses across the recording ANF position for the second-phase durations of (25 and 100) µs (gray circle and dark gray triangle, respectively) with an identical electrode position of de,f = 0.23 mm. The stimulation electrode was located over the ANF at 0 mm on the horizontal axis, and the ANFs’ responses located at an interval of 0.1 mm horizontally were measured. The SOE index is calculated from the area under the curve. The example indicates that a pulse train with a second-phase duration of 100 µs results in a lower SOE index of 0.263 than that of 0.347 with a 25-µs second-phase duration.

Example of the spread of neural excitation (SOE) index for pulse–train stimulation. Auditory nerve fiber (ANF) responses were measured at different horizontal positions relative to the stimulation electrode, and normalized to the response of the centered ANF. The SOE index was defined as the area-under-the-response curve. The example plot compares SOE for (25 and 100) µs (gray and dark gray, respectively) second-phase durations, demonstrating reduced SOE with prolonged second-phase duration.
Figure 5 illustrates how the SOE is influenced by the second-phase duration and electrode–ANF distance during a constant-amplitude 200 ms pulse train stimulation at a rate of 900 Hz, presented at the C-level. To assess the potential adaptation effects, the SOE was analyzed in two temporal intervals: the (0–12) ms onset interval and the (100–200) ms steady-state interval, as described in “Methods” section.

Effect of second-phase duration on the spread of neural excitation (SOE) index in response to 200 ms pulse–train stimulation at the C-level. (A) SOE index computed on the onset-response interval at 0–12 ms and steady-state response interval at 100–200 ms as a function of the second-phase duration for different electrode–ANF distances of 0.23, 0.68, 1.18, 1.68, and 2.08 mm. (B) A reorganization of the data to highlight the effect of electrode–ANF distance for different second-phase durations of 25, 50, 75, and 100 µs. ANF = auditory nerve fiber.
Figure 5(a) illustrates the SOE index as a function of the second-phase duration across different electrode–ANF distances. Overall, the results demonstrated negative correlations between the SOE index and second-phase duration. As the second-phase duration increased from 25 to 100 µs, a gradual reduction in SOE index was noted. At larger distances (≥1.18 mm), the SOE index was consistently higher; however, a mild decreasing trend was observed with an increasing second-phase duration. The SOE index was slightly reduced in the (100–200) ms interval compared to the (0–12) ms interval across all conditions (paired t-test, p < .05), indicating that neural adaptation may play a role in shaping the SOE over time. Figure 5(b) reorganizes the data to highlight the effect of the electrode–ANF distance on the SOE for each condition of the second-phase duration. As the electrode–ANF distance increased from 0.23 to 2.08 mm, the SOE increased significantly, indicating a greater current spread at larger distances. This effect is evident in both the onset at (0–12) ms and steady state at (100–200) ms intervals.
Table 2 lists the slope (a0) and correlation coefficient (corr. coef.) of the linear regression model describing the relationship between the second-phase duration and SOE index under specific electrode–ANF distance conditions. All the slopes are negative, indicating a consistent decrease in the SOE index with increasing second-phase duration. Furthermore, the differences in the slopes between the onset (0–12) ms and steady-state (100–200) ms phases of the constant-amplitude pulse train were not statistically significant (Wilcoxon signed-rank test, p > .1). Table 3 presents a summary of the linear regression model parameters that quantify the relationship between the SOE index and electrode–ANF distance across various second-phase durations. The slopes (b0) were positive in all cases, demonstrating that the SOE index increased with increasing electrode–ANF separation. Similar to the previous analysis, no significant difference was observed between the onset and steady-state interval conditions (Wilcoxon signed-rank test, p > .1).
Statistical Summary of the Linear Regression Model.

ANF = auditory nerve fiber; SOE = spread of neural excitation.
SOE Index = a0 × ϕ2 + y0, evaluating the relationship between SOE index and second-phase duration (ϕ2) in both the onset at 0–12 ms and steady state at 100–200 ms intervals in Figure 5(a). A negative slope (a0) indicates the narrow SOE with increasing ϕ2, under a specific electrode–ANF distance (de,f) condition.
Summary of Linear Regression Results Based on the Model.

ANF = auditory nerve fiber; SOE = spread of neural excitation.
SOE Index = b0 × de,f + y0, assessing the effect of electrode–ANF distance (de,f) in both the onset at 0–12 ms and steady state at 100–200 ms intervals in Figure 5(b). A positive slope (b0) reflects increasing SOE with greater ϕ2, under a specified second-phase duration (ϕ2).
The general linear model of datasets in Figure 5 revealed a strong main effect of electrode–ANF distance on SOE index, with larger distance associated with significantly greater onset SOE [β = 0.39, p < .001] and steady-state SOE [β = 0.39, p < .001]. Second-phase duration showed a trend toward reduced SOE with increasing duration, but no statistical significance for both onset [β = −0.0010, p = .099] and steady-state case [β = −0.0010, p = .092]. No significant interaction was observed between second-phase duration and electrode–ANF distance for onset (p = .98) and steady-state SOE (p = .90), which indicates that the influence of distance on SOE was consistent across pulse durations vice versa.
Neurogram Similarity: A Spoken Word “Choice”
Figure 6 presents the neurograms generated in response to the word “choice” under varying second-phase durations and electrode–ANF distances. While the reference neurograms remained unchanged with increasing second-phase duration, the neurograms with current spread exhibited distortion. Clearly, as the electrode–ANF distance increased, the excitation range caused by the current spread expanded. However, as the duration of the second phase increased, the excitation range decreased. The inhibition of neural responses with an extended second-phase duration led to a reduction in the SOE, potentially enhancing the perception of the word “choice” for electrodes positioned farther from the ANFs. Accordingly, Figure 6 shows the compromised effect between the current spread and neural inhibition.
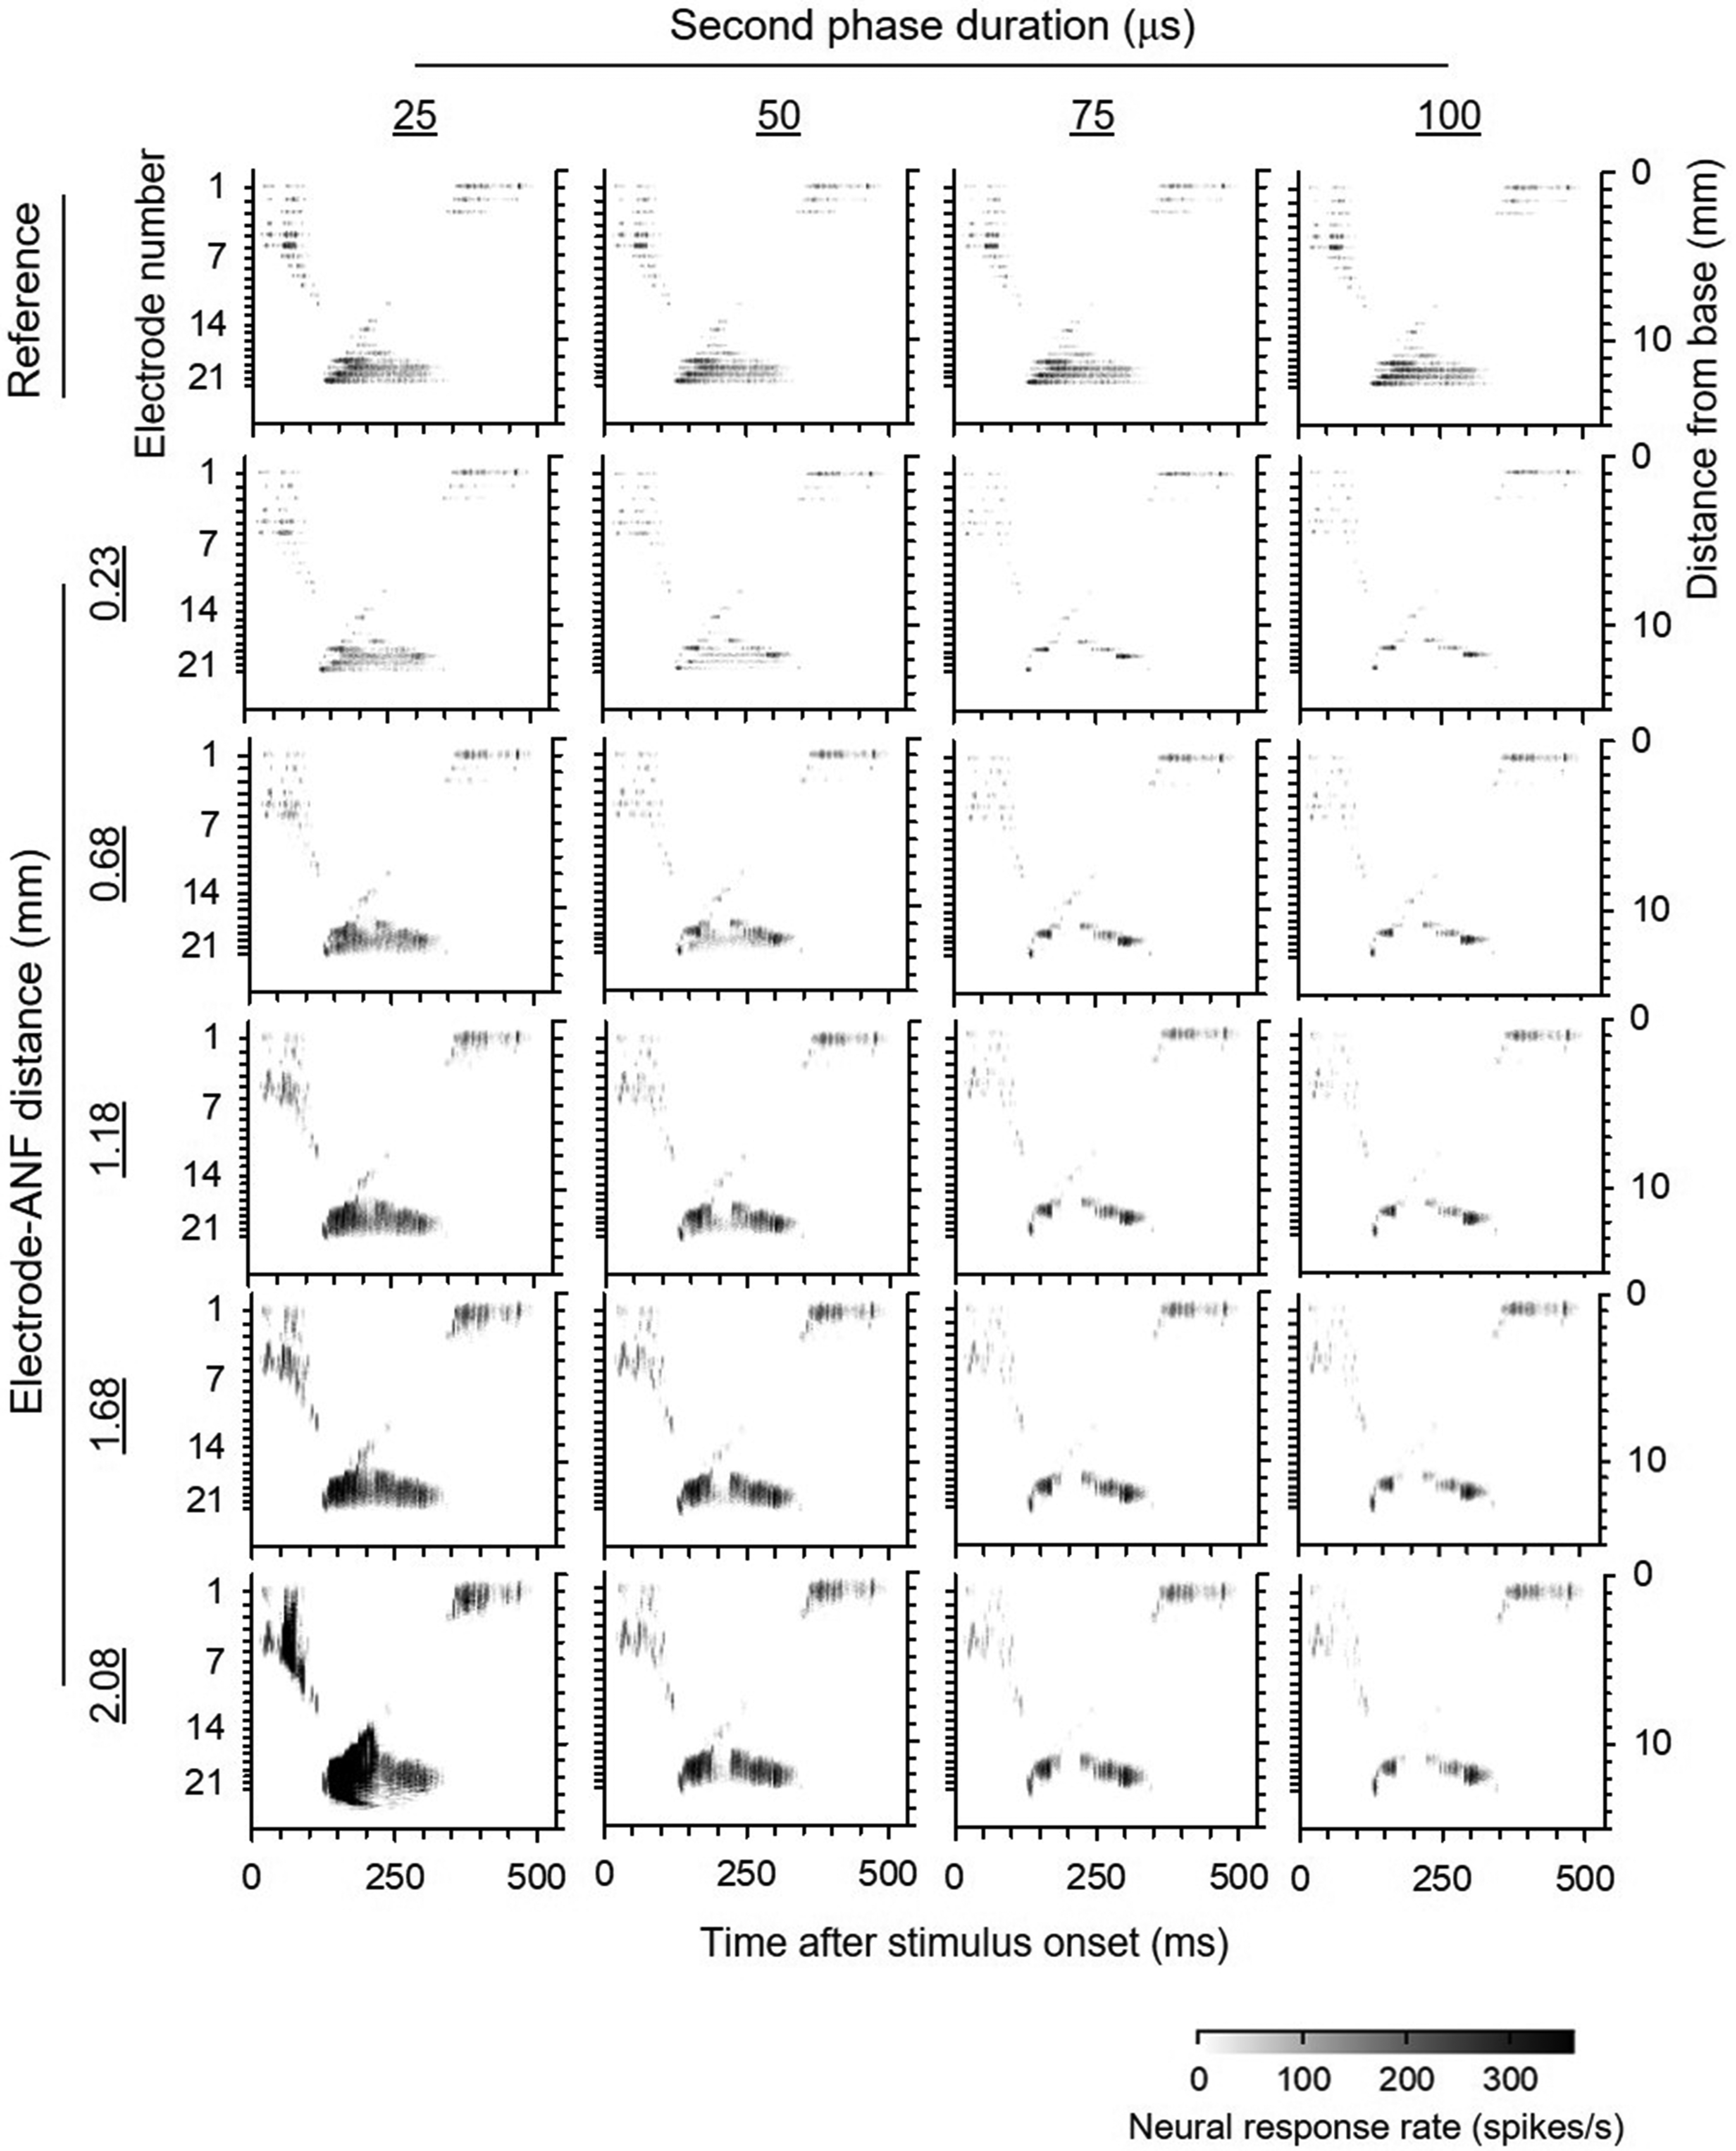
Neurogram responses to the spoken word “choice” under different second-phase durations and electrode–ANF distances. References of the first-row panels denote the neurogram simulated with the current spread-off model. ANF = auditory nerve fiber.
Figure 7(a) presents plots of the NSIM index corresponding to each panel in Figure 6. A high NSIM index indicates a strong similarity between the testing and reference neurograms. For symmetric pulses (i.e., with 25-µs second-phase duration), the NSIM index ranged from 0.96 to 0.84, in accordance with the variation of electrode–ANF distance from 0.23 to 2.08 mm. Conversely, asymmetric pulses exhibited a narrower NSIM range of 0.93–0.88. For the cases of the electrode–ANF distance of 0.23 and 0.68 mm, the NSIM index decreased with longer second-phase duration due to inhibition-induced distortion. However, for electrode–ANF distances of 1.68 and 2.08 mm, NSIM increased with longer second-phase duration due to SOE reduction, improving the similarity of the neurogram. Table 4 presents a summary of the linear regression model parameters describing the relationship between second-phase duration and NSIM under the specific electrode–ANF distance conditions shown in Figure 7(a). At shorter electrode–ANF distances (0.23 and 0.68 mm), the linear model slopes of c0 were negative, indicating that NSIM, a measure of signal quality degradation, decreased as the second-phase duration increased. In contrast, at longer distances (1.68 and 2.08) mm, the slopes were positive, suggesting that longer second-phase durations are associated with improved NSIM values.

The neurogram similarity indices (NSIMs) for different second-phase durations and electrode–ANF distances. (A) NSIM across different stimulation conditions. Higher NSIM indicates more similar neural representation of the spoken word “choice” with the current spread-off model. The data were fitted using a linear regression model. (B) The relative change in NSIM for typical asymmetric pulse with a 50, 75, and 100 µs second-phase duration (NSIM50, NSIM75, and NSIM100, respectively) cases, compared to NSIM with symmetric pulses with a 25-µs phase duration. ANF = auditory nerve fiber.
Statistical Summary of the Linear Regression Model.

ANF = auditory nerve fiber; NSIM = neurogram similarity.
The model NSIM = c0 × ϕ2 + y0, Evaluating the relationship between NSIM and second-phase duration (ϕ2) in Figure 7(a). A negative slope (c0) indicates NSIN degradation with increasing ϕ2, under a specific electrode–ANF distance (de,f) condition.
Figure 7(b) illustrates the relative change in NSIM for asymmetric pulse stimulation compared with symmetric pulse stimulation (NSIM25), analyzed across different electrode–ANF distances. Each color bar represents the relative change in NSIM corresponding to second-phase durations of 50 µs (NSIM50), 75 µs (NSIM75), and 100 µs (NSIM100). Positive values indicate an improvement in NSIM owing to asymmetric pulses, whereas negative values signify degradation in NSIM compared to symmetric pulses.
These results highlight the clear dependence of the change in NSIM on the electrode–ANF distance. At larger distances (i.e., 1.68 and 2.08 mm), increasing the second-phase duration leads to a reduction in the spread of excitation, which is attributed to the reduction in the current spread. Consequently, narrowing of the excitation resulted in improved NSIM values. In contrast, at shorter electrode–ANF distances (i.e., 0.23 and 0.68 mm), an increase in second-phase duration appeared to induce neural inhibition, leading to an overall degradation in NSIM.
Overall, these findings suggest that the impact of asymmetric pulse stimulation on NSIM is not uniform across all spatial configurations, but is strongly influenced by the electrode–ANF distance. When the distance is large, the reduced spread of excitation enhances the neural selectivity, thereby improving NSIM; however, when the distance is small, the asymmetric pulses resulted in a decline in the NSIM. This differential effect highlights the importance of considering the electrode placement and pulse-shaping parameters in neural stimulation strategies to optimize the effectiveness of auditory prostheses. Table 5 presents the linear regression models characterizing the relationship between the NSIM and the electrode–ANF distance under various second-phase duration conditions. Overall, NSIM decreased as the electrode–ANF distance increased; however, the rate of this decrease diminished as the duration of the second phase increased. This suggests that the influence of the distance on NSIM becomes less pronounced at longer second-phase durations.
Linear Regression Statistics for the Model.
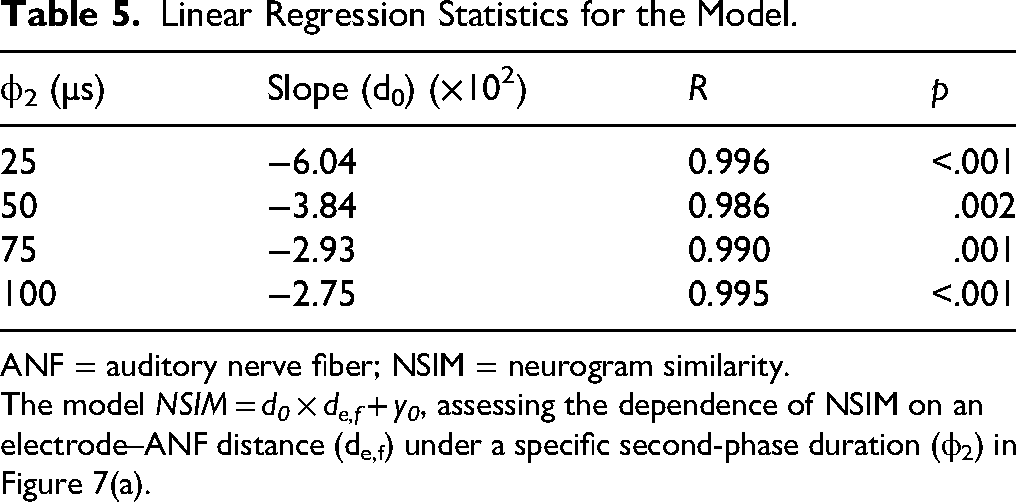
ANF = auditory nerve fiber; NSIM = neurogram similarity.
The model NSIM = d0 × de,f + y0, assessing the dependence of NSIM on an electrode–ANF distance (de,f) under a specific second-phase duration (ϕ2) in Figure 7(a).
The general linear model showed that electrode–ANF distance was significantly associated with NSIM, with larger distance corresponding to lower NSIM values [β = −0.066, p < .001]. Second-phase duration was also related to NSIM [β = −0.458, p < .001]; however, this relationship depended on electrode–ANF distance, as indicated by a significant interaction [β = 0.432, p < .001] between second-phase duration and electrode–ANF distance. Specifically, increasing duration tended to reduce NSIM at shorter distances but increase NSIM at longer distances.
Discussion
This study investigated the effects of the asymmetry of stimulating pulses and electrode–ANF distance on the SOE in CIs. The results demonstrated that both parameters significantly influenced the SOE; these results may have implications for speech perception and CI programming strategies.
Effect of the Electrode–ANF Distance on the SOE
Our findings showed that SOE increases with increasing electrode–ANF distance. This aligns with prior studies showing that larger electrode–neuron distances lead to broader current spread, thereby reducing spatial selectivity while increasing channel interactions (Bierer & Faulkner, 2010; Carlyon et al., 2017). Channel interactions in CIs have previously been identified as key factors limiting speech perception, as they degrade spectral resolution and reduce the number of independent channels available for information encoding (Berenstein et al., 2008; de Balthasar et al., 2003). The broader excitation patterns observed at larger electrode–ANF distances are consistent with previous findings; this behavior is known to produce wide electrical fields and reduced spatial selectivity (Bonham & Litvak, 2008).
Effect of the Asymmetry of Pulses on the SOE
Prior studies have reported that modifying pulse shapes, such as using triphasic or asymmetric pulses, can improve current focusing while reducing unwanted neural activation, potentially reducing channel interactions and improving perceptual outcomes (Bahmer et al., 2017, Ballestero et al., 2015; Bonnet et al., 2004). However, our results also show that longer second-phase durations may induce neural response inhibition, particularly at shorter electrode–ANF distances. This finding is consistent with prior reports showing that asymmetric pulse shaping can influence neural recruitment patterns, leading to a trade-off between spatial selectivity and neural suppression (Carlyon et al., 2018).
Previous human and electrophysiological studies have shown that pseudomonophasic stimulation with highly asymmetric pulse shapes has a stronger perceptual and physiological effect (Miller et al., 2001; van Wieringen et al., 2005). In contrast, the present study employed the maximum asymmetry ratio to 1:4, owing to practical constraints imposed by the 8-of-22 ACE strategy and the single-current-source design, which requires less than 138 µs pulse durations to achieve a 900-Hz stimulation rate. Future studies should therefore investigate larger asymmetry ratios using alternative stimulation strategies or multi-current-source CI where such limitations may not apply.
Interaction of Neural Inhibition and SOE
The neurogram analysis of the spoken word “choice” reveals a complex interaction between SOE reduction and neural inhibition. The results of this study indicate that when the electrode–ANF distance is small, increasing the second-phase duration leads to inhibition, resulting in the degradation of the neural representation of words. Conversely, when the electrode–ANF distance is large, inhibition due to phase increase tends to improve the neural representation. This suggests that the interaction between electrode positioning and neural responses plays a crucial role in determining the effectiveness of stimulation parameters. Understanding these relationships may help to refine stimulation strategies to improve speech perception outcomes in CI users (Bierer & Middlebrooks, 2002).
Effect of the Leading Polarity
This study exclusively employed cathodic-leading biphasic pulses to maintain methodological consistency with prior work using similar models of ANF responses. It has been known that leading polarity can significantly influence neural activation thresholds, excitation sites, and perceptual outcomes. In human CI users, anodic-leading pulses often elicit larger electrically evoked compound action potentials (ECAPs) and broader SOE patterns (Spitzer et al., 2019; Undurraga et al., 2010), whereas animal studies have frequently demonstrated lower thresholds for cathodic-leading pulses, indicating species- or condition-dependent differences in the polarity sensitivity (Miller et al., 1999). Moreover, Macherey et al. (2008) and Carlyon et al. (2015) demonstrated that human CI listeners exhibit greater sensitivity to the anodic phase than the cathodic phase, whereas findings from animal models generally show the opposite pattern. Computational modeling studies have suggested that such polarity effects may be modulated by the degeneration of the peripheral processes of ANFs, the location of excitation (peripheral vs. central), and the extent of demyelination (Rattay et al., 2001). Overall, these findings support the view that the leading polarity effect is not universally generalized but is instead likely influenced by cochlear health, ANF geometry, and the specific characteristics of the electrode–neural interface. Accordingly, future studies should focus on developing computational models that simulate polarity-dependent excitations under diverse anatomical and physiological conditions. Such models could inform individualized stimulation strategies by enabling the selection of the optimal leading polarity to improve neural recruitment and lower thresholds, or enhancing perceptual outcomes for each user.
SOE Versus Speech Perception
Several studies have previously investigated the relationship between the SOE and speech perception using different methodologies, including ECAP-based forward masking, the spectral blurring paradigm, and the marker-probe paradigm (Berg et al., 2024; da Silva et al., 2021; Goehring et al., 2021; Joly et al., 2021). For example, research has shown that poor spatial selectivity due to excessive SOE can limit the ability of CI users to distinguish between phonemes (Berenstein et al., 2008). Goehring et al. (2021) demonstrated that increasing the channel interaction directly in CI users significantly degraded speech perception, but only when apical electrodes are involved. Interestingly, these clinical studies suggested that the SOE does contribute to variability in speech perception; however, its impact depends on factors such as electrode design (straight vs. perimodiolar arrays), electrode positioning, and the frequency regions (apical vs. basal regions) involved (Garcia & Carlyon, 2025). While a broader SOE is generally associated with increased channel interaction and reduced speech intelligibility, its predictive value remains limited unless it is combined with other patient- and device-specific factors.
In the clinic, electrophysiological impedance measurements and forward-masked psychophysical or electrophysiological spatial tuning curves are commonly applied to assess current spread and its impact on speech intelligibility (Joly et al., 2021; Nelson et al., 2008). These approaches provide valuable insights into SOE of CIs in patients; however, they have limitations, particularly in the systematic analysis of the parameters related to the electrode–neuron interface. Further, the variability in electrode–neuron interactions cannot be easily controlled in vivo, making it difficult to establish direct causal relationships between stimulation parameters and perceptual outcomes.
Clinical Relevance of the Computational Model
Although the NSIM index itself only quantifies the similarity between two neurograms and does not directly indicate speech perception performance, prior studies have nevertheless demonstrated its predictive value. For example, Yang et al. (2020) validated that model-based predictions derived from NSIM were significantly correlated with clinical measures of speech perception. This suggests that although NSIM should be interpreted primarily as a similarity metric, it can still provide indirect insights into potential perceptual outcomes. In the present study, we therefore used NSIM to capture neural representations of speech under quiet listening conditions. Alternative metrics, such as the short-time objective intelligibility index and hearing-aid speech perception index, have been extensively validated for estimating intelligibility, particularly in noisy environments. Future studies that incorporate them would allow a comprehensive assessment of how neural coding relates to intelligibility (Kates & Arehart, 2014; Taal et al., 2010).
Computational modeling with many ANFs offers a powerful alternative for evaluating the impact of electrode–neuron interface variations. This approach further allows for the systematic manipulation of stimulation parameters, thereby providing a controlled environment to assess their effects on neural activation patterns. Moreover, computational models can overcome the inherent constraints of clinical experiments by enabling unlimited simulations of various stimulation strategies (Bruce et al., 2018; Goldwyn et al., 2010). This capability is of particular benefit in optimizing stimulation paradigms that, owing to ethical or technical limitations, may not be feasible to test directly in patients.
Modeling Limitations and Future Works
Computational modeling has inherent limitations. Simplified and nonrealistic models may not fully capture the complexities of real auditory nerve responses, thereby leading to potential discrepancies between simulated and actual patient outcomes. Future research should thus focus on improving the realism of computational models by incorporating more biologically accurate representations of the auditory nerve and electrode–neuron interactions (Frijns et al., 2001; Thiselton & Hanekom, 2024). Furthermore, integrating patient-specific data into simulations may further enhance the predictive power of these models, allowing more personalized CI programming. A hybrid approach that combines clinical measurements with advanced computational modeling may offer the most comprehensive strategy for optimizing CI outcomes and improving speech perception.
This study provided a reference framework for ANF responses under different asymmetric pulse durations and electrode interface, while preserving the original ANF morphology. Computational models can evaluate changes in neural responses associated with morphological alterations of the auditory nerve, such as peripheral demyelination of ANFs and degeneration of peripheral axons (Heshmat et al., 2020; Resnick et al., 2018). Future studies should extend this computational modeling to investigate the influence of patient-specific ANF morphological differences on neural activation and CI outcomes. This will provide a more comprehensive understanding of the relationship between nerve degeneration and stimulation efficacy, thereby ultimately contributing to more personalized CI fitting strategies.
Recent advances in high-resolution computed tomography imaging have also made it feasible to assess the electrode–neuron distance of the CI in vivo (DeVries & Arenberg, 2018; Long et al., 2014). Future research should include patient-specific CI fitting strategies that incorporate electrode–neuron distance estimates using imaging or impedance information. Clinical studies evaluating the perceptual effects of second-phase duration modifications could further be conducted to validate these computational findings and enhance speech perception. Although the present implementation preserves stimulus polarity, systematic investigation of anodic- and cathodic-leading stimulation is warranted to better explain clinically observed polarity-dependent neural recruitment. Future work could also extend the modeling by incorporating coating conductivity, electrode shape, or histopathological alterations over time, which could provide a more comprehensive understanding of the effects of electrode design and interface properties on CI performance.
Conclusions
Overall, this study provides novel insights into the effects of the second-phase duration and electrode–ANF distance on the SOE in CIs. These findings further indicate that increasing the electrode–ANF distance leads to a broader SOE, which could negatively affect spectral resolution and speech perception. However, the impact of increasing the second-phase duration varies depending on the electrode–ANF distance. These results highlight the need for individualized CI strategies. Current focusing techniques, in combination with optimized pulse shaping and pulse configuration, may further help to reduce the tradeoff effects of excessive SOE, while preserving neural excitability.
Footnotes
Acknowledgments
The authors wish to acknowledge the work of the editor and two anonymous reviewers.
Funding
The authors disclosed receipt of the following financial support for the research, authorship, and/or publication of this article: This study was supported by the National Research Foundation of Korea (NRF) Grant funded by the Korea government (MSIT) (NRF-RS-2024-00338148).
Declaration of Conflicting Interests
The authors declared no potential conflicts of interest with respect to the research, authorship, and/or publication of this article.