
Abstract
While the majority of cochlear implant recipients benefit from the device, it remains difficult to estimate the degree of benefit for a specific patient prior to implantation. Using data from 2,735 cochlear-implant recipients from across three clinics, the largest retrospective study of cochlear-implant outcomes to date, we investigate the association between 21 preoperative factors and speech recognition approximately one year after implantation and explore the consistency of their effects across the three constituent datasets. We provide evidence of 17 statistically significant associations, in either univariate or multivariate analysis, including confirmation of associations for several predictive factors, which have only been examined in prior smaller studies. Despite the large sample size, a multivariate analysis shows that the variance explained by our models remains modest across the datasets (
Introduction
For decades, cochlear implants (CIs) have been an effective intervention to restore some hearing in individuals who have been impacted by significant permanent hearing loss (HL) (Eshraghi et al., 2012). Implantation is considered as an option when the auditory nerve is intact but hearing aids (HAs) are no longer able to compensate adequately for the loss of hearing. In general, clinical outcomes for implantees have improved substantially since the introduction of CIs (Hoppe et al., 2019) and it is recognized that the vast majority of individuals who are eligible for implantation showed improved hearing outcomes. Despite the well-documented success of CIs in restoring some hearing for the majority of patients, individual patient outcomes, and satisfaction vary with some individuals achieving strong improvements in hearing, while a minority show little or no improvement (Rubinstein et al., 1999; Gantz et al., 1993; Pisoni et al., 2017; Boisvert et al., 2020).
An expansive body of research aims to quantify differences in hearing performance and identify factors that may account for the variation in observed performance (Blamey et al., 1996, 2013; Dowell et al., 2004; Lazard et al., 2012; Roditi et al., 2009; Shea III et al., 1990; Summerfield & Marshall, 1995; Waltzman et al., 1995). However, identification and interpretation of such predictive factors remain challenging (Pisoni et al., 2017). Several factors are associated with CI outcomes, including etiology of HL, duration of HL, duration of HA use prior to implantation, patient age at implantation, preoperative hearing scores, and percentage of stimulating electrodes (Zhao et al., 2020; Blamey et al., 2013, 1992). While the association with the hearing outcome is clear, the strength of evidence for many of these associations varies substantially across studies (Zhao et al., 2020). Similar trends are observed for multivariate analysis whereby the reported ability of predictive factors to explain variance in performance outcomes varies from as low as 10% (Blamey et al., 2013) to up to 31% for implantees with prelingual HL (Kraaijenga et al., 2016). Several reasons proposed to explain this variability include small patient cohorts (Zhao et al., 2020), differing performance criteria (Gaylor et al., 2013), and differences in cohort demographics (Boisvert et al., 2020; Leigh et al., 2016).
Larger multicenter studies or meta-analyses of the literature may provide a more accurate depiction of true effect size for predictive factors compared to smaller, single-center cohorts but such studies come with potential complications. The largest analysis of individual-level participant data can be seen in the landmark papers by Lazard et al. (2012) and Blamey et al. (2013), which examined numerous factors in 2,251 patient records across 15 clinics, the largest studies to date. However, these studies did not analyze differences in effect sizes or the impact of cohort differences between centers. Moreover, the chosen hearing outcome, a rank-based composite of heterogeneous hearing tests from across the different clinics may reduce the predictive power of the measured factors (Goldberg et al., 2014; Harrell & Frank, 2015). More recently, Zhao et al. (2020) conducted a meta-analysis of 1,095 participants from 13 different studies. They identified duration of HL, preimplantation pure tone average (PTA), preimplantation word recognition tests, and age at implantation as significantly associated with multiple performance outcomes across the different studies, albeit with substantial interstudy differences. This study was unable to conduct a metaregression due to limited data available across studies. Given the limited number of large multicenter studies, a recent review of the CI literature explicitly recommended larger meta-analyses from multiple datasets be conducted to improve the reliability of conclusions related to predictive factors (Boisvert et al., 2020).
To address some of the challenges of prior studies of predictive factors for cochlear implantation outcomes, we evaluated a cohort of 2,735 individual CI patients, the largest joint study of CI outcome to date. We focused on a single outcome metric, postoperative monosyllabic word recognition scores (WRSs) at 12 months after implantation, with data provided by three different clinics, Vanderbilt University Medical Center (VUMC), Ear Science Institute Australia (ESIA), and Medizinische Hochschule Hannover (MHH). We investigated predictive factors pertaining to patient demographics, hearing-related measurements, clinical history, and etiology of HL and examined their effects within and across the clinics (with the latter subject to measurement availability across the three cohorts). Examining 21 predictive factors across three large centers, we found further refinement of several known associations and more definitive evidence for several predictive factors, which have only been examined in relatively smaller studies. Our study highlights the real-world complexities in understanding the relationship of predictive factors and cochlear implantation outcomes, including differences in cohort criteria, data collection, and definitions of predictive factors, that will impact the clinical translation of findings from this area, and we suggest several possibilities to mitigate the impact of these discrepancies.
Methods
Participating Clinics
This study was based on records from three different clinics: VUMC, ESIA, and MHH. Ethics approvals and data privacy protection practices were implemented. All patient data were deidentified and meet data compliance requirements for local patient data privacy laws and international law for General Data Protection Regulation. Each clinic implemented its own standard practice and preimplant test protocol for CI candidacy and post-implant evaluations.
Exclusion Criteria
This study focuses on the hearing performance of adults with a single implantation whose HL was within the range typically considered for cochlear implantation (moderate to profound HL). To ensure that the patient records met these criteria across the clinics, we removed any individual where: age at implantation was
Dataset Demographics.

All entries show mean (and standard deviation in brackets), except N. female and N. prelingual HL, where we report the number and percentage of participants.
VUMC = Vanderbilt University Medical Center; ESIA = Ear Science Institute Australia; MHH = Medizinische Hochschule Hannover;
Measure of Performance
The most common method to evaluate a patient’s progress with a HA or CI is to conduct monosyllabic word recognition and sentence recognition tests. The present study used different monosyllabic WRSs at the different clinics; Consonant-Nucleus-Consonant (Peterson & Lehiste, 1962) scores for data acquired in Australia (ESIA) and the United States of America (VUMC), and the Freiburg monosyllable test scores for data collected in Germany (MHH) (Hahlbrock, 1953, 1960). The tests are not identical, with differences in the number of words, the words themselves, and how common the words are in the language. However, they do have a similar structure and were conducted in comparable settings. If predictive factors are associated with WRS, we would expect to see comparable results across the clinics. While we recognize that differences in the word recognition tests across clinics may impact our analysis, a formal comparison of the impact was beyond the scope of this work.
Across all clinics, WRS tests for pre- and postoperative evaluation of the implanted ear were conducted in free-field at conversational level with a HA, denoted WRS(HA), or with a CI, denoted WRS(CI), while the contralateral ear was masked appropriately. The presentation level of the monosyllabic word test ranged from 60 to 65 dB sound pressure level (SPL) root mean squared (RMS), differing across a site with respect to the calibration procedure applied. This level was consistent across pre- and postimplant visits in each clinic. Additionally, the MHH dataset included records of a preoperative test conducted with headphones at a range of loudness levels. The maximum score under these conditions was recorded as PB
In our study, we used the postoperative WRS (evaluated on whole words, not on the phoneme level) that was acquired closest to 12 months after implantation, with the time after surgery varying from 6 to 24 months.
Predictive Factors Studied
In addition to demographic and hearing-related influences, we investigated factors relating to the impact of a patient’s clinical history and their etiology. These clinical factors were collected across the three clinics independently and, as such, some differ in their exact definition across the three sites, reflecting the current reality of clinical data collection in this space. While many factors were collected by all clinics, we highlight when a factor was only available in a subset of datasets, as this limits the ability to evaluate performance across all individuals.
Patient Demographics
The age of the patient at the time of receiving a CI.
Hearing tests were conducted in English (VUMC and ESIA) and German (MHH). This binary field indicates whether an implantee self-identifies as a native (or bilingual) speaker in the test language. Since this field was only available in the MHH dataset, a value of 1 means that German is the implantee’s native language. This has previously been shown to impact speech perception of cochlear implantees (Van Wijingaarden et al., 2002; Kilman et al., 2015).
Gender recorded as either female or male was available in the VUMC and MHH datasets, with female coded as 1 in any regression analysis. While this field was recorded at ESIA, it was unavailable for this study.
Hearing-Related Measurements
The WRS recorded during the most recent visit prior to implantation, as defined in the “Measure of Performance” section and measured with a HA. This score was recorded for the to-be-implanted ear (
The PTA is the mean hearing threshold across 0.5, 1, 2, and 4 kHz frequencies. During audiogram tests, the patient was unaided with no HA and the assessment was under air conduction. This audiometric score was recorded for the to-be-implanted ear and the contralateral ear, denoted
The maximum WRS measured in the to-be-implanted ear via headphones while the presentation level of the stimulus was varied. This was only available in the MHH dataset.
Clinical History
A binary variable where 1 indicates an individual with diagnosed HL at the age of two years or younger (VUMC and ESIA), or at the age of four years or younger (MHH).
This describes whether the patient had sudden (acute) or progressive HL, as defined by a clinician. Available in MHH only, this binary variable is coded with progressive loss as 1. Note: this measurement is different from the etiology of “sudden hearing loss as many individuals without this etiology may describe their hearing loss as sudden and vice versa.”
The time span between an individual being identified with HL of any degree and implantation date. This information is based on the patient’s response to several questions. This value was recorded for the to-be-implanted ear (
This binary variable refers to the side of the ear that received a CI, with left coded as 1.
The time span between onset of severe to profound HL and implantation is recorded in all three datasets and is denoted for the to-be-implanted and contralateral ears as
Available in ESIA and VUMC, the duration of HA use prior to CI implantation is recorded for the to-be-implanted and contralateral ears, denoted
Etiology
The underlying reason for the patient’s HL, if known, was commonly recorded as free text by clinics. Although there is no standardized methodology for categorizing etiological data, an approach was followed to combine the data into groups after consulting with subject matter experts.
The grouping of conditions led to a 13-category variable, with the following classes: noise-induced, otosclerosis, Meniere’s disease, congenital syndrome, childhood or congenital illness, genetics, (chronic) otitis media & infections, trauma, sudden HL, ototoxicity & streptomycin, meningitis, others (containing all recorded etiologies that did not fit into a category with sufficient values to be meaningful or were recorded as “other” in the original datasets), and unknown (if etiology was recorded as unknown in the original datasets or was missing). Since otosclerosis and meningitis have been described as predictive factors in the past literature (Blamey et al., 2013), they are not grouped with other etiologies.
In the MHH dataset, the course of HL was captured separately to etiology. For example, patients with meningitis can exhibit acute or progressive HL, as do patients with an etiology that falls in the “sudden HL” group. The “sudden HL” etiology was used to describe patients whose cause of HL is unknown but occurs in one or several acute episodes.
Imputation of Missing Hearing Assessments
Audiograms were collected at the last visit before implantation to investigate the degree of HL and were used to compute PTA. In some circumstances (i.e., patients reaching the limit of their hearing at low frequencies, or patients not being able to hear at maximum loudness and providing no response), the resulting audiogram data may not include all frequencies. If the data indicate that the patient reached the limit or had no response at that particular frequency, no response was recorded at max limits, and the missing values were imputed to 125 dB HL.
Similar to audiogram frequencies, all datasets contained missing values for the preoperative WRS(HA) of the to-be-implanted ear. Since missing WRS values again may indicate that the assessed patient may have had more severe HL than the average tested participant, removing these patients would bias our analyses. Hence, we imputed any missing preoperative WRS(HA) values with
Statistical Analysis
Univariate distributions of predictive factors provide insight into the make-up of the different cohorts. Age at implantation, years of HL, WRS(HA), and WRS(CI) were estimated using kernel density estimation as provided in the Seaborn Python package (Waskom, 2021). Differences in the distributions across the clinics were quantified using a two-sided Kolmogorov–Smirnov test.
Within each clinic, associations between predictive factors and WRS(CI) were evaluated using linear regression models, either with the predictive factor alone (univariate analysis) or with a combination of predictive factors (multivariate). The resulting coefficient (
Interaction analysis was evaluated by fitting models with and without an interaction term and determining whether the interaction significantly improved the model’s fit via a likelihood ratio test.
Significance for each predictive factor was determined using a two-sided Wald test. Significant predictive factors were those that had a
Forest Plots
Given a large number of variables being considered across three separate datasets and the combined dataset, we visualized the effect of predictive factors using forest plots, which are commonly reported in the epidemiology literature. For a given set of predictive factors, whether uni- or multivariate, we created a forest plot showing effect size, confidence interval, and associated
Results
Distribution of Data Across Clinics
As summarized in Table 1, data between clinics differed in several ways, including demographic factors and the clinical history of patients. To explore the similarity of these cohorts, we analyzed the distribution of patients’ age and hearing performance before and after implantation. Figure 1 displays the density of age, years of deafness in implanted ear, PTA in both ears, WRS(HA) scores, and WRS(CI) scores for each dataset, visualizing the relative spread of data for each of the clinics.

Differences in key predictive factors across clinics. (A) Distribution of age, (B) distribution of years of severe to profound hearing loss, (C) distribution of pure tone average (PTA) in the implanted ear, (D) distribution of PTA in contralateral ear, (E) distribution of preoperative WRS(HA)
The distributions of all fields shown in Figure 1 differ significantly in MHH compared to VUMC and ESIA (
While WRS are scaled to be between 0 and 100, the tests included 50, 25, and, 20 monosyllabic word items for VUMC, ESIA, and MHH, respectively. The difference in the number of words or, in particular, word lists being used may account for some of the variability in testing outcome, in particular, with differences between VUMC and the remaining clinics, with the smaller word lists likely to result in noisier WRS due to increased sampling error (Thornton & Raffin, 1978). These differences between clinics highlight some of the underlying properties that may affect the interpretation of predictive factor associations across the clinics.
Analysis of Univariate Predictive Factors
We initially conducted a univariate analysis, considering predictive factors of patient demographics, hearing-related measurements, and clinical history. The resulting effect sizes, confidence intervals, and significance levels are shown in Figure 2, with a detailed description of forest plots in Figure and further details given in the Online Supplemental Table 2.

Univariate predictive factors showing (A) demographic factors, (B) hearing-related measurements, (C) clinical history, and (D) etiology groups. The number of individuals in each category in each dataset is shown beneath the
Overall, we found significant associations for 16 of the 21 common predictive factors across the different datasets. The most significant associations were prelingual HL (
Patient Demographics
Results were mixed for the relationship between the age of the patient at implantation and their post-operative WRS. Lower age is associated with better WRS(CI) in VUMC and ESIA (
We observe that native German speakers have a significant advantage, with an expected 19.7 points increase in WRS(CI) compared to nonnative German speakers (
In the VUMC and MHH datasets, gender shows no significant difference (
Hearing-Related Measurements
WRS(HA) in the implanted ear (WRS(HA)
Having a poorer (i.e. larger) PTA was significantly associated with worse WRS(CI) for both ears, except in ESIA. Stronger and more significant effects are observed for PTA in the implanted ear compared to the contralateral ear (
PB
Clinical History
Out of all factors relating to the clinical history, patients with prelingualHL have the largest association with poorer outcome. This association is significant except for in ESIA (
This factor measures the duration for which a patient experienced any HL before they received an implant. It is negatively associated with postoperative hearing performance for the implanted ear (
We found no significant relationship between implant side and hearing outcomes. However, a negative association in the MHH and combined analyses (
Greater years of deafness (i.e., more time between the onset of severe to profound deafness and implantation) in the implanted ear leads to lower WRS(CI) in VUMC, MHH, and the combined datasets (
Years of HA use in the implanted ear shows a significant negative association (
Etiology
Etiology data are available in all datasets. Etiology coefficients indicate the expected change in WRS(CI) for that etiology compared to the change in WRS(CI) when the cause of HL is unknown. Overall, we see a lot of variability across the datasets in terms of the strength and spread of the associations, likely because the distribution of etiology classes differs dramatically across the datasets and is likely to be different within the “unknown” category (Online Supplemental Table 4). Nevertheless, Figure 2 reveals that some etiology classes show a significant and consistent effect:
Individuals with genetic HL have mixed results across the clinics, with the MHH and the combined analysis showing significant better postoperative outcome in WRS(CI) (
Meningitis shows a significant negative association (poorer outcome) in MHH and the combined analysis (
An etiology of Meniere’s disease is positively associated with outcomes in the combined analysis (
Individuals with sudden HL show a significant positive association in the combined analysis (
Otosclerosis is almost significant in the MHH dataset (
Multivariate Analysis
While the previous section examined the relationship of individual predictive factors with WRS(CI), it did not capture which measurements provide independent information, and how the relationship with WRS(CI) changes in the presence of other variables. To explore this further, we repeated the analysis by analyzing all variables simultaneously. As predictive factors in this analysis must be measured in all observations, the number of individuals and predictive factors in this multivariate analysis was reduced compared to the univariate analysis.
Results of the multivariate analysis are shown in Figure 3, with further details in Online Supplemental Table 5. The combined analysis shows having a higher PTA

Multivariate predictive factors for three datasets and the combined dataset. The number of individuals in each category in each dataset is shown beneath the
In addition, we found associations for factors for which the data only allowed for the inclusion of a subset of datasets. Years of deafness is significant in VUMC, MHH, and the combined analysis (
Although most of these associations are in line with those found in the univariate analysis and provide further evidence of their relevance, we notice some interesting differences. Patient age is no longer a significant factor in MHH or the combined analysis. Across the VUMC and ESIA datasets, we observe a moderate negative impact of age. The different results between clinics are likely due to the fact that both VUMC and ESIA have a relatively higher representation of older versus younger recipients while MHH has a wider spread of ages. Similarly, PTA
A multivariate analysis also reveals the significant association of the implant side in the MHH dataset (
Variance Explained
The multivariate analysis in the previous section highlights the relationship between predictive risk factors with the postoperative outcome, conditioned on all other available factors. We used these same models to examine how much of the variability of WRS(CI) can be explained using the combination of risk factors.

VUMC = Vanderbilt University Medical Center; ESIA = Ear Science Institute Australia; MHH = Medizinische Hochschule Hannover.
To account for potential overfitting in smaller datasets with larger feature sizes, we also reported
These reported values are comparable with or higher than those presented in previous studies in Blamey et al. (1996) (
Interaction Analysis
There has been little investigation to date whether there are significant nonadditive effects between established predictive factors. To explore this, we conducted an interaction analysis among all major predictive factors in the dataset, focusing on those predictive factors that were shown to be significant in the univariate analysis. This results in a total of 72 interactions, with several more being excluded if the feature combinations were redundant (i.e., interactions between PTA on the contralateral and implanted ear, or PTA and PTA
The most significant finding is a strong synergistic effect between years of deafness in the contralateral ear and patient age at implantation (
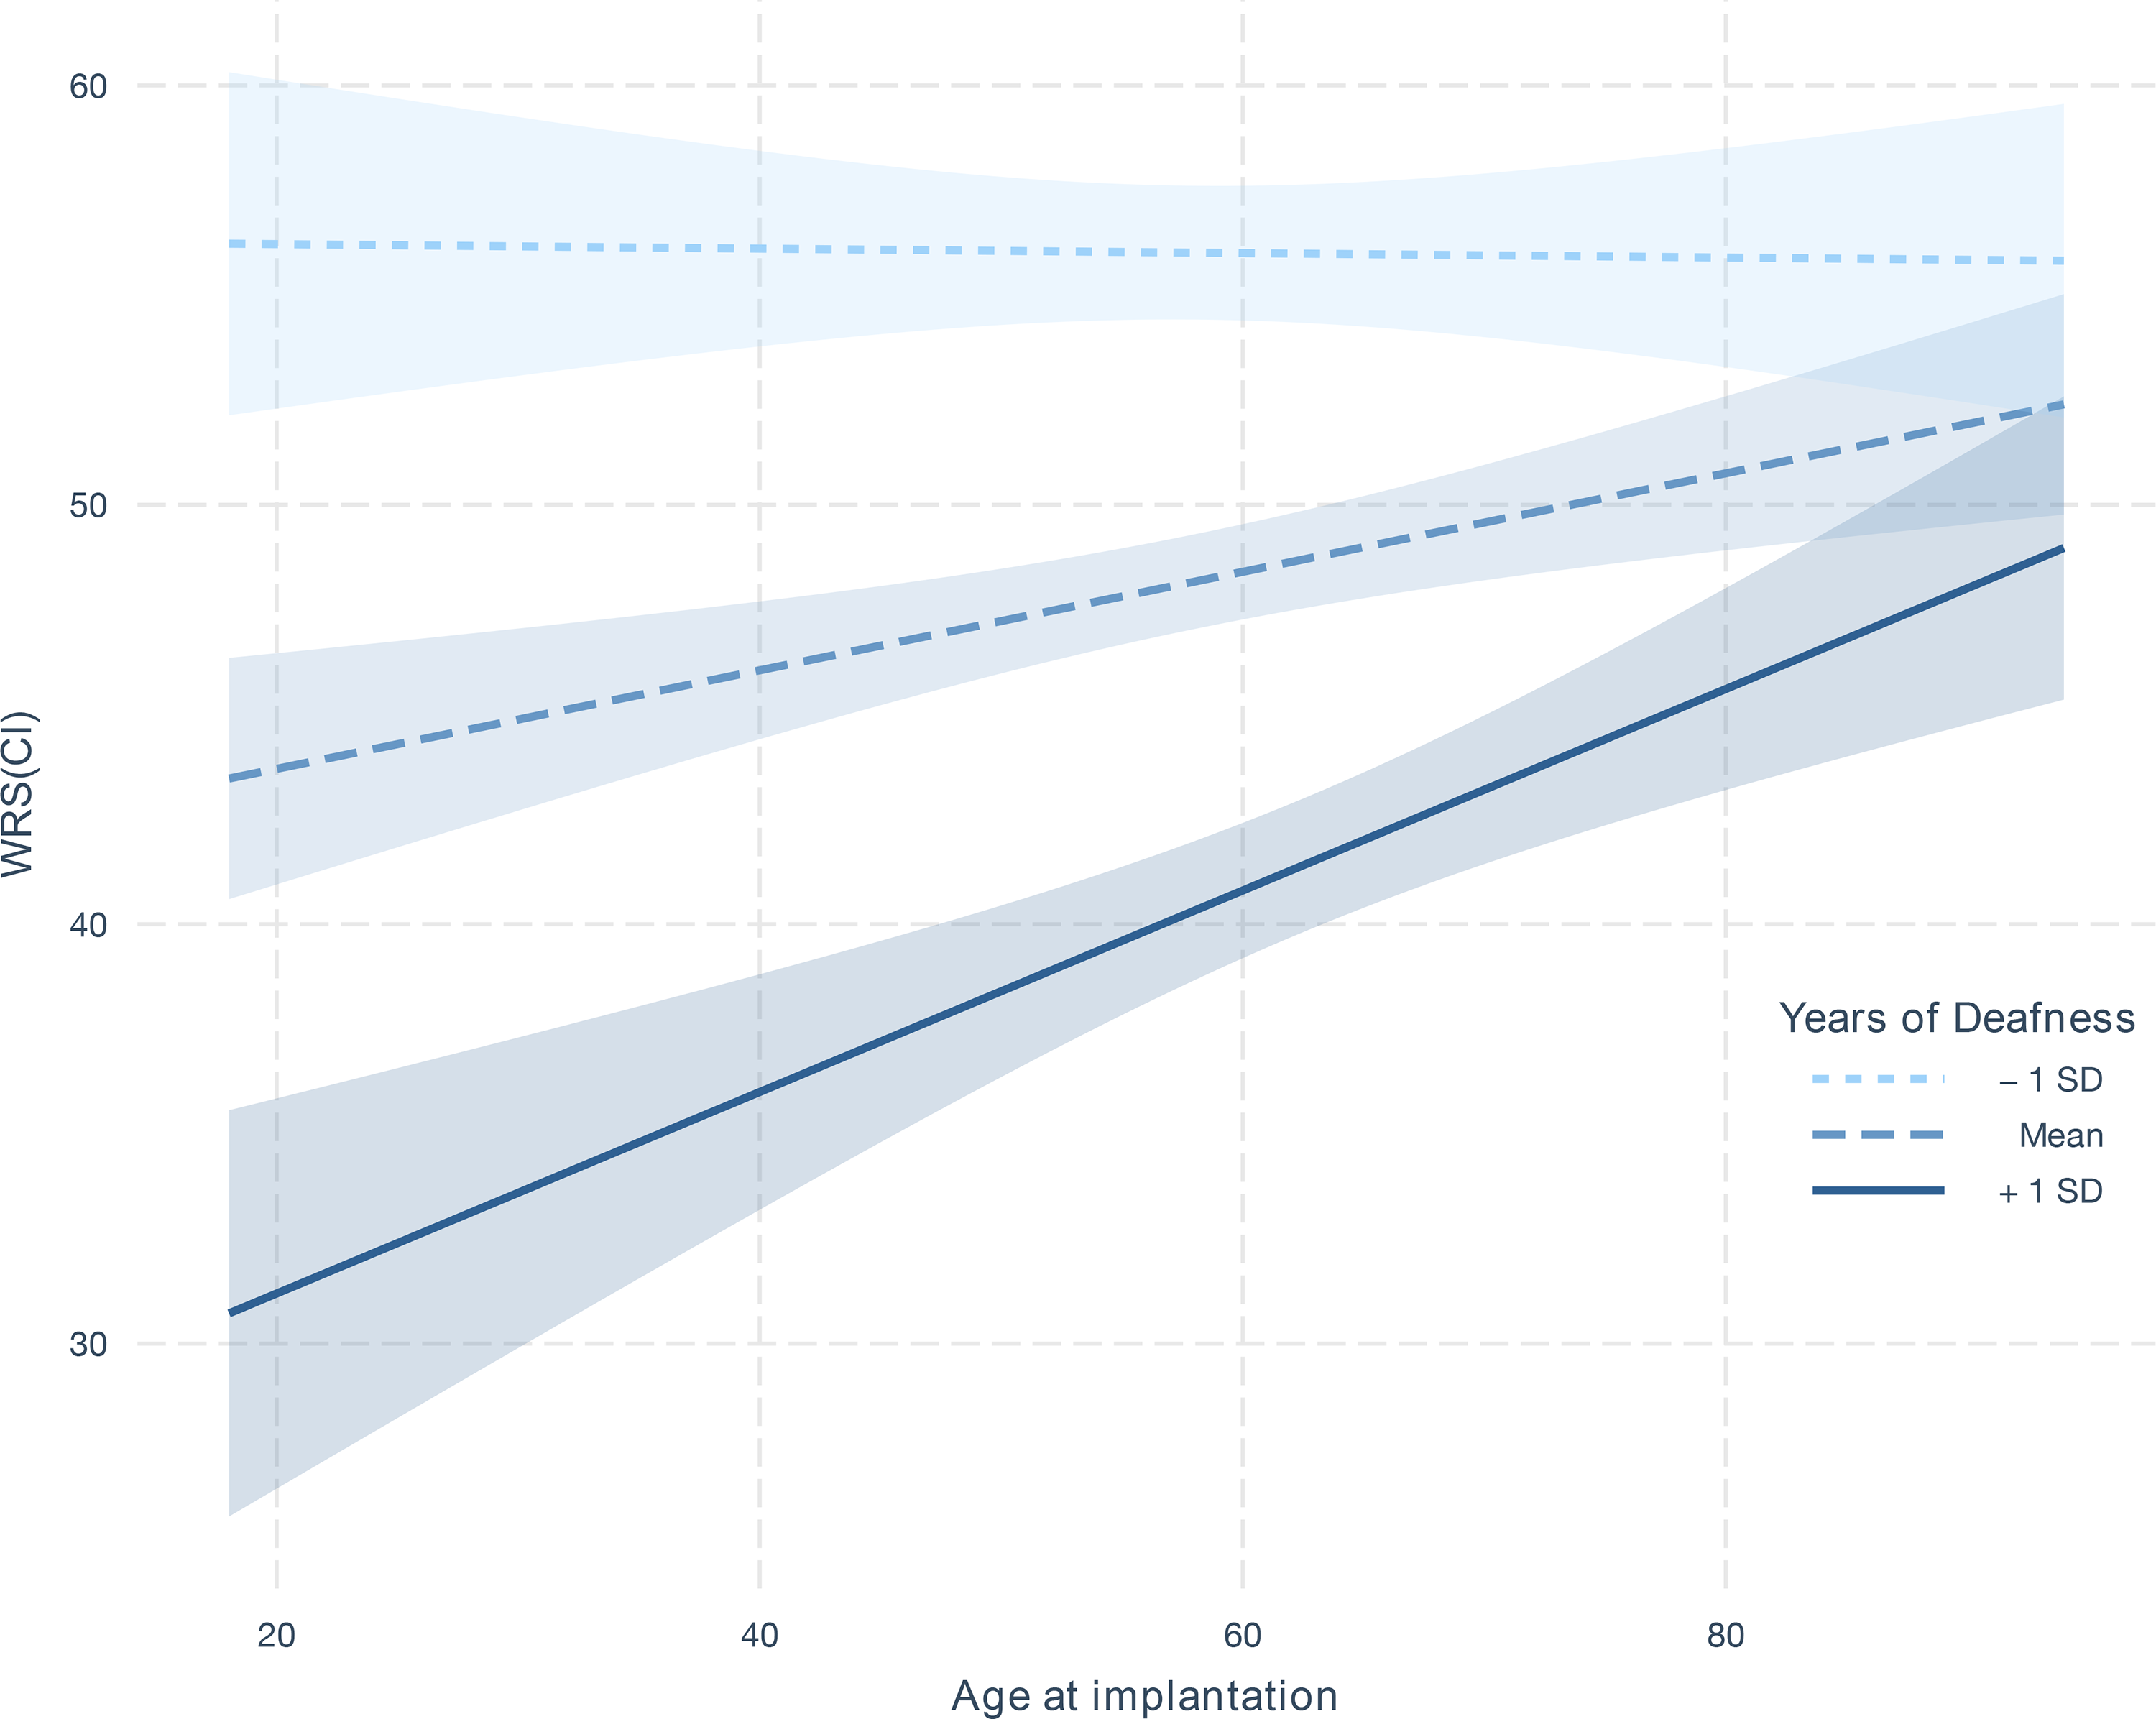
Interaction effect of age of implantation on WRS(CI) as a function of years of deafness. The three lines show the estimated linear relationship between age of implantation on WRS(CI) when years of deafness is set to the 34th, 50th, and 68th percentile (i.e., one standard deviation (SD) below the mean, the mean, and one SD above the mean). The shaded intervals around the lines indicate the 95% confidence interval derived from the coefficient estimates in the linear model.
Similar findings were seen for years of deafness in the implanted ear (
Informed by the interaction analysis, we repeated the multivariate analysis in the previous sections to determine whether the observed interaction increases the variance explained by WRS(CI). As both years of deafness in the implanted or contralateral ear are not present in all datasets, we could not evaluate the impact on the combined cohort. Focusing instead on the MHH dataset, we found that the
Conclusion and Discussion
Although most adult cochlear implantees have improved hearing outcomes, the degree of improvement in hearing and speech perception varies widely (Pisoni et al., 2017; Boisvert et al., 2020). Despite having been studied extensively over the last 25 years, the exact relationship between preoperative predictive factors and hearing outcome after cochlear implantation is not fully understood (Boisvert et al., 2020; Zhao et al., 2020). In this study, we analyzed a large cohort of adult cochlear implantees
We found significant univariate associations for 16 predictive factors, many consistent with the previous literature, with one additional association found through a multivariate analysis. In line with previous studies (Blamey et al., 2013; Lazard et al., 2012; Rubinstein et al., 1999; del Mar Medina et al., 2017; Francis et al., 2005; Zhao et al., 2020), the negative effect of a longer duration of HL prior to implantation across all three clinics was shown to have a strong and consistent effect size for the implanted ear. Years of deafness in the contralateral ear were also significant in the combined analysis, but was only significant in MHH individually. Although many of these associations are not significant in ESIA, this is likely to be a function of sample size, given ESIA has a far smaller sample size (
Several factors are understudied for their explicit role as a predictive factor for cochlear implantation but nevertheless have expected outcomes. As per Kraaijenga et al. (2016), we found that individuals with prelingual HL had worse postoperative WRSs. The impact of being a native language speaker was found to have a highly significant effect, similar to findings by Kilman et al. (2015) and Van Wijingaarden et al. (2002). The course of HL (sudden vs progressive) also had a highly significant effect in the univariate analysis, whereby progressive HL lead to improved outcomes, in line with previous studies (Clark, 2006; Battmer et al., 1995). However, we found that the course of HL was not significant in the multivariate analysis, indicating the information it carries may be reflected in other measurements.
Etiology of HL emerged as another strongly associated predictive factor, adding to the existing evidence investigating the relationship between certain causes for HL and CI outcomes (Blamey et al., 2013; Lazard et al., 2012; Boisvert et al., 2020; Janeschik et al., 2013). As with many studies of etiology in the literature to date, inconsistency in data collection limits our ability to interpret some of these findings. Given the clinics reported a large number of different etiology classes (including uncontrolled free text fields), we grouped etiology values from each clinic into 11 standardized groupings. Although standardizing the data ensure each category had a larger number of observations, it also discards valuable information, for example, grouping different genetic conditions into only one category (e.g., deafness due to mutations in the connexin gene family vs deafness due to autosomal recessive syndromes become a single etiology). Moreover, etiology information was only knowns and available in 55% of the data making subsequent analysis difficult. Despite these challenges, patient etiology remains highly informative of the outcome. As such, refining the collection of etiology-related information may substantially help explain the remaining variance in hearing outcome.
Hearing performance before implantation is known as an indicator of postimplantation hearing capabilities. Our results for the implanted ear are consistent with the previous literature (Blamey et al., 2013; Lazard et al., 2012; Boisvert et al., 2020; Zhao et al., 2020), showing that individuals with a better hearing before implantation are likely to have stronger outcomes postimplantation. Our analysis also paid particular attention to the influence of the preimplantation performance of the contralateral ear, given mixed conclusions in the previous literature. Lazard et al. (2012) showed a positive association between PTA
Hoppe et al. (2019) hypothesized that PB
We shed further light on the relevance of implantation age in adults, which has also been a point of contention in the literature (Kraaijenga et al., 2016; Schwab et al., 2015; Zhao et al., 2020; Blamey et al., 2013; Holden et al., 2013). Our univariate analyses showed mixed results, revealing both positive (ESIA and VUMC) and negative (MHH) associations in the individual datasets. Similar results are seen when only analyzing patients with postlingual HL, indicating that the effect is not driven by differences in pre-/postlingual HL. When accounting for other factors through multivariate analysis, a significant but mild negative association was observed for two datasets. This is in line with results from Blamey et al. (1996), Blamey et al. (2013), Holden et al. (2013) and the meta-analysis of Zhao et al. (2020).
To further investigate the varying outcomes across different datasets with respect to age, we examined interactions between predictive factors and found significant nonadditive effects for the age of implantation and years of severe to profound deafness prior to implantation. We showed that this interaction was statistically significant, replicated across two of the three clinics, and improved the variance explained. We also demonstrated that this improvement was not caused by the presence of patients with prelingual HL. However, the underlying drivers of this association are unclear. It is possible that the observed interaction is a statistical artifact due to the uncaptured information about the underlying etiology of HL. An alternative explanation, discussed in a recent review (Simon et al., 2020), is that auditory deprivation has different effects on the brain structure, specifically the primary or secondary auditory cortex, between younger and older individuals, and this may be reflected in auditory and speech perception. This supports a feasible mechanism underpinning the observed statistical association. Future work will be required to further clarify the true driver of this interaction.
We further found a strong association of the implant side and postoperative hearing performance, with right-ear implantation leading to better results. Similar results have previously been reported on adults (Liang et al., 2020) and children with pre- and postlingual HL, as summarized in a meta-analysis by Kraaijenga et al. (2017). Significant interactions with other factors, including prelingual HL and gender, were not found. Possible explanations include hemispherical asymmetries in auditory processing (Mills & Rollman, 1980; Schönwiesner et al., 2007; Brown & Nicholls, 1997) or the well-established right-ear-advantage that has been linked to the language dominance of the left hemisphere (Hugdahl, 2009).
Despite the large cohort, the multivariate analysis only explains a modest 13%–21% of the variance in postoperative WRSs. The meta-analysis on the combined dataset explains 12% of variance, with the lower performance potentially attributable to the smaller number of included features that overlapped across all datasets. Our results are in line with previous studies, which were able to explain up to 31% (Kraaijenga et al., 2016) of variance for a cohort of patients with prelingual HL and up to 22% (Lazard et al., 2012) for a cohort including a wider range of patients. Any reported
The analyses conducted in this work highlight several practical considerations for the standardization of data collected in this space. One such issue is around inconsistency in the definitions of the preoperative factors that are commonly collected. For example, the “years of severe to profound deafness” feature showed a clear difference in distribution between the clinics that is unlikely to be due to cohort make-up alone. Although this predictive factor has been shown to be important in numerous studies (Blamey et al., 2013; Lazard et al., 2012; Zhao et al., 2020), we reexamined the studies that were used to form a recent meta-analysis of the duration of HL (Zhao et al., 2020) and found definitions of HL across the included studies varied. This included asking a patient whether they could use the phone (Rubinstein et al., 1999), asking whether HAs were useful (del Mar Medina et al., 2017) or were based on PTA (Francis et al., 2005). In our study, we found similar variability across the three centers and while this may reduce the precision of estimated effect sizes within our analysis, it also reflects the current nature of data collected and analyzed in the field.
Our analysis was also complicated by the inconsistency of predictive factor availability across the three centers. This is an issue that has been observed in previous meta-analyses of cochlear implantation outcomes (Zhao et al., 2020; Lazard et al., 2012) due to the inconsistent data collection across centers. Such data missingness, while common in the medical domain, limits the ability to examine combined effects of each factor or conduct comparable multivariate analyses across datasets. Although the future exploration of imputation techniques may mitigate this issue and increase the variance explained, such approaches are not a substitute for improved data collection. Moreover, the use of artificial intelligence and machine learning, which are helping advance many health care-related fields but remain nascent in predicting CI outcomes (Chen & Asch, 2017; Crowson et al., 2020a, 2020b), will be greatly improved with larger, more cohesive datasets, which enable more accurate predictive performance.
Given this, a key outcome of this study is to further highlight how standardization of data collection is critical to further improve our understanding of outcomes related to cochlear implantation, supporting many other efforts to advance this cause. According to a 2018 analysis (Adunka et al., 2018), this process will be a global effort that requires collaboration between manufacturers, HA distributors, cochlear implantation clinics, hospitals, and governments to integrate audiological data with other health data, following the example set by the UK NHS Hearing Health Informatics Collective initiative. Although such standardization is difficult to implement, such systems have been implemented successfully in cancer pathology reporting (Srigley et al., 2009), where adherence to a controlled vocabulary has enabled greater rigor in epidemiological studies across multiple institutions, leading to improved patient outcomes (Williams et al., 2015).
There are several limitations of our current analysis that may impact the interpretation of results. For some predictive factors, our analysis led to different results for the three datasets despite applying the same inclusion criteria for patients. Interpreting such results is difficult given the datasets differ in a number of factors, including cohort differences, testing protocol and/or setup differences, and patient selection criteria, due to differing regulatory rules across countries.
Moreover, despite analyzing the largest number of preoperative factors in a predictive factor analysis, our dataset lacked certain features that have previously been shown to be associated with outcome performance. These include previously studied factors about the implantation itself such as electrode placement (Holden et al., 2013), insertion depth (James et al., 2019), implant brand, and the number of active electrodes during stimulation (Lazard et al., 2012). Information about rehabilitation, a patient’s domestic or work environment, medication, comorbidities, cognitive or education level, and social interaction are also likely to increase the explained variance.
A further limitation stems from the selected hearing outcome variable. The use of a single test at a single time point may have limited the power of our analysis, given that hearing outcome is known to change across tests and across time. Instead, combining multiple measures of hearing performance and evaluating these longitudinally may provide a cleaner signal that improves both our ability to detect significant predictive factors and to predict an individual’s likely outcome. In addition, the assessment of hearing performance tested with a low number of monosyllabic words introduces limitations on the granularity of our data, as well as contributing to the variance of the measurement results. Finally, tests may not be conducted if they are perceived by the patient as too hard, particularly on the lower end of word recognition performance. In that case, alternative test protocols were used by clinicians that were not included in our analysis.
The results presented in this paper largely align with previous studies, with several findings advancing our understanding of the relationships between predictive factors. Although the findings explain only a modest amount of the variability of WRS outcomes, they shed light on the nature of several interactions and highlight the ongoing need for data standardization. These results will be complemented by an exploration of nonlinear machine learning-based approaches to explain variation on CI outcome. Furthermore, it is increasingly apparent that predictive factors that are currently being collected are insufficient for strong predictive performance. Instead, factors that more directly capture aspects of the implantation itself, the individual’s environment (before and after implantation), and the nature of their HL are promising candidates to consider. These directions combined should lead to significant improvements in our ability to explain implantation outcomes beyond improvements in sample size alone.
Footnotes
Acknowledgments
This research has been conducted primarily while all authors employed by their institutional affiliations. The authors would like to thank Dwarikanath Mahapatra, Benjamin Scott Mashford, Christine Schieber, Kerry Halupka, Suman Sedai, Andrei Pavlov, Andrew Rawlinson, Jianbin Tang, and Gregory Cameron. Without their contributions, insightful discussion, and assistance in preprocessing the three datasets, this study would not have been possible.
Declaration of Conflicting Interests
The authors declared no potential conflicts of interest with respect to the research, authorship, and/or publication of this article.
Funding
The author(s) disclosed receipt of the following financial support for the research, authorship, and/or publication of this article: The collection of the VUMC dataset was supported by a research project grant no. NIH NIDCD R01 DC13117 (principal investigator: Gifford).
Supplemental Material
Supplemental material for this article is available online.
References
Supplementary Material
Please find the following supplemental material available below.
For Open Access articles published under a Creative Commons License, all supplemental material carries the same license as the article it is associated with.
For non-Open Access articles published, all supplemental material carries a non-exclusive license, and permission requests for re-use of supplemental material or any part of supplemental material shall be sent directly to the copyright owner as specified in the copyright notice associated with the article.