
Abstract
Spectro-temporal modulation (STM) sensitivity has been proposed as a sensitive marker of speech intelligibility in challenging listening conditions, yet the underlying auditory mechanisms involved in STM detection remain incompletely understood. The present study measured STM detection thresholds in young normal-hearing and older hearing-impaired listeners and evaluated whether the revised Computational Auditory Signal Processing and Perception model (CASP) can account for individual performance. Thresholds were obtained for six modulation detection conditions, defined by combinations of spectral (0, 1, and 2 c/o) and temporal (4 and 12 Hz) rates. To individualize CASP, outer and inner hair cell loss estimates were obtained from audiometric and Adaptive Categorical Loudness Scaling (ACALOS) data. The results showed systematically elevated thresholds in older hearing-impaired listeners as compared to the young normal-hearing group, particularly at higher spectral rates. The model simulations reproduced overall threshold patterns, but substantially underestimated group differences and interindividual variability in the data. Moreover, the simulations showed limited sensitivity to estimates of outer and inner hair cell loss, supporting the idea that additional supra-threshold mechanisms contribute to STM deficits. While these findings demonstrate the potential of auditory models to predict STM performance, they also highlight the need for refined representations of peripheral and central processing to account for individual STM detection thresholds.
Keywords
Introduction
Accurately characterizing the sources and consequences of individual hearing loss remains a central challenge in auditory science. A fundamental distinction is typically drawn between reduced audibility and supra-threshold deficits. Audibility limitations—commonly assessed with pure-tone audiometry or speech-in-quiet tests—reflect elevated detection thresholds and are often compensated for by amplification, restoring near-normal performance in quiet listening conditions in many cases (Plomp, 1978). Nevertheless, many listeners continue to experience difficulties when sounds are presented well above threshold, in the so-called supra-threshold conditions (Dreschler & Plomp, 1985; Glasberg & Moore, 1989; Lopez-Poveda, 2014; Plomp, 1978). These difficulties are especially pronounced in noisy or complex environments and cannot be explained by audibility alone, pointing to additional deficits in auditory processing. Despite decades of research, the precise mechanisms underlying supra-threshold deficits remain only partly understood.
To investigate these mechanisms, numerous studies have examined supra-threshold deficits in specific auditory domains. Temporal processing has been assessed using tasks such as gap detection, temporal modulation transfer functions (TMTFs), and temporal fine structure sensitivity (Buss et al., 2004; Lorenzi et al., 2006; Oxenham & Moore, 1997; Qin & Oxenham, 2003; Regev et al., 2023). Spectral processing has been probed with measures of frequency selectivity and spectral masking (Dreschler & Plomp, 1985; Festen & Plomp, 1983; Glasberg & Moore, 1990; van Schijndel et al., 2001), while binaural processing has been evaluated through sensitivity to interaural time and level differences, as well as binaural masking level differences (Gabriel et al., 1992; Hall et al., 1984). A central motivation for these studies has been to determine whether such measures can predict individual speech-in-noise performance (Dreschler & Plomp, 1985; Houtgast & Festen, 2008; Johannesen et al., 2016; Strelcyk & Dau, 2009; Thorup et al., 2016). While informative, these measures typically explain only a modest portion of the variance in speech reception thresholds (SRTs) among hearing-impaired (HI) listeners.
Spectro-temporal modulation (STM) processing has received particular attention as a key ability supporting speech understanding (Singh & Theunissen, 2003; Venezia et al., 2019). STM detection thresholds measure sensitivity to combined temporal and spectral fluctuations, and, unlike other psychoacoustic tasks, have shown robust predictive power for speech intelligibility beyond the audiogram (Bernstein et al., 2016, 2013; Zaar et al., 2024). This has motivated the development of STM-based diagnostics, most prominently the clinically viable Audible Contrast Threshold (ACT) test (Zaar et al., 2023, 2024). Early work by Chi et al. (1999) characterized STM detection in normal-hearing (NH) listeners, deriving spectro-temporal modulation transfer functions (MTFs) across a range of temporal (Hz) and spectral (cycles/octave, c/o) modulation rates. The MTFs showed low-pass characteristics in both dimensions, consistent with earlier findings on temporal resolution (Viemeister, 1979) and spectral resolution (Eddins & Bero, 2007; Green, 1986). Building on this, Bernstein et al. (2013) measured STM sensitivity in NH and HI listeners using a four-octave pink noise carrier modulated at combinations of temporal (4, 12, and 32 Hz) and spectral (0.5, 1, 2, and 4 c/o) rates. HI listeners showed reduced sensitivity at low temporal and high spectral rates, with the largest group difference at
Despite its diagnostic potential, the auditory mechanisms underlying STM detection are not yet fully understood. Evidence suggests that STM performance reflects multiple processes, with temporal fine structure (TFS) encoding contributing more strongly at lower frequencies and frequency selectivity playing a greater role at higher frequencies (Bernstein et al., 2013; Mehraei et al., 2014). Specifically, Bernstein et al. (2013) showed that STM performance using a broadband carrier was jointly predicted by sensitivity to low-rate (500 Hz) frequency modulation (FM)—linked to TFS processing—and by high-frequency (4 kHz) frequency selectivity measured with notched-noise masking. This finding provided initial evidence for the involvement of multiple contributing mechanisms. Building on this result, Mehraei et al. (2014) employed narrowband (one-octave) carriers centered at 0.5, 1, 2, and 4 kHz to probe frequency regions in which different mechanisms are expected to dominate. This approach enabled a more direct association of low-frequency STM performance with TFS-based temporal coding and high-frequency STM performance with frequency selectivity, thereby providing further support for a dual-mechanism account of STM detection. This interpretation is based on statistical associations between behavioral measures; however, the underlying physiological mechanisms linking these measures to STM performance remain to be established.
Rather than relying solely on statistical associations between STM thresholds and individual psychoacoustic measures, the present study adopts a computational modeling approach using the Computational Auditory Signal Processing and Perception model (CASP, Jepsen & Dau, 2011; Jepsen et al., 2008; Paulick et al., 2025). Auditory models such as CASP provide a framework for identifying which auditory processing stages may limit performance in a given task and how hearing loss may alter these stages. A model that can predict individual STM thresholds has the potential to both help clarify the underlying mechanisms and to support the development of personalized diagnostic and compensatory strategies.
Earlier modeling work introduced the STM index (STMI), which combines a peripheral transformation with an explicit spectro-temporal analysis using a bank of modulation-selective filters tuned to different scales and rates. This model was consistent with TMTFs measured in NH listeners and successfully predicted speech intelligibility under various distortions (Chi et al., 1999; Elhilali et al., 2003). In contrast, CASP implements separate spectral and temporal modulation filterbanks, simulating nonlinear frequency selectivity and temporal modulation frequency selectivity, respectively. The present study evaluates whether CASP can account for STM detection thresholds without explicit spectro-temporal tuning. By doing so, we aim to determine the extent to which STM sensitivity can be explained by core auditory processing stages, as implemented in CASP, and to identify which aspects of hearing loss most strongly influence this ability.
The CASP model simulates auditory processing through a cascade of peripheral and central stages, including nonlinear frequency selectivity, adaptation mechanisms, and temporal modulation frequency selectivity, followed by a decision stage based on an optimal detector designed for n-alternative forced choice (AFC) paradigms (Green & Swets, 1988). CASP has successfully predicted performance in a wide range of psychoacoustic tasks with NH listeners (Jepsen et al., 2008; Paulick et al., 2025) and has been extended to capture average effects of hearing loss (Jepsen & Dau, 2011). In addition, a speech-based variant of the model (sCASP, Relaño-Iborra et al., 2019) has been applied to predict speech intelligibility in noise.
In the present study, we measured STM detection thresholds in two listener groups: young NH (yNH) listeners and older HI (oHI) listeners. We tested a subset of the STM conditions used by Bernstein et al. (2013), selecting temporal modulation rates of 4 and 12 Hz and spectral modulation rates of 1 and 2 c/o. All STM stimuli were imposed on a low-frequency pink-noise carrier, following the carrier configuration of the ACT paradigm (Zaar et al., 2024). The ACT paradigm itself corresponds specifically to the 4 Hz, 2 c/o modulation condition. For comparison, we also measured pure temporal (AM) detection thresholds at the same temporal rates using the same carrier.
To further characterize auditory processing in the oHI group, participants completed the Adaptive Categorical Loudness Scaling test (ACALOS, Brand & Hohmann, 2002), which provided individual estimates of nonlinear loudness growth. These parameters were incorporated into CASP to individualize the model’s front-end stages. Following established modeling frameworks (Chalupper & Fastl, 2002; Jürgens et al., 2011; Moore & Glasberg, 1997; Stefan et al., 2019), the overall audiometric hearing loss was decomposed into contributions from outer hair cell (OHC) and inner hair cell (IHC) dysfunction. This individualized modeling enabled us to simulate STM performance for each listener and to evaluate whether CASP can account for the observed across-listener variability.
Experimental Methods
Listeners
Ten yNH listeners (4 female, age range: 22–30 years, mean age = 23.9 years) and 10 oHI listeners (2 female, age range: 54–80 years, mean age = 74.2 years) participated in the study. All listening tests were conducted monaurally. The oHI listeners had sensorineural hearing loss in both ears with no history of conductive impairment, and the tested ear was randomly selected. The yNH listeners had audiometric thresholds

Audiometric thresholds for the tested ears of the young normal-hearing (yNH, left panel) and older hearing-impaired (oHI, right panel) listeners. Individual thresholds are shown in gray, with the mean and standard deviation across listeners shown in black.
Procedure and Apparatus
All listening tests were conducted in single-walled, soundproof booths. Stimuli were generated in
(Spectro)-Temporal Modulation Detection Task
An STM stimulus consists of a carrier signal modulated by a combination of spectral and temporal modulations, producing upward- or downward-moving ripples in the spectrum. The stimulus followed the design described by Zaar et al. (2023, 2024). The carrier was generated in the frequency domain by summing 2,499 random-phase tones, equally spaced along a logarithmic frequency axis spanning

STM thresholds were measured using a three-interval, three-alternative forced-choice (3I-3AFC) procedure with a 1-up-2-down tracking rule, targeting the
Thresholds were measured in three blocks (order randomized) defined by spectral modulation rate: pure AM (0 c/o),

Auditory spectrograms of the stimuli used in the AM and STM detection tasks. Spectral ripple rates (0, 1, and 2 c/o; horizontal dimension) were combined with temporal modulation rates (4 and 12 Hz; vertical dimension). All modulations were applied to a 2.5-octave-wide noise carries with an upper cutoff frequency of 2 kHz. Spectrograms are shown for fully modulated stimuli (M = 0 dB). During testing, modulation depth was adaptively varied to estimate the detection threshold for each AM and STM condition. AM = amplitude modulation; STM = spectro-temporal modulation.
Participants received visual feedback after each trial indicating whether their response was correct. For STM conditions, one training run was completed per STM combination. For AM conditions, one training run was completed for the
Adaptive Categorical Loudness Scaling (ACALOS)
The ACALOS test (ISO 16832, 2006) was administered following the procedure described by Brand and Hohmann (2002). Stimuli were one-third-octave band noises with center frequencies of
Statistical Analysis
Statistical analyses were performed on the measured (spectro)-temporal modulation detection thresholds using a repeated-measures analysis of variance based on fits of a linear mixed-effects model. The model included group (yNH vs. oHI), temporal modulation rate, and spectral modulation rate as fixed effects, and listener as a random effect. All main effects and their interactions were tested. Model assumptions were checked using Levene’s test for homogeneity of variance and the Shapiro-Wilks test for normality of residuals. Significant interactions were followed up with Holm-Bonferroni-corrected post-hoc pairwise comparisons. The significance level was set to 0.05 for all analyses.
Auditory Processing Model
The preprocessing stages of the CASP model are illustrated in Figure 3 and follow the framework described by Jepsen et al. (2008) and Paulick et al. (2025). Briefly, the input signal passes through outer- and middle-ear filters, followed by a dual-resonance nonlinear filterbank (DRNL, Lopez-Poveda & Meddis, 2001) that simulates level-dependent frequency selectivity. The filterbank output is then processed by a nonlinear IHC stage, introduced by Paulick et al. (2025), which captures saturation at high sound pressure levels. This is followed by an adaptation stage consisting of five cascaded feedback loops (Püschel, 1988). Finally, the signal is decomposed into modulation subbands using a temporal modulation filterbank, yielding a three-dimensional internal representation with dimensions of time, auditory frequency, and modulation frequency. The final preprocessing stage limits access to modulation-phase information at higher temporal rates (above

Preprocessing stages of the CASP model that construct the three-dimensional internal representation. Sensorineural hearing loss is simulated via (i) outer hair cell (OHC) loss, implemented as a modification of the broken-stick nonlinearity in the dual-resonance nonlinear (DRNL) filterbank, and (ii) inner hair cell (IHC) loss, implemented as an attenuation at the output of the IHC stage.
The model backend consists of an optimal detector designed for
Among the preprocessing stages, the DRNL filterbank plays a central role in simulating sensorineural hearing loss (SNHL). The DRNL filterbank implements level-dependent frequency selectivity using two parallel pathways: a linear path controlled by a gain parameter, and a nonlinear path incorporating a broken-stick nonlinearity. Together, these pathways shape the DRNL input–output (I/O) function:

To simulate SNHL within this framework, it is assumed that the total audiometric hearing loss can be separated into contributions from OHC and IHC dysfunction (Jepsen & Dau, 2011; Lopez-Poveda & Johannesen, 2012; Moore & Glasberg, 1997):

Based on the estimated

Select adjustments were made to the model implementation compared to that described by Paulick et al. (2025), specifically in the DRNL filterbank parametrization, the modulation phase sensitivity implementation and backend metric. Details regarding these adjustments, as well as a backwards-compatibility assessment using the same benchmark experiments as by Paulick et al. (2025), are given in the Appendix.
Results
Experimental Results
Modulation detection thresholds for the yNH listeners (blue) and the oHI listeners (red) are shown in Figure 4 as a function of spectral rate (0, 1, and 2 c/o) at two temporal rates: 4 Hz (left panel) and 12 Hz (right panel). The statistical analysis revealed significant main effects of group (

Boxplots of (spectro)-temporal modulation detection thresholds for yNH (blue) and oHI (red) listeners across temporal and spectral rate combinations. Left: Thresholds at 4 Hz as a function of spectral rate (0, 1, and 2 c/o). Right: Thresholds at 12 Hz. Individual data are shown as crosses. In boxplots, boxes represent the interquartile range (IQR; 25th–75th percentiles), central lines indicate medians, and whiskers extend to 1.5
Model Predictions
The top panels of Figure 5 show AM and STM thresholds for yNH listeners (dark-blue circles) alongside CASP predictions (light-blue circles). The model captured the general trends observed in the data, namely lower STM thresholds at 4 Hz compared to 12 Hz and a monotonic increase in thresholds with spectral rate at 12 Hz. However, at 4 Hz, the model overestimated AM sensitivity and predicted a performance drop from AM to STM that was not observed in the data, thereby exaggerating the AM-STM difference. Quantitatively, predictions for NH listeners yielded a mean absolute error (MAE) of 2.18 dB and a strong correlation with empirical means across conditions (Pearson’s
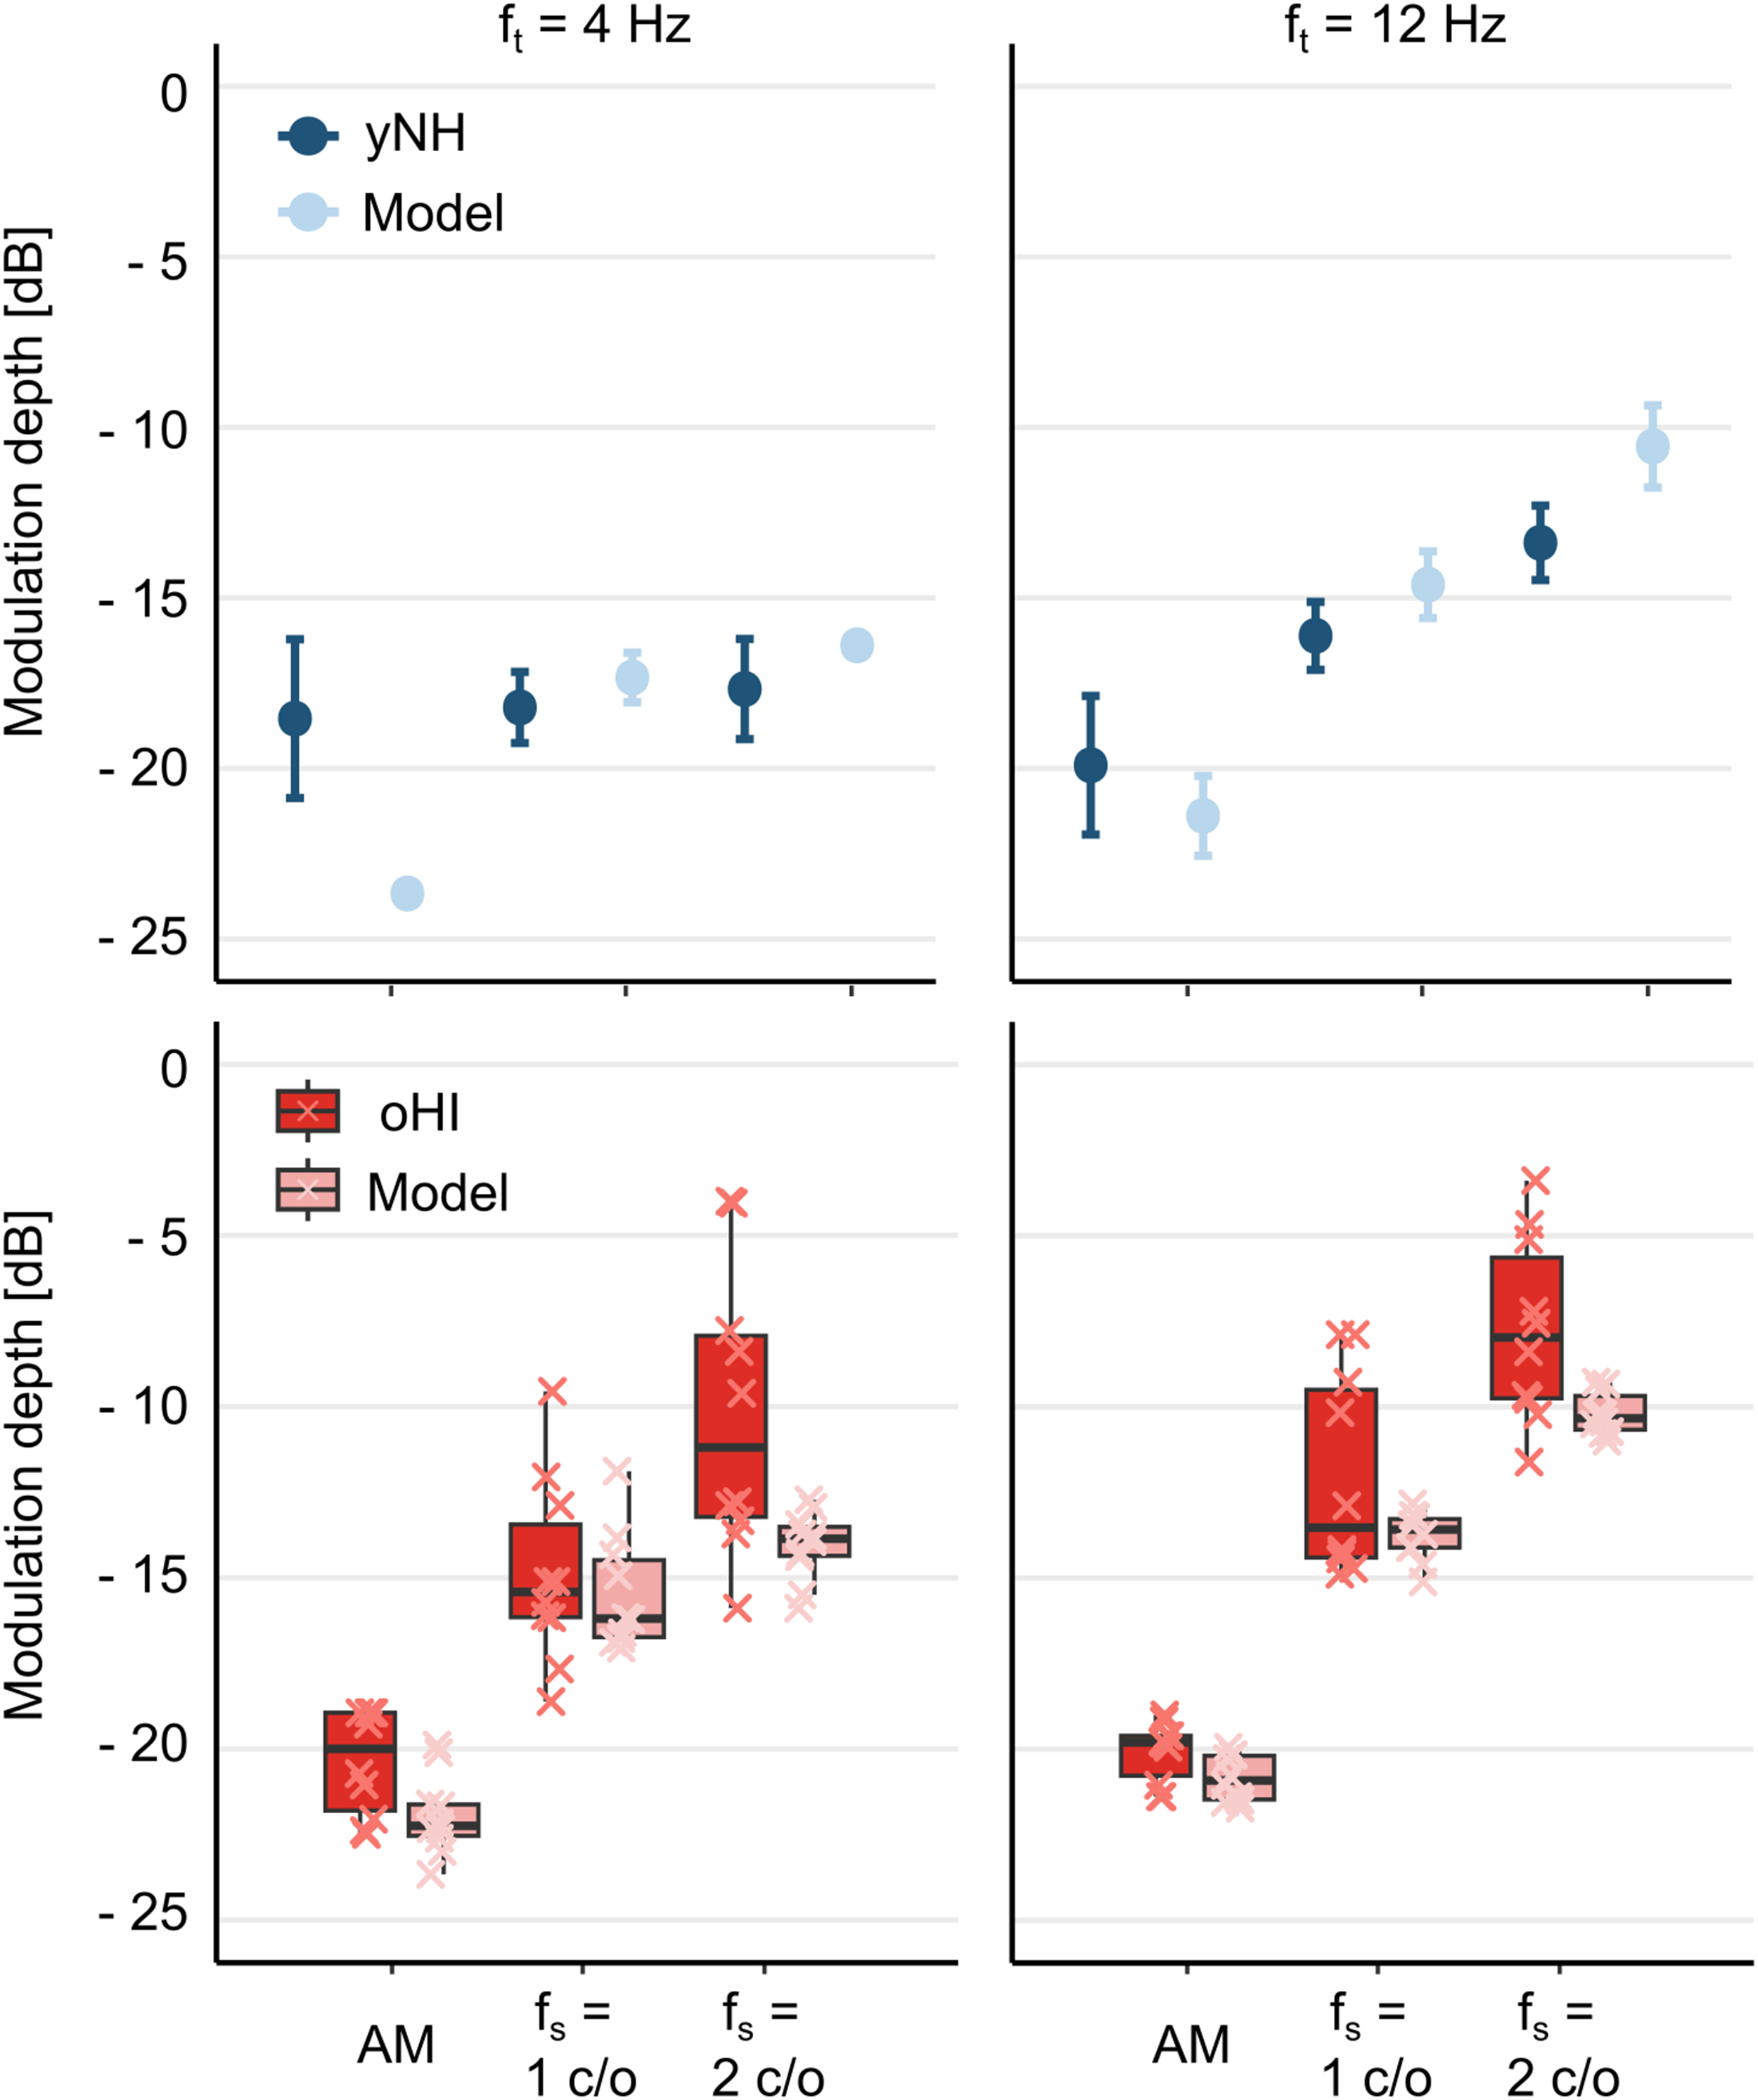
Top: AM and STM thresholds for yNH listeners (dark-blue symbols with errorbars) and CASP predictions (light-blue symbols with errorbars). Error bars represent the SD across repeated simulations. The model achieved a mean absolute error of 2.18 dB and correlated strongly with listener data (
The bottom panels of Figure 5 show measured and predicted thresholds for oHI listeners. Predictions relative to the group average yielded an MAE of

Group differences in modulation depth at threshold (
Figure 7 shows scatter plots of predicted versus measured thresholds for individual HI listeners across AM and STM conditions at 4 Hz (left) and 12 Hz (right). Group-averaged NH thresholds and model predictions are additionally plotted for reference. On an individual level, the model particularly fails to accurately predict thresholds from the worst performers in the STM tasks, that is, those with the highest thresholds. Overall, when pooling across conditions, predictions correlated strongly with the behavioral data (

Predicted versus measured thresholds for individual HI listeners (red) across AM and STM conditions at 4 Hz (left) and 12 Hz (right). Group-averaged NH thresholds and model predictions (blue) are shown for a reference. Condition types (AM, 1 c/o, and 2 c/o) are indicated by markers. The dashed line indicates perfect agreement. Pooled across conditions, predictions correlated strongly with the data (
Pearson’s Correlations (

Abbreviations: HI = hearing-impaired; AM = amplitude modulation
Discussion
This study evaluated the ability of the CASP model to predict STM detection thresholds in yNH and oHI listeners. The model reproduced several aspects of the measured data, including the higher sensitivity (i.e., lower thresholds) to lower temporal rates in the STM condition. However, discrepancies with the human data were also observed, particularly the inability to capture the stable performance of yNH listeners across spectral rates at the lower temporal modulation frequency, the pronounced STM deficits at higher spectral rates, and the variability across oHI listeners. The simulations provide insights into potential mechanisms contributing to STM detection in both NH and HI listeners, while also highlighting specific auditory processes that warrant further investigation.
For yNH listeners, STM detection performance was stable across spectral densities at 4 Hz but declined with increasing spectral density at 12 Hz. This pattern is consistent with earlier reports of robust low-rate modulation sensitivity and increasing difficulty when spectral and temporal modulations are combined at higher rates (Bernstein et al., 2013). Two mechanisms have been proposed to explain this behavior: (i) frequency selectivity, which determines the extent of spectral smearing across channels as density increases (Bernstein et al., 2013; Mehraei et al., 2014), and (ii) TFS coding, which may provide cues for detecting slow frequency modulations at low carrier frequencies (Bernstein et al., 2013; Mehraei et al., 2014; Moore & Sek, 1996; Moore & Skrodzka, 2002). From this perspective, good performance at 4 Hz reflects reliance on TFS-based coding of spectral-peak fluctuations, whereas the rise in thresholds at higher temporal rates occurs once TFS cues are no longer available and listeners must rely on AM cues that are degraded by limited frequency resolution.
The CASP model predictions were broadly consistent with the observed NH data but offered a different mechanistic interpretation. The model captured the pattern observed in the human data whereby STM detection thresholds were lower at 4 Hz than at 12 Hz and increased monotonically with spectral rate at 12 Hz. Importantly, these trends emerged not from an explicit TFS-processing mechanism, but from limitations in modulation-phase sensitivity implemented in the model. At lower temporal modulation rates (below
The 10-Hz phase-sensitivity cutoff implemented in the model was motivated by findings from Dau (1996) who tested three normal hearing listeners’ ability to discriminate
Notably, the model overestimated sensitivity, that is, predicted lower thresholds, in the 4-Hz AM condition, likely because it benefited from phase cues that human listeners either do not access or do not exploit in simple AM detection tasks. Thus, any benefit from phase information seems to arise primarily in conditions where modulation varies across frequency, such as STM. The model, by contrast, treats all phase cues as informative, regardless of their distribution across channels. The failure to reproduce flat performance across spectral rates at 4 Hz, therefore, likely reflects an overestimation of AM sensitivity rather than an underestimation of STM thresholds. Incorporating a stage that applies modulation-phase sensitivity selectively—enhancing detection only when there is meaningful across-frequency coherence—would likely improve predictions and bring them closer to human performance.
For HI listeners, AM detection was broadly comparable to that of NH listeners, consistent with previous studies (Moore & Glasberg, 2001; Regev et al., 2024; Schlittenlacher & Moore, 2016; Wallaert et al., 2017; Wiinberg et al., 2019). In contrast, STM detection was substantially impaired, with threshold elevations of up to 7.43 dB relative to the NH group. CASP simulations, however, predicted only modest elevations (up to 2.33 dB) and showed little variability across individualized predictions. This mismatch suggests that the current model does not fully capture the mechanisms underlying STM deficits in HI listeners, particularly for those performing worst in the STM task. This limitation may reflect missing processing stages in the model, or shortcomings in how hearing loss is individualized. Simulated thresholds were relatively insensitive to estimates of OHC and IHC losses, with only large amounts of IHC loss producing measurable effects. This indicates that the model primarily reflected audibility limitations.
The limited influence of simulated OHC loss likely stems from the high presentation level (85 dB SPL). At such levels, the DRNL filterbank is dominated by its linear pathway, reducing frequency selectivity even in the NH configuration (Lopez-Poveda & Meddis, 2001). The OHC-loss parameter decreases nonlinear gain, effectively lowering the level at which the linear path starts to dominate. This broadens filters at low to mid levels but has little effect at higher levels, where tuning is already governed by the unchanged linear path in both NH and HI simulations. This behavior is consistent with psychophysical findings showing minimal differences in frequency selectivity between NH and HI listeners at high presentation levels (Carney & Nelson, 1983; Dubno & Schaefer, 1991; Florentine, 1978). Low-pass filtering of the noise carrier at 2 kHz further limited the expected influence of OHC loss. The DRNL constrains the extent of implementable OHC loss at low frequencies, consistent with evidence for reduced cochlear gain in apical regions (Plack et al., 2008; Robles & Ruggero, 2001), making extensive OHC-related loss less likely in this range. Consequently, most of the simulated hearing loss under the present stimulus conditions was attributed to IHC dysfunction (Johannesen et al., 2014). This interpretation is also consistent with previous STM studies (e.g., Mehraei et al., 2014), which emphasized the role of frequency selectivity primarily at higher carrier frequencies not tested here. Taken together, these considerations indicate that differences in frequency selectivity between NH and HI listeners were unlikely to have substantially influenced STM detection thresholds in this study.
Instead, IHC loss emerged as the primary determinant of elevated thresholds in the simulations, although the variability introduced by this parameter remained limited. The impaired DRNL sets the operating point along the IHC nonlinearity, but the inputs reaching the IHC stage after cochlear transformation showed restricted variability under the present stimulus conditions. IHC loss is then implemented as an attenuation applied to the IHC output. This approach captures audibility limitations for large losses but appears insufficient to account for more subtle supra-threshold deficits. The precise ways in which IHC loss alters the IHC input–output function remain incompletely understood (Patra et al., 2024). Moreover, the IHC-loss parameter functions as a catch-all for residual threshold elevation not explained by OHC contributions, and therefore likely conflates multiple impairments rather than providing a physiologically specific description of IHC dysfunction.
The role of other possible impairments, such as possible effects of neural deafferentation, remains unclear. Existing models of transduction (Lopez-Poveda, 2014) could be integrated into the present framework to explore their potential impact on STM encoding. Importantly, modulation-phase sensitivity—critical for accounting for the low-rate advantage in STM conditions for NH listeners—may also contribute to deficits observed in HI listeners. In the CASP model, current OHC and IHC impairments do not alter the representation of modulation phase or the integration of cues across frequency, which may explain why STM thresholds were only minimally affected. Modeling studies of speech perception have shown that explicitly analyzing coherence across auditory channels improves intelligibility predictions under phase-distorted noisy conditions (Chabot-Leclerc et al., 2014; Elhilali et al., 2003; Relaño-Iborra et al., 2019). However, it remains unclear how hearing loss or ageing may affect modulation-phase sensitivity or across-frequency integration. Extending CASP to include impairments in modulation-phase processing could, therefore, provide a mechanistic account of the pronounced STM deficits in HI listeners, but targeted empirical studies are needed to inform such model developments.
Several limitations of the present study should be considered when interpreting the findings. A first limitation concerns the use of a fixed presentation level (85 dB SPL) without amplification for HI listeners, leading to differences in sensation level across listeners. This was a design choice aimed at facilitating interpretation of the modeling results. By keeping the acoustic input identical across listeners, differences in model predictions could be attributed unambiguously to the simulated hearing loss rather than to individualized stimulus levels. In contrast, equating sensation levels would have introduced additional individualized stimulus differences that are difficult to disentangle within the modeling framework. However, this choice may have reduced audibility at certain frequencies for some HI participants, potentially leading to an underestimation of their STM sensitivity. Nevertheless, measurable thresholds were obtained for all listeners in all conditions, and the range of STM thresholds was comparable to that reported in studies using amplification (Zaar et al., 2023). This consistency further supports the view that STM detection captures aspects of supra-threshold auditory processing beyond the audiogram. Elevated presentation levels can also negatively affect modulation sensitivity in NH listeners (Magits et al., 2019). To address these issues, Zaar et al. (2023) applied individualized linear amplification in STM tasks, ensuring adequate audibility while avoiding unnecessarily high levels and providing more ecologically valid listening conditions. Future work should consider adopting this approach and testing whether the model can predict STM thresholds when audibility is systematically restored. Comparisons across unaided listening, individualized linear amplification, and more realistic hearing-aid processing with nonlinear gain would provide a more stringent and ecologically relevant evaluation of the model’s predictive power. Furthermore, unlike in previous STM paradigms the modulation starting phase was fixed within each run and randomized across runs. This modeling choice was required by the use of fixed templates, as the current implementation cannot reliably detect modulation when stimulus and template phases are mismatched. Although this design could, in principle, allow listeners to exploit short-term, frequency-specific level cues, behavioral performance was stable across repetitions and comparable to earlier studies, suggesting that such cues were unlikely to have played a dominant role. This limitation reflects a current constraint of the model that could be addressed in future.
A second limitation concerns the re-parametrization of certain model stages that was necessary to account for the present dataset—specifically, the DRNL filterbank and the modulation phase-sensitivity stage. The revised CASP implementation (Paulick et al., 2025) employed relatively broad auditory filters (cf. Osses Vecchi et al., 2022, for model comparisons). Although this reduced frequency selectivity had little impact on simulated NH–HI group differences at the high presentation levels used here, it did affect the magnitude of the threshold reduction from AM to the 2 c/o STM condition, leading to a loss of sensitivity at 2 c/o that exceeded the empirical data. This aligns with earlier observations that limited frequency selectivity particularly hampers detection at higher spectral ripple densities, where closely spaced peaks cannot be resolved by broader filters (Mehraei et al., 2014). To address this, we re-instated the original DRNL implementation (Lopez-Poveda & Meddis, 2001), simplified by omitting the characteristic-frequency shift with level. These changes produced overall sharper auditory filters at high levels. In parallel, the phase-sensitivity stage was revised, as the earlier implementation produced substantial residual phase cues at higher modulation frequencies (see the Appendix for implementation details). The updated stage more effectively suppressed these cues. Although these adjustments were validated for backward compatibility with prior datasets (see the Appendix, Section d.), they underscore a broader concern: parameter modifications that improve descriptive accuracy for a specific dataset may compromise generalizability and complicate the functional interpretation of model parameters. Future work should therefore evaluate the robustness of these re-parametrizations across larger and more varied datasets to ensure that the model continues to reflect plausible auditory mechanisms with interpretable parameters.
Finally, a more fundamental limitation concerns the reliance on audiogram-based individualization when attempting to predict supra-threshold performance such as STM detection. STM thresholds are thought to probe aspects of auditory processing that extend beyond audibility and are, therefore, only partially constrained by the audiogram. In this study, peripheral deficits were estimated in two ways: the proportion of OHC loss was derived from ACALOS loudness-growth data using a loudness model to capture recruitment, while IHC loss was inferred from the residual audiometric loss after accounting for OHC contributions. Although this partitioning provides a principled framework, it remains inherently tied to the audiogram and inherits uncertainties from the loudness-model fitting, which propagate into the individualization process. In the present study, the impact of these uncertainties was likely limited, as STM thresholds were relatively insensitive to the precise OHC/IHC parameter values. More broadly, however, audiogram-based individualization cannot capture other contributors to STM variability—such as synaptopathy, central auditory changes, or cognitive factors—and interpreting residual audiometric loss as IHC dysfunction risks conflating peripheral and nonperipheral sources of variability.
Still, pure-tone thresholds often covary with supra-threshold phenomena such as frequency selectivity and loudness recruitment (Sanchez-Lopez et al., 2020), and several studies have shown that audiogram-based predictors explain a substantial proportion of variance in speech outcomes (Bernstein et al., 2016, 2013; Zaar et al., 2023). Within this framework, audiogram-based models may be best viewed as defining the variance attributable to peripheral deficits, thereby clarifying the extent to which residual variability must arise from other mechanisms. This perspective also highlights the potential of STM thresholds themselves to serve as complementary individualization metrics, extending beyond audiogram-based parameters and enabling more comprehensive accounts of interindividual differences in speech perception.
Conclusion
This study examined STM detection in NH and HI listeners and evaluated the ability of an individualized auditory model to predict these STM detection thresholds. CASP reproduced general threshold patterns across temporal and spectral rates but failed to fully capture group differences and the pronounced variability across individuals. Model predictions showed limited sensitivity to OHC and IHC loss estimates, indicating either that other mechanisms contribute to STM deficits or that current implementations of these impairments are insufficient. Within the model framework, modulation-phase sensitivity emerged as a key factor for explaining NH performance at low and high temporal rates, highlighting its potential importance for understanding STM processing more broadly. Future work should investigate the role of modulation-phase sensitivity in speech perception and examine how hearing loss alters this mechanism, alongside contributions from other mechanisms, such as neural deafferentation, central auditory changes, and age-related and cognitive factors. Moreover, future work could explore incorporating STM thresholds as an individualization metric, beyond traditional audiogram-based approaches. This may enable the development of auditory models that more accurately predict speech performance and provide a stronger basis for hearing-aid evaluation.
Appendix: Model Adjustments
Select adjustments were made to the model implementation compared to that described by Paulick et al. (2025). The following sections provide a detailed account of these changes, followed by an assessment of their backward compatibility. Specifically, the modified model was re-evaluated on the same benchmark experiments used by Paulick et al. (2025)—intensity discrimination, forward masking, and modulation detection—to verify that its predictive performance was maintained.
DRNL Filterbank
For the NH simulations, the original parametrisation of the DRNL model proposed by Lopez-Poveda and Meddis (2001) was adopted, rather than the implementation used by Paulick et al. (2025). The key difference lies in the number of cascaded gammatone and low-pass filters in the linear and nonlinear paths. In the modified linear path, three gammatone filters and four low-pass filters were applied (compared to two gammatone and four low-pass filters by Paulick et al. (2025)), while the nonlinear path comprised a cascade of three gammatone and three low-pass filters (compared to two and one, respectively, by Paulick et al. (2025)). The DRNL implementation of Paulick et al. (2025) was aligned with that used in the speech-based sCASP model (Relaño-Iborra et al., 2019). A comparative study of auditory models demonstrated that this version produced comparatively broad filters (Osses Vecchi et al., 2022). By reverting to the original DRNL (Lopez-Poveda & Meddis, 2001) parametrization, we aimed to restore sharper frequency selectivity which proved necessary to capture the trends in the STM data. In addition, one simplification was introduced: the center frequencies and cutoffs of the gammatone and low-pass filters were fixed to the characteristic frequency, independent of level. Unlike the original formulation, no level-dependent frequency shifts with increasing sound pressure level were implemented here. This choice reflects more recent findings that challenge the notion of characteristic-frequency shifts at higher levels (Moore & Glasberg, 2003).
Modulation Phase Sensitivity
The implementation of the modulation phase-sensitivity stage was slightly modified compared to earlier work, while the underlying rationale remained unchanged—namely, to reduce phase information in the internal representation above 10 Hz. In the present study, the real output of the modulation filterbank was first obtained. For filters with center frequencies at and above 10 Hz, the Hilbert envelope of this real output was then calculated and subsequently low-pass filtered with a 10 Hz cutoff, while preserving the overall energy at the filterbank output. For filters centered below 10 Hz, the real filter output was used directly. This procedure produced a stronger suppression of phase information at high modulation frequencies than the earlier implementation. In previous work, phase sensitivity had instead been reduced by taking the real part of the modulation filter output for
Back-End Stage
In the model backend, a supra-threshold template was generated prior to each run and correlated with the three alternative intervals across all dimensions of the internal representations. The correlation was computed as follows:
Backwards Compatibility
The backward compatibility of these adjustments was evaluated by rerunning the benchmark experiments reported by Paulick et al. (2025), including intensity discrimination, forward masking, and modulation detection for NH listeners. Table 2 presents the mean absolute error and Pearson correlation with human data for each task, comparing the predictions of the previous model with those obtained using the modified implementation described above. Overall, similar performance of the two model implementations can be observed across the different experimental conditions.
Backward Compatibility Assessment: MAE and Pearson Correlation (

Abbreviations: MAE = mean absolute error; CASP = Computational Auditory Signal Processing and Perception model.
Footnotes
Acknowledgments
We would like to thank Jonathan Regev for valuable help with the experimental design and setup and providing code for the ACALOS experiment, as well as Johannes Zaar for providing base code for generating the STM stimuli. This work was carried out in connection to the Center for Applied Hearing Research (CAHR) supported by WSA, Oticon, GN Hearing, and the Technical University of Denmark.
Funding
The author(s) disclosed receipt of the following financial support for the research, authorship, and/or publication of this article: This work was funded by the Centre for Applied Hearing Research, supported by WSA, Oticon, GN Hearing and the Technical University of Denmark.
Declaration of Conflicting Interest
The authors declared no potential conflicts of interest with respect to the research, authorship, and/or publication of this article.
Data Availability Statement
The data supporting the findings of this study are openly available in the repository “Dataset for: ‘Predicting spectro-temporal modulation detection thresholds with a functional auditory model”’ in DTU Data at https://doi.org/10.11583/DTU.31079305 (Paulick et al., 2026). The CASP model implementation and simulations for the tasks presented are available at https://gitlab.com/lpau/casp_forafc.git (Paulick et al., 2024).