
Abstract
Previous studies have shown that older adults can witness a decline in the integration of their spatial auditory cues even when they don’t present pathological audiometric thresholds. Nonetheless, when spatial hearing in aging is discussed, most of the focus concerns elderly individuals with hearing impairments or presbycusis, rather than those with clinically normal hearing. In fact, auditory aging (even without presbycusis) may still result in a decline in spatial sensitivity, potentially contributing to the deterioration of key binaural functions crucial for speech understanding, such as binaural summation, squelch effect, and head shadow effect. The current study aims to determine whether Event-Related Potentials (ERPs) can reflect auditory spatial aging in populations without abnormal audiometric thresholds. Using a spatial oddball paradigm, we aim to explore the neural components associated with spatial sensitivity and examine whether these components correlate with changes in binaural integration with age. Our findings suggested a decrease in spatial auditory performance, speech in noise comprehension, and cognitive status across age even when audiometric thresholds were normal. Electroencephalograhy investigation revealed a strong correlation between N100 amplitudes and age, in addition to correlation between unmasking function and N100 amplitudes. These findings underscore the validity of ERP components as markers of spatial hearing performance and aging. This could orient the decision-making concerning the necessity for hearing rehabilitation in some cases to compensate for deficits and prevent auditory aging consequences on peripheral and central auditory processing.
Introduction
Auditory localization involves several specialized and complementary mechanisms that go beyond static sound localization. Spatial hearing is essential for safe navigation in the environment, as it continuously updates the listener's perception of peri personal and surrounding space (Noel et al., 2015). It also enables the identification of dynamic sound sources in the surrounding environment, ensuring better displacement and protection from danger (Abel & Hay, 1996). Beyond its spatial function, spatial hearing plays a central role in communication. The segregation of speech in noisy environments heavily relies on the integration of auditory spatial cues (Lu & Cooke, 2010). Four main types of auditory spatial cues are known to be crucial for decoding spatial information and ensuring effective perception. Interaural time differences (ITDs) and interaural level differences (ILDs) are primarily used for detecting sound sources and deviations in the horizontal plane (Middlebrooks & Green, 1991). In contrast, monaural spectral cues, shaped individually by the pinna, enhance sound discrimination and detection in the vertical (elevation) plane (Slattery & Middlebrooks, 1994). Additional factors, such as head and eye movements, also play a complementary role in improving the use of spatial cues (Valzolgher et al., 2020). Recent studies using virtual acoustic environments have confirmed the importance of these cues for spatial perception and highlighted age-related differences in their integration (Stodt et al., 2025; Wang et al., 2024).
The interaction between these different cues provides high spatial resolution and compensates for physiological limitations or changes, such as those occurring during normal auditory aging. In aging, studies have shown a decline in the integration of spatial auditory cues among older adults compared to younger individuals, even when the older group presents normal audiometric thresholds. However, most studies on spatial hearing and aging have focused on presbycusis, while much less attention has been given to older adults with clinically normal hearing (NH) (Boncz et al., 2024). In fact, auditory aging (even without presbycusis) may still result in a decline in spatial sensitivity, potentially contributing to the deterioration of key binaural functions crucial for speech understanding, such as binaural summation, squelch effect, and head shadow effect. This decline is increasingly thought to reflect not only peripheral changes but also central auditory processing deficits (Madashetty et al., 2024; Mahmud et al., 2020); while this form of aging is not pathological, it may serve as an important predictor of how spatial auditory detection evolves with age. This may help anticipate communication difficulties, which remain the primary complaint among older individuals and a key reason for hearing aid fitting.
Studies on aging populations with controlled-hearing thresholds generally show consistent findings regarding an auditory spatial decline despite normal clinical audiometry. Earlier psychoacoustic studies demonstrated that older adults require longer inter-stimulus intervals to judge the order of spatially separated sounds (Fink et al., 2006; Kolodziejczyk & Szelag, 2008; Szymaszek et al., 2006). More recent evidence confirms that temporal resolution declines with age and can be objectively captured with electrophysiological markers (Augereau et al., 2025), while older adults also report greater difficulties with spatial hearing and sound identification despite clinically normal audiograms (Cañete et al., 2025). In addition to reduce spatial lateralization ability due to aging, localization accuracy has been shown to also decline with age. Dobreva et al. (2011) found that older adults performed worse in both azimuth and elevation, particularly for ultra-high-pass noise (10–20 kHz) (Dobreva et al., 2011). Abel et al. (2000) also noted accuracy decline starting the age of 30, especially at higher frequencies (4 kHz), with age explaining 12–26% of the variance (Abel et al., 2000). These behavioral findings have been extended by more recent work, which shows that deficits in dynamic spatial hearing contribute to difficulties with speech processing (Ashrafi & Baghban, 2024) and that spatial selective attention, while relatively preserved in older adults with NH, decreases progressively with age-related loss (Caso et al., 2024).
Spatial hearing can also be assessed through the minimum audible angle (MAA), a measure of spatial acuity (also called spatial discrimination). This form of sensitivity requires higher order processes such as selective attention and short-term memory that appears to decline in older age. Freigang et al. (2014) found that older adults had MAAs nearly twice as large as those of young adults for both low (0.5 kHz) and high (3.0 kHz) frequency sounds (Freigang et al., 2014). Similarly, Rønne et al. (2016) reported MAAs of around 10° in young adults and 20 to 30° in older adults, with pinna manipulations disproportionately affecting the latter (Rønne et al., 2016). However, not all spatial functions are equally affected: recent findings suggest that motion direction discrimination based on ILD cues may remain relatively preserved with age (Harada et al., 2025). These behavioral findings are consistent with recent evidence showing neural correlates of reduced spatial sensitivity in older adults, even when pure-tone thresholds remain normal (Brinkmann et al., 2021; Gommeren et al., 2021).
We argue that spatial hearing is essential for maintaining functions that go beyond the mere detection of sound sources. It involves multilayered processing: at the perceptual level (e.g., spatial lateralization and discrimination), in the segregation of speech from background noise, and in higher level integrative functions such as selective attention and auditory inhibition. Despite its broader role, the contribution of spatial hearing to these domains in the normally aging population remains understudied. Thus, limited attention has been given to the early effects of normal aging on peripheral and central neural processing, which may alter auditory–cognitive integration at multiple levels. Older adults with NH may already exhibit early, subclinical alterations in auditory performance, particularly in speech-in-noise perception and spatial hearing, which may also be reflected at the neural level. These subtle changes could serve as precursors to more pronounced deficits in higher order integrative processes that may also rely on spatial hearing.
Pure-tone audiometry is insufficient for evaluating this subtle auditory changes that precede significant peripheral loss (Arvin et al., 2013). Advanced objective exploratory techniques such as cortical auditory evoked potentials CAEP can be used as a predictor of preliminary alterations in spatial sensitivity. In CAEP tests, speech stimuli are frequently used to study the neural representation of speech sounds in populations with speech segregation deficits due to presbycusis (Ostroff et al., 1998; Tremblay et al., 2021). Some studies suggested that increasing hearing thresholds is responsible for longer latencies and amplitude increment of CAEP (Harkrider et al., 2009; McClannahan et al., 2019), suggesting that changes are due to sound processing deficiencies and decreased neural inhibition that commonly occurs in the P2 wave. Thus, Event-Related Potentials (ERPs) have proven valuable in studying hearing sensitivity and temporal auditory processing in age-related hearing loss, especially when using speech stimuli. Numerous studies evaluating the P1-N1-P2 complex have shown delayed N1 and P2 latencies in presbycusis patients, accompanied by difficulties in word processing. P300 has also been used as a central auditory processing marker, and an index of speech understanding in noise (Pearson et al., 2025). Recent work has further demonstrated that ERP components such as N100, P200, and mismatch negativity (MMN) are sensitive to subtle auditory and cognitive decline in older adults, even in the absence of overt hearing loss (Gommeren et al., 2021; Madashetty et al., 2024; Mahmud et al., 2020).
In a previous study, our team demonstrated that spatial MMN a specific ERP component correlates with spatial behavior in patients with unilateral hearing loss (UHL) (Alzaher et al., 2023). Poor localization accuracy was also accompanied by high cognitive load, reflected by broader distribution of the MMN in the frontal and prefrontal areas. These findings motivated us to step further into the exploration of spatial hearing changes with age, in a passive oddball paradigm that evaluates spatial discrimination abilities that engages both spatial sensitivity and short-term memory capacity that could deteriorate with age. Building on our previous work, the present study investigates whether ERPs can reflect auditory spatial aging in adults with clinically NH thresholds. Using a spatial oddball paradigm, we specifically test the hypothesis that MMN component can serve as neural marker of age-related changes in spatial sensitivity. This patterns would provide neural evidence of subtle spatial hearing decline associated with normal aging, even in the absence of peripheral hearing loss.
Materials and Methods
Population: Twenty-nine NH participants took part in the present study, with variable age range going from 22 years old to 77 years old. All 29 subjects had an audiometric test prior to inclusion. A clinical audiometry was applied over frequencies ranging from 150 Hz to 4000 Hz, all subjects presented symmetric and NH thresholds (below 25 dB at all the frequencies).
Behavioral Test
Speech perception in noise (SPIN). Speech-in-noise segregation (SPIN) was assessed by determining Speech Reception Thresholds (SRTs) using the French Matrix Test (Jansen et al., 2012). This test consists of 50 predefined words grouped into five categories: 10 names, 10 verbs, 10 numerals, 10 objects, and 10 colors. Random combinations of one word from each category form five-word sentences, such as “Charlotte attrape douze ballons verts” (translation: “Charlotte catches 12 green balls”), spoken by a female French speaker. In our study, sentences were presented under varying levels of competing noise across three blocks of three free-field spatial configurations. The first condition, S₀N₀, corresponded to speech and noise co-located at 0° azimuth (frontal presentation). The second condition, S₆₀N₋₆₀, presented speech at +60° (right side) and noise at −60° (left side). Participants completed 20 trials per condition. After each sentence, the participant was required to repeat the words they heard, and the noise level was adaptively adjusted based on the correctness of the response verbally provided by the subject. If the participant's response was correct, the noise level increased by 5 dB; if incorrect, the noise level decreased by 5 dB. The speech volume remained constant at 60 dB throughout the test.
Sound localization test. For the sound localization task, participants were seated at the center of a semicircular array with a 1-meter radius, consisting of 12 loudspeakers. These loudspeakers were positioned from +82.5° to the participant's right to −82.5° to the left, with an angular separation of 15° between each speaker. Participants used a tablet that displayed a visual representation of the loudspeaker array and were instructed to select the speaker corresponding to the perceived sound location. The acoustic stimulus used was 250-ms white Gaussian noise, band-pass filtered between 300 and 1,200 Hz. This stimulus has been previously administered in MMN studies by Alzaher et al. (2023), Bennemann et al. (2013), and Freigang et al. (2014). The use of low-frequency bands is a standard choice in spatial studies to prevent spatial differences from being misinterpreted with intensity variations due to ILD. Before the test, participants underwent a training session where they listened to sounds gradually shifting through the 12 loudspeakers while the corresponding sound locations were displayed on the tablet. This familiarization phase aimed to help participants understand the spatial arrangement of the sound sources. For the localization test, sounds were presented through each of the 12 speakers in a randomized order, with each speaker emitting the stimulus twice. After each sound, participants selected the perceived location on the tablet.
Montreal Cognitive assessment (MoCa). The cognitive status of each participant was evaluated using the French version of MoCa. A sensitive and comprehensive rapid screening test for evaluating cognitive functions, including attention, concentration, executive functions, memory, language, visuoconstructive abilities, abstraction, calculation, and orientation.
Speech and Spatial Qualities Questionnaire (SSQ-12). We administered a shortened version of the Speech, Spatial, and Qualities (SSQ) questionnaire, comprising only twelve items assessing the quality of speech and spatial hearing. Each item was rated on a scale from 0 to 10. The total score was calculated by summing the scores of the 12 items and dividing the sum by 12, to obtain an overall score out of 10.
Electroencephalograhy (EEG) setup and recording: To assess spatial discrimination ability, and short-term memory function related to it using EEG recordings, we applied a passive oddball paradigm with auditory stimulations varying as a function of spatial location. We applied the same stimulation procedure using the same material already applied in our previous work, see (Alzaher et al., 2023). This spatial oddball paradigm was initially inspired from Bennemann et al. (2013) study. It consists of sending 2,000 stimulation randomly through four loudspeakers organized as follows: One standard positioned at 50° (at the left or at the right), and three deviants positioned at different angular deviations from the standard: First deviant, at 10° of deviation, second deviant at 20° of deviation and a third deviant at 100° of contralateral deviation from the standard. Following classic oddball paradigms, the occurrence of the standard was more frequent and represented 85% of the total stimulations, while the three deviants represented all together 15% of total stimulation. The auditory stimulation used was the same used in the sound localization task. In order to prevent any impact of the side of the standard on the stimulation, the sides were alternated randomly between the participants, with 15 participants undergoing oddball stimulation with the standard at the left and 14 participants with the standard at the right. The deviants also followed the position of the standard. Figure 1 illustrates an example of the stimulation structure when the standard sound was positioned at the left. The MMN is known to be an un-attentional evoked potential; therefore, unattentive sound processing is necessary for the emergence of the MMN. Our participants were asked to watch a silent subtitled movie during the whole stimulation procedure, to prevent any voluntary attentional engagement with the auditory stimulation. EEG recordings were obtained using BiosemiActiveTwo system with 64 Ag/AgCl electrodes placed according to the international 10–20 system. The CMS (Common Mode Sense) and DRL (Driven Right Leg) electrodes served as ground and were positioned at the center of the head cap. Additional electrodes were placed on the left and right mastoids. Scalp electrode impedance was kept below 10 kΩ, and the default sampling rate of 2,048 Hz was used.
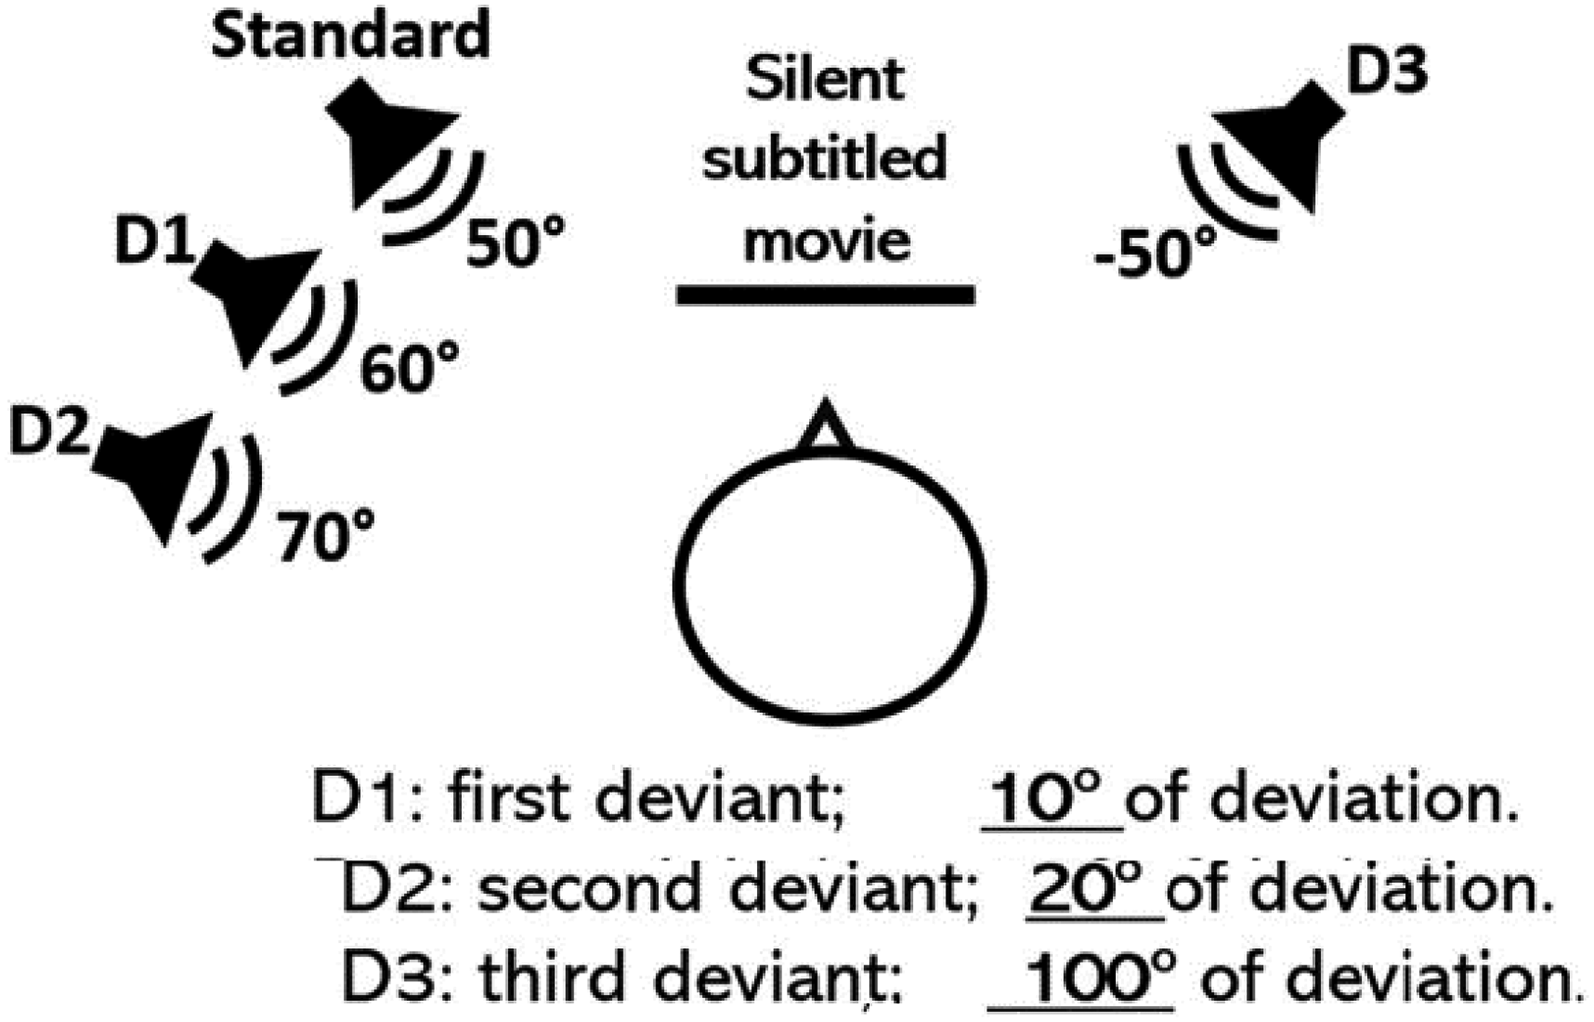
EEG setup and speaker distribution between standard and deviant positions (Alzaher, 2023).
Data Analysis
Analysis of the Behavioral Data
K-Means Cluster and Behavioral Analysis
K-means cluster analysis was used as an exploratory data analysis technique to maximize intra-group homogeneity. The algorithm calculated the Euclidean distance relative to the centroid of the variables, grouping similar observations into clusters. K-means cluster analysis was conducted to identify subgroups with similar binaural performances. The optimal number of clusters was determined using the elbow method based on the Within-Cluster Sum of Squares (WSS). The WSS was plotted as a function of the number of clusters (N). The optimal number of clusters was identified at the elbow point, where N = 3. The analysis included five measures related to spatial hearing: Root Mean Square (RMS) errors from the sound localization task. Three SRTs from the SPIN test conditions. Speech, Spatial, and Qualities of Hearing Scale scores (SSQ; (Vannson et al., 2015)). Pure-Tone Average (PTA) was not included in the cluster analysis. The K-means cluster analysis was conducted using R (library version 3.6.3) in RStudio (version 1.1.423). The resulting groups were subsequently used for all further behavioral and EEG analyses.
For the sound localization task, the RMS error was calculated for each spatial position. Additionally, the average RMS error across all 12 locations was determined for each participant. A linear mixed-effects (LME) model was used to analyze the variation in RMS errors among the clusters identified by the K-means analysis. The RMS was modeled as the dependent variable, with Group as a fixed factor and Subject as a random factor. The LME model was fitted using the lmer() function from the lme4 package in R, employing the Restricted Maximum Likelihood method. The level of statistical significance was set at 0.05.
To analyze the SPIN results, SRTs were modeled using an LME approach. Group (emerging clusters) and Condition (S₀N₀, S₋₆₀N₆₀, S₆₀N₋₆₀) were set as fixed factors, and Subject as a random factor, to examine their effects on SRTs and their interactions. Post-hoc comparisons were conducted using the Tukey test.
Analysis of EEG Recordings
EEG data were analyzed offline using EEGLAB (version 14.1.1.b) and ERPLAB (version 8.10), open-source toolboxes running in MATLAB (version 8.1.0.604 R2013a). In the pre-processing stage, data were downsampled to 500 Hz and band-pass filtered between 1–20 Hz using an 1813-point Kaiser windowed-sinc FIR filter (Kaiser beta = 5.65; firfilt plugin version 1.5.3). Epochs of 600 ms were created for each sound stimulus, including a 100-ms pre-stimulus baseline. Epochs with amplitudes exceeding ±100 μV were rejected using the moving window peak-to-peak amplitude function in ERPLAB. The epochs corresponding to each loudspeaker position were averaged for each individual to generate four ERP waveforms: one for the standard and one for each of the three deviants. MMN was calculated by subtracting the standard ERP from each deviant ERP, resulting in three MMN waveforms for deviations of 10°, 20°, and 100°. To determine the statistical significance of the MMN, we used a paired permutation test based on randomization (Alzaher, 2023). For each deviation within each group, 10,000 randomizations were applied to the negative MMN peaks within a ± 10-ms window centered at the latency peak of the grand-average (GA) MMN at the Fz electrode (Duncan et al., 2009). The level of significance was set at 0.05. LMEs models were used to assess whether MMN amplitudes and latencies differed across clusters and deviant sound locations. The peak MMN amplitude and latency for each individual at the Fz electrode were modeled with Group (emerging clusters) and Sound Deviation (10°, 20°, and 100°) as factors. Post-hoc tests were conducted using the glht() function for multiple comparisons with the Tukey HSD test.
In addition to analyzing MMN, we extended our evaluation to include N100 and P2 components to explore their potential roles in providing insights into auditory aging and spatial auditory processing. These early and late auditory ERP components are known to reflect neural mechanisms of auditory attention and processing, and their variation across age groups could reveal patterns not captured by MMN alone. To assess the N100 and P2 components, individual peak amplitudes and latencies were extracted from averaged ERPs in a ± 20 ms window around the GA peak for each component at the Fz electrode. These components were then analyzed using linear mixed-effects regression (LMER) models and post-hoc tests to evaluate group and angular effects. Individual N100 amplitudes were analyzed as the dependent variable in an LMER model, with Group and Angle as fixed factors, and Subject as a random effect. Main effects of Group and Angle were tested using Chi-squared tests for model comparisons. Post-hoc comparisons between groups were conducted using the glht() function from the multcomp R package. A similar LMER model was applied to P2 amplitudes, with the same fixed and random effects.
To investigate relationships between neural markers and behavioral performance: N100 amplitudes were correlated with age, spatial auditory performance (RMS errors), and speech-in-noise unmasking ability (calculated as the difference in SRT between S₀N₀ and S₋₆₀N₆₀/ S₆₀N₋₆₀ conditions), using Pearson rank correlation coefficient.
Results
Cluster Division and Behavioral Performances
To obtain homogeneous group division, we employed a K-means clustering algorithm on six auditory performance variables. These variables included static sound localization (RMS), speech-in-noise perception in three conditions (SRT), cognitive scores from the MoCA assessment, and life quality scores using the SSQ. Through this unsupervised learning technique, our 29 subjects were grouped into three clusters: cluster 1 (n = 10), cluster 2 (n = 9), and cluster 3 (n = 10). To identify the primary factor responsible for this clustering, we examined the correlation between each factor and the first principal component (PC1), which contributed most significantly to the division. As shown in the table of the Figure 2C, there was a strong correlation between PC1 and the SRT scores across all three conditions. This indicates that speech-in-noise perception had the highest impact on cluster division. In contrast, the SSQ and MoCA scores did not show a significant correlation with PC1. When examining the age groups, we found a significant difference in age between each cluster (Figure 3A), confirming that unsupervised learning using the six factors resulted in three groups with different means of age. Additionally, a comparison using Analysis of Variances (ANOVAs) of audiometric thresholds’ variability between the three resulting clusters revealed that the third cluster had a higher PTA score compared to clusters 1 (p = .038) and 2 (p = .023). Based on these results, we will refer to each cluster according to its age mean in the rest of the article: cluster 1 as YNG-a for young-aged participants, cluster 2 as MID-a for middle-aged, and cluster 3 as OLD-a for old aged participants, demographic and behavioral measures of each participant are presented in Table 1.

A. Cluster distribution as a function of Principal Components 1 and 2, which account for 77.2% of the variance in the division. B. Pure tone audiometry results are shown for the left (L) and right ear (R) across each identified group after clustering. C. Correlation coefficients between Principal Component 1 and the six factors used in the K-means clustering algorithm.

Box plot comparison between the three resulting clusters (YNG-a, MID-a and OLD-a) after K mean clustering, in terms of Age (A), MOCA score (B), localisation errors (C) and SPiN performance in S₀N₀, S₋₆₀N₆₀, S₆₀N₋₆₀) (D, E, F). SPIN, speech perception in noise; MoCa, Montreal Cognitive assessment.
Individual Measures of the 29 Normal-Hearing Subjects and Post-Cluster Repartition.

Speech Reception Threshold; MoCa, Montreal Cognitive assessment; SSQ, Speech, Spatial, and Qualities; RMS, Root Mean Square.
Mean and SD of Speech Reception Threshold (SRT) in the Three Stimulation Conditions for the Three Groups.

After the cluster division according to six factors mentioned above, we used the analysis of variance ANOVA in order to compare behavioral performances between the resulting clusters. As shown in Figure 3, the outcome shows a statistical effect of each of the presented variables as a function of resulted clusters. The analysis showed an effect of the group on the age (χ2(2) = 44.266, p < .001), with a significant difference between YNG-a (M = 33.8; SD = ±12.6) and MID-a (48.5; ±14.9) (t(17) = −2.801, p = .0313), YNG-a and OLD-a (67.4; ± 8.8) (t(17) = −6.636, p < .001) and MID-a and OLD-a(t(17) = −3.636, p = .0055). Cognitive scores also varied as a function of the Group (χ2(2) = 15.313, p < .001), with significantly higher MoCa score for YNG-a (28.8; 0.91) group compared to OLD-a (26.2; 2.09) (t(17) = 3.912, p = .00318). Concerning auditory spatial performances measured by RMS error, (χ2(2) = 32.82, p < .001), a significant difference was noted between YNG-a (6.044°; ±1.432) and MID-a (10.393°; ±2.76) (t(17) = 0.9256, p = .000512) and YNG-a and OLD-a (10.673°; ±1.88) (t(17) = 0.8996, p = .000218), with no significant difference between MID-a and OLD-a groups despite the significant age difference. For speech in noise (Table 2), the variation was also significant in the three listening conditions, reflecting the impact of age on speech segregation. In the S₀N₀ condition when the sound and noise were simultaneously delivered from the central speaker, we notice a variability in the performances between the three groups (χ2(2) = 37.473, p = 7.292e−09). The highest SRT was noted for the OLD-a group compared to MID-a (t(17) = −3.246, p = .0125) and YNG-a (t(17) = −3.246, p = .0125), the MID-a group showed also higher SRT compared to YNG-a group (t(17) = −2.705, p = .0379). This was not the case in the S₋₆₀N₆₀ and S₆₀N₋₆₀ conditions, where no significant difference was noted between these two groups despite the general group effect (R: χ2(2) = 62.658, 2.478e−14; L: χ2(2) = 30.708, 2.478e−14), mainly related to the difficulty of OLD-a subjects in segregating speech in noise compared to MID-a (R: t(17) = −5.457, p < .001; L: t(17) = −3.467, p = .00777) and YNG-a (R: t(17) = −7.658, p < .001; L: t(17) = −5.464, p < .001) in both simulation sides.
Mismatch Negativity Analysis of Spatial Deviance After Clustering
We recorded EEG data from 29 subjects using a passive oddball paradigm, as detailed in the Materials and Methods section. The primary aim of the EEG analysis was to investigate auditory perception of spatial changes and its variability in terms of latency and amplitude relative to spatial deviation from the standard. Initially, we analyzed the ERP results before examining the difference waves. The general analysis of ERP waves at the four positions for the three groups revealed a P1/N1/P2 complex, which peaks within the same time windows across all groups. Specifically, P1 peaks within a 40–80 ms window, N1 within a 110–150 ms window, and P2 within a 200–300 ms window as shown in Figure 4. The absence of a P300 component is attributed to the inattentive paradigm used, which did not require subjects to voluntarily focus their attention, and therefore suppress P300 (Picton, 1992). Difference wave ERPs plotted in Figure 4B were calculated by subtracting the deviant ERP from the standard ERP, resulting in a negative deflection that appeared as a response to the three deviant positions for the three groups. To determine the significance of the observed negativity, we employed a permutation test based on randomization applied to individual peak amplitudes in a 20 ms time window around the GA peak at Fz electrode (Alzaher, 2023), for each group and angle combination, using the “dplyr” and “purrr” packages in R. The results indicate a significant negative MMN for all angles in all groups, as detailed in Table 3.
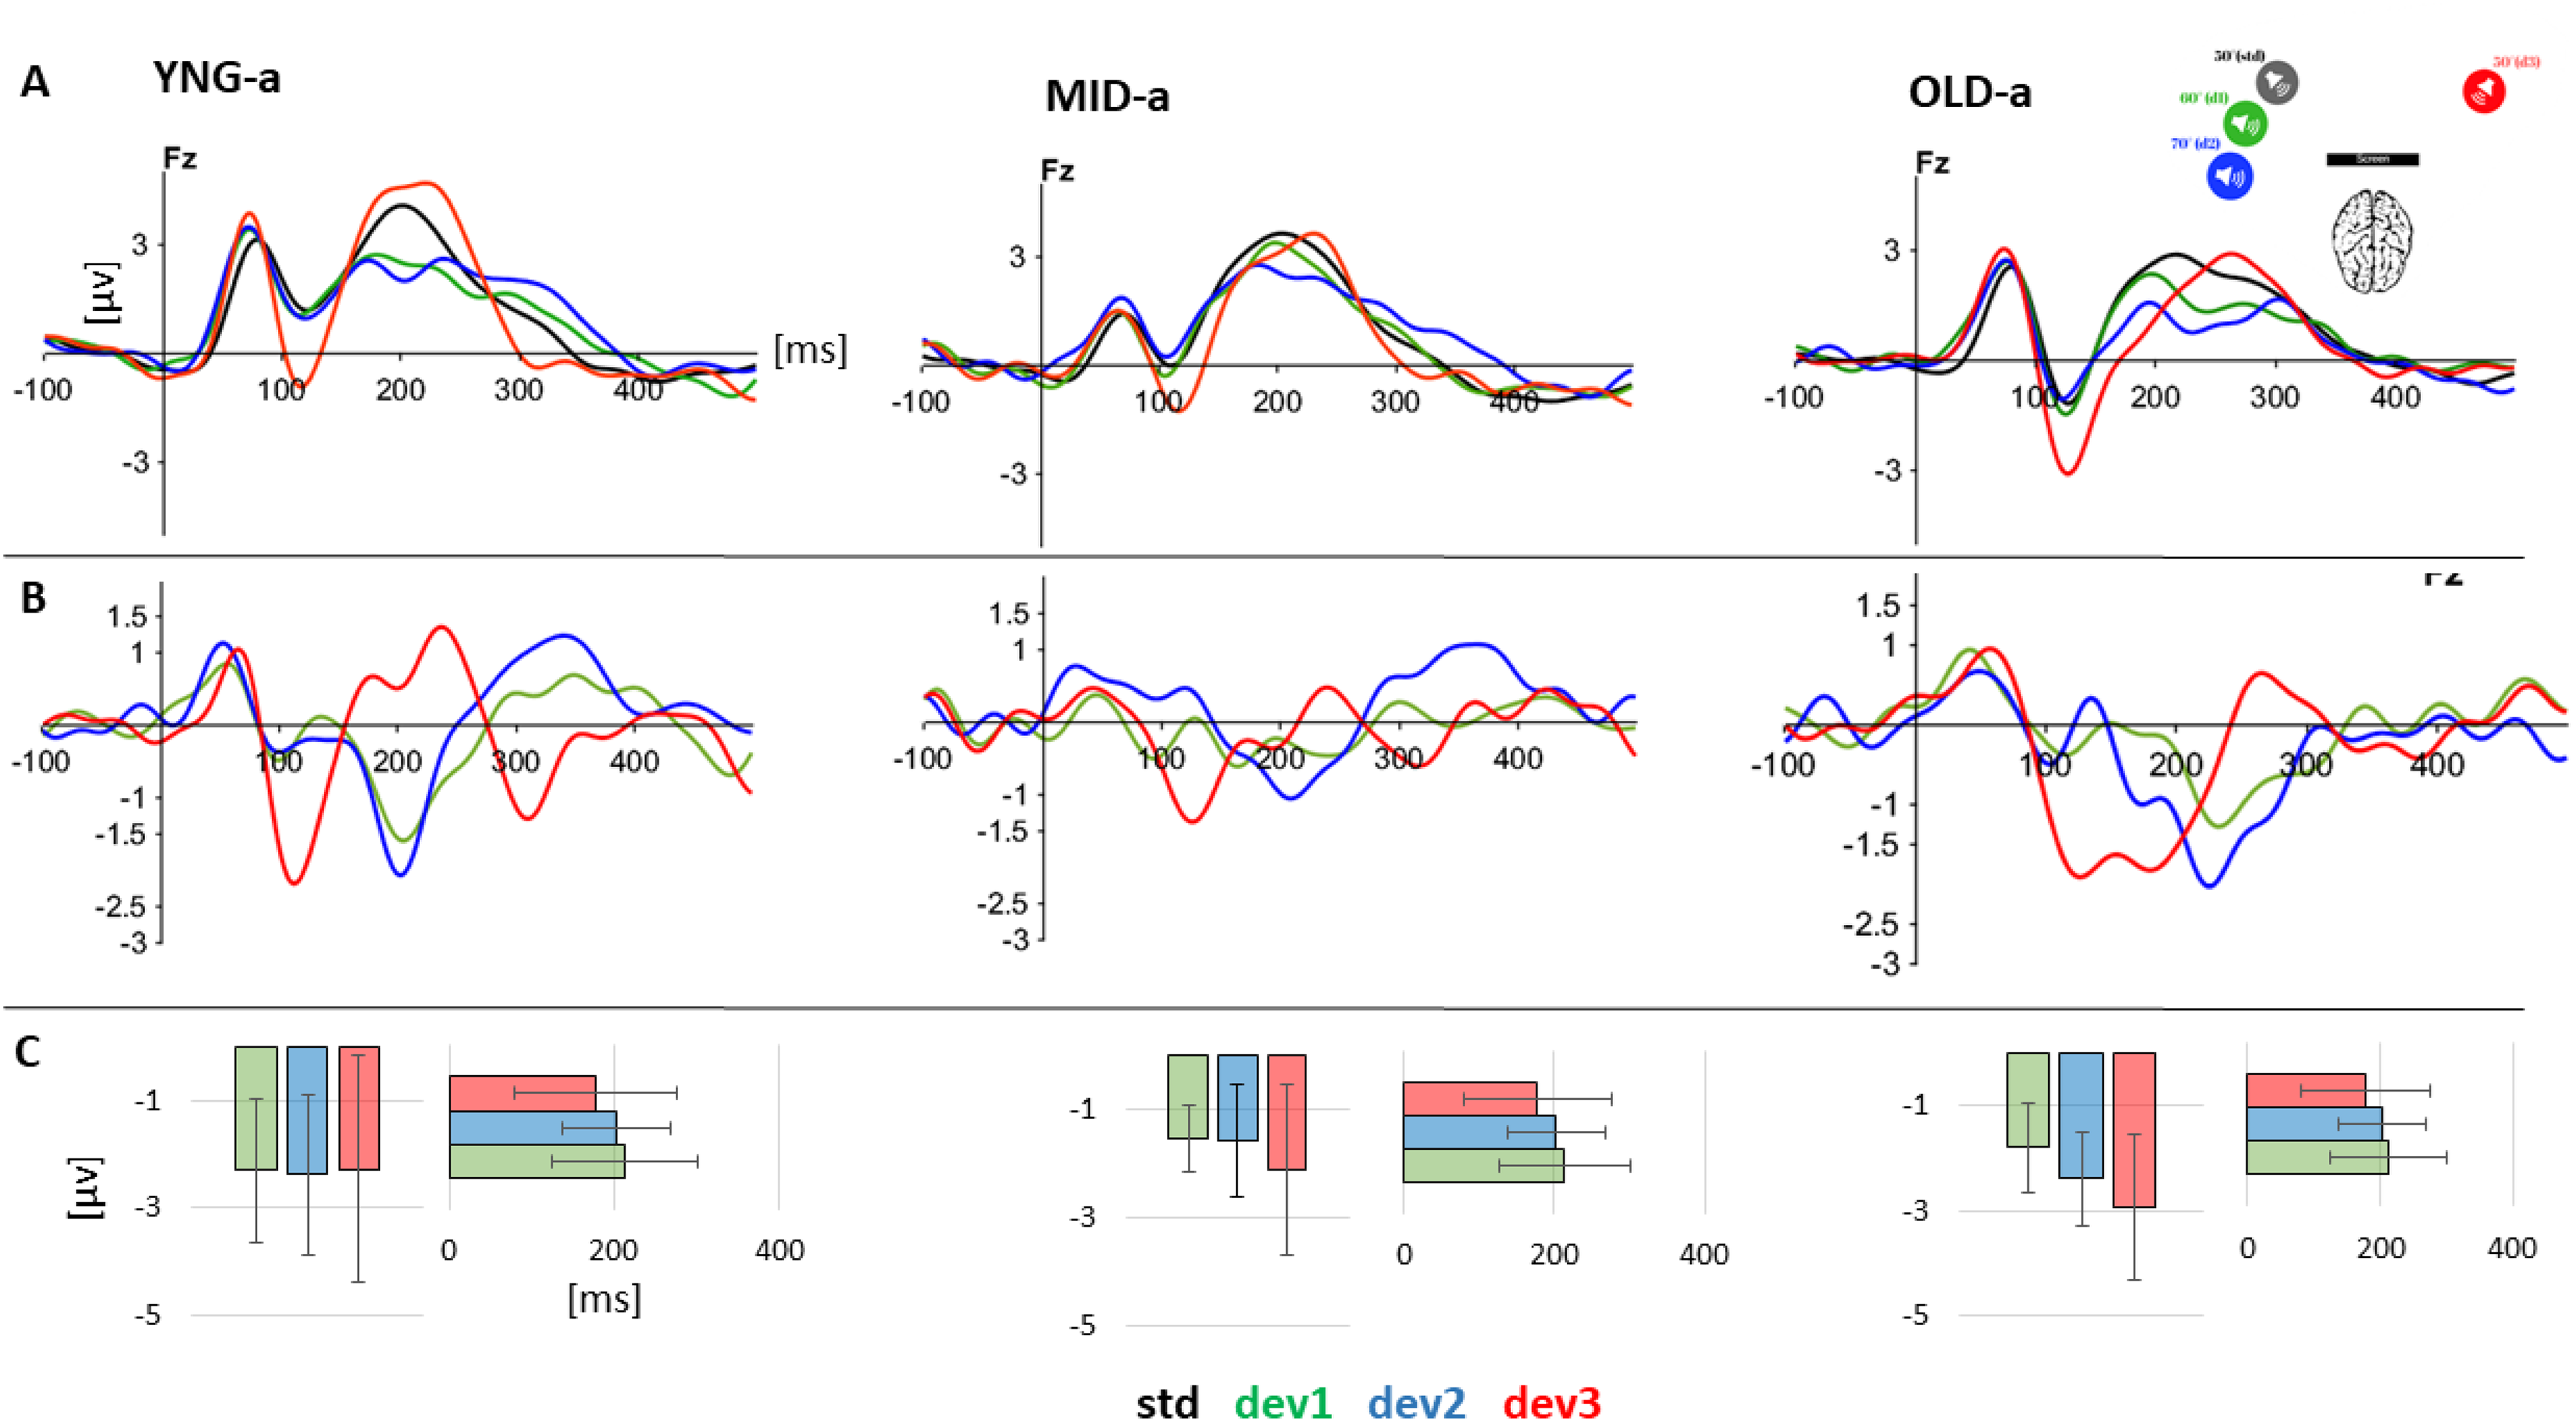
A. Grand Average ERPs for the standard and the 3 deviant sounds at the Fz electrode for the three groups: YNG (n = 10), ADLT (n = 9), AGED (n = 10). B. Difference waveforms (deviant ERP - Standard ERP) at the Fz electrode for each of the three deviant sounds (10°, 20°, and 100°of deviation) for the three corresponding groups YNG (n = 10), ADLT (n = 9), AGED (n = 11). C. Mean and standard error of individual MMN absolute peak in amplitude and latency at the three angular deviations for the three groups. ERP, Event-Related Potential; MMN, mismatch negativity.
Permutation Test Results for Each Group and Angle. The Test was Applied on Individual MMN Peak in a 20 ms Time Window Around the Grand-Average Peak at Fz Electrode, at Each Angular Deviation for Each Group.
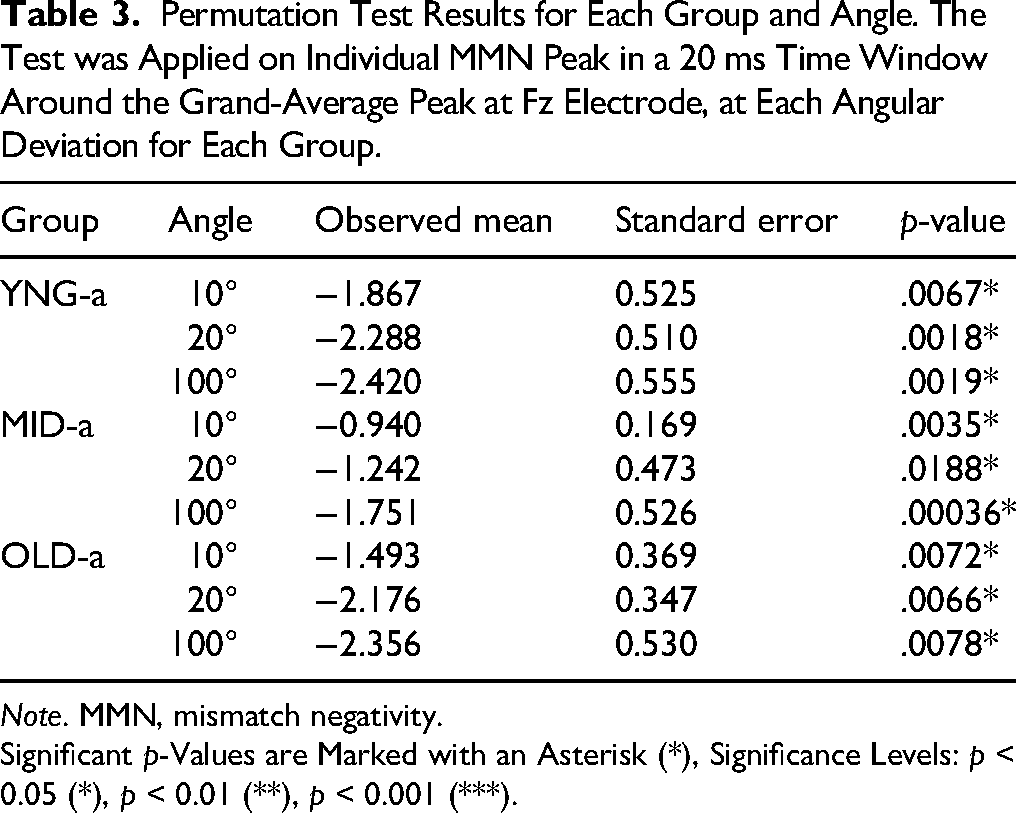
Note. MMN, mismatch negativity.
Significant p-Values are Marked with an Asterisk (*), Significance Levels: p < 0.05 (*), p < 0.01 (**), p < 0.001 (***).
A LMER was used to study the effect of group and angle on amplitude and latency. The model was applied to the individual absolute peak of the MMN amplitude and latency at Fz electrode, using the lmer function from the lme4 package in R to fit the model. The dependent variables were the amplitude and latency of the individual MMN that were regressed against the mixed effects (Group and Angle) with Subjects as random effect, followed by post-hoc multiple comparisons using the glht() function from the multcomp package in R. The model applied on the Amplitude did not show any effect of the Group (χ2(2) = 3.4590, p = .1774) or the Angle (χ2(2) = 1.8518, p = .3962) on amplitude variation. And no significant interaction between Angles and Groups (χ2(4) = 1.7793, p = .7763). However, a significant effect of the Angle was noticed for the peak latency (χ2(2) = 9.8715, p = .007185**) in the MID-a group where MMN peaked earlier at 100° of deviation compared to 10° of deviation (125 ms Vs 196 ms; p = .0218), this significance was observed for the MID-a group only.
What Does N100 Tell us About Auditory Aging in Normal Hearing
The comparison between the three groups did not indicate any age-related impact on MMN emergence. Therefore, we suggested examining other auditory potentials that may be influenced by auditory aging. Using the LMER model, we tested the variation of N100 and P200 individual peaks as a function of Angle and Group, with Subject as random effect (Figure 5). The results showed a variation of N100 amplitude as a function of Group (χ2(2) = 20.592, p < .001) and Angle (χ2(3) = 21.239, p < .00) but no interaction between Group and Angle (χ2(6) = 0.839, p = .991). Post-hoc comparison applied to compare amplitude variation between groups at each angle (Table 4) showed amplitude differences mainly between YNG-a and OLD-a groups at the Std position (0.942 ± 1.24 Vs −1.09 ± 1.75), at 10°(0.59 ± 1.63 vs −1.44 ± 2.27) of deviation, with a tendency at 20° and 100°; means and SD comparisons are presented in Table 5 below.
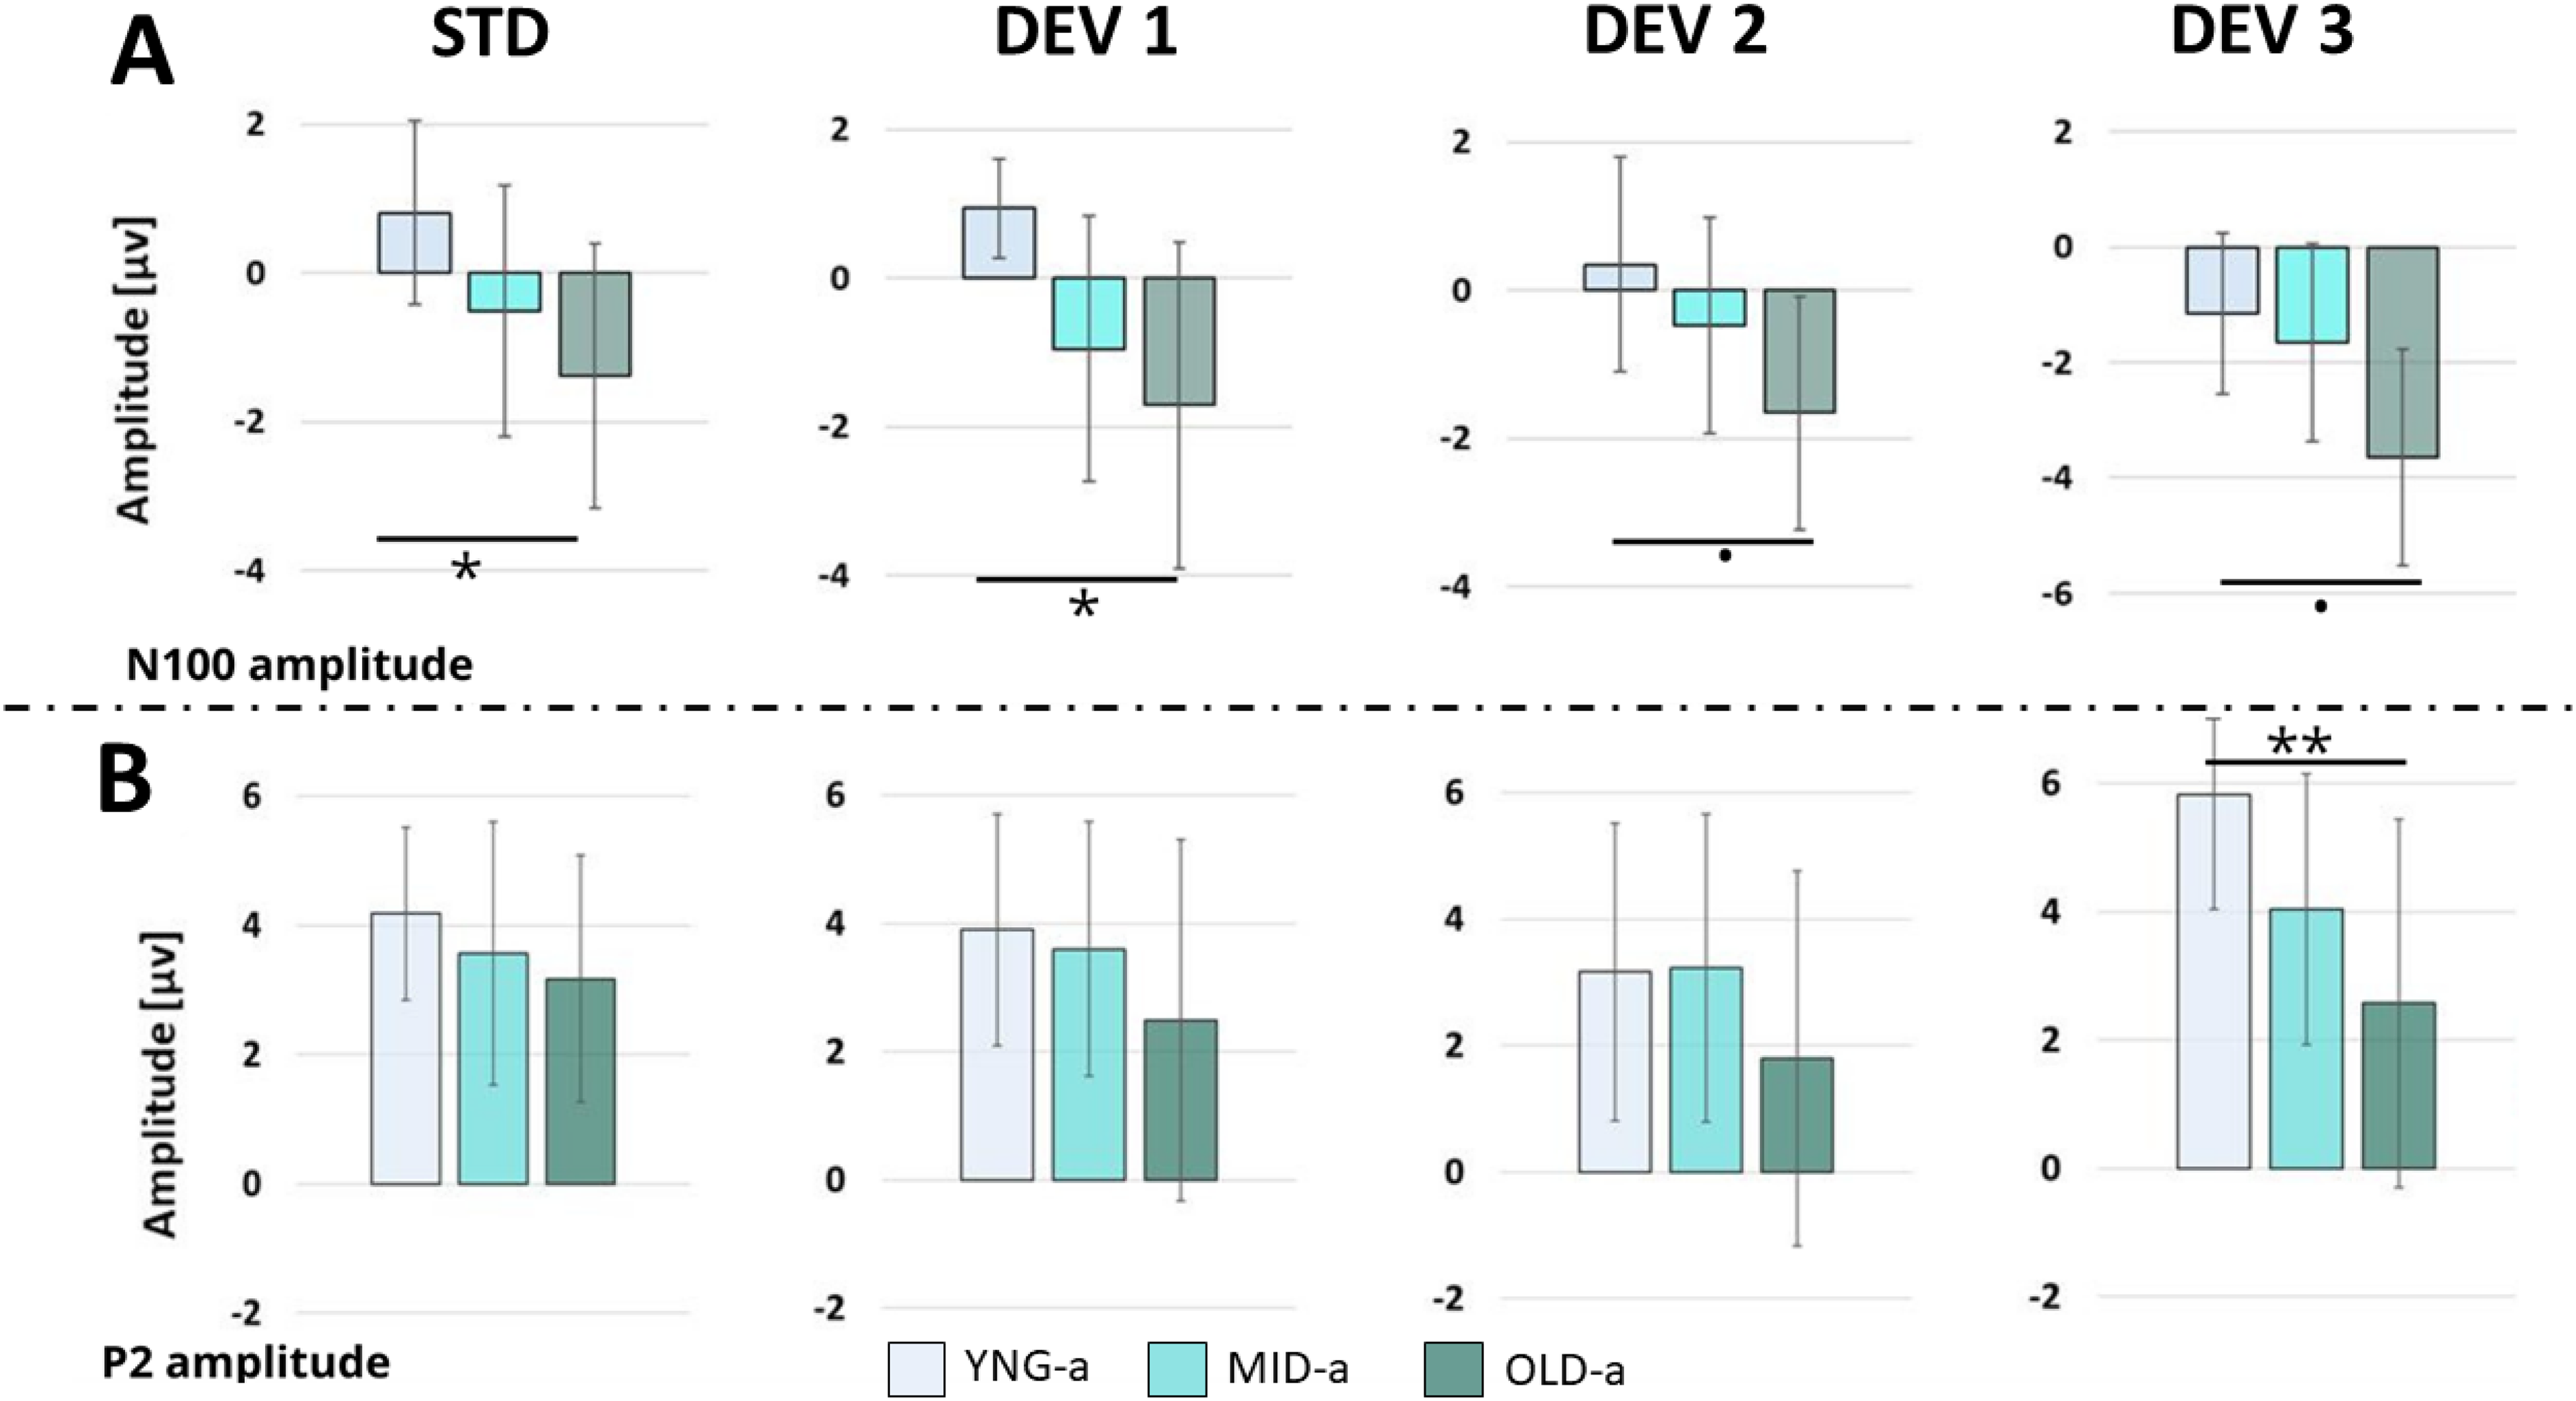
Comparison of N100 and P2 peaks between the groups at each angular position. The group peaks were calculated by averaging an individual peak in a 20 ms window around the GA peak of each ERP component. (A) P2 amplitudes and (B) N100 amplitudes. Data were analyzed at Fz electrode site. ERP, Event-Related Potential; GA, grand-average.
Simultaneous Tests for General Linear Hypotheses for Different Angles Applied on N100 Individual Amplitudes.

Note. Significant p-Values are Marked with an Asterisk (*), Significance Levels: p < 0.05 (*), p < 0.01 (**), p < 0.001 (***).
Mean and Standard Deviation of Amplitude and Latency of the MMN by Group and Angle. Significant p-Values are Marked with an Asterisk (*), Significance Levels: p < 0.05 (*), p < 0.01 (**), p < 0.001 (***).
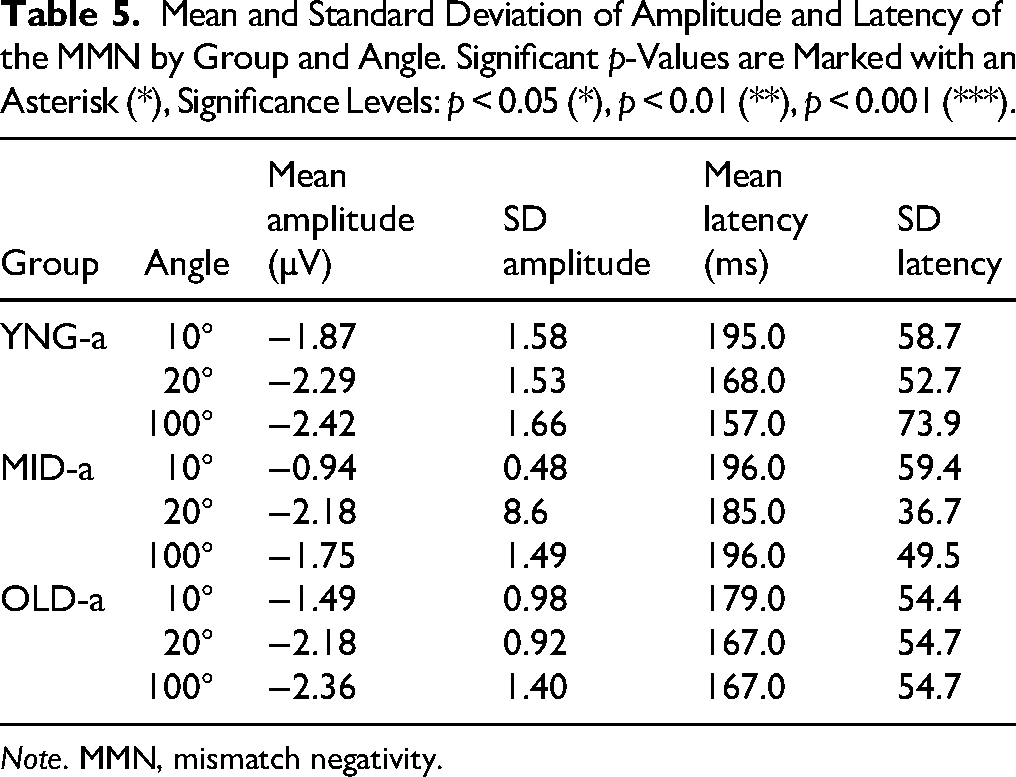
Note. MMN, mismatch negativity.
We applied the same LMER model on P2 individual amplitude. The analysis showed an effect of the Group (χ2(2) = 11.9509, p < .005) but not for the Angle (χ2(3) = 6.5028, p = .0089), and no interaction between Group and Angle, (χ2(6) = 3.6481, p = .72418). The post-hoc multiple comparison using glht package showed only a significant difference between YNG-a (5.83 μV ± 1.79) and OLD-a (2.57 μV ± 2.87) groups at 100°; (p = .0059). These findings indicate that while MMN amplitude does not account for age-related differences and their effect on perceptual spatial acuity, general ERPs like N100 and P200 are predictive of age-related impacts on auditory processing. Consequently, we decided to extend our analysis by performing a correlation analysis between the neural markers and the behavioral data presented in the initial sections. Firstly, Pearson correlation analysis applied to N100 amplitude and age across 29 participants revealed significant correlations at all angular positions, as shown in Figure 6. In addition to these promising results confirming age-related impacts on late neural auditory processing, this neural response also appears to correlate with auditory performance in speech in noise, particularly in unmasking. Unmasking was quantified by subtracting the SRT of the S₀N₀ condition from the S₋₆₀N₆₀ and the S₆₀N₋₆₀ condition (S₋₆₀N₆₀/S₆₀N₋₆₀ - S₀N₀). The results of Unmasking from the 29 subjects were correlated with N100 individual amplitudes at each of the four angular positions, Figure 7. While spatial deviance in the oddball paradigm did not affect N100 amplitude, we decided to explore correlations between spatial behavior and N100 responses. We discovered a significant correlation between N100 responses to standard stimuli and average RMS scores. Furthermore, we found it compelling to highlight the strong correlations observed between RMS scores, age, speech perception in noise under S₋₆₀N₆₀ and S₆₀N₋₆₀ conditions, and unmasking, as illustrated in Figure 8.
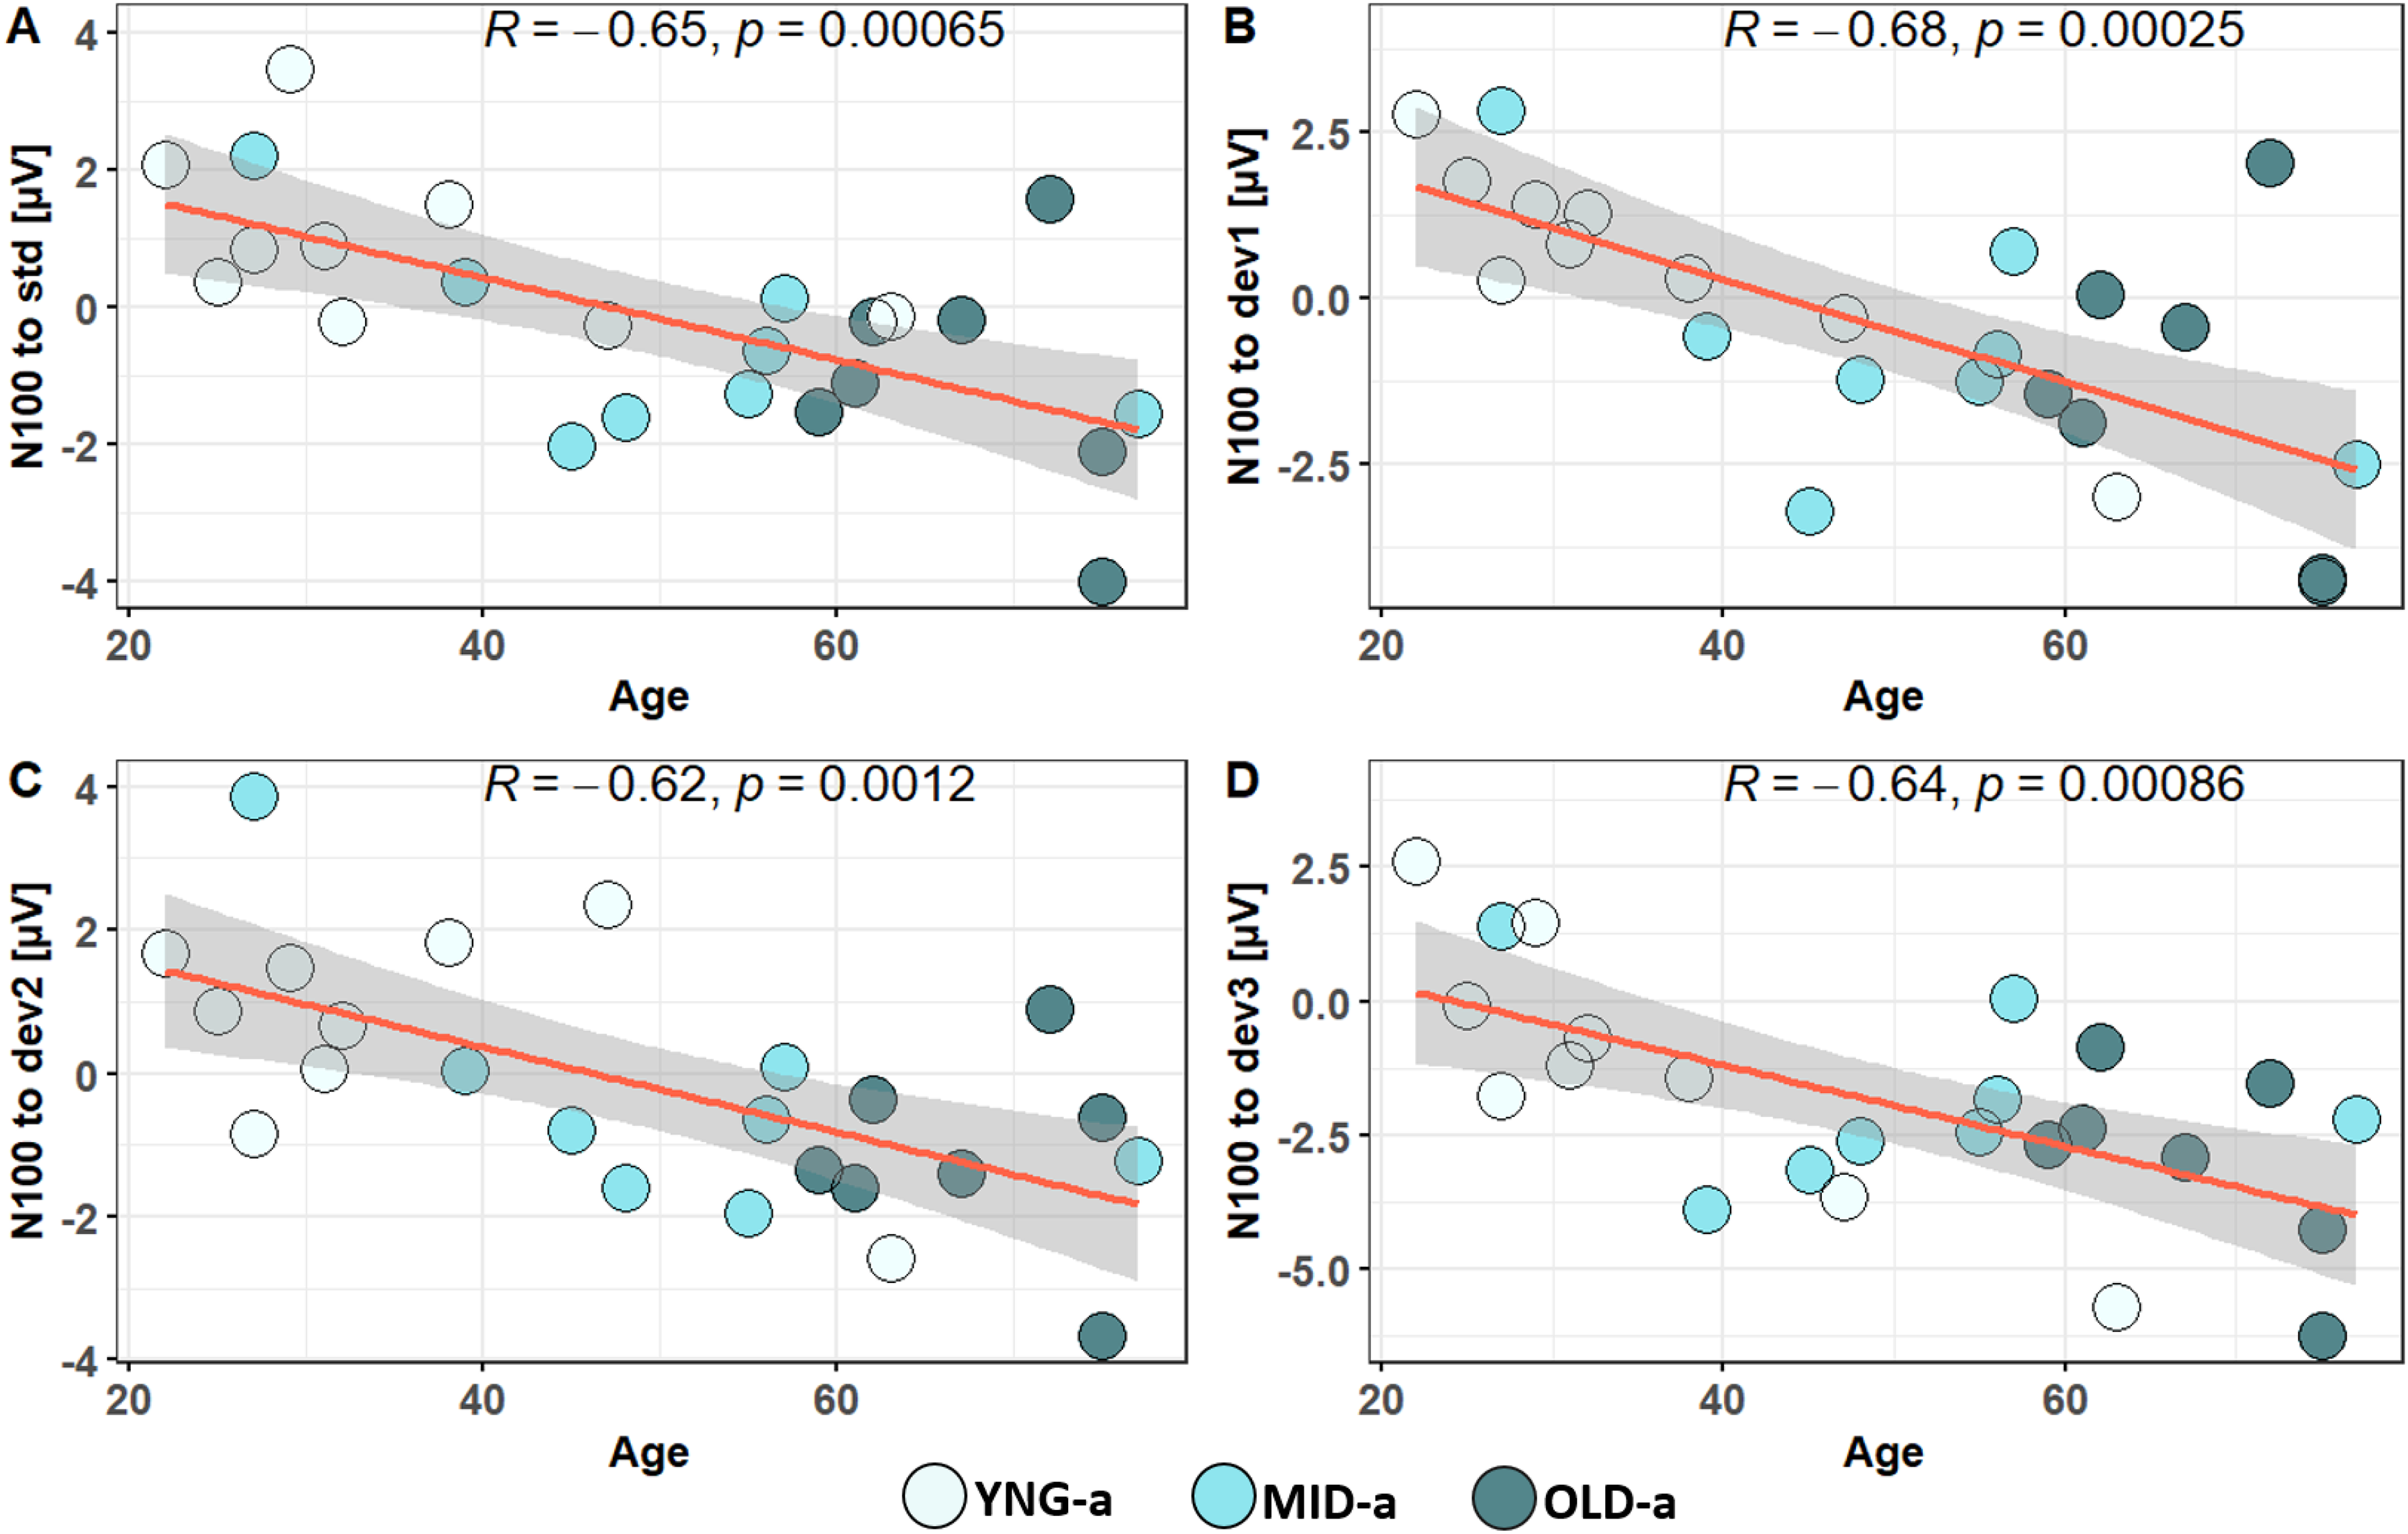
Correlation between age and individual peak amplitudes of N100 in response to an oddball paradigm played at four angular positions: standard at 50° (A), first deviant at 10° (B) deviation from the standard, second deviant at 20° (C) deviation, and third deviant at 100° (D) deviation.

Correlation between Unmasking and individual peak amplitudes of N100 in response to an oddball paradigm played at four angular positions: standard at 50° (A), first deviant at 10° (B) deviation from the standard, second deviant at 20° (C) deviation, and third deviant at 100° (D) deviation.

(A) Correlation between auditory spatial performance (RMS) and N100 response at the standard position. (B) Correlation between RMS and Age. (C) Correlation between RMS and speech in noise in S₋₆₀N₆₀ and S₆₀N₋₆₀ conditions at the Right and Left side; (D) Correlation between RMS and unmasking. RMS, Root Mean Square.
Discussion
Auditory Aging Reflected by Behavioral Outcomes
The primary objective of our study was to assess age-related changes in spatial auditory behavior in a normal-hearing population across a wide age range (22 to 81 years) combining behavioral and neurophysiological approaches. To accurately evaluate the impact of non-pathological aging on the integration of spatial cues in our 29 subjects, we employed a K-means clustering approach, a data-driven method widely used to uncover latent subgroups in cognitive and neurophysiological research (Brucar et al., 2022; Lavielle & Waggoner, 2020; Pfarr et al., 2023; Xu et al., 2025). Such approaches are particularly valuable when the aim is to group individuals based on functional performance rather than arbitrary demographic cutoffs such as chronological age. By doing so, clustering increases homogeneity within groups, enhancing sensitivity for subsequent analyses (e.g., EEG). As illustrated in Figure 2, the clustering of 29 subjects based on six factors resulted in the emergence of three distinct groups which, although differing in age distribution, were primarily driven by differences in behavioral performance. The K-means algorithm effectively identified these three groups based on their behavioral performances, which were significantly influenced by SPIN, particularly under S₋₆₀N₆₀ and S₆₀N₋₆₀ listening conditions as presented by the correlation with the PC1 that contributed to 57% of the division (Figure 2C). These conditions primarily involved spatial release from masking and binaural unmasking, that strongly relies on the integration of binaural spatial cues, ITD and ILD (Misurelli et al., 2020). Consistent with contemporary work, age-related reductions in binaural unmasking and spatial release from masking have been demonstrated behaviorally and electrophysiologically in older listeners, even when audiometric thresholds are controlled (Anderson et al., 2018; Jakien et al., 2017; Tolnai et al., 2024).
The age-related decline in the integration of binaural cues has already been demonstrated in different studies (Davis et al., 2016; Füllgrabe & Moore, 2018; Lin et al., 2011, 2013; Ross et al., 2007).The study of Ross et al. (2007) showed that middle-aged groups already presented a decline in the threshold of ITD while ILD performance appeared relatively preserved (Ross et al., 2007). Furthermore, recent studies confirms reduced horizontal lateralization in older adults using ITD-based tasks under controlled-hearing conditions (Morita et al., 2023) and cortical responses to ITD changes provide converging neurophysiological evidence for altered temporal processing with age (Ross, 2018). These observations align with broader demonstrations of age-related deficits in binaural hearing using combined behavioral, electrophysiological, and imaging approaches (Tolnai et al., 2024).
These results were also consistent with more recent findings showing that older adults exhibit lower lateralization performance than young adults across ITD conditions, even when standard audiometry is within normal limits (Morita et al., 2023). Besides the great implication of SRT in the cluster division, static sound localization performance seemed to be significantly better in younger subjects (6.044°; ± 1.432) and began to decline significantly in middle-aged (10.393°;± 2.76) and old aged (10.673°;± 1.88). These results are consistent with recent reviews and virtual-environment studies focusing on age-related deficit in localization and spatial change detection (Carlini et al., 2024; Stodt et al., 2025). Although few studies debated ILD sensitivity with age, most of the literature focuses on the decline of temporal fine structure (TFS) sensitivity that primarily depends on ITDs (Füllgrabe & Moore, 2018).Recent work reinforces these assumptions stating that large-sample TFS-adaptive-frequency data show robust age-related declines in binaural TFS sensitivity (Füllgrabe & Moore, 2018), and broader analyses indicate that age and hearing loss jointly affect the processing of envelope and TFS cues (Moore, 2021).
Based on a large number of psychoacoustical studies, TFS sensitivity tends to decline with increasing age (Füllgrabe et al., 2015; Grose & Mamo, 2012b; Hopkins & Moore, 2011; King & Dehaene, 2014). Furthermore, temporal coding limitations have been directly linked to speech-in-noise difficulties in middle-aged listeners with otherwise normal audiograms (McFarlane & Sanchez, 2024). Hopkins and Moore (2011) found a significant group difference in binaural TFS sensitivity between young normal-hearing and older normal-hearing listeners, but the difference between the latter group and older hearing-impaired listeners was not significant (Hopkins & Moore, 2011), suggesting that the decline in TFS sensitivity could be directly related to natural aging and not only a by-product of peripheral threshold elevation. Also, binaural TFS sensitivity has been found to be more highly correlated with age than with the audiometric threshold at the test frequency for listeners with normal or near-NH (Füllgrabe et al., 2015; Füllgrabe & Moore, 2018; Moore et al., 2012). Recent reports also suggest that extended-high-frequency sensitivity may contribute to individual variability in TFS measures and binaural integration, underscoring the importance of testing beyond 8 kHz (Ding et al., 2022). Binaural TFS sensitivity can deteriorate with age even when audiometric thresholds are in the normal range, consistently with the presented data. Taken together, age-related reductions in TFS sensitivity and elevated ITD thresholds offer a plausible account for the degradations we observed in speech-in-noise and localization tasks. While animal and human work implicates brainstem and cortical mechanisms in ITD coding (Pecka et al., 2008; Ross, 2018), our data cannot specify the neural locus of change and should be interpreted accordingly. Beyond potential peripheral age-related changes, the decline in MoCA scores between groups, even if it is still in the normal range, may reflect subtle, higher order differences consistent with reports that perceptual aging co-varies with cognitive performance in healthy older (Abbas et al., 2024; Füllgrabe et al., 2015). For instance, Füllgrabe et al. (2014) showed positive correlation between cognitive scores in Digit Span test, Block Design test and the Test of Everyday Attention with TFS sensitivity, even when the effect of age was partialled out (Füllgrabe et al., 2014).
Can Mismatch Negativity Reflect Auditory Spatial Decline Related to Aging?
In our study, we further investigate the effects of aging on auditory cortical function by exploring ERPs, widely used in the literature to study aging (Duncan et al., 2009).Our initial objective was to assess MMN responses (Kujala & Näätänen, 2001), as previous research has demonstrated its utility in reflecting auditory spatial sensitivity in hearing-impaired populations (Alzaher et al., 2023). While MMN has been shown to decline with age in domains such as frequency, duration, and speech processing (Näätänen et al., 2012; Rimmele et al., 2015), its sensitivity to age-related spatial hearing changes remains less established.
In our study, although K-means clustering separated subjects into three distinct behavioral groups, MMN responses did not show significant differences across spatial deviants. While there was a slight increase in amplitude relative to the spatial angle, the neural response did not exhibit marked deterioration with age.
In contrast, Alzaher (2023) showed a pronounced reduction in MMN among individuals with UHL compared to normal-hearing controls. In Alzaher's study, MMN responses were consistent with spatial behavior, showing significant differences in localization accuracy between normal-hearing individuals (15.6 ± 4.8), moderate UHL performers (31.6 ± 9.3), and poor UHL performers (48.7 ± 23). In the present study, although RMS scores differed across young, middle, and older aged subjects, this behavioral variation did not appear sufficient to provoke a distinct spatial sensitivity response in a late neural marker like MMN. We can conclude that in the case of NH, despite the age, unattended spatial deviance did not significantly differ from younger adults. To step further, we suggest that earlier components, such as N100, could vary with age even when no auditory deficit is reported.
N100 Variation with Aging
The N100 has been widely studied as an index of early auditory processing, novelty detection, and attentional engagement (Lijffijt et al., 2009; Näätänen & Picton, 1987). Its amplitude and latency vary depending on the acoustic properties of the stimulus and the degree of attentional allocation.
In our oddball paradigm, participants were instructed to watch a silent subtitled movie and ignore the auditory stimuli, creating a passive listening task optimized for MMN generation (Alzaher et al., 2023; Bennemann et al., 2013). Although our experimental protocol was not designed to evaluate cortical responses related to inhibition of auditory stimuli, but more to selective attention, these two functions remain strongly related and interdependent. In fact, N1 amplitude been shown to be enhanced in oddball paradigms due to less efficient inhibition (Friedman, 2008), in a more recent study, on the role of inhibition states an increase of P50 and N1 in older adults across pure-tone auditory and audiovisual speech paradigms, similarly in the study of Leiva et al. (2021) showed that older adults were unable to filter out task irrelevant stimuli, the deviation to distractors was more present compared to younger adults (Leiva et al., 2021). This interpretation is consistent with prior work linking aging to difficulties in filtering out stimuli due to reduced inhibitory control and increased distractibility (Yadon et al., 2009). The works of Lavie (1995) around perceptual load theory shows how passive processes of rejecting distractors involve active inhibitory components and a full cognitive engagement in a task relevant activity that can be degraded with healthy aging (Lavie, 1995). In normal cases, even if the brain appears to passively ignore distractions, it is actually engaging active inhibitory processes to suppress irrelevant information. In our case, watching a silent movie was maybe not a sufficient distractor to guarantee inhibitory control in older population. Thus, filtering out auditory distractions is not a passive process but requires cognitive effort that becomes more pronounced in older adults, where inhibitory auditory processes tend to decline even when pure-tone thresholds remain within normal limits. However, this enhanced cortical responses related to N1 in the older group remains an unuasual result compared to another studies exploring N1 and aging. N1 varies with age but also varies according to the stimulation paradigm applied. In fact, Ungan et al. (2020) demonstrated reduced N1 amplitudes to binaural beats in older adults with preserved cognition, suggesting that physiological aging of TFS and envelope processing can directly impact early cortical responses (Ungan et al., 2020). Similarly, Grose and Mamo (2012a, 2012b) reported that while frequency-following responses remained robust across age, 40 Hz binaural beat responses were markedly reduced in older adults, again pointing to age-related deficits in binaural temporal coding (Grose & Mamo, 2012a). These findings differ from our observation of increased N1 amplitudes in a passive oddball task, likely because our paradigm is based on passive oddball listening to evaluate unattentional sensitivity to sound change, by emphasizing inhibitory control and distractor suppression, whereas binaural beat paradigms specifically index temporal coding fidelity. These methodological differences may account for the divergent patterns of N1 modulation reported across studies.
Binaural Unmasking and Cognitive Hearing
The hypothesis that increased N100 amplitudes in response to auditory stimuli reflect reduced inhibitory control with age is supported by the results presented in Figure 7 that shows the variation of N100 amplitude with unmasking, with higher N100 amplitudes observed when unmasking was more challenging. Additionally, our findings demonstrate that unmasking performance varied with age. These results suggest that one of the main challenges in SPIN may be linked to difficulties in spatial release from masking, or binaural unmasking, which appears to decline with age, even in the absence of age-related hearing loss or presbycusis. Our data indicate that binaural unmasking is not solely reliant on peripheral auditory processing, central processes may also be involved (Humes et al., 2012). Numerous studies have shown that binaural unmasking is heavily influenced by selective attention and inhibitory control. In noisy environments, the ability to distinguish speech from background noise depends not only on efficient integration of ITDs and ILDs but also on the listener's cognitive capacity to filter out environmental noise (Tremblay et al., 2021).
Selective attention has been identified as one of the key functions in binaural hearing, ensuring individuals can effectively navigate noisy environments (Meister et al., 2013). In our study, despite the absence of auditory threshold deficits in the older group, and despite SPIN and localization scores remaining within the normal range, the significant reduction in SRTs for SPIN and increased localization errors indicate the impact of normal aging on the cognitive processes—like selective attention—involved in binaural integration. Our results align with the pioneering work of Füllgrabe et al. (2014) where he reports decline in auditory and cognitive behavior in old patients with normal audiograms, suggesting that in some cases of hearing loss, there is a risk of confusion, between cognitive decline related strictly to sensory loss, or accentuated by age effect (Füllgrabe et al., 2014). As mentioned earlier, all these findings are taking place in a population that does not present pathological aging of hearing or presbycusis, this drives us to the assumption that auditory aging, can start to impact higher order of cognitive function, even when no peripheral problem is detected. In fact five out of 10 participants in the OLD-a group who had normal audiometric thresholds, had a (SRT) exceeding −3 dB, a value commonly associated with reduced ability to benefit from the squelch effect, which depends heavily on inhibitory mechanisms. Such individuals are often considered candidates for hearing aid fittings. This reinforces our assumptions regarding reduced selective attention and inhibition related to age despite normal peripheral hearing. Although these changes with age does not seem to largely impact their behavior in sound localization, speech perception and MoCa, nor their quality of life, this change in hearing sensitivity reflected by ERPs should alert us that cognitive decline reported in sensorineural hearing loss, can be possibly due, not only to the lack of peripheral input, but also to a higher vulnerability to cognitive deficit related to normal aging. In this case N100 amplitude may serve as a potential marker for higher order auditory deficit that could predict future auditory performance and help in optimizing the screening of individuals in need for hearing aids even when they present clinically normal audiometric thresholds. A key limitation of the present study is that audiometric assessments were limited to frequencies up to 8 kHz, leaving higher frequency hearing status unexamined. For future investigations, it will be important to determine whether these individuals also present with elevated thresholds at extended high frequencies, which may reflect the early onset of peripheral hearing loss not detected in standard clinical testing.
Conclusion
These findings suggest that even in the absence of sensorineural hearing loss, the decline in spatial auditory performance accompanied by a change in the CAEP with age are complementary with previous studies highlighting behavioral and neural processing decline with age. These findings also underscore the validity of ERP components as markers of spatial hearing performance that could orient the decision-making concerning the necessity for hearing rehabilitation in some cases. The findings shed the light on the need for more targeted diagnostic approaches that go beyond conventional audiometry and can be systematically applied to middle-aged individuals with NH. Such early intervention could facilitate rehabilitation prior to the symptomatic onset of age-related hearing loss and prevent deficit-related outcomes such as cognitive decline.
Footnotes
Ethical Considerations
This study was approved by the Ethical Committee of the University Hospital of Purpan (Toulouse), and all participants provided written informed consent prior to their participation, in accordance with institutional and international ethical standards.
Authors Contributions
MA contributed to conceptualization, project administration, methodology, data collection, analysis of raw data, data visualization, statistical analysis, writing original draft, and writing reviewing and editing of the manuscript. PN contributed to project administration, methodology, data collection, analysis of raw data. KS contributed to methodology and project administration. MM contributed to conceptualization, project administration, resources, and supervision. PB contributed to conceptualization, project administration, resources, and supervision.
Funding
The authors disclosed receipt of the following financial support for the research, authorship, and/or publication of this article: This research was supported by Agir pour l’audition (APA-RD2015-6B), and the French National Research Agency under grant numbers AgeHear (ANR-20-CE28-0016) and Hearing3D (ANR-16-CE17-0016).
Declaration of Conflicting Interests
The authors declared no potential conflicts of interest with respect to the research, authorship, and/or publication of this article.
Data and Code Availability
The data supporting the findings of this study are available from the corresponding author upon request and with permission from the study sponsor, Toulouse University Hospital. These data are not publicly available due to the presence of personal health information that could compromise the privacy of research participants. Custom scripts used for EEG pre-processing and analysis are also available upon request from the corresponding author.