
Abstract
Past research suggests that older adults expend more cognitive resources when processing visual speech than younger adults. If so, given resource limitations, older adults may not get as large a visual speech benefit as younger ones on a resource-demanding speech processing task. We tested this using a speech comprehension task that required attention across two talkers and a simple response (i.e., the question-and-answer task) and measured response time and accuracy. Specifically, we compared the size of visual speech benefit for older and younger adults. We also examined whether the presence of a visual distractor would reduce the visual speech benefit more for older than younger adults. Twenty-five older adults (12 females, MAge = 72) and 25 younger adults (17 females, MAge = 22) completed the question-and-answer task under time pressure. The task included the following conditions: auditory and visual (AV) speech; AV speech plus visual distractor; and auditory speech with static face images. Both age groups showed a visual speech benefit regardless of whether a visual distractor was also presented. Likewise, the size of the visual speech benefit did not significantly interact with age group for accuracy or the potentially more sensitive response time measure.
Successfully participating in a conversation involves identifying what is said (i.e., speech recognition), extracting meaning from this analysis (i.e., speech comprehension), and acting on this meaning by producing a response in a socially acceptable amount of time (Carlile & Keidser, 2020). In day-to-day social situations, these processes often need to occur in the presence of auditory and visual (AV) background noise (e.g., in a busy café). Communication with noise can be challenging, particularly for older adults experiencing age-related changes in auditory and cognitive functioning (Pichora-Fuller et al., 2017). Since social engagement fosters wellbeing in old age, it is important to understand the barriers and facilitators of effective communication for older adults (WHO, 2015).
Visual speech, i.e., seeing a talker's face, has been shown to have a large facilitatory effect on speech recognition in noise for older and younger adults (Beadle et al., 2021; Sommers et al., 2005; Tye-Murray et al., 2016). That is, when listeners are presented with words or sentences in noise and asked to recall what was said, recognition performance is better for an auditory-visual (AV) speech condition in comparison to auditory-only (AO) one (i.e., the visual speech benefit). This benefit is typically measured in terms of speech recognition accuracy, however, using phoneme or syllable detection tasks, several studies have shown that it can also facilitate response time for both younger (Jesse & Janse, 2012; Kim & Davis, 2014; Paris et al., 2016) and older adults (Jesse & Janse, 2012). Response time offers a potentially more sensitive measure of the visual speech benefit, since accuracy measures are bounded by chance performance at the lower end of the range and by perfect performance at the top end of the range (see James et al., 1994).
Although the faciliatory effect of visual speech on speech recognition is well accepted, it has not been established whether seeing a talker's face will help older adults communicate in situations that require prompt comprehension of (and action on) the meaning of speech. This is an important issue to address, since extracting meaning and acting on it, not just accurately but also promptly, are primary elements of speech communication. To help fill this gap in the literature, the current study investigated whether visual speech facilitates the speed as well as the accuracy of older and younger adults’ speech comprehension in noise, compared with an AO condition. Furthermore, in keeping with the idea of increasing ecological validity, the current study also included a visual distractor and tested whether it would reduce any comprehension benefits provided by congruent AV speech. Given that real-world AV situations often include not only the face of the talker of interest but also other irrelevant talking face(s), we chose an irrelevant talking face as a visual distractor.
Why might a visual speech benefit be different for speech comprehension, and why might this show up when comparing young and older adults under more real-world demands? In short, we propose that speech comprehension in real-life circumstance requires more extensive cognitive processing than speech recognition, and that this may reduce the visual speech benefit obtained by older versus younger adults. This proposal may seem counter-intuitive, since visual speech facilitates speech recognition and so would be especially useful for older adults when carrying out a more cognitively demanding speech processing task. However, it makes sense if it is the case that being able to use visual speech requires cognitive resources and is effortful, particularly for older adults. This is precisely what Gosselin and Gagné (2011) have claimed based on the results of a dual-task paradigm. In their study, young and old participants’ performance on a primary word recognition in noise task and a secondary tactile pattern recognition task (either concurrently or separately) was measured. It was found that older adults had higher dual-task costs on performance when visual speech was presented, and this was interpreted as indicating that for older adults the processing of the additional visual cues placed an extra demand on processing resources.
Other evidence consistent with the idea that being able to utilize visual speech requires cognitive resources, and thus can disproportionately affect older adults, comes from studies that have increased the need for participants to pay attention to the task. For example, studies using sentence recognition tasks have shown that the size of older adults’ visual speech benefit declines when the location of a target talker is visually uncertain (e.g., when there is more than one possible target talker in a visual scene, Beadle et al., 2021), and when there is a visual distraction (i.e., an additional visual stimulus not relevant to the target visual speech, Cohen & Gordon-Salant, 2017).
If there is a cost in utilizing visual speech, then a visual speech benefit might be reduced when older adults need to comprehend and act on speech presented in noise, especially when real-life factors such as talker uncertainty and visual distractors are involved. Indeed, results from AV comprehension studies with populations that have relatively fewer processing resources than younger adults, (e.g., young children), have shown that a robust visual speech benefit is not always found. For example, in three speech comprehension experiments conducted by Rudner et al., (2018), 8-year-old children did not show a significant benefit from AV compared to AO speech in noise. For the few studies that have shown a statistically significant benefit of AV presentation in speech comprehension tasks, the effect sizes were small (Nirme et al., 2019; Nirme et al., 2020; Rudner et al., 2018) compared to that shown in word recognition studies (Halverson & Lalonde, 2020).
As mentioned above, research on whether visual speech will benefit speech comprehension is rare. That is, studies on aging and speech comprehension in noise have been conducted using tests mostly in the auditory modality (e.g., Best et al., 2018; Schneider et al., 2000; Sommers et al., 2011). One study, i.e., Tye-Murray et al. (2008) compared younger and older adults’ performance in two AV speech conditions using a comprehension task. However, the two conditions differed not only in visual (clearly visible vs blurry) but also in auditory signal clarity (+5 vs −5 dB), so it is difficult to interpret the results with respect to the current interests, i.e., the extent that a visual speech benefit occurred.
In response to the limitations of previous studies, the current study aimed to determine the size of the visual speech benefit in older and younger adults’ speech comprehension by implementing features of real-life listening, i.e., when prompt comprehension and action are required; use of an AV condition that includes not only the face of the talker of interest but also another irrelevant talking face. For this, the current study adopted the question-and-answer task (Best et al., 2016). In the original task, listeners were presented with the basic components of a conversation, i.e., a question and then an answer using only the auditory modality (e.g., Q: What colour is a lime A: Green), and asked to indicate, via a button press, if the answer was true or false; then another question and answer was presented, and so on. This simple true-false response format captures speech understanding and action that occurs in a rapid manner, such as during an on-going conversation for which a listener needs to maintain attention.
The current study involved several modifications to the question-and-answer task. The first related to the current interest in creating AV conditions that are potentially visually demanding and distracting. Here, the spoken items were presented in three visual presentation conditions: static image (i.e., a static image of three faces), AV (i.e., two target talking faces were shown; one uttering the question and one uttering the answer), and AV with visual distraction (i.e., question face, answer face, and one distractor face). It is important to note that to create visual uncertainty, the question and answering face locations were randomly swapped across trials (see Method for details). A second modification was made to the task instructions and was related to the current interest in measuring visual speech benefit in comprehension and action in real time. Since a visual speech benefit can manifest in accuracy as well as response time, we instructed participants to respond as quickly and accurately as they could via a simple button press and both response time and accuracy were measured. As Best et al. (2016) only measured accuracy, the current study is the first to include response time as a performance measure for the question-and-answer task. Given this interest in response time, and because only correct response times are analyzed, it is important that task difficulty is not too high since this would result in many errors that would potentially produce uneven sample sizes across conditions.
One property of the original (auditory-only) question-and-answer task is that accuracy is generally close to ceiling unless quite adverse SNRs are employed. For example, in Best et al.'s initial study, younger adults’ performance was near chance (i.e., 65%) only when the stimuli were presented at −14 dB. This high level of accuracy is likely due to the task being derived from the “Helen Test,” which was originally developed to test the speech reading abilities of individuals with profound hearing loss (low lexical complexity). In selecting SNRs for the current study, we aimed to avoid presenting SNRs that would be highly unlikely in real life, such as −14 dB, but we also wanted to prevent ceiling performance on the auditory-only condition, so that it would be possible for some improvement to occur for the AV conditions. Additionally, to minimize the effect of age-related hearing loss on task difficulty, each age group was presented with a different SNR. That is, for older adults, the signal-to-noise ratio (SNR; −8 dB) was less adverse than that used for the younger adults (−10 dB). These SNRs were determined from a pilot study that showed that both age groups performed at approximately 80% correct for these respective SNRs when no visual cues were provided.
In summary, the current study tested older and younger adults to determine the visual speech benefit for speech comprehension using the question-and-answer task, in AO (with a static face) and AV with/without visual distraction conditions, and both response time and accuracy were measured. As older adults were presented with a less adverse SNR than younger adults, it was predicted that there would not be a significant difference in accuracy scores between age groups. It was also predicted that younger and older adults would be less accurate for the static condition in comparison to the auditory–visual condition and the auditory-visual with visual distraction condition, and that the two auditory–visual conditions would be near ceiling performance, and not significantly different from each other. That is, as the lexical complexity of the question-answer stimuli is low, visual distraction was not expected to affect younger or older adults’ ability to accurately respond.
Based on cognitive ageing and speech recognition in noise literature, it was predicted that older adults would respond slower than younger adults overall and that both age groups would gain a visual speech benefit (i.e., response times would be faster for the auditory–visual condition than the static condition). Furthermore, it was expected that the response time measure would be sensitive to effects of distraction. That is, we expected that response time would be a more sensitive measure for detecting older adults’ distractibility, and that the visual speech benefit should reduce (i.e., response times should increase) for older adults, but not for younger adults, when visual distraction is presented.
To evaluate how strongly age-related changes in sensory and cognitive processing are related to participants’ AV speech comprehension and action abilities, the current study also tested participants’ visual acuity, hearing sensitivity, and working memory capacity. Based on previous research on AO comprehension in noise (Dryden et al., 2017; Humes, 2013), it was expected that older adults would perform worse than younger adults on the sensory and cognitive tests, and that working memory capacity and hearing sensitivity would be related to performance on the question-and-answer task, particularly for the condition with additional visual distraction due to the additional cognitive demand of this condition.
Method
Participants
Twenty-five younger adults (17 Females, MAge = 22) and 25 older adults (12 Females, MAge = 72) participated in this study. Younger adults were students at Western Sydney University and participated for course credit or monetary reimbursement. Older adults were recruited from the community and participated for monetary reimbursement. All participants reported English as their first language and passed a screening test for mild cognitive impairment (The Clock Test; Nishiwaki et al., 2004). Based on the R pwr package (Version 1.3-0; Champely et al., 2018), a sample size of 24 participants per group will reliably detect a medium-sized effect (i.e., δ ≥ 0.56; J. Cohen, 1988), with a probability greater than 0.8, assuming a one-sided criterion for detection that allows for a maximum Type I error rate of α = .05.
Participants’ hearing sensitivity is summarized in Figure 1. All younger participants had normal hearing (i.e., ≤ 25 dB HL at .25, .5, 1, 2, 4 kHz). Older adults’ hearing levels were more diverse, ranging from normal to moderately-severe hearing loss (i.e., 40 dB HL < HTL ≤ 70 dB HL at .25, .5, 1, 2, or 4 kHz in the better ear), with the majority of older participants having mild hearing loss (12 participants; 25 dB HL < HTL ≤ 40 dB HL at .25, .5, 1, 2, or 4 kHz in the better ear) or normal hearing (six participants). None of the participants were hearing aid users.

Audiogram results for the left and right ears. Note. The bold black line represents the mean threshold for older adults as a function of frequency. The fine black lines represent individual audiograms for older adults as a function of frequency. The shaded area represents the audiometric threshold range for younger adults.
All younger participants had normal or corrected to normal vision (i.e., ≥ 1.0 on the FrACT visual acuity measure; Bach, 2007). Younger adults’ visual acuity scores ranged from 1.11 to the maximum score of 2.0 (M = 1.63, SD = .25). Six older adults had worse than normal vision (i.e., < 1.0 on the FrACT visual acuity measure) with visual acuity scores ranging from 0.76 to the maximum score of 2.0 (M = 1.18, SD = .32). All participants provided informed consent.
Question-and-Answer Task Stimuli
An AV, Australian-English version of Best et al.'s (2016) question-and-answer Task was created. Each trial of the question-and-answer task consists of a simple, unambiguous question, and a one-word answer. The questions cover six broad categories (i.e., days, months, colours, opposites, sizes, and numbers). See Table 1 for examples of questions and answers from each category.
Description of the Six Question Categories from the Question-and-Answer Task.

Note. False answers were selected by the first author from valid answer options (i.e., answers from the same category). There was some repetition of each answer; however, the frequency of repetition varied between categories. For example, for the days category, “Wednesday” was the true answer for two questions and the assigned false answer for two questions. For the Numbers category, “two” was the true answer for 14 questions and the assigned false answer for six questions.
Recording
A native Australian-English female talker, with previous experience recording AV speech for research, was recorded uttering 226 questions and 113 answers in a sound attenuated booth. The talker was seated in front of a monitor that displayed each question and each answer one at a time. The talker said aloud each question or answer after first reading it silently. The talker was directed to speak clearly and at a natural pace, and to look into the camera lens as they spoke.
The video camera (Sony NCCAM HXR-NX30p) was situated directly above the monitor and captured video at 1920 × 1080 full HD resolution at 50 frames per second. The microphone (AT 4033a Transformerless Capacitor Studio Microphone) was placed approximately 20 cm away from the talkers’ mouth out of the camera's view and captured auditory speech at 48 kHz. All audio recordings were sent through a Motu Ultralite mk3 audio interface with FireWire connection to a PC running CueMix FX digital mixer and then to Audacity (Version 2.1.1).
One of the questions used in Best et al. (2016) was adapted for use in an Australian context, i.e., “What colour is a dime?” was changed to “What colour is a ten-cent coin?”. Two additional Australian questions and their respective answers were recorded and used (e.g., “Which is bigger, a kangaroo or a koala?”).
Editing
Two versions of the auditory recordings were created: one with an SNR of −8 dB and one with an SNR of −10 dB. Speech-shaped noise was created based on the long-term average spectrum of the original unmasked speech stimuli and then mixed with a copy of the unmasked stimuli at −8 and −10 dB, respectively. Both versions were normalized to 70 dB SPL with Praat software.
Using FFmpeg, questions from each version of the auditory recordings were concatenated twice, once with the true answer and once with the preselected false (but valid) answer. A 0.5 s silent audio file was always included between the offset of each question and onset of each answer.
The concatenated audio recordings from each SNR were added to two different video types: AV and AV with visual distraction. See Figure 2 and the section below for a summary of the stimuli presented for each presentation condition. A condition without visual speech (i.e., the static condition) was also included by presenting the AV videos simultaneously with a grey scale still image of the three faces (two female targets and one male distractor). The image covered each video so that any visual speech utterances were not visible. For each SNR (i.e., −8 dB, −10 dB), six versions of the experiment were created so that each item could appear in all conditions without being repeated to a participant.

Stimuli summary. Note. The video camera symbol indicates that a visual speech video (in colour) was presented. For the static condition, a grey scale photo was presented. Videos were presented as 12 cm (height) by 21 cm (width). The horizontal visual angle was 17° 3′ and the vertical visual angle was 9° 47′. For the auditory-visual and auditory-visual with visual distraction conditions, answer location (right vs. left) and answer type (true vs. false) were evenly distributed across trials (and pseudo-randomly presented) for each version of the experiment.
As this study was a first attempt at incorporating visual speech for the question-and-answer task, we had the same female talker present both the questions and the answers. This was done to control for differences in AV speech output that might occur by using different talkers as such differences could affect response time and/or accuracy. This procedure also required attention to be directed to the “conversation” initiator (since, as in a real conversation, participants did not know for each trial if the question will come from the left or right talker) and a switch of that attention to a new spatial location to apprehend the response.
Video Development
Prior to adding the audio signal, the individual question and answer video recordings were scaled and cropped to measure 450px (height) × 340px (width). Question videos were then paired with their preassigned true and false answer videos and one additional video of a male talker. For the AV with visual distraction videos, the middle section of the video always displayed a silent video of the male talker participating in a conversation about travelling (from Miles et al., 2020). A male talker was used in order to make the distractor distinctive. One out of eighteen possible distractor videos (all with the same male) were randomly assigned to each question-answer pair. The silent distractor video played for the full duration of each question-answer pair. For the AV videos, the middle section of each video displayed a static image of the same male (i.e., there was no visual speech or movement of any kind). FFmpeg was used for all video editing.
The time-course of stimulus presentation for the auditory visual with visual distraction conditions are shown in Table 2. As can be seen, when a question was uttered, a static image of the female talker was displayed in the location of the answer video. Likewise, when the answer was uttered, a static image of the female talker was displayed in the location of the question video. Videos were presented as 12 cm (height) × 21 cm (width). The horizontal visual angle was 17° 3′ and the vertical visual angle was 9° 47′. Answer location (right vs left) and answer type (true vs false) were evenly distributed across trials (and pseudo-randomly presented).
Time Course of Auditory-Visual and Auditory-Visual with Visual Distraction Trials.
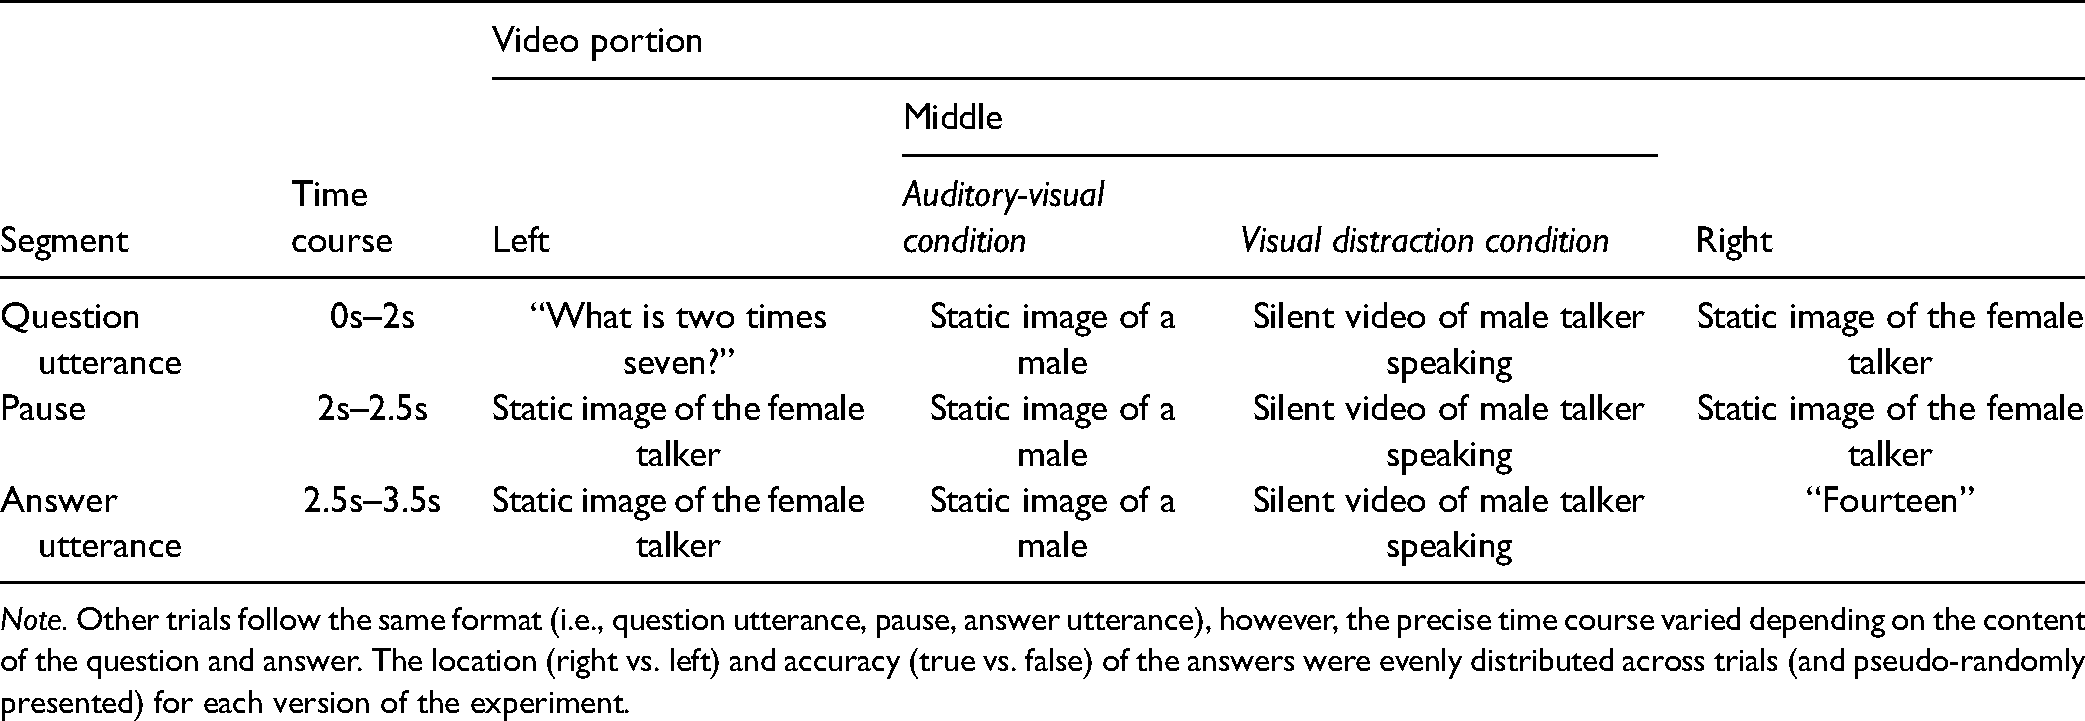
Note. Other trials follow the same format (i.e., question utterance, pause, answer utterance), however, the precise time course varied depending on the content of the question and answer. The location (right vs. left) and accuracy (true vs. false) of the answers were evenly distributed across trials (and pseudo-randomly presented) for each version of the experiment.
Hearing Sensitivity, Visual Acuity, and Working Memory Capacity
Pure-tone thresholds for both ears (Diagnostic Audiometer, AD229e) were measured at seven different frequencies (0.25,0.5, 1, 2, 4, 6, and 8 kHz). Hearing sensitivity to lower and higher frequencies were analyzed separately, since although research suggests that the most important information about speech is transmitted by energy in the low to mid-frequency region (Hazan et al., 2018); studies have also found that hearing acuity at higher frequencies (6 kHz and above) predicts performance in some listening in noise tasks (Besser et al., 2015). Lower frequency better ear average (LFBEA) scores were calculated by averaging hearing thresholds across 0.25, 0.5, 1, 2 and 4 kHz for each ear and the lower average threshold was selected. Higher frequency better ear average (HFBEA) scores were calculated using the same procedure but with average hearing thresholds from 6 and 8 kHz.
Visual acuity thresholds were measured using a four alternative forced choice version of the FrACT Landlot C task (Bach, 2007). For this task, participants identify the orientation (up, down, left, and right) of the letter “C” for 18 trials. The size of each “C” is determined by the best parameter estimation by sequential testing procedure (Bach, 2007). The listening span was used to measure working memory capacity (Conway et al., 2005). For this task, participants listened to letter sequences ranging from three to seven letters. Each letter in a sequence was preceded by an auditory semantic categorization task in which a sentence was presented (e.g., the train sang a song) and the participant judged whether the sentence made sense or not. At the end of each sequence, participants were instructed to recall each letter from that sequence using a letter matrix. The researcher performed all the mouse clicking during the task while the participant provided oral responses (i.e., true, false, and letter sequences). Participants were instructed to adjust the volume to a comfortable level during a practice session. The LSPAN was calculated as the sum of all perfectly recalled sequences (i.e., the absolute scoring method). For example, if an individual recalled 2 letters in a set of 2, 3 letters in a set of 3, and 4 in a set of 5, their absolute score would be 5 (i.e., 2 + 3 + 0). The maximum score was 75.
Apparatus
Question-and-answer task stimuli were presented using DMDX software (Forster & Forster, 2003) on a Dell T7810 computer with Windows 7. Stimuli were presented on a 30 cm × 53 cm monitor and binaurally through Sennheiser HD280pro headphones. A response button-box interfaced with the DMDX program via a parallel input/output card (Measurement Computing PCI-DIO24) to provide millisecond accurate response timing. A laptop PC (Windows 7) was used to administer the FrACT and LSPAN. For the LSPAN, sound was delivered binaurally through Sennheiser HD280pro headphones.
Procedure
The experiment was approved by the Western Sydney University Research Ethics Board. After providing informed consent, participants completed a questionnaire about their age, sex, and native language. Next, the question-and-answer task with noise was presented to older and younger participants.
For the question-and-answer task, participants were seated in a sound attenuating booth approximately 70 cm from the computer monitor. Participants were told that they would hear a question followed by a one-word answer and that their task was to respond (as quickly and as accurately as possible) by indicating whether each answer was true or false on the button box provided. Participants were familiarized with the button box; the left button was always labelled “FALSE” and the right button “TRUE.”
Participants were also told that they would see a fixation cross and then static or talking faces for each trial. Participants were instructed to attend to each fixation cross and to the faces, and to avoid closing their eyes during the experiment. To ensure attention to the faces, catch trials were included. Catch trials appeared as a trial from the AV condition with a red border surrounding the videos. Participants were instructed not to press either button (i.e., true or false) when catch trials were presented.
Each participant completed a practice session that consisted of two items from the Static Condition presented with noise at −1 dB, two items from the AV condition presented with noise at −8 dB (older) and −10 dB (younger), and two practice catch trials. After the practice session, participants completed 234 trials (216 test trials and 18 catch trials) presented in a pseudo-randomised order with an enforced break after 117 trials (i.e., halfway). Five questions were presented twice as catch trials (once with a true answer and once with a false answer). Four questions that were presented during the practice session were also used as catch trials. Questions presented as practice or catch trials were not used as test trials. For each trial, participants had 10 s from the onset of each question to respond. The following trial always started after the 10 s had passed, regardless of when the participant responded. Accuracy and response time (from the onset of the answer) were measured.
Trials from each presentation condition were intermixed and presented pseudo-randomly (i.e., conditions were not blocked). As mentioned earlier, for trials from the AV and AV with visual distraction conditions, the face uttering the question appeared on the right side (and the face uttering the answer on the left) 50% of the time. The location (right vs left) and the type (true vs false) of the answers were evenly distributed across trials (and pseudo-randomly presented) for both AV conditions, for each version of the experiment.
After completing the question-and-answer task, participants completed the FrACT visual acuity test, pure-tone audiometry and the LSPAN test. The testing session took approximately one and a half hours.
Results
Speech Comprehension Task
The response time and accuracy data from the question-and-answer task were analyzed to answer two questions: first, whether presenting AV targets helped older and younger adults’ performance (i.e., response time and/or accuracy) on the speech comprehension test, and second, whether the visual distractor reduced performance (in response time and/or accuracy) compared to the AV target condition.
Response Time
Participants’ response times were measured from the onset of the answer of each item. Answer onset was selected as a timing point rather than answer offset since participants were instructed to respond as quickly as possible, and for many trials participants responded after the answer onset, yet before the answer offset. Note that all participants identified at least 14 of the 18 catch trials, suggesting that participants were attending to the video stimuli throughout the experiment.
We fitted a linear mixed model (estimated using ML and nloptwrap optimizer, and used the afex r package, Singmann et al., 2016, to provide p values), to predict response time as a function of age group (younger vs older), presentation condition (Static vs AV vs AV + visual distraction) and answer type (formula: RT ∼ presentation condition × age group × answer type). The model included participants and items as random effects (formula: list (∼1 | participants, ∼1 | items)); including random slopes, however, resulted in singular models and so reduced models were used (see Bates et al., 2015; Matuschek et al., 2017, on fitting overparameterized models). The model's total explanatory power was reasonable (conditional R2 = 0.41); the part related to the fixed effects (marginal R2) was 0.06.
Figure 3 shows the mean correct response times (ms) for younger and older adults as a function of answer type and presentation condition.

Mean correct response times (ms) for younger (left panels) and older adults for true and false answers (top and bottom panels, respectively) as a function of presentation condition, age group, and answer type. Note: Standard boxplots are shown representing the median and interquartile range (Q3-Q1); the additional black dots show the mean; the grey dots show participant data.
The results for the analysis of the response time data are summarized in Table 3.
Summary of the Linear Mixed Model Analysis of the Correct Response Times (ms) for all Participants as a Function of Presentation Condition (Static, Auditory-Visual, Auditory-Visual + Distractor); Age Group (Younger, Older); Answer Type (True, False) and Interaction Effects.

Note. Significant p-Values are in Bold.
As shown in Table 3, there was a significant main effect of presentation condition; this main effect was examined in a set of planned comparisons that were conducted using the emmeans package (1.5.1, Lenth et al., 2019) and adjusted for multiple comparisons using a multivariate t distribution approach. Response times for the Static Condition (M = 1061, SE = 13.7) were significantly slower than participants response times for the AV Condition (M = 849, SE = 10.2, t(1,9284) = 15.784, p < .0001) and the AV with distraction condition (M = 877, SE = 11.6, t(1, 9284) = 13.634, p < .0001). These two latter conditions were not significantly different from each other (t(1,9279) = −2.209, p = 0.698). A significant main effect of answer type was also found. Participants responded faster when the answer type was true (M = 800, SE = 9.2) in comparison to when the answer type was false (M = 1042, SE = 9.9), t(1,9267) = −22.313, p < .0001. No significant interaction effects were found.
Post-hoc Analyses
A factor that likely contributed to variability in responses is the type of question and answers that were presented. In their study with younger adults, Best et al. (2016) found that the different types of question and answers attracted different error rates. They found that colors had the most, then opposites and sizes; with numbers, months and days attracting fewer errors (see Table 1 for examples of the different types). This difference in error rates suggests that some questions and answers were easier than others.
In the Static condition, we found the same error pattern as Best et al. (2016) did), see below. What is new, is that we also found that the ordering of older adults’ response times (in the static condition) was consistent with the Best et al. results. That is, days, numbers, and months had fastest response times, with responses to colours, opposites, and sizes being slower. Given that questions and answers with slower response times (and more errors) are more difficult, the issue of whether question/answer difficulty differentially affected the older and younger adults is worth exploring. This is because any effects of visual distraction in older adults may only be apparent under conditions of high cognitive load (e.g., when performing a difficult task) as such may reduce cognitive resources needed to help overcome distraction. To do this, we divided the questions into “easy” (days, months, and numbers) and “hard” (colors, opposites, and sizes) conditions; and a linear mixed model was used to predict response time as a function of age (younger vs older), presentation condition (static vs AV vs AV + distraction) and easy vs. hard question/answers (formula: RT ∼ presentation condition × age group × easy-hard). The model included participants and items as random effects (formula: list (∼1 | participants, ∼1 | items)); including random slopes, however, resulted in singular models and so were not included. Estimated mean correct response times (ms) for the easy and hard questions and answers as a function of age group and presentation condition are shown in Figure 4.
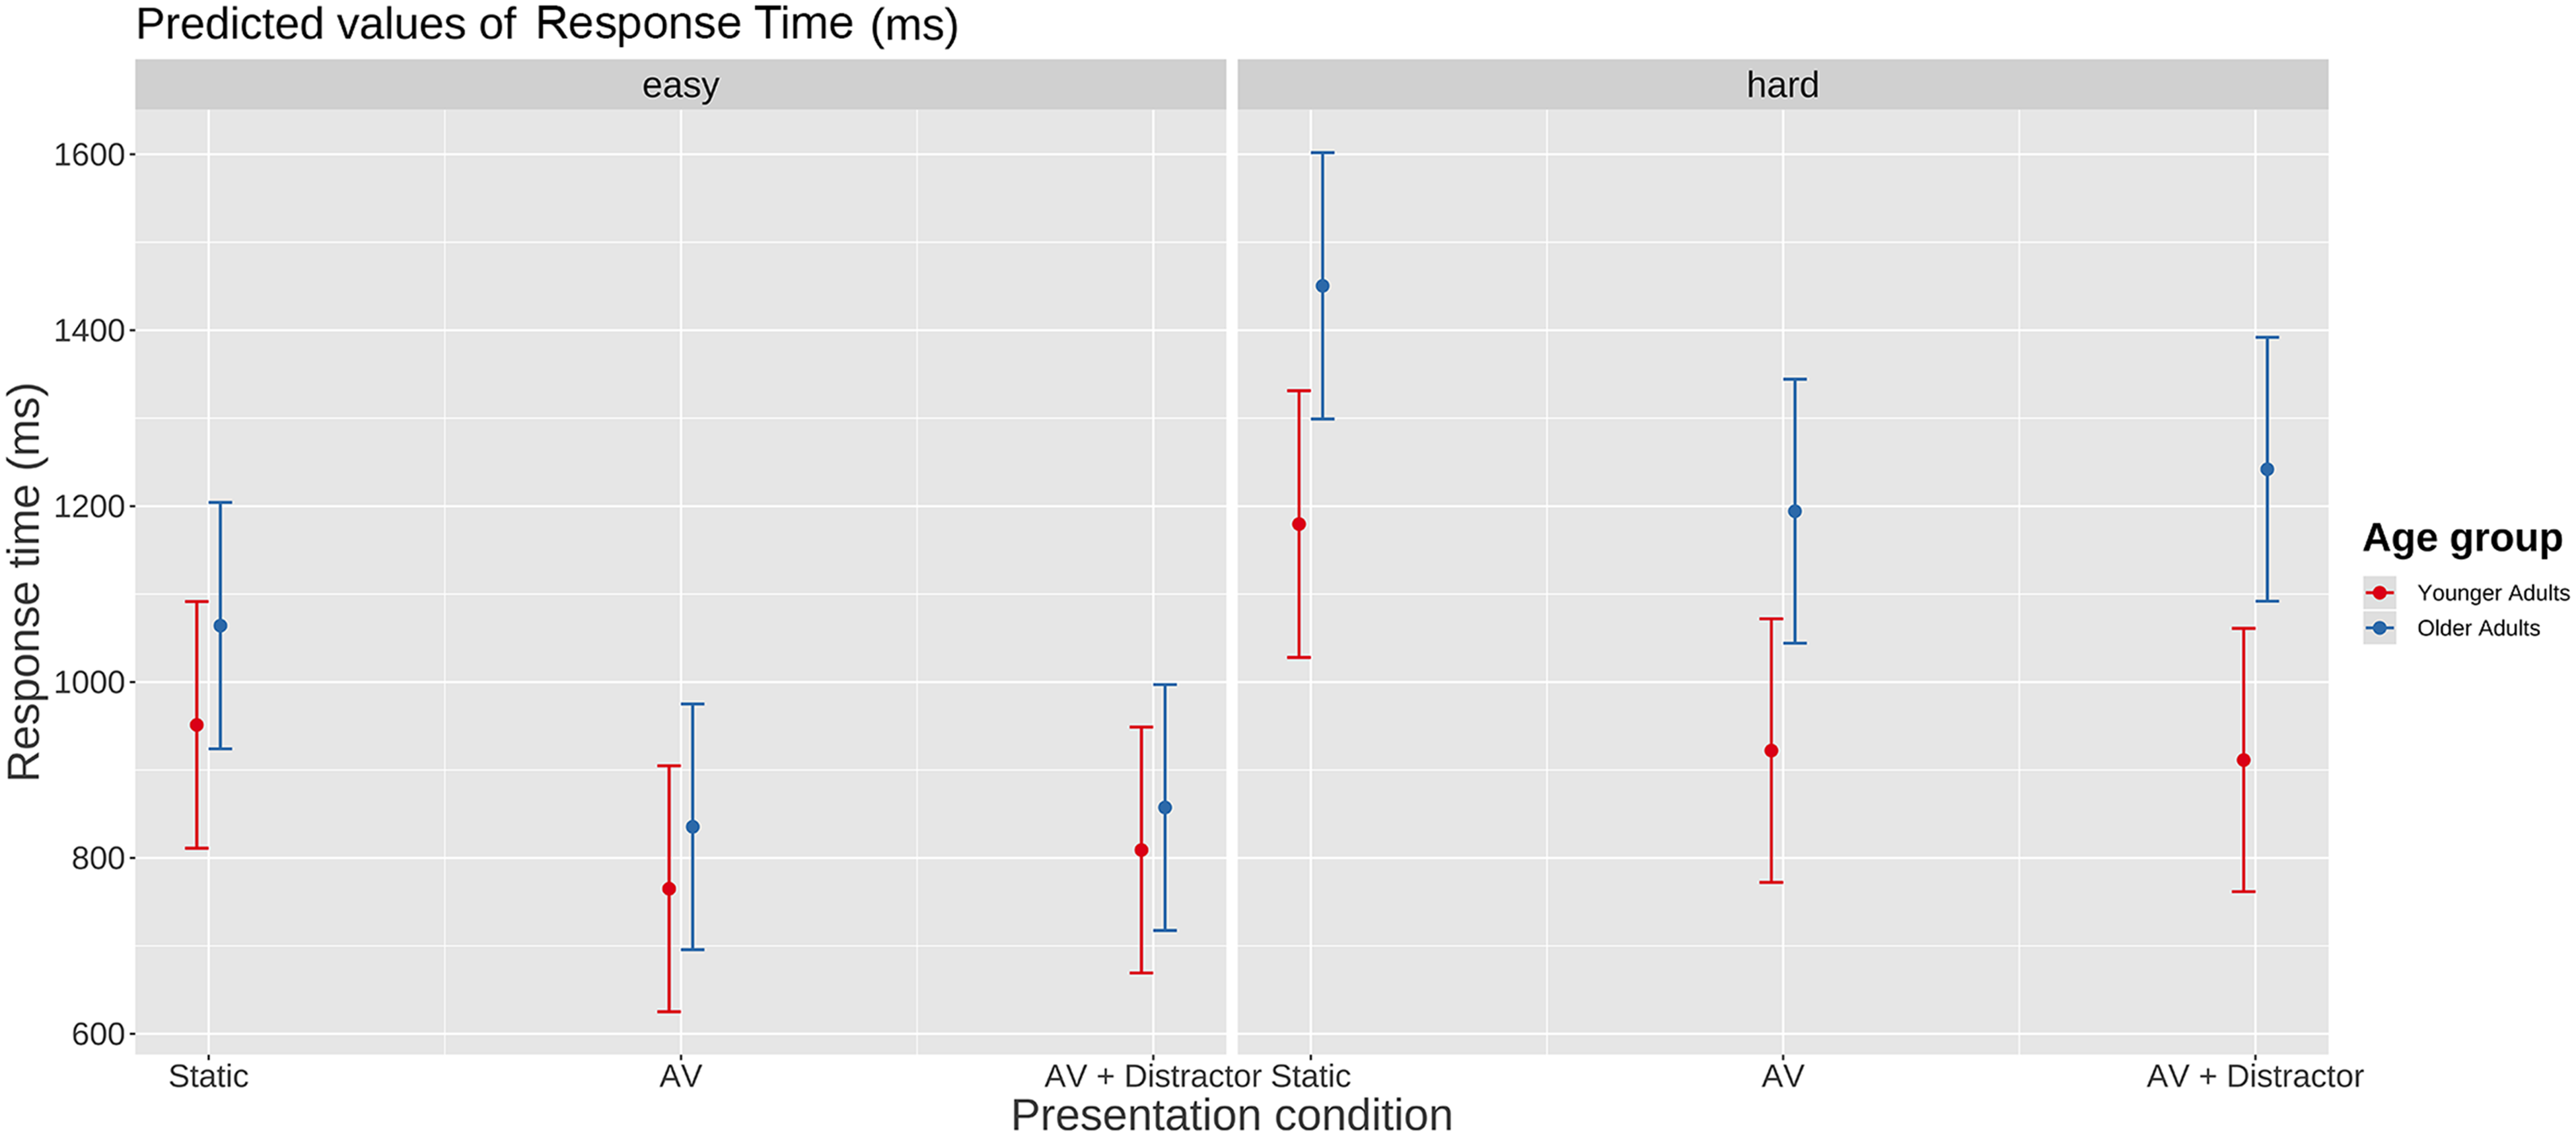
Mean correct response times (ms) for the easy and hard questions and answers as a function of age group and presentation condition. Note: The whiskers represent 95% confidence intervals.
The results for the analysis of the response time data as a function of presentation condition, age group, and easy vs hard question/answers are shown in Table 4.
Summary of the Linear Mixed Model Analysis of all Participants’ Correct Response Times (ms) as a Function of Presentation Condition (Static, Auditory-Visual, Auditory-Visual + Distractor); Age Group (Younger, Older); Easy-Hard Question/Answers and Interaction Effects.

Note. Significant p-Values are in Bold.
As can be seen, there was a significant effect of presentation condition, however, the effect of age group was not secure, nor was the interaction between presentation condition, age group, and easy-hard questions. Given the exploratory nature of this analysis, we examined the effect of age group on presentation condition further by conducting pairwise contrasts between the younger and older adults’ response times for the static, AV and AV + distractor conditions (multiple comparison corrected using emmeans). None of the pairwise age group comparisons for the easy questions and answers were significant (static, estimated effect = 113 ms; SE = 99.4, Z-ratio = 1.14, p = .87; AV, estimated effect = 70 ms, SE = 99.1, Z-ration = .71, p = .98; AV + distractor, estimated effect = 48 ms, SE = 99.13, Z-ratio = .49, p = 1.0). For the hard questions and answers, the effect of age group for the static and AV presentation conditions was not significant (static, estimated effect = 271 ms, SE = 105.0, Z-ratio = 2.58, p = .10; AV, estimated effect = 272 ms, SE = 103.82, Z-ratio = 2.62, p = .09). There was a significant effect of age group for the AV + distractor condition (estimated effect = 331 ms, SE = 103.73, Z-ratio = 3.19, p = 0.018).
In summary, the effect of age on correct response times was not significant. Both age groups responded faster to items presented with visual speech (in comparison to static faces) and to items that had a true answer (in comparison to a false one); further, there was no effect of visual distraction on response time (AV vs. AV + distractor) for either age group. An analysis based on a hard/easy question-answer split, indicated that correct response times for older adults for the hard question-answers were significantly slower than younger adults in the AV + distractor condition. It should be emphasized that this last result came from an exploratory, post-hoc analysis.
Accuracy
Figure 5 shows the mean proportion of errors for the question-and-answer task as a function of age group, presentation condition, and answer type. As can be seen, almost all older and younger adults performed at above chance levels for all presentation conditions and answer types.

Mean percent error rates as a function of age group (younger, older adult), presentation condition (static, AV, AV + distractor) and answer type (true, false). Note: Standard boxplots are shown representing the median and interquartile range (Q3-Q1); the additional black dots show the mean; the grey dots show participant data.
Errors were analyzed by fitting a logistic mixed model (i.e., a generalized linear mixed model, family = binomial) to predict error as a function of presentation condition, age group, and answer type (formula: error ∼ presentation condition × age group × answer type). The model included participants as and items as random effects (formula: list(∼1 | participants, ∼1 | items)). The model's total explanatory power was reasonable (conditional R2 = 0.32) with the part related to the fixed effects, marginal R2 = 0.07. The results from the analysis of the error data are shown in Table 5.
Summary of the Linear Mixed Model Analysis of Errors Made by all Participants as a Function of Presentation Condition (Static, Auditory-Visual, Auditory-Visual + Distractor); Age Group (Younger, Older); Answer Type (True, False) and Interaction Effects.

Note. Significant p-Values are in Bold.
As can be seen in Table 5, there was a significant main effect of presentation condition; pairwise comparisons of this main effect were conducted using the emmeans package (multiple comparison adjusted). The results showed that participants were significantly less accurate for the static condition (proportion error, M = 0.18, SE = .01) compared to the AV condition (M = 0.08, SE = .01, Z-ratio = 13.098, p < .0001) and the AV with visual distraction condition (M = 0.08, SE = .01, Z-ratio = 12.522, p < .0001), which were not significantly different from each other (Z-ratio = −0.679, p = .775).
A significant main effect of answer type was also found. Participants were less accurate when the answer type was true (proportion error, M = 0.14, SE = .005) in comparison to when the answer type was false (M = 0.10, SE = .004), Z-ratio = 6.35, p < .0001. The main effect of age was not significant, i.e., the mean proportion of errors made by older adults (M = 0.12, SE = .004) was not significantly different from that of the younger adults (M = 0.11, SE = .004, Z-ratio = 1.31, p = .19).
There was a statistically significant interaction between presentation condition and answer type. Interaction comparisons using the emmeans package (multiple comparison adjusted) showed that this was driven by a significant difference in the proportion of errors between the static and AV conditions for answer type true compared to answer type false (Z-ratio = 3.987, p < .0001) and a significant difference in errors between the static and AV + distraction conditions for true and false answers (Z-ratio = 3.380, p < .001). There were no significant interactions between age group and the other variables.
In summary, there was no significant age effect on speech comprehension accuracy. Both age groups responded more accurately to items that were presented with visual speech (in comparison to static faces) and both age groups were more accurate when the answer type was negative (false) in comparison to positive (true). There was no effect of visual distraction on accuracy for either age group. The magnitude of the difference between the static and the two dynamic face conditions varied: the difference was greater for true than false responses.
We conducted post-hoc analyses on the error data using the hard and easy stimuli (as per the response time analyses). The results of the general linear mixed model are shown in Table 6. As can be seen, the outcomes are similar to the response time analysis (Table 4) except that the interaction between age and hard-easy question/answers was not significant.
Summary of the General Linear Mixed Model Analysis of Errors Made by all Participants as a Function of Presentation Condition (Static, Auditory-Visual, Auditory-Visual + Distractor); Age Group (Younger, Older); Hard-Easy Question/Answers and Interaction Effects.

Note. Significant p-Values are in Bold.
Discrimination (d’) and Bias
As participants’ responses for the question-and-answer task consisted of true/false judgements, the accuracy data were also analyzed based on the signal detection theory (Green & Swets, 1966). Signal detection theory provides a way of understanding accuracy and error in terms of sensitivity and response factors, and generates separate bias and sensitivity estimates. The results for this additional analysis are presented in the supplementary materials (Supplementary Figure S1). This analysis showed that both older and younger adults had poorer discrimination (lower d’) and were more biased to respond false for the static condition in comparison to both AV conditions. Visual distraction did not affect younger or older adults’ sensitivity or bias.
Hearing Sensitivity, Listening Span, and Question-and-Answer Task Performance
To examine how performance on the question-and-answer task varied as a function of the participant's hearing level and working memory capacity (as indexed by listening span), we conducted two linear mixed models, one using the response time and one using the error data (note, mixed model analysis for the separate effects of hearing level and listening span on question-and-answer task performance are detailed in Supplementary materials B and C). For this model, we only analyzed older adults scores as the younger adult group had normal hearing levels with a restricted range. In the following analysis, only the higher frequency BEA data are used, as separate analyses of both the Lower frequency and High frequency BEA scores (see Supplemental materials) showed that there was an interaction between BEA and presentation condition (for both response time and errors) only for the HFBEA scores.
For the response time data, we fitted a linear mixed model (estimated using REML and nloptwrap optimizer) to predict response time as a function of presentation condition, HFBEA and LSPAN scores (formula: Presentation condition * HFBEA * LSPAN). The model included participants and items as random effects (formula: list(∼1 | Participants, ∼1 | Items)). The model's total explanatory power was substantial (conditional R2 = 0.40) and the part related to the fixed effects alone (marginal R2) was 0.14. Estimated mean correct response times (ms) as a function of presentation condition, HFBEA hearing levels and LSPAN scores are shown in Figure 6.

Mean correct response times for each Presentation condition (Static, AV, AV + Distractor) as a function of HFBEA hearing level for three illustrative levels of LSPAN (maximum score obtained = 33; mean score = 11 and minimum score = 0).
The figure shows three plots, one for each presentation condition; correct response time is plotted on the vertical axis against HFBEA hearing level on the horizontal axis for three illustrative levels of LSPAN (maximum score obtained = 33; mean score = 11 and minimum score = 0). A higher BEA hearing level score indicates worse hearing; so, the general expectation would be that response times should increase as BEA score increased. As the figure shows, this pattern was the case for participants who had the minimum LSPAN score, and it occurred for each of the presentation conditions. However, participants who obtained the maximum LSPAN score showed no evidence of this trend; the curve for participants that had a mean LSPAN score was in between the other two. A summary of the analysis of the results is shown in Table 7.
Summary of the General Linear Mixed Model Analysis of Correct Response Times Made by Older Adults as a Function of Presentation Condition (Static, Auditory-Visual, Auditory-Visual + Distractor); HFBEA; LSPAN and Their Interaction.

Note. Significant p-Values are in Bold.
The analysis, as can be seen in the table, confirms the above description of the data presented in Figure 6. Overall, HFBEA had a significant effect on response times; it also had a significant interaction with presentation condition (clearest in the static condition) and a significant interaction with LSPAN score (i.e., the greater the LSPAN score, the less the influence HFBEA). The three-way interaction between HFBEA, presentation condition, and LSPAN was not significant.
To analyze the error data, we fitted a logistic mixed model (estimated using ML and BOBYQA optimizer) to predict errors as a function of presentation condition, HFBEA and LSPAN scores (formula: error ∼ presentation condition * HFBEA). The model included participants and items as random effects (formula: list(∼1 | participants, ∼1 | items)). The model's total explanatory power was reasonable (conditional R2 = 0.37) and the part related to the fixed effects alone (marginal R2) was 0.11. Estimated mean percent errors as a function of presentation condition, HFBEA hearing levels and LSPAN scores are shown in Figure 7.

Mean percent error for each Presentation condition (Static, AV, AV + Distractor) as a function of HFBEA hearing level for three illustrative levels of LSPAN (maximum score obtained = 33; mean score = 11 and minimum score = 0).
Figure 7 has the same layout as for the response time data in Figure 6, above. Like the response time data, there appears to be a relationship between HFBEA hearing level and the response measure, here, more errors for higher hearing levels. A summary of the analysis is shown in Table 8.
Summary of the General Linear Mixed Model Analysis of Errors Made by Older Adults as a Function of Presentation Condition (Static, Auditory-Visual, Auditory-Visual + Distractor); HFBEA; LSPAN and Their Interaction.

Note. Significant p-Values are in Bold.
The analysis indicated that the only significant effect was for HFBEA on error rates.
Discussion
Standard tests of listening have most often used auditory only speech, and tasks that primarily probe sound detection and speech recognition abilities. Such tests overlook important aspects of “real world” listening, e.g., that listeners typically can also see the talker (and other talkers) and that the listener's primary focus is to understand and act on the meaning of what has been said. The current study aimed to gauge the listening performance of older and younger adults using a speech comprehension task with speech presented auditorily or audio-visually with/without additional non-relevant visual speech (visual distraction). The primary aims of the study were to test, using a speech comprehension in noise task, whether seeing visual speech that matches the auditory signal improves older and younger adults’ performance (i.e., accuracy and response time) in comparison to an AO condition, and whether this benefit would be reduced, for the RT measure, when a visual distractor was additionally presented.
Due to the simple nature of the language used in the question-and-answer task, visual distraction was not expected to affect younger or older adults’ ability to accurately respond. The accuracy results were consistent with this expectation, that is, although both age groups were more accurate for the visual speech conditions in comparison to the static conditions, there was not a significant age effect or visual distraction effect for speech comprehension accuracy. The finding that both younger and older adults performed more accurately for both AV conditions in comparison to the AO one is compatible with studies that have used speech recognition tasks (Beadle et al., 2021; Cienkowski & Carney, 2002; Jesse & Janse, 2012; Tye-Murray et al., 2016).
Although the accuracy data were consistent with our expectations, the lack of a distraction effect for older adults in the response time measure was not. That is, in contrast with the cognitive ageing literature, older adults did not respond slower than younger adults overall and the visual speech benefit was not reduced for older adults when visual distraction was presented. One possible explanation for this pattern of results is that performing the question-and-answer test did not tax the processing resources of the older adults – so that even the potentially more sensitive response time measure did not pick up a difference between the older and younger adults. That is, due to the simple structure of the question-and-answer stimuli, the task may not have been so resource-demanding that older adults struggled and were therefore able to expend resources on processing visual speech and using it to facilitate their performance. This general idea that task difficulty has a role to play, is consistent with the outcome of the post-hoc “easy” versus “hard” question/answer analysis for the response time data (where the only significant difference between older and younger adults was for the hard items in the AV + distractor condition). Given this, developing an AV speech comprehension task that includes full conversation stimuli between multiple talkers may be more appropriate for identifying performance differences due to visual distraction in cognitively healthy older adults.
Another factor that may have led to the lack of age effect for the response time measure is that older adults received a less adverse SNR than younger adults. We used a more favourable SNR for older adults in an attempt to minimize the effect of age-related hearing loss and it likely had an influence on older adults' response times. That is, studies have demonstrated (at least for within-participant contrasts) that better SNRs are associated with faster word recognition response times (e.g., Houben et al., 2013). It would be interesting for a follow up study to test younger and older adults, with minimal hearing loss, using the same SNRs (e.g., presenting both age groups with stimuli at −10 dB).
Although we predicted that the response time measure would be more sensitive to visual distraction, at least for older adults, the finding that both age groups were able to successfully ignore the visual distractor is consistent with the results of Cohen and Gordon-Salant (2017), who found that the visual speech benefit gained by older and younger adults on a traditional speech recognition task was not reduced when an additional irrelevant talking face was presented. Together, the results from the current study and Cohen and Gordon-Salant (2017) could therefore be interpreted to indicate that visual distractors have a very limited impact, if any, on the visual speech benefit, particularly when the distractors do not spatially overlap with the target visual speech.
However, some caution needs to be exercised concerning the above interpretation. This is because there are properties of the visual distractors used in the current study and in the Cohen and Gordon–Salant one that may have helped older and younger adults to ignore the visual distractor (the irrelevant talker), while attending to the visual speech of the relevant talker. First, the visual speech from the distractor talker presented in both studies never needed to be attended as it was never relevant to the task, which could have made the distractor easier to ignore. Second, the distractor talker presented in both the current study and Cohen and Gordon-Salant (2017) was visually distinct from the target talker(s). That is, in both studies, there was a gender difference between target and distractor talkers (male vs. female) and the distractor video always appeared in the same location on the screen. If one or more visual properties of the visual distractor were consistent with the visual targets, particularly if the speech of the distractor could have potentially been a target (Lien et al., 2010), then older adults’ ability to ignore the distractor may have been impaired. Further studies are warranted to test the effect of visual distractors with the above-mentioned properties manipulated.
The effect of visual speech on response times in a speech comprehension in noise task has been rarely studied (c.f., Janse & Adank, 2012 that examined foreign accent adaptation). Thus, this study is one of the first to show a new type of visual speech benefit, i.e., for both older and younger adults, seeing a talker's face can significantly reduce response time for speech comprehension in noise in a task that requires the integration of a “call” and “response.” Response time has been used as a proxy measure for how different SNRs and hearing aid settings affect listening effort (the level of fatigue experienced by a listener due to the allocation of cognitive resources to a listening task, e.g., Meister et al., 2018; van den Tillaart-Haverkate et al., 2017). In this view, the current visual benefit in response time can be interpreted to indicate that the provision of visual speech helped make listening to speech in noise less effortful.
The analyses of hearing level and question-and-answer task performance (see Supplemental materials) indicated that higher frequency hearing sensitivity (in addition to low frequency sensitivity) has a role to play in older adults’ speech comprehension in noise, especially for AO environments. This finding is consistent with results from speech recognition tasks measuring accuracy and response time performance (e.g., Jesse & Janse, 2012) and suggests that the use of hearing aids or assistive listening devices to manage older adults’ higher frequency hearing loss has the potential to support speech comprehension in noise in real life (Brody et al., 2018; Cox et al., 2014). The regression analysis that jointly examined high frequency hearing level and LSPAN found that for correct response times, HFBEA hearing level interacted with LSPAN scores. That is, the correct response times of older adults who had high LSPAN scores were not influenced by their BEA hearing levels; whereas those of the older adults with lower LSPAN scores were (i.e., those with higher BEA scores took longer to respond). This result supports the idea that individuals with more cognitive capacity (higher LSPAN scores) are better able to cope with barriers that affect speech comprehension in noise (such as poor hearing sensitivity). This finding is consistent with the ease of language understanding model and framework for understanding effortful listening, both of which suggest that when speech perception is challenging due to noise and/or hearing loss, listeners engage additional cognitive processing resources (e.g., working memory) to successfully perceive speech (Pichora-Fuller et al., 2016; Rönnberg et al., 2019). Given the question-and-answer task's sensitivity to participant factors such as working memory capacity, future studies (with more power), could examine how task difficulty (e.g., hard question-answers) and participants' level of working memory may potentiate the effect of visual distraction on AV processing.
The current study was an attempt at incorporating some basic visual features of real-life communication (i.e., visual speech and a visual distractor) into a speech understanding task. Using an AV version of the question-and-answer Task, the results showed that older and younger adults were able to gain a visual speech benefit in the form of improved accuracy and reduced response time, and that this benefit persisted when a visual distractor was presented. Although the visual scene presented is arguably more ecologically valid than previous studies, it had some limitations in terms of capturing real-life listening scenes, e.g., where visual distractors can typically be heard (i.e., competing talkers) and potentially less easy to ignore. Furthermore, spatialized competing speech would be more typical of a realistic noise environment than the auditory noise used in the current study (speech-shaped noise) and may also be more distracting. Developing speech understanding tasks that include naturalistic auditory scenes and naturalistic visual scenes will be useful for expanding our understanding of older adults’ day-to-day communication difficulties and for predicting the real-world outcomes of hearing aids in realistic AV listening conditions. The challenge will be in incorporating the key aspects of real-world listening that affect speech related processing while maintaining experimental control.
Supplemental Material
sj-docx-1-tia-10.1177_23312165221145006 - Supplemental material for Visual Speech Improves Older and Younger Adults’ Response Time and Accuracy for Speech Comprehension in Noise
Supplemental material, sj-docx-1-tia-10.1177_23312165221145006 for Visual Speech Improves Older and Younger Adults’ Response Time and Accuracy for Speech Comprehension in Noise by Julie Beadle, Jeesun Kim and Chris Davis in Trends in Hearing
Footnotes
Acknowledgments
The first author acknowledges support from the HEARingCRC, the second and the corresponding authors support from the Australian Research Council (DP 200102188).
Author Note
The authors have obtained informed consent for publication of the images and/or recordings included in this research. Data are available on reasonable request.
Declaration of Conflicting Interests
The author(s) declared no potential conflicts of interest with respect to the research, authorship, and/or publication of this article.
Funding
The author(s) disclosed receipt of the following financial support for the research, authorship, and/or publication of this article: This study was funded by the MARCS Institute for Brain Behaviour, and Development and the HEARing CRC.
Supplemental Material
Supplemental material for this article is available online.
References
Supplementary Material
Please find the following supplemental material available below.
For Open Access articles published under a Creative Commons License, all supplemental material carries the same license as the article it is associated with.
For non-Open Access articles published, all supplemental material carries a non-exclusive license, and permission requests for re-use of supplemental material or any part of supplemental material shall be sent directly to the copyright owner as specified in the copyright notice associated with the article.