
Abstract
The discrepancy between the hearing aid benefit estimated in standard audiological tests, like speech audiometry, and the perceived benefit in daily life has led to interest in methods better reflecting real-world performance. In contrast to audiological tests, everyday communication commonly takes place in enclosed spaces with acoustic reflections and multiple sound sources, including sounds from adjoining rooms through open doors. This study investigates speech recognition thresholds (SRTs) with a sentence test in a laboratory environment resembling an average German living room with an adjacent kitchen. Additionally, acoustic simulations of the environment were presented in a large-scale (86) and small-scale (4) loudspeaker array, with the latter feasible for a clinical context. Measurements with normal-hearing and hearing-impaired listeners were conducted using different spatial target positions and a fixed masker position. One of the target positions was within the adjacent kitchen without line-of-sight to the sound source, representing a challenging acoustic configuration. Hearing-impaired listeners performed the measurements with and without their hearing aids. SRTs were compared between different presentation settings and to those measured in standard free-field audiological spatial configurations (S0N0, S0N90). An auditory model was employed for further analysis. Results show that SRTs in the simulated living room environment with 86 and 4 loudspeakers matched the real environment, even for aided listeners, indicating that virtual acoustics representations can reflect real-world listening performance. When signal-to-noise ratios were normalized, the measured hearing aid benefit did not differ significantly between the standard audiological spatial configuration S0N90 and any spatial configuration in the living room environment.
Introduction
Hearing loss and its compensation with hearing aids (HAs) is typically assessed in acoustically controlled laboratory settings, e.g., a near-anechoic listening booth and measurement conditions involving co-located or spatially separated target and masker. The compensation provided by HAs, referred to as the HA benefit, is the improvement in speech intelligibility (SI) and overall auditory performance compared to unaided listening. However, such laboratory tests show little relation to relevant real-life acoustic situations, which can be characterized by more complex room acoustics, different sound sources with varying spatial separation and masking signals and more complex auditory tasks. There is often a discrepancy between the HA benefit measured in clinical settings and the actual experiences of users in their everyday environments (e.g., Bentler, 2005; Cord et al., 2004; Cord et al., 2007; Wu, 2010), with clinical tests frequently overestimating real-world benefit. This discrepancy is attributed to different factors, including cognitive load and listening effort, as HAs improve audibility, but do not necessarily reduce listening effort or cognitive fatigue (Pichora-Fuller et al., 2016); individual factors influencing HA benefit, such as age, working memory and auditory training (Arehart et al., 2013); and an ecological validity gap, as clinical settings do not reflect the acoustic complexity of real-world environments. In response, it was proposed to increase the focus on developing test paradigms that better reflect everyday communication contexts (e.g., Keidser et al., 2020). These efforts involve enhancing the realism of tests and settings—such as adding visual information (Devesse et al., 2020), incorporating more realistic speech material (Miles et al., 2024), or designing tasks that simulate interactive conversations (Beechey et al., 2019). Additionally, creating test environments that are more comparable to real-world environments by transferring life-like listening environments to laboratory settings allows for a more accurate evaluation of HA performance under realistic conditions.
While field tests for SI in real-world environments can provide outcomes with higher ecological validity, they lack control over acoustic parameters. On the other hand, laboratory testing offers high reliability and sensitivity but may produce outcomes that are less transferable to real-life situations. Virtual acoustic environments present a potential solution for combining the advantages of both by enabling more realistic and complex controlled lab-based setups that replicate existing real-world environments and other realistic complex acoustic configurations, thereby enabling measurements that are consistent and offer generalizability to everyday acoustic situations (Patou, 2022; Serafin et al., 2023).
Most everyday acoustic situations take place in enclosed spaces, where sound is affected by reverberation. In these environments, discrete early reflections from different directions and diffuse late reverberation superimpose the direct sound. SI has been observed to be positively influenced by early reflections (Arweiler et al., 2007), while late reverberation has a detrimental effect through the reduction of fluctuations of the speech envelope (Bronkhorst, 2000; Houtgast et al., 1980). Moreover, “dip-listening” in the gaps of temporally fluctuating interferers, where an improved signal-to-noise ratio is observed (e.g., Collin & Lavandier, 2013), might be hampered in reverberant environments. To assess SI in a reverberant environment, the ratio of early-arriving speech sound energy to the late-arriving speech sound energy and background noise can be used, which is called the useful-to-detrimental ratio (Bradley, 1986). SI has been investigated in virtual acoustic environments representing various everyday settings, ranging from living rooms, cafeterias, and restaurants, an underground station, and a conference hall. Virtual sound environments have been validated by a comparison to the real room in different studies: Cubick and Dau (2016) auralized via a spherical array of 29 loudspeakers using ambisonics or the nearest loudspeaker method. A separate comparison between SI in a real room and SI in a virtual reproduction was conducted for a standard listening room (Ahrens et al., 2019). Hládek et al. (2021) compared SI between a headphone presentation based on binaural recordings of room impulse responses with a simulated presentation in a loudspeaker array. For speech reception thresholds (SRTs), reflecting the signal-to-noise ratio (SNR) at which the listener correctly identifies 50% of the words, Hládek et al. (2021) showed relatively small deviations between real and simulated environments, indicating that the simulation provides similar acoustic features. Cubick et al. (2016) measured slightly higher SRTs in the simulated environment, while Ahrens et al. (2019) reported lower SRTs in simulated conditions, but only when the target and masker were spatially separated. This discrepancy was attributed to inaccuracies in modeling early reflections, despite correctly reproduced reverberation time. Schütze et al. (2025) compared SI measures with normal hearing (NH) listeners between a real living room and virtual reproductions in different renderings. Moreover, Schütze et al. (2025) showed that in their moderately reverberant living room, most effects in NH listeners can be explained by long-term signal-to-noise ratio (SNR). For their most challenging condition with the target speaker in a connected room (and obstructed direct sound), a 3.5 dB increase of the SRT in comparison to a target position in the same room as the receiver can be attributed to the effects of room acoustics. It remains unclear what impact the connected room has on SI in hearing-impaired (HI) listeners.
Several studies have been conducted in echoic environments, specifically focusing on HI listeners. Oreinos and Buchholz (2016) measured SI with 18 HI listeners in three different acoustic environments: one real meeting room and two reproductions using a 41-channel loudspeaker arrays in an anechoic chamber: one based on room acoustic simulation, the other on microphone array recordings. They concluded that their acoustic environments can be used for testing directional HAs, but would have a lower sensitivity toward spatial aspects of the sound field compared to real environments, which could lead to an underestimation of the provided directional benefit. Mansour et al. (2022) investigated the impact of HA dynamic range compression on SI in simulated real-world acoustic configurations. They used a spatialized version of a speech-in-noise (SIN) test in a 32-channel loudspeaker-based acoustic environment resembling an office environment with spatially distributed target speech and background noise from either real-world sound scenarios or artificial speech-shaped noise (SSN). They compared unaided performance with results obtained using a basic HA simulator employing fast-acting dynamic range compression. The study found that SRTs were significantly higher in configurations with real-world background noise than with artificial SSN. Reasons for this are the higher complexity and variability as well as greater amplitude fluctuations for the real-world noises. Best et al. (2015) compared SRTs measured with aided and unaided HI listeners in a complex environment simulating a reverberant cafeteria with SRTs measured in a typical anechoic laboratory environment. In the anechoic environment, four loudspeakers presented multi-talker babble, while the target was presented from the front. In the complex environment, seven conversations with two interlocutors each were used as background noise. Here, a larger HA benefit was found, primarily because higher SNRs were presented during testing. Xia et al. (2018) assessed how speech reception is affected by reverberation and noise in both NH and HI individuals with HAs. Simulated acoustic scenes, including a large living room, were used to test different levels of reverberation and noise types. NH participant's SI measures were more robust to reverberation compared to those of the HI participants.
For the use of virtual acoustic environments in clinical settings, the minimum number of loudspeakers necessary for their reproduction is highly relevant, since big setups requiring anechoic rooms and large numbers of loudspeakers are not feasible for widespread use. To determine such a minimum number, different approaches have been made: Grimm et al. (2015) compared three spatial audio reproduction methods with discrete loudspeakers, vector base amplitude panning (VBAP), and higher-order ambisonics (HOA). The audio reproduction methods were tested in a simulated circular horizontal loudspeaker array with varying channel numbers (from 4 to 72), for which binaural and HA signals were generated using a database of head-related impulse responses. The performance measures of representative multi-microphone HA algorithm classes with spatially distributed microphones and a single-channel noise-reduction algorithm were analyzed. Performance differences between the reproduction methods were found. They concluded that at least eight loudspeakers are necessary in order to match the performance measure criteria for most of the tested configurations. Oreinos et al. (2013) used HOA for the reproduction of realistic acoustic environments, in which the benefit of HA beamforming was tested with respect to SNR improvement, directional algorithm performance and target frequency response. HOA was found not to degrade the SNR improvement, but it did impose a low-pass effect on the processed target, particularly above the system's cut-off frequency. Above this cut-off frequency, spatial aliasing occurs, leading to inaccuracies in the spatial reconstruction of the sound field. Seol et al. (2021) tested SIN with a small loudspeaker array with five loudspeakers, which they concluded being sufficient as results were comparable to those of earlier studies.
In summary, speech intelligibility in HI listeners and HA benefit have been assessed in a variety of acoustic environments and using SIN tests with frontal targets. However, no study to date has directly compared HA benefit in real environments, the simulated spatial conditions reproduced via loudspeakers, and in standard audiological conditions, with either co-located frontal (S0N0) or spatially separated frontal target and lateral masker (S0N90) in a sound-insulated listening booth. A transfer of this classic and widely used SIN paradigm into a realistic daily-life environment and comparison to the standard audiological condition could give further insight into the HA benefit mismatch between audiological tests and daily-life conditions and the ecological relevance of such measures.
This comparison is important as multiple authors (e.g., Bentler, 2005; Cord et al., 2007; Kiessling et al., 2003) have emphasized that current clinical assessments often fail to predict HA benefit in daily life. As Cord et al. recommended, “ways must be found to bring real-life conditions into the clinic.” Our study takes a step in this direction by testing whether a realistic spatial simulation using a loudspeaker array can approximate the HA benefit observed in everyday acoustic environments and whether either of these settings better reflects real-world hearing than current standard clinical paradigms.
For this, it is required to directly and systematically compare the HA benefit with aided and unaided measurements in the same listener groups in (i) a real daily-life environment with that in a clinically applicable loudspeaker reproduction of the same environment, and in (ii) the loudspeaker reproduction with that observed in the standard audiological S0N0 and S0N90 test conditions. Hereby, potential differences may arise from (a) the acoustics of the real environment including effects of reverberation in comparison to the audiological free field test in a sound-treated listening booth; (b) between the real environment and the loudspeaker reproduction of the according simulated environment. Moreover, (c) perceptual differences can be related to peripheral auditory factors or more central processing deficits.
Accordingly, the aim of the current study is to investigate if the standard laboratory tests accurately reflect how well HI listeners understand speech in an everyday listening situation without and with HAs by transferring the classical SI in noise paradigm into a real and a simulated, complex environment, resembling an average German living room (Schütze et al., 2021). SRTs were measured with the OLSA matrix sentence test (Wagener et al., 1999) for NH and three groups of HI listeners with different degrees of hearing loss, both aided and unaided. The measurements were conducted in a real living room laboratory and with virtual acoustics and loudspeaker reproduction of the living room scene using different loudspeaker arrays, and in two (free-field) standard spatial configurations, with a frontal target and either a co-located or a spatially separated masker. Only loudspeaker reproduction was used as opposed to headphone-based reproduction, in order to allow HI participants to use their own hearing aids. A stationary SSN masker was used for the standard spatial configurations, and a speech-like fluctuating masker was used for all measurements. The fluctuating masker contains temporal gaps that allow for increased SI, known as “dip-listening” (Collin & Lavandier, 2013), and is therefore more similar to everyday noise compared to SSN. Simulated acoustic renderings used both a large-scale and a clinically applicable small-scale loudspeaker array. SRTs were measured unaided and aided in HI groups with varying degrees of hearing impairment as well as NH for three different target positions in the living room environment, which differed in direction, distance, and acoustic characteristics.
To further investigate the contribution of peripheral auditory factors and central processing deficits to the observed SRTs, the binaural speech intelligibility model (BSIM; Beutelmann et al., 2010; Beutelmann & Brand, 2006) was applied and compared to the measurements. The assumption is that BSIM prediction reflects consequences of basic binaural auditory processing principles, while more complex cognitive components are not included in the model.
Taken together, the study aims to gain a deeper understanding of HA benefit evaluations in real and simulated room acoustics, as well as the relation to standard audiological test conditions.
Methods
Listeners
A total of 24 listeners participated in the study, distributed in four groups based on their audiometric test results. All participants received compensation on an hourly basis for their involvement in the study. All were native German speakers.
Six NH participants (five females, one male) within the age range of 18–31 years were recruited. Their pure-tone hearing thresholds were better than 20 dB HL at frequencies ranging from 125 to 8,000 Hz. One NH participant had prior experience with the matrix sentence test.
Six HI participants were recruited for each of the standard audiogram groups N2, N3, and S1 according to Bisgaard et al. (2010), corresponding to mild to moderate hearing loss. HI listeners had bilateral sensorineural hearing losses and hearing levels did not differ between the ears by more than 15 dB at any audiometric frequency (250–6,000 Hz), except for two HI listeners from each of the S1 and N3 group: In the S1 group, one listener had a difference of 40 dB and 25 dB at one frequency each and another listener had a difference of 30 dB at one frequency. In the N3 group, one listener had a difference of 20 dB at one frequency, and another listener had a difference of 25 dB at one frequency. The majority of HI participants had prior experience with the matrix sentence test.
For the N2 group, three females and three males, aged 56–74 (mean 66 years, std 6.1 years) participated, with a mean duration of HA use of 5.7 years. For the N3 group, two females and four males took part, aged 36–77 (mean 61 years, std 14.1), with a mean duration of HA use of 9.4 years. For the S1 audiogram group, one female and five males, aged 56–69 (mean 64 years, std 5.3), with a mean duration of HA use of 5.7 years, took part. The audiograms of the respective groups are shown in Figure 1.

Audiograms of the hearing-impaired listeners with the hearing loss classifications N2, N3, and S1 (from top to bottom). Group means for the right ear are shown in red, for the left ear in blue, together with the standard deviation. In gray, individual audiograms are shown. In pink, the standard audiograms according to Bisgaard et al. (2010) for the respective group is shown.
Based on an estimated standard deviation of 2.3 dB from previous data for target and masker at similar positions (Schütze et al., 2025) and a desired observable variability across groups of 1.5 dB, we calculated an effect size of f = 0.65 (G*power 3.1.9.7), resulting in a required total sample size of 24 participants (power 1-β = 0.8) for a repeated-measures ANOVA with four participant groups.
Acoustic Environment and Configurations
A typical living room environment (Schütze et al., 2021; van de Par et al., 2022) and its virtual acoustic reproductions (Schütze et al., 2023, 2025) were used in this study. The living room environment was built and designed as a lab environment at the University of Oldenburg to closely resemble a typical German living room with an adjacent smaller (kitchen) room, connected by a door. In the living room lab (LRL), there was a seating group, a sofa table, a carpet, and a TV on a TV board, as well as other furniture items. The flooring was laminate.
A floor plan of the LRL is shown in Figure 2. The living room had the dimensions 4.97 m × 3.78 m × 2.71 m (width × length × height), while the kitchen had the dimensions 4.97 m × 2.00 m × 2.71 m. The overall volume of both rooms, the living room and the kitchen is 77.85 m³. The reverberation time in the living room was 0.56 s (van de Par et al., 2022). For a more detailed specification of the room acoustic parameters, see Schütze et al. (2025).
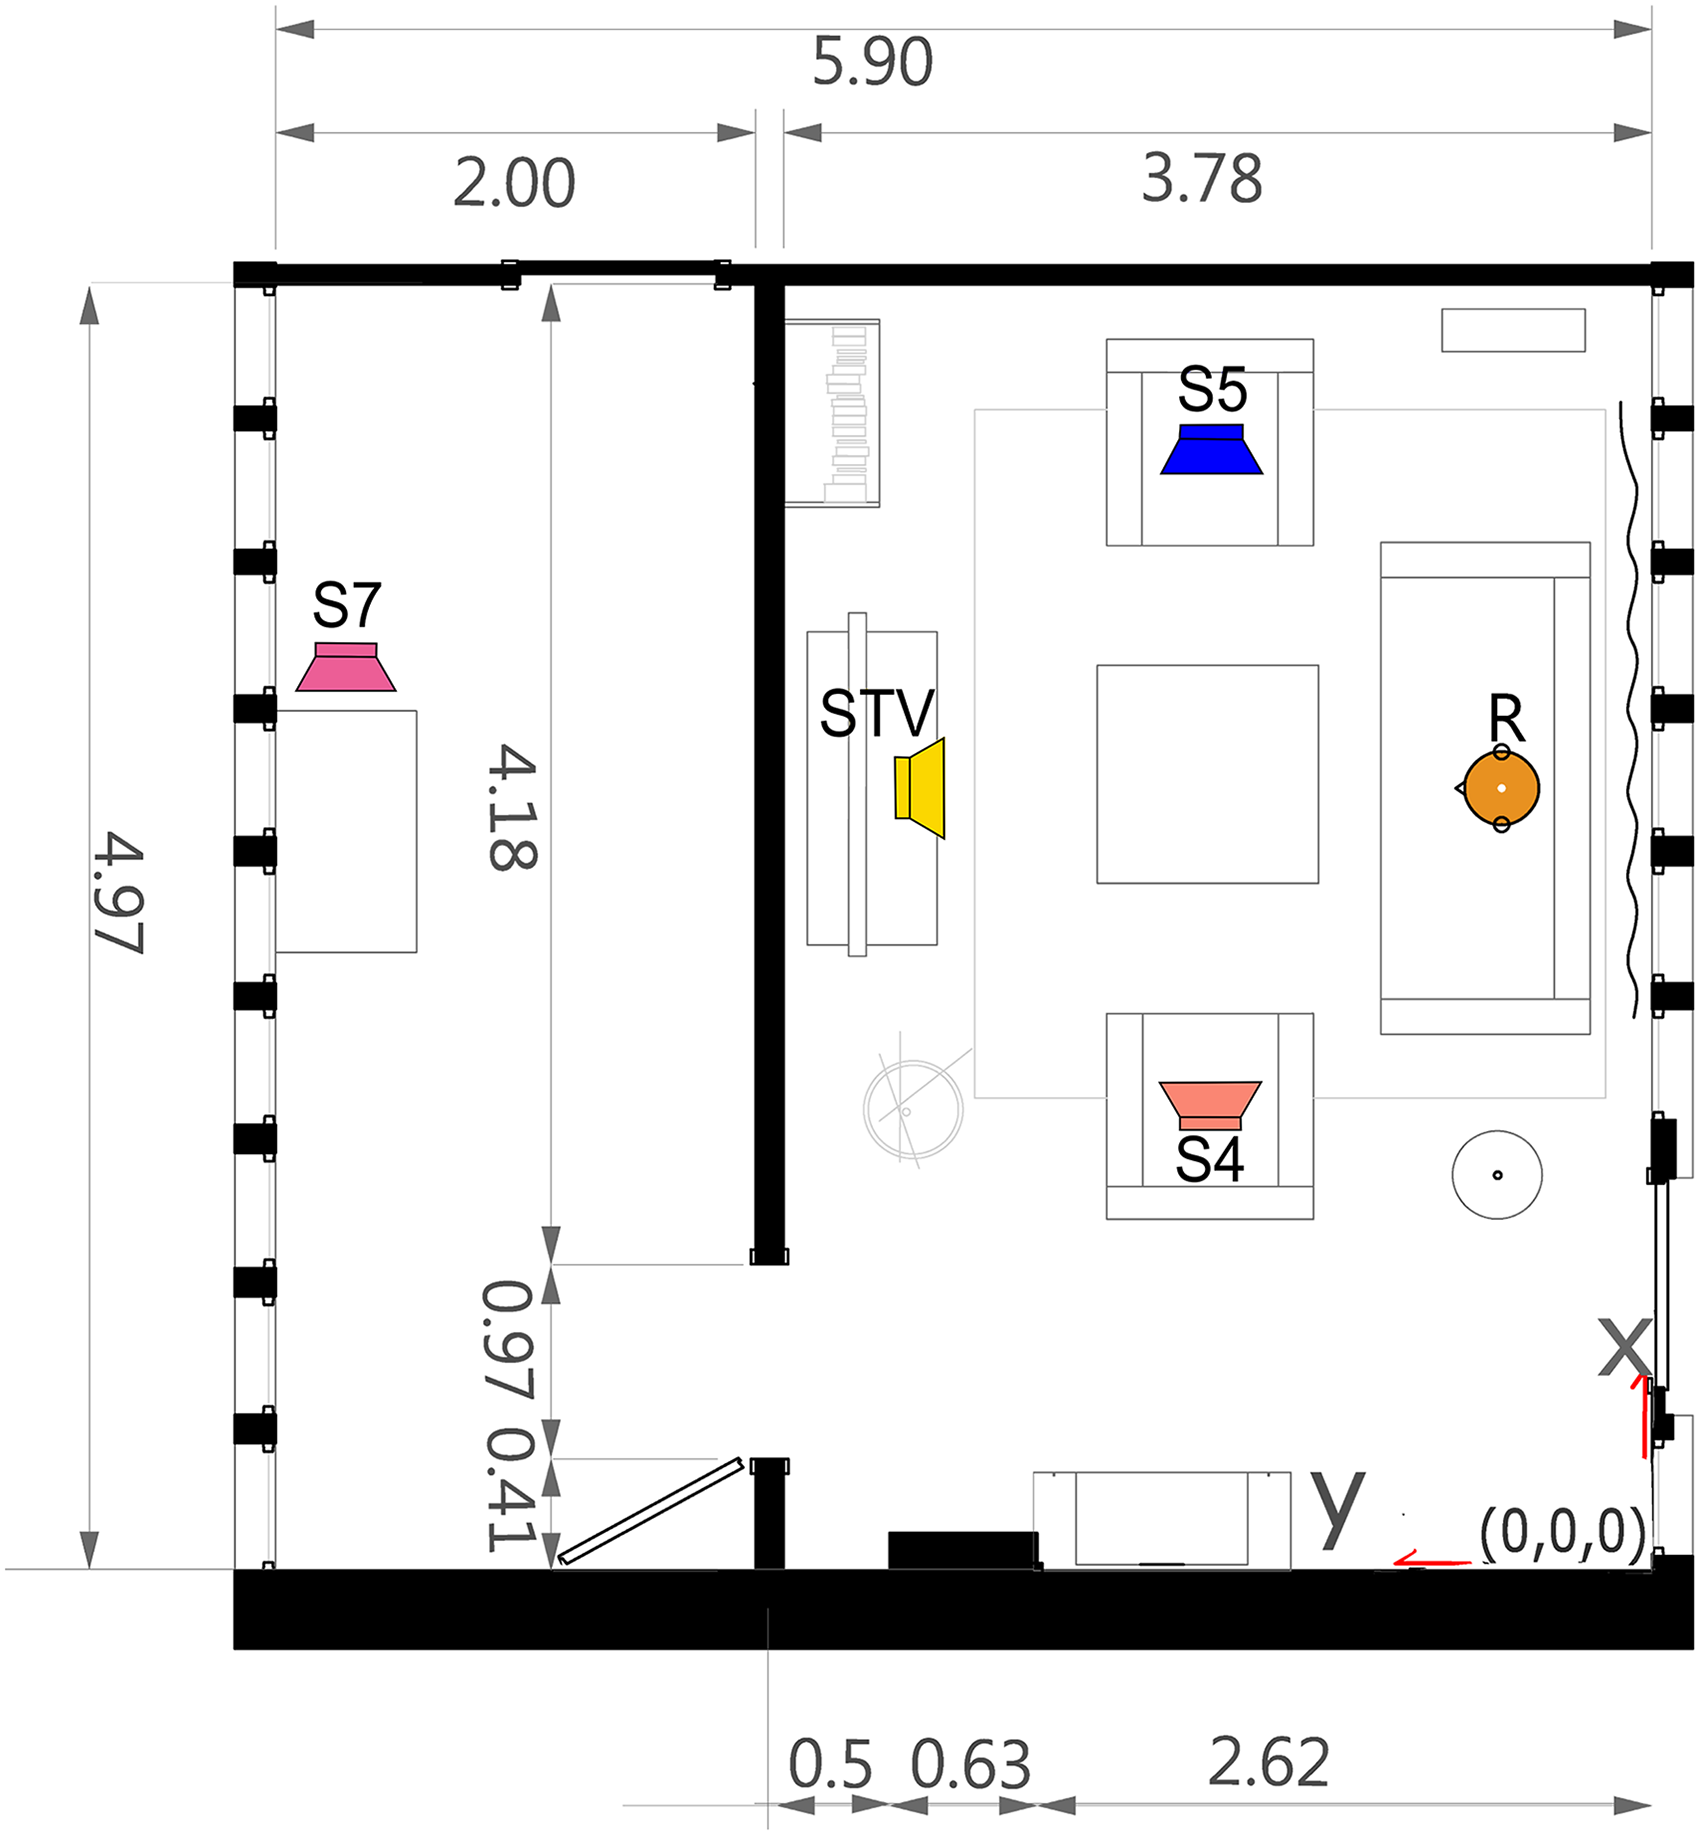
Floor plan of the living room lab at the University Oldenburg with indicated target STV (yellow loudspeaker), S4 (orange loudspeaker), S7 (pink loudspeaker), interferer S5 (blue loudspeaker), and receiver R (orange manikin) positions.
Genelec 8030 loudspeakers were placed at the respective positions in Figure 2 (see also Schütze et al., 2021; van de Par et al., 2022). The target and interferer positioned on the chairs were at a height of 1.02 m, while the targets STV and S7 were at a height of 1.10 m. For binaural room impulse response (BRIR) measurements and in the simulation, the receiver's ears were positioned at a height of 1.05 m.
Clinical evaluation of hearing performance with SIN tests typically uses spatial configurations with either a collocated presentation of target and masker (S0N0) or a spatially separated configuration, commonly with a separation angle of 90° (S0N90) (e.g., Wagner et al., 2020). For S0N0, one frontal loudspeaker was used in the listening booth, and for S0N90, the frontal loudspeaker and an additional lateral loudspeaker were used for the masker.
Apparatus and Procedure
SI was measured as 50% SRT with the OLSA matrix sentence test (Wagener et al., 1999) using the AFC framework (Ewert, 2013), to ensure comparability with other SRT50 studies (Best et al., 2015; Cubick & Dau, 2016; Hladek & Seeber, 2022 Schütze et al., 2025). The OLSA was presented as a closed test, where listeners were able to see the response alternatives and choose their response (i.e., identified words from a selection of a matrix of 10 × 5 words) on a touchscreen. The screen was placed in front of the listener, to provide the interface for the matrix sentence test. As interfering signals, either an interfering nonsense talker in the form of a male-transformed version (Schubotz et al., 2016) of the international speech test signal (ISTS; Holube et al., 2010), henceforth referred to as ISTSm, or a SSN matching the long-term spectrum of the target speech (OLnoise) were used. ISTSm had the same mean fundamental frequency as the target speech by a single male talker in the OLSA sentences and consists of intact continuous speech from six different talkers in six languages (Arabic, Chinese, English, French, German, and Spanish). The ISTSm signal had an overall duration of 54 s, from which randomly selected segments of 5 s length were extracted for the presentation of each matrix sentence. While the interferer level was fixed, the level of the target was varied depending on the number of correctly identified words during the OLSA.
Using a stationary interfering noise with the same spectrum as the sentences of the matrix sentence test, the target on position STV (see Figure 2) was calibrated to 65 dB SPL at the receiver position.
SI was compared between the real-world LRL and in two different acoustic reproductions (see Table 1). The “ground truth” setup in the LRL consisted of four loudspeakers (from which two were active during each measurement) at the positions STV, S7, S5, and S4 (see Figure 2). In the LRL, the listener was seated at the receiver position R on the sofa. The interferer had a fixed position at S5. The target signal was presented from one of three positions: in the coupled room without a direct line of sight (S7, pink loudspeaker symbol), from the left of the receiver on a chair (S4, orange loudspeaker symbol), and directly in front of the receiver (STV, yellow loudspeaker symbol). The second setup was a three-dimensional spherical 86-channel spherical loudspeaker array (Genelec 803° c/b) in an anechoic chamber, with 48 loudspeakers positioned on the horizontal ring (referred to as VR in the following). The loudspeakers are arranged in five rings at -60°, −30°, 0°, 30°, and 60° elevation and two additional loudspeakers below and above the center point. The radius of the horizontal loudspeaker ring is about 2.5 m. The third setup was a small-scale, horizontal 4-channel loudspeaker array (45°, 135°, 225°, 315°) with a radius of 1.0 m located in a listening booth (LB).
Overview of Presentation Settings.

Simulated loudspeaker renderings were obtained using the room acoustic simulator RAZR (version 0.963) (Kirsch et al., 2023; Wendt et al., 2014). Here, early reflections were calculated using an image source model, and the reverberant tail was generated by a feedback delay network. The simulation parameters were based on the room dimensions of the LRL and on the measured T30 in octave bands. Homogeneous boundary configurations were assumed within the respective rooms. VBAP was used for spatialization in the different loudspeaker arrays. 1 Participants were allowed to move their heads in all presentation settings.
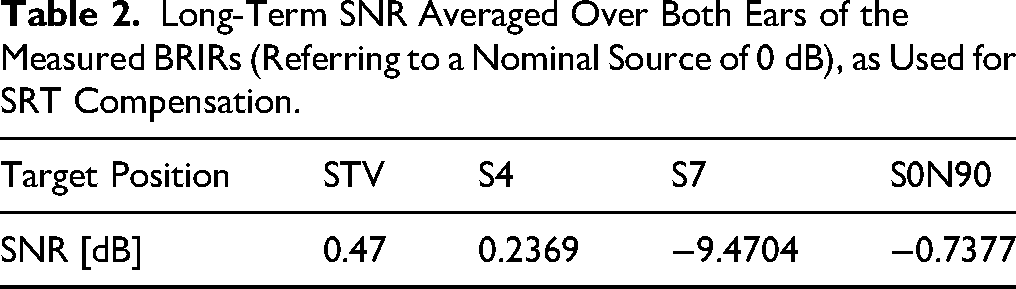
To make it easier to interpret the measured SRTs, distance-related level differences between the different (spatial) target positions (STV, S4, S7) were compensated with the mean SNR for both ears of the measured BRIRs (for the respective target and masker, see Table 2). With this separation of the effects of spatial configuration and other acoustic properties from the simple effect of distance attenuation of farther sound sources (especially for target S7, where no direct sound reaches the receiver) is possible. Thus, all distance-related level differences are disregarded in the results reported below, and remaining SRT differences can be solely attributed to spatial differences and other room-related effects. This compensation was applied to both the measured data as well as to the BSIM predictions.
Long-Term SNR Averaged Over Both Ears of the Measured BRIRs (Referring to a Nominal Source of 0 dB), as Used for SRT Compensation.
HI listeners used their own HAs during the aided part of the measurements. All HAs were of the behind-the-ear style, and listeners were instructed to select their most commonly used HA program. Also, participants were asked not to change the HA program during the measurement. Instead of attempting to standardize the gain or compression settings among participants, we chose to utilize the individual settings each listener was already accustomed to in daily life.
Binaural Speech Intelligibility Model
BSIM was employed here as a computational auditory model to predict binaural speech intelligibility in spatial listening situations. BSIM connects the speech intelligibility index (SII) with an equalization-cancellation (EC) model. The current application of BSIM integrates a time constant that accounts for “binaural sluggishness” (Hauth & Brand, 2018). The output of BSIM is a predicted SI score, which is expressed as an SRT and which quantifies the listeners' ability to recognize speech under the given binaural and acoustic conditions.
As an input parameter for individual predictions, BSIM received the individual audiograms. The individual SII parameter was adjusted so that predictions for S0N0 OLnoise matched the individual measurement result. This SII parameter was used for all other predictions, echoic and anechoic. For the three echoic measurement configurations, BSIM was calibrated to STV with OLnoise. As BSIM requires two ear signals as input, the following preprocessing was applied to the audio files: The four-channel loudspeaker renderings intended for use in the LB were spatialized to binaural signals using head-related impulse responses corresponding to the loudspeaker directions. For the anechoic measurements, the Cortex MK2-database (measurement set-up similar to Brinkmann et al. (2017)) was used to convolve target and masker. The input target positions were convolved with OLnoise, for the masker position, depending on masker kind, either ISTSm or OLnoise was used. For the anechoic standard spatial conditions S0N0 and S0N90, BSIM was calibrated to S0N0 with OLnoise.
Results
Effect of Spatial Configuration in Normal-Hearing Listeners
The left panels in Figure 3 show the measured mean SRTs for NH from the LRL and the renderings in the LB and the VR for each of the three target positions STV, S4, and S7. The bottom panel at the left side shows the anechoic configuration S0N0 and S0N90, which were measured in the LB with the two maskers OLnoise and ISTSm.

Speech recognition thresholds (SRTs) for normal hearing (NH) and the hearing-impaired unaided (HIu) listeners for different sound presentation settings and spatial configurations. The lower and upper boundaries of each box represent the 25th and 75th percentiles, respectively. The whiskers stretch to the outmost data points, excluding those identified as outliers. The outliers are shown as red plus symbol. The median is shown as red horizontal line in each box. Statistically significant differences between configurations are indicated through an asterisk and a dotted line between configurations. Horizontal dashed lines are drawn to aid comparison between panels. In each panel, the median NH SRTs are indicated as gray cross. In the first three rows from the top different targets STV, S4, S7 in the living room environment are shown for the living room laboratory (LRL) and the renderings in the listening booth (LB) and the virtual reality lab (VR). In the bottom row, SRTs are shown for the two standard spatial configurations (SSC) S0N0 and S0N90 with ISTSm and OLnoise (gray background) maskers. In the first column, the SRTs of the NH are shown.
Generally, a good agreement between the different presentation settings was observed. The mean SRTs for target position STV (yellow boxes) were in the range of −16.3 to −13.2 dB for all NH listeners, for target position S4 (orange boxes) were in the range of −15.5 to −15.4 dB, and for target position S7 (pink boxes) were in the range of −16.7 to −13.6 dB.
In the bottom left panel of Figure 3, results are shown for the anechoic configurations S0N0 and S0N90 (purple boxes), which were measured in the LB with OLnoise and ISTSm as indicated in the abscissae. Mean SRTs were highest for S0N0 OLnoise with −7.1 dB, and the lowest SRTs were observed for S0N90 ISTSm.
Compared to the echoic LRL configurations, the SRTs for measurements with ISTSm were lower, considering that the same masker signal was used, while with a different masker (OLnoise, grey background in Figure 3) were higher for the co-located configuration (S0N0) and similar to the echoic configurations for the spatially separated configuration (S0N90) with −24.8 dB.
Results of the two-way repeated measures ANOVAs for NH are shown in Table 3. Post hoc tests (Bonferroni corrected) revealed a significant difference at S7 between LRL and LB. The significant effects for spatial separation and masker, with no effect for the interaction, indicated that with the different maskers and spatial configurations, NH listeners were able to take advantage of dip-listening in the temporal gaps of the fluctuating ISTSm masker.
Two-way Repeated Measure ANOVAs for NH in the LRL and Anechoic Conditions.

Effect of Hearing Impairment
The SRTs for the HI listener groups are presented for the unaided and aided configurations. Results were analyzed for each of the three Bisgaard profile groups separately, as well as for all cumulated HI listeners.
Unaided
Figure 3 shows box plots of the SRTs for the tested configurations for HI unaided (HIu) listeners. The upper three rows show SRTs measured using ISTSm for the three target positions STV, S4 and S7 in the reverberant living room environment with the different presentation settings in LRL, LB and VR indicated in the abscissa of the respective panels. The columns correspond to cumulated results for all listeners and the separate Bisgaard profile groups. In each panel, the average SRT for the NH group for the respective measurement configuration are shown as faint grey crosses.
The mean SRTs for target position STV (yellow boxes) were in the range of −7.9 to −3.9 dB for all HI unaided listeners and for target position S4 (orange boxes) in the range of −6.0 to −5.4 dB, and for target position S7 (pink boxes) between −6.7 and −3.6 dB. Variability was smallest for N2 and largest for N3. Mean SRTs were increased considerably compared to the NH group, with a difference of up to 14.5 dB between the average SRT of NH vs N3 at target position S4 in the LRL.
In the bottom row, results are shown for the anechoic configurations S0N0 and S0N90 (purple boxes), which were measured in the LB with the two different maskers OLnoise and ISTSm as indicated in the abscissae. SRTs were highest for S0N0 OLnoise. The lowest SRTs were observed for S0N90 ISTSm. For N3, differences between configurations with ISTSm and OLnoise were smaller (0.4 Δ dB for S0N0 and 0.8 Δ dB for S0N90) compared to a difference of more than 10 Δ dB for the NH group. Compared to the echoic living room configurations, the SRTs measured with OLnoise were similar, considering that a different masker signal was used. However, the S0N90 ISTSm configuration was lower compared to the echoic living room configurations.
Results of the two-way repeated measures ANOVAs for HIu all, and unaided N2, N3, and S1 are shown in Table 4. Simple effects post hoc tests (Bonferroni) revealed significant differences for all HIU for the target positions STV and S7 between the LRL and the presentations in LB and VR. For N2, simple effects post hoc tests revealed significant differences for target STV between the LRL and both renderings and for target S7 between LRL and VR. For N3, simple effects post hoc tests revealed significant differences for target STV between LRL and VR and for target S7 between LRL and both presentation settings. And for the standard spatial conditions, simple effects for the standard spatial conditions showed significant effects between S0N0 ISTSm and S0N90 ISTSm (p = .0059) and S0N0 ISTSm and S0N90 OLnoise (p = .0029). For S1, simple effects post hoc tests revealed significant differences for target STV between LRL, LB, and VR and for target S7 between the LRL and VR (p = .0401). And for the standard spatial conditions, simple effects for the standard spatial conditions showed significant effects for all combinations but S0N0 ISTSm and S0N0 OLnoise.
Results of the Two-Way Repeated Measures ANOVAS for HIu all, N2, N3, and S1 unaided.

Aided
For the measurements with HI aided (HIa), Figure 4 shows the measured SRTs (from top to bottom) from the three presentation settings, in LRL, LB, and VR for each of the three target positions STV, S4, and S7. In the bottom row, the anechoic configurations S0N0 and S0N90 are shown. The left-most column shows the SRTs pooled across all three different groups, followed by the individual groups N2, N3, and S1 (from top to bottom). In each panel, the respective median results for the NH group are shown in the background as a grey cross.
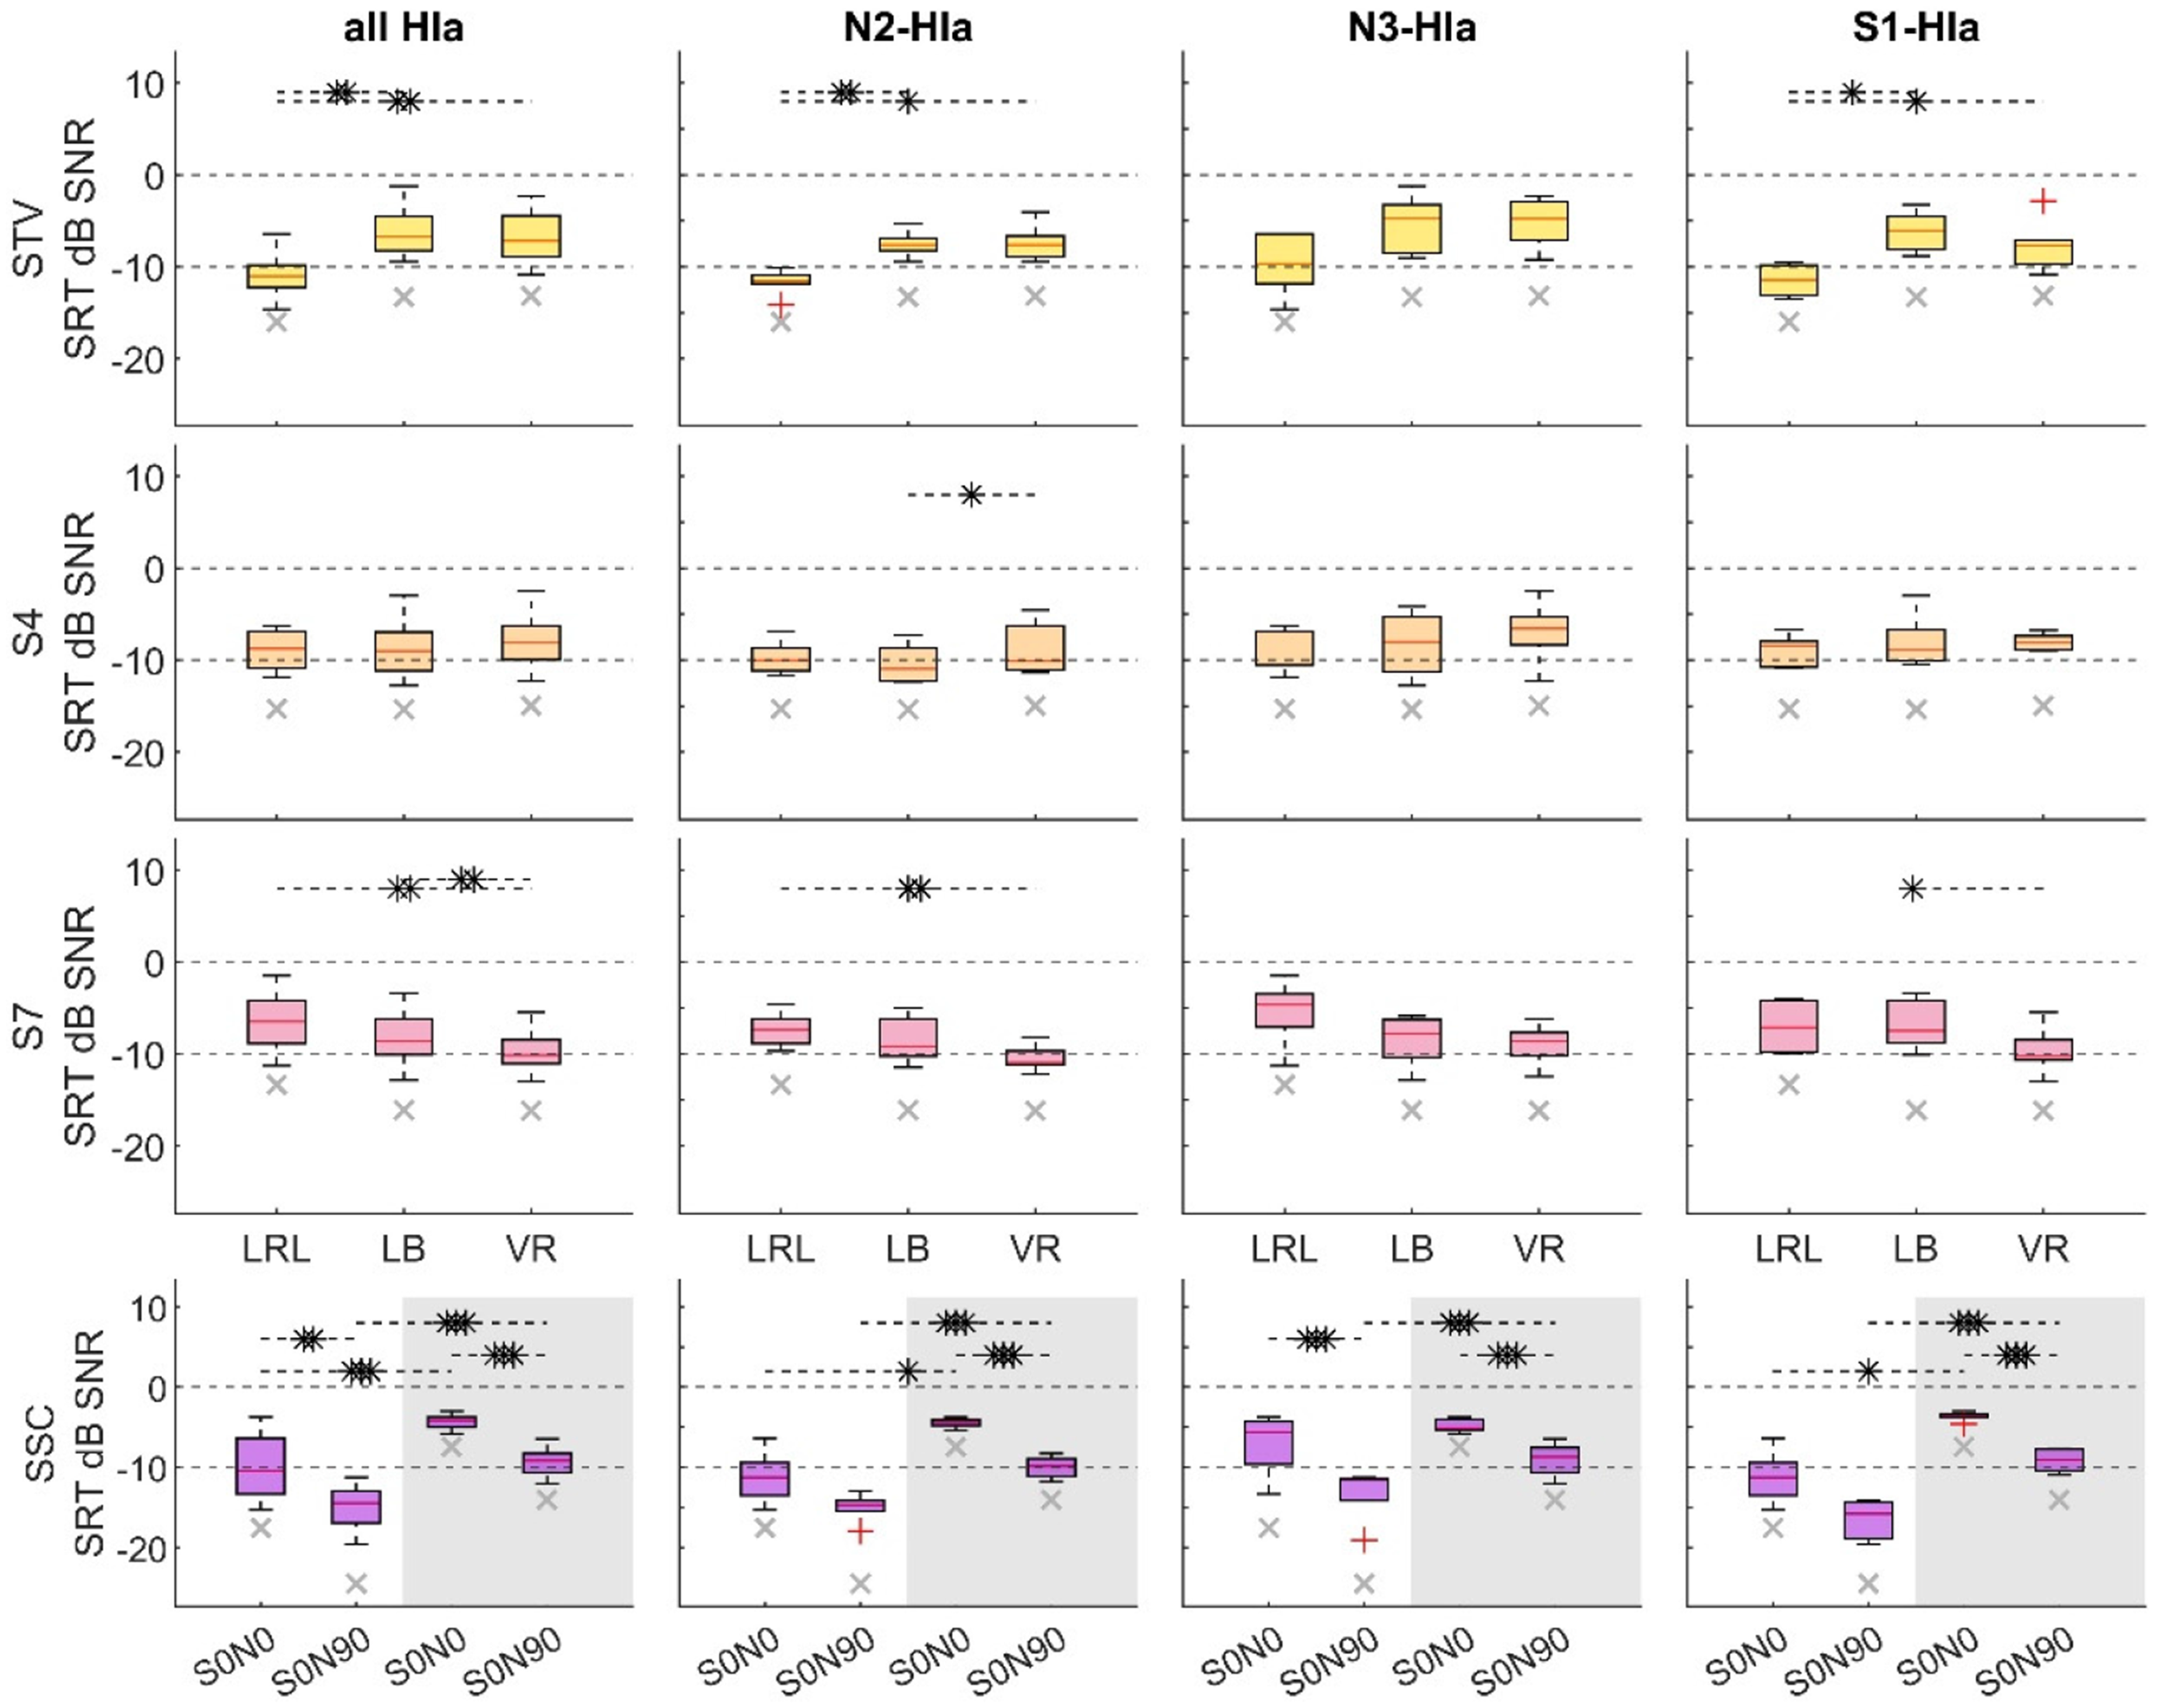
Speech recognition thresholds (SRTs) for the hearing-impaired aided (HIa) listeners. The box plots use the same style as in Figure 3. In each panel, the median of the SRTs measured for the normal hearing participants in that specific configuration is indicated by a gray cross. In the first three rows from the top, the different targets STV, S4, S7 in the living room environment are shown for the living room laboratory (LRL) and the renderings in the listening booth (LB) and the virtual reality lab (VR). In the bottom row SRTs are shown for the two standard spatial configurations S0N0 and S0N90 with ISTSm and OLnoise (gray background) maskers. SRTs of all hearing-impaired listeners are shown in the first column, while results for the different groups N2, N3, and S1 are shown consecutively from the second column.
Generally, similarities between the aided SRTs (Figure 4) to the unaided SRTs (Figure 3) can be observed. The mean SRTs for target position STV (yellow boxes) were in the range of −10.9 to −6.3 dB for all HIa listeners, for position S4 (orange boxes) in the range of −8.9 to −7.9 dB, and for position S7 (pink boxes) in the range of −9.7 to −6.6 dB. Similar to the unaided measurement, variability in the SRTs was smallest for N2 and largest for N3. Also, the aided SRTs were increased compared to the NH group, with a difference of up to 8.6 dB between the mean SRT of NH vs N3 at position S4 in VR.
In the bottom row, results are shown for the anechoic configurations S0N0 and S0N90 (purple boxes), which were measured in the LB with the maskers OLnoise and ISTSm as indicated in the abscissae. SRTs were highest for S0N0 OLnoise with a mean SRT of −4.3 dB for all HIa. The lowest SRTs were observed for S0N90 ISTSm with −14.8 dB for all HIa. For N3, differences between configurations with ISTSm and OLnoise were smaller compared to the other HIa groups. Comparing the echoic living room configurations to SSC configurations, the SRTs for S0N0 OLnoise were higher than those for the echoic living room configurations, while S0N90 ISTSm was lower, even though the ISTSm was also used in the living room configurations. Results of the two-way repeated measures ANOVAs for HIa all and aided N2, N3, and S1groups are shown in Table 5.
Results of the Two-Way Repeated Measures ANOVAS for HIa all, N2, N3, and S1 aided.

For all HIa, simple effects post hoc test showed significant effects for target STV between LRL and both renderings (LB and VR) and for target S7 between LRL and VR (p = .0014) and between LB and VR (p = .0026). For group N2, post hoc tests revealed significant differences for STV between LRL and LB (p = .009) and between LRL and VR (p = .026); for S4 between LB and VR (p = .004) and between LB and VR (p = .018); and for S7 between LRL and VR (p = .047). For group S1, post hoc comparisons revealed significant differences for STV between LRL and LB (p = .011) and for S7 between LB and VR (p = .034). For all HIa, simple effects post hoc tests showed significant effects between S0N0 ISTSm and S0N0 OLnoise (p < .001), S0N90 ISTSm and S0N90 OLnoise (p < .001), S0N0 ISTSm and S0N90 ISTSm (p < .001) and S0N0 OLnoise and S0N90 OLnoise (p < .001).
Hearing Aid Benefit
Figure 5 shows the means of the intra-individual benefit of HAs, defined as the difference in SRT between the measurement with and without HAs. In the first three rows from top to bottom the benefit for LRL, LB and VR are shown for each of the three target positions STV, S4, and S7. In the bottom row, the benefit for the anechoic configurations S0N0 and S0N90, which were measured with OLnoise and ISTSm are shown. The columns from left to right show the groups N2, N3, and S1.

HA benefit in speech recognition thresholds (SRTs) for the hearing-impaired aided listeners. In the rows from top to bottom, the benefits are shown for the target positions in the living room (STV, S4, and S7) for the living room laboratory (LRL) and the renderings in the listening booth (LB) and the virtual reality lab (VR). In the bottom row, SRTs are shown for the two standard spatial configurations S0N0 and S0N90 with ISTSm and OLnoise (gray background) maskers. Each column shows SRTs for the respective HI groups N2, N3, and S1.
Between the different presentation settings, generally the same benefit was observed. The HA benefits differed between groups, however within each group, the benefit matched over the different target positions.
For group N2 for target position STV, the benefits were in the range of 2.3 dB benefit to 1.1 dB benefit, for position S4 in the range of 2.5 dB benefit to 2.1 dB benefit and for target position S7 it ranged between 2.5 dB benefit and 0.5 dB benefit. For group N3, the benefit ranged between 7.2 and 4.9 dB over all target positions and presentation settings. For group S1 the benefit ranged between 1.1 and −0.6 dB over all target positions and presentation settings. Variability was smallest for S1.
In the bottom row, results are shown for the anechoic configurations S0N0 and S0N90. The lowest benefit was found for S0N0 OLnoise and highest for S0N90 ISTSm. Compared to the echoic living room configurations, the benefit measured with OLnoise was smaller. The benefit measured with ISTSm matched well with the benefit measured in the echoic living room configurations.
A two-way rmANOVA showed no significant differences between the benefits measured in the different living room renderings. No significant main effects of target position or presentation setting, nor a significant interaction, were observed in any of the three groups. A two-way rm ANOVA showed that neither the masker, measurement condition, nor interaction was significant for groups N2 and S1, while the main effects, but not the interaction, were significant for group N3. For N3, post hoc pairwise comparisons (Bonferroni) showed significant differences between conditions S0N0 and S0N90.
Results of the two-way repeated measures ANOVAs for the measured benefits of N2, N3, and S1 are shown in Table 6. Variations in HA benefit were evident across all HI groups, as participants used their personalized devices with non-uniform prescriptions.
Results of the Two-Way Repeated Measures ANOVAS for the Benefit of N2, N3, and S1.

For comparing the HA benefit between measurement configurations, paired-samples t-tests were run on the cumulative data from all three HI listener groups (see Table 7) with Bonferroni correction. Significant differences were only found for S0N0 OLnoise with STV, S4, and S7. These differences are related to the different maskers (OLnoise vs. ISTSm).
Aggregated p-Values Between Different HA Benefit Configurations From Bonferroni Corrected Paired-Samples t-Tests.

SRT Predictions Using BSIM
In Figure 6, measured SRTs are shown together with SRTs predicted by BSIM. Only data obtained in the LB were compared to BSIM, as the standard spatial configurations were measured exclusively in this setting (see Methods for details).

SRTs are shown for four listener groups—NH, N2, N3, and S1 (left to right columns)—with measured SRTs indicated by colored bars and BSIM-predicted SRTs by open bars. From top to bottom, results are shown for three different targets: STV (yellow), S4 (orange), and S7 (pink). The two bottom rows show SRTs for two standard spatial configurations, S0N0 and S0N90, using ISTSm and OLnoise (gray background). In each boxplot, the median is marked with a red line.
The predictions exhibit a slight trend of underestimating the SRTs, but generally match well with the measured results. For the echoic living room configurations, the agreement was best for the frontal target position STV with the lowest deviation for NH (1.2 dB) and the largest deviation for S1 (2.5 dB). The agreement was overall worst for target position S7 with a deviation of 8.4 dB for S1.
For the standard spatial conditions, BSIM predictions and the measured results matched well, except for an overestimation for S0N90 OLnoise. Here, the difference between measured and predicted SRTs ranged from 2.0 dB for N2 to 3.9 dB for S1.
A t-test revealed significant differences for S0N90 with OLnoise for NH and S1. In the echoic configurations, t-tests revealed significant overestimations for target S7 for N2 and S1, and an overestimation for target S4 for group S1. No significant differences were found for the N3 group.
Discussion
For the standard spatial conditions, the (fluctuating) ISTSm masker led to lower SRTs with a larger standard deviation compared to the SRTs obtained with the (stationary) OLnoise masker. This effect has also been shown by Holube et al. (2024), who reported SRTs for diotic OLnoise (mean NH: −7.5 dB SNR, HI: −5.1 dB SNR) and lower SRTs for diotic ISTS (mean NH: −20.9 dB SNR, HI: −12.0 dB SNR). For young NH listeners, Heeren et al. (2015) reported SRTs of −5.6 dB SNR for S0N0 in a 24-channel loudspeaker array, which match well with our NH results for S0N0 OLnoise of −5.3 dB SNR. Biberger and Ewert (2019) and Hu et al. (2018) measured SRTs with NH listeners with two ISTSm maskers in co-located anechoic conditions, which is in line with our result with one co-located masker for S0N0 ISTS. These comparisons with prior studies demonstrate that our results for the standard spatial conditions align within established findings, which is important, as such direct comparisons are not feasible for SRT measures in the LRL.
Speech Intelligibility in the Living Room Environment
Generally, SRTs for the different target positions in LRL (see Figure 3) tended to show only little differences when the level compensation was applied: The most challenging target position was S7, with occluded direct sound, where the average SRT for the NH in LRL was 1.9 dB higher compared to target position S4, and 2.7 dB higher compared to target position STV (STV: −16.3 dB, S4: −15.5 dB, S7: −13.6 dB). This is consistent with the HIu results, where the mean SRT for S7 is 2.4 dB higher compared to S4 and 4.3 dB higher compared to STV, and with the mean HIa, with the mean SRT for S7 being 2.3 dB higher compared to S4 and 4.6 dB higher compared to STV. With differences between SRTs for S7 and the other target positions being similar for HIu and HIa, the HAs did not seem to influence the effect of differences in the useful to detrimental ratio, which describes the ratio between beneficial direct sound energy and detrimental reflected or reverberant energy. In case of S7, the lack of direct sound and the dominance of reflected sound from the coupled room reduced the useful to detrimental ratio, resulting in higher SRTs.
In Schütze et al. (2025), SI with NH listeners was investigated in the same LRL as in this study. However, the masker position was S4, while S5 was one of the target positions, leading to a smaller spatial separation to the door direction, allowing for a coarse comparison only of target positions STV and S7 between studies. In their study, generally similar results (STV: −16.4 dB, S7: −12.9 dB) were measured. While the results match well for STV, the result for S7 differs 0.7 dB between both studies. This can be explained as follows: The door opening from which sound from S7 travels to the listener was located in a similar direction to the position S4, making spatial separation difficult for S7 with S4 as the masker.
Real Room and Simulation-Based Presentations
To enable participants to use their own HAs, only loudspeaker renderings were used as opposed to headphone-based presentations. A high agreement between SRTs in LB and VR was found, and when comparing SRTs for NH between LRL, LB, and VR a high agreement could be found. For target position S4 a deviation of 0.1 dB, and for S7 a deviation of up to 3.1 dB was found between LRL and VR. For target position STV, a small deviation was found between LB and VR of 0.4 dB, while a deviation of 3 dB was found between LRL and LB.
The difference between the simulation and real room might be related to the coarse shoebox-approximation of the room geometry for the acoustic simulation, which may have led to an inappropriate temporal fine structure of the onset of the simulated RIR for STV, where the loudspeaker in the real room was located relatively close to a wall and the flat screen television that was spaced about 30 cm away from the wall (and which is not included in the simulation). In conjunction with the reflecting glass surface of the coffee table (included in the simulation) and the strongly non-homogeneous absorption properties of the partly carpet-covered floor, a complex reflection pattern in the early part of the RIR could be observed (see van de Par et al. (2022), their Figure 5). These reflections in the real room were likely beneficial for SI. Additionally, in LB there was no frontal loudspeaker. Here, a fifth loudspeaker would have been beneficial for the acoustic presentation.
The number of five loudspeakers also coincides with the suggestions by Seol et al. (2021), who examined VR in SIN testing with HI participants, but is still lower than the eight loudspeakers recommended by Grimm et al. (2015) in their simulation study.
Observations Regarding the Maskers
For the anechoic standard spatial conditions, lower SRTs were observed for the fluctuating ISTSm masker compared to the stationary SSN OLnoise for all groups. This result was expected, as listening-in-the-dips is possible with the fluctuating masker, as opposed to the stationary SSN. This is in line with reports in the literature (Holube et al., 2010). Holube et al. reported an SRT of around −8.5 dB SNR for OLnoise and −21 dB SNR for ISTS (the original ISTS with longer temporal gaps) for young NH participants in a closed measurement with a diotic headphone-based presentation of the OLSA matrix sentence test. While the data of Holube et al. matches well to our NH data of −7.1 dB SNR for OLnoise, it differs for the ISTS configuration by 3 dB SNR with our results for ISTSm of −17.9 dB SNR. This difference can be explained by the larger temporal gaps in the original ISTS.
Free-Field Standard Configurations vs. Living Room Configurations
For the standard spatial conditions, stationary (OLnoise) and non-stationary (ISTSm) maskers were tested. For NH, the mean SRT for S0N0 and S0N90 with ISTS was more than 10 dB lower compared to the same respective configuration with OLnoise. Overall, it can be observed that co-located target and masker led to higher SRTs compared to a 90° separated target and masker condition in which spatial release from masking occurs (Biberger & Ewert, 2019; Cherry, 1953; Plomp, 1976). Listeners showed the best performance, indicated by the lowest SRT, for the spatially separated ISTSm maskers in the anechoic configuration.
The NH group reached lower SRTs for the anechoic configurations with ISTSm compared to OLnoise, this was also the case for N2 unaided, however, for N3 and S1 unaided, the STV LRL configuration was lower compared to the anechoic S0N0 ISTSm. For the aided configuration, ISTSm S0N90 was the least challenging configuration for all groups, while S7 was even more challenging compared to S0N0 OLnoise. In contrast to this, the HA benefit measured for the different configurations was highest for the anechoic OLnoise configurations. When measuring the benefit with standard spatial conditions and an SSN, this could result in an overestimation of the HA benefit compared to what listeners experience in real-life.
As the SRTs for standard spatial conditions with ISTSm are lower compared to the measured SRTs in the living room environment, our results are in line with those by Best et al. (2015): They compared standard anechoic measures (here defined as targets presented in an anechoic chamber from a frontal loudspeaker at 0°, with a multi-talker babble masker, consisting of four independent recordings of eight talkers speaking, which was presented from four loudspeakers at ± 45° and ± 135°) to a complex environment (large reverberant room with T30 = 0.5 s, simulating a kitchen and 12 tables with each six chairs, target position in frontal direction with maskers oriented around listener and target). They stated, that on average the unaided SRTs in the complex environment were higher compared to the standard measures, even though the masker used in the complex environment allowed more listening in the dips. In their study, the negative impact of reverberation and spatial complexity could have outweighed the benefits of the fluctuating masker—whereas in our study, the advantage of dip listening in the standard spatial condition with the fluctuating ISTSm masker led to lower SRTs compared to the living room environment. Best et al. argue that the higher SRTs could also be caused by reverberation and informational masking.
Effect of Reverberation on SI
The effect of reverberation could be observed through a difference of 1.9 dB in SRT (which has been normalized based on SNR) between the target positions of S4 and S7 for NH. While early reflections have a positive effect on SI (e.g., Arweiler et al., 2007), late reverberation is regarded as having a detrimental effect on SI as it reduces the fluctuations of the speech envelope (e.g., Biberger & Ewert, 2019; Houtgast et al., 1980). Due to a larger impact of reverberation and no direct sound, the threshold for the target position S7 was higher compared to S4. For the unaided HI, the SRT difference was 1.7 dB SNR for N2, 1.9 dB SNR for N3, and 3.6 dB SNR for S1, while the difference aided was larger for two groups (2.4 dB SNR for N2 and 2.8 dB SNR for N3) and lower for S1 (1.8 dB). Our data agree with Bronkhorst and Plomp (1990). They reported that the effect of reverberation on SI was the same on NH and HI listeners. They stated that all listeners, NH and HI, experienced a disadvantage due to the distortion of speech in reverberation. This is also in line with Duquesnoy and Plomp (1980) who reported equal relative losses, if tests were performed in reverberant configurations.
This shows that reverb is detrimental to speech intelligibility regardless of hearing status. This is an indication that room acoustic optimizations are also important for normal hearing individuals.
Hearing Aid Benefit
Concerning the HA benefit, the lowest benefit could be found in configuration S0N0 OLnoise. This is expected since any spatial signal processing by the HAs (e.g., directional microphones or beamformers) is not useful in this (co-located) measurement configuration. Better agreement between the S0N0/S0N90 and the LRL conditions is expected when the same masker is used, i.e., the ISTSm masker, as this ensures greater comparability.
While differences between the target positions were observable for the unaided and aided SRTs, this was not the case for the HA benefit. Across all target positions in the living room environment, the HA benefit showed little variance within each group—even for the target located in the coupled room. The maximum difference observed was 2.3 dB for group N3 between LB STV and LRL S4. When comparing the benefits between groups, as expected, the benefit for group N3, which was the group with the largest hearing loss and had longer average HA use, was higher than that for the two other groups. For group N3, the mean benefit was above 2 dB in all measurement configurations, indicating a successful fitting (Gemeinsamer Bundesausschuss, 2012). S1 was the group with the lowest average hearing loss, which also experienced the smallest benefit from HAs, ranging between −0.9 dB and 1 dB. Here, the mean benefit did not reach 2 dB in any of the measurements, except for S0N0 and S0N90 with the fluctuating ISTSm.
Negative benefits—as observed for some members of group S1—were also observed by Best et al. (2015). In contrast to our study, they measured larger HA benefits in the complex environment, while a wide range of benefits (including negative ones) were measured in both the complex simulated environment and the anechoic laboratory environment. Mealings et al. (2024) have investigated HA benefit in a study with listeners who had a PTA above 20 dB HL, but reported experiencing hearing impairment in everyday life, where these listeners also reported a benefit from HAs. With regard to group S1 this could mean, that even though no large benefit in SI measures could be reported, the listeners experienced a benefit through the devices in everyday life. This suggests a discrepancy between lab-based SIN tests and self-reported real-world experience. In our study, this could be seen in group S1, who showed no measurable SI improvement despite likely experiencing benefit in everyday communication involving broader contextual and cognitive factors.
Mansour et al. (2022) reported significantly higher improvements due to HA in configurations with real-world background noise compared to artificial SSN, which were linked to variations in the output SNR of the HA signal processing when comparing real-world environments to simulated configurations. Oreinos and Buchholz (2016) noticed a reduced estimated directional benefit in the model-based virtual scene environment, and further reduced by recording-based virtual scene environments.
In our study, benefit did not differ between real and simulated presentations.
When familiarized with the environment and the test method of the study in the LRL, several participants reported that the situation with target in the coupled room reflected a familiar domestic situation in which they often have difficulties. Nevertheless, t-tests between the standard spatial conditions and living room environment conditions have shown, that the measured benefit at any of the tested positions in the living room, including S7, is not statistically significant different from the standard spatial conditions, apart from S0N0 OLnoise conditions. Hence, the reported mismatch between HA benefit in standard audiological evaluation methods and the subjective benefit in everyday life (e.g., Cord et al., 2004) has not been observed for the tested scenarios in the (echoic) LRL in this study. The transfer of the classical SIN paradigm into a real life-like environment does not lead to results, which differ to SIN measures from standard audiological evaluation methods.
While statistically significant differences between SRTs at the different target positions in the more realistic measurement set-up were found, this was not the case for HA benefit. This indicates that neither a congruence between the acoustic and visual environment nor the room conditions that are present in typical homes (even when the line of sight to the target talker is interrupted) are particularly important for evaluating HA benefit. However, real conversations would involve face and lip movements, context and feedback, which might influence the SI for targets in the same room, but not in the coupled room. Perhaps, the here-used SIN test paradigm (matrix sentence test with spatially separated non-stationary masker/interferer) does not sufficiently represent everyday conversation situations, either due to the test paradigm itself, or due to the choice of interfering signal(s). The generalizability of SIN measures has been strongly questioned because of their focus on symbolic information, while they neglect cues, speaker dynamics and interactivity, which are necessary in real-world communication (Beechey, 2022) and miss the possibility of listeners actively reacting on the environment (Whitley et al., 2025). Timmer et al. (2015) stated, that commonly used clinical tests are able to classify and quantify hearing function, but that tests are needed that also test complex auditory function. They stated that subjective reports and such tests for complex auditory function could give more insight into an individual's hearing function.
Miles et al. (2024) compared an adaptive version of the everyday conversational sentences in Noise (ECO-SiN) to the commonly used Bramford et al. (1979) test with NH and HI listeners and concluded that SRTs for NH listeners were better for ECO-SiN, but for HI listeners ECO-SiN SRTs were poorer compared to the BKB sentences. Miles et al. named several potential reasons, faster speech tempo compared to BKB, limited advantage of SNR variations due to high frequency hearing loss, and speech characteristics as vowel space differences and durations. This aligns with the hypothesis, that the HA benefit mismatch may not be found simply by using more realistic environments, but rather that everyday conversations differ from matrix sentence tests like BKB or OLSA, resulting in other outcomes. Real-world communication involves interpreting speech and nonspeech cues (like gaze and gestures) which engages additional demands on neural processing than those typically engaged during standard SIN tasks, highlighting the increased cognitive load during active communication (Carlile and Keidser, 2020). Carlile and Keidser (2020) reported that brain activity differs significantly between individuals who passively listen and repeat speech and those who are actively emotionally engaged in social interactions. As such everyday conversations require cognitive resources and abilities, stronger differences between HI and NH could show, when conversational tasks are used.
Another potential reason the mismatch was not detected is that the used noise lacks key characteristics of real-world noise—such as temporal variability, and only one noise source instead of multiple overlapping noise sources was used, which limits the ability to generalize findings to everyday environments. Jorgensen and Wu (2023) quantified real-world noise using entropy in time- and frequency domains. They reported, that entropy significantly affects speech perception and that speech perception in the real-world was worse than in typical standard noise tests. Mansour et al. (2022) compared SI using the Danish Hearing In Noise Test with real-world background noise (a one-minute long spatial recording of a public lunch) and with artificial SSN (with the same long-term average spectrum of the public lunch recording), both presented at a broadband level of 75.5 dB SPL. They stated that SRTs with real-world background noise were significantly higher, indicating that a higher SNR was necessary in these conditions. This is generally in agreement with the results for the standard spatial conditions with SSN and ISTSm in the current study.
Another aspect is that the reported real-world benefit may not lead to a perceivable improvement in SI for the HA wearer if the changes are too small: Wu et al. (2019) compared subjective reports and laboratory measurements with basic and premium HAs and found that the advantages of the premium HAs observed in the lab did not translate well to the real world. The authors attributed this to SI improvements in the laboratory being smaller than the just-noticeable difference of SNR. This would imply that the HA benefit would have to be stronger than the just-noticeable difference of SNR, in order to see changes in the subjective report. In the laboratory it is possible to measure benefits, which are not subjectively perceived by the HA wearer.
Auditory Model-Based Analysis
Although BSIM is often used to predict SRTs of simplified anechoic conditions, the comparison between measured and predicted results can determine if the basic monaural and binaural auditory processing principles implemented by BSIM accurately reflects the performance of NH and HI listeners with varying degree of hearing loss in reverberant, everyday environments, or if additional factors (such as, e.g., a central, cognitive deterioration) have to be accounted for. In general, the predictions matched well with the measured results in anechoic and echoic configurations. Only few significant differences occurred that were either comparatively small (i.e., on average 1.3 dB for NH in S0N90 and N2 for condition S7) or showed a distinct underestimation of the effect of hearing loss on (binaural) SRT: For the group S1 it amounted to 3.2 dB for S0N90 OLnoise and to 3.6 dB for condition S7. It was unclear why larger differences between measured and predicted SRTs occurred for group S1, even though sloping hearing loss is known to produce larger prediction inaccuracies than more flat losses (e.g., Hülsmeier and Kollmeier, 2022; Wardenga et al., 2015). One possible reason may be related to the frequency weighting function (“band importance”) applied in BSIM which might have to be adapted to the specific participant group. While the current version of BSIM allows for such adjustments—aligned with the flexibility provided by the original SII standard to adapt band importance to the speech material—this was not the focus of the present study. Note that this SRT overestimation is consistent both for (quasi-) diotic conditions (S0N0 for ISTSm and S7 target) without a binaural processing benefit and for spatially separated conditions with such a benefit, i.e., S0N90 for OLnoise and S4 target). This is in line with the assumption that this SRT overestimation is rather due to a compromised (monaural and binaural) band weighting than to a specific binaural processing impairment. Nonetheless, an additional, specific cognitive effect cannot be ruled out for this subject group either.
BSIM proved useful in the context of virtual acoustics, as it allows differentiation between peripheral auditory factors, such as SNR improvements, and central processing deficits that may impact SI. Overall, the BSIM could predict results fairly well; however, it underestimated the effects of sloping hearing loss. This indicates that central cognitive factors and frequency-specific weighting need to be considered more strongly.
Conclusion
This study compared SI measures in a real room and two simulation-based renderings of the same room as well as co-located and spatially separated free-field conditions. NH and HI participants took part in the measurements, the latter aided and unaided. The measured SRTs with the different presentation settings showed a high degree of agreement for most spatial configurations. The largest deviations (3.1 dB for NH and less than 4.0 dB for HIu) occurred between the STV target position in the LRL and the STV target position in the LB. From the difference between aided and unaided SRTs, a HA benefit for the different measurement conditions could be determined. As might be expected, this HA benefit differed between HI groups. However, no difference in benefit was found between the different presentation settings (including simulation-based renderings) or target positions in the living room environment. With the currently tested hearing devices in standard settings, we found no discrepancy between the hearing aid benefit in the real listening condition and a clinical/laboratory condition as long as the participant's task is a simple sentence recognition test in both conditions.
The following conclusions can be drawn:
For recreating the SRTs observed in the (real) LRL, simulation-based presentation with four loudspeakers can be sufficient, however a fifth frontal loudspeaker would be beneficial, especially for the frontal target position STV. The three-dimensional 86-channel loudspeaker array did not increase the accuracy with which SRTs could be reproduced, regardless of whether listeners were NH, HIu, or even HIa. A five-channel loudspeaker array would be feasible for widespread use in, e.g., clinics for HA fitting with virtual acoustic environments. There are no statistically significant differences between the HA benefits observed in the real LRL and the two simulation-based renderings. This again hints toward small loudspeaker arrays being sufficient for evaluating HA performance using virtual acoustic environments. The observed HA benefits measured with fluctuating maskers were consistent between the here tested echoic configurations and standard (free-field) spatial conditions. This suggests that, in the tested setup, adapting the classical SIN paradigm to a more complex, mildly reverberant home environment does not necessarily lead to substantially different benefit estimates. However, this finding should not be taken as evidence that no mismatch exists in general, but rather that, under the controlled conditions used here—including a carefully prepared real room, its loudspeaker-based simulation, and the laboratory setup with matrix sentence test—HA benefit remained comparable across conditions. BSIM predictions match well with measurement results for both anechoic standard spatial conditions and echoic configurations. This indicates that most of the observed SRTs may be explained (and modelled) by basic monaural and binaural auditory signal processing principles without a major central (cognitive) impairment component. The only exception was observed for the participant group S1, who have a mild, steeply sloping hearing loss, where BSIM consistently underestimates the detrimental effect of hearing loss. For rehabilitative audiology purposes, the high experimental effort required to simulate a complex environment (e.g., a virtual living room using an 86-channel loudspeaker array in an anechoic room) does not appear to be justified. Even a simpler geometric loudspeaker arrangement (i.e., a four-channel loudspeaker array) provides similar effect sizes in terms of SRT improvement and HA benefit. Thus, the lab-to-real-life gap reported for HA evaluation may only be addressed by using more cognitively demanding tasks than the Matrix sentence test employed here.
Footnotes
Acknowledgments
The authors thank all participants who took part in the study. We would like to thank Thomas Biberger and Thomas Brand for their support with BSIM.
Ethical Considerations and Informed Consent Statement
The study was approved by the Ethics Committee of the University of Oldenburg. All participants provided written informed consent prior to their participation and were compensated on an hourly basis. Participation in the study was entirely voluntary.
Funding
The authors disclosed receipt of the following financial support for the research, authorship, and/or publication of this article: This work was funded by the Deutsche Forschungsgemeinschaft (DFG, German Research Foundation)—Projektnummer 352015383—SFB 1330 C4 and C5.
Declaration of Conflicting Interests
The authors declared no potential conflicts of interest with respect to the research, authorship, and/or publication of this article.