
Abstract
In October of 2022, the US Food and Drug Administration finalized regulations establishing the category of self-fitting over-the-counter (OTC) hearing aids, intended to reduce barriers to hearing aid adoption for individuals with self-perceived mild to moderate hearing loss. Since then a number of self-fitting OTC hearing aids have entered the market, and a small number of published studies have demonstrated the effectiveness of a self-fitted OTC intervention against a traditional clinician-fitted intervention. Given the variety of self-fitting approaches available, and the small number of studies demonstrating effectiveness, the goal of the present study was to evaluate the effectiveness of a commercially available self-fitting OTC hearing aid intervention against a clinician-fitted intervention. Consistent with previous studies, we found that the self-fitted intervention was not inferior to the clinician-fitted intervention for self-reported benefit and objective speech-in-noise outcomes. We found statistically significant improvements in self-fitted outcomes compared to clinician-fitted outcomes, though deviations from best audiological practices in our clinician-fitted intervention may have influenced our results. In addition to presenting our results, we discuss the state of evaluating the noninferiority of self-fitted interventions and offer some new perspectives.
Introduction
It has been estimated that around 13% of individuals (age ≥ 12) in the United States have hearing loss, and that most of these individuals could benefit from using a hearing aid (Lin et al., 2011; see also WHO, 2021). It is also estimated that only around 20% of individuals in the United States who could benefit from hearing aids actually use them (Chien & Lin, 2012). While a variety of reasons have been put forward to explain this service gap, two commonly identified barriers are access and affordability, with self-fitting hearing aids being identified as a priority for addressing these barriers (Donahue et al., 2010; National Academies of Sciences, Engineering and Medicine, 2016). In an attempt to remove these barriers, the US Food and Drug Administration (FDA) passed the Reauthorization Act of 2017, establishing the creation in principle of an over-the-counter (OTC) hearing aid category. Regulations for this new category were finalized and went into effect on October 17, 2022. Since then, a number of self-fitting OTC hearing aids have received FDA 510(k) clearance and entered the market. Since clinical performance testing demonstrating substantial equivalence (see Supplement) is typically required to receive 510(k) clearance, the fact that these devices have made it to market would suggest that self-fitting OTC hearing aids can be an effective amplification intervention for individuals with mild-to-moderate hearing loss. However, to our knowledge, there remain only a few published papers examining the effectiveness of the OTC delivery model against the clinician delivery model for hearing aids.
The effectiveness of an OTC delivery model was first examined by Humes et al. (2017). They found the OTC delivery model and the prescription delivery model to be similarly effective in terms of benefit, though they observed significantly lower satisfaction for the OTC model. Humes et al. (2019) replicated this main result having modified their participant screening process such that the objective audiometric screening validating “perceived” mild-to-moderate hearing loss was removed, this being done so that the group of participants would be more representative of those who may purchase a commercially available OTC hearing aid. The OTC delivery model used was one where participants self-selected a hearing aid for each ear from an available set of hearing aids with different preset gains (see also Urbanski et al., 2021).
Sabin et al. (2020) were the first to evaluate a self-fitting OTC technology designed for commercial use. This is also a foundational study in the space since it largely determined the key outcome measures and analyses used to demonstrate the noninferiority of a self-fitting OTC intervention against a standard clinician intervention for devices seeking FDA clearance. The key self-reported outcome they used was the Abbreviated Profile of Hearing Aid Benefit (APHAB) questionnaire (Cox & Alexander, 1995), and the key objective outcome was the Quick Speech-In-Noise (QuickSIN) test (Killion et al., 2004). For each fitting intervention (self-fitted and clinician-fitted), benefit scores were computed as the difference in raw outcome score relative to unaided (unaided - intervention). They found that the difference in APHAB global benefit between self-fitted and clinician-fitted interventions was not significant, nor was the difference in QuickSIN benefit, suggesting that these interventions were similarly effective.
De Sousa et al. (2023) evaluated the effectiveness of the Lexie Lumen self-fitting OTC device. They obtained APHAB and QuickSIN score outcomes from participants at three time points. At the baseline time point, they measured unaided outcomes, and for those assigned to the clinician-fitted intervention, a clinician fit was obtained, for those assigned to the self-fitted intervention, a self-fit was obtained. After a 2-week field use period, outcomes were obtained for each intervention. At this first follow-up, the audiologist conducted fine-tuning for participants in the clinician-fitted group upon request. Participants in the self-fitted group were informed that they could now contact remote support for troubleshooting or fit adjustment, which they had been unable to do previously. After another 4-week field use period, outcomes were once again obtained for each intervention. When considering differences in benefit between interventions, the authors rely primarily on effect sizes, reporting statistical significance only when the effect size of a particular difference was deemed clinically meaningful.
As discussed recently by Almufarrij et al. (2021), our understanding of the minimum clinically meaningful differences for hearing aid outcomes is lacking. Perhaps because of this, De Sousa et al. (2023) used standard effect size conventions, with Cohen's d interpreted as small (d ≤ 0.2), small-to-medium (d > 0.2 to d < 0.5), medium (d = 0.5), medium-to-large (d > 0.5 to d < 0.8), or large (d ≥ 0.8), and considered medium or larger effect sizes to be clinically meaningful. For APHAB global outcomes, the difference in benefit between interventions was found to be clinically meaningful at the 2-week follow-up (d = −0.5, self-fitted benefit better than clinician-fitted benefit), but not at the 6-week follow-up (d = −0.4), though this difference in benefit at 6-week follow-up might be considered marginally meaningful. For QuickSIN outcomes, the difference in benefit between interventions was not found to be clinically meaningful at either the 2-week (d = 0.1) or 6-week follow-up (d = 0.4). Though once again this latter difference in benefit might be considered marginally meaningful such that the degree to which clinician-fitted benefit is larger than self-fitted benefit is marginally meaningful at the 6-week follow-up.
In a follow-up study, De Sousa et al. (2024) obtained APHAB outcomes from a subset of the original participant population after 8 months of field use. Their analysis here seems to have been focused exclusively on raw APHAB scores, as opposed to APHAB benefit (unaided - intervention) scores. Like Sabin et al. (2020), De Sousa et al. (2023) used a between-groups design, where they found no clinically meaningful differences in unaided APHAB scores between the self-fitted and clinician-fitted groups. Presumably on this basis, De Sousa et al. (2024) chose not to report APHAB benefit scores. Instead, comparing raw APHAB global scores across self-fitted and clinician-fitted interventions, they did not find clinically meaningful differences at the 8-month follow-up (see also, Sheng et al., 2024). In another related study, Knoetze et al. (2024) compared the effectiveness of two different Lexie self-fitting OTC devices (B2 and B2 Plus). They did not observe clinically meaningful differences in APHAB benefit (unaided - intervention) between the two self-fitting hearing aid models, which employ different self-fitting strategies.
Evaluating the effectiveness of an anonymous OTC device, Yellamsetty and Lewis (2024) used a within-subjects crossover design and found no significant differences in QuickSIN or APHAB outcomes between self-fitted and clinician-fitted interventions. Comparing the effectiveness of a self-fitting strategy (in situ hearing test to obtain initial fit followed by access to post-fit adjustments) against a preset strategy (a single preset program) for an anonymous Bluetooth earbud device, Chang and Lo (2024) did not observe a significant difference in objective speech-in-noise outcomes using the Mandarin Hearing in Noise Test (MHINT) when target and masker were colocated, though they observed a significant difference (self-fitted better than preset) when target and masker where spatially separated (see also Helfer et al., 2022). Since self-fitting users were allowed to adjust noise reduction and microphone directionality on their devices, while preset users did not (and had their program set to omni-directional), it is possible that the observed difference in the spatially separated MHINT condition across intervention types could be attributed to non-gain settings on the device. The authors also found a significant difference (self-fitted better than preset) in self-reported outcomes using a custom questionnaire assessing speech quality in the presence of simulated noise.
The available literature evaluating the effectiveness of the self-fitting OTC delivery model against a prescription delivery model suggests that OTC interventions provide a similar benefit to prescription interventions by a clinician. The present study evaluated the effectiveness of a commercially available self-fitting OTC device, the Concha Sol, which employs a novel self-fitting strategy based on paired preference comparisons (see Methods: Self-fitting Session). Using a within-subjects crossover design, the hypothesis was that self-reported benefit assessed with the APHAB questionnaire and objective speech-in-noise benefit assessed with the QuickSIN test for the self-fitted intervention would not be inferior to the clinician-fitted intervention.
Methods
Outcome Measures
Self-reported and objective outcome measures were obtained in three conditions for each participant: unaided, clinician-fitted, and self-fitted. By comparing outcome measures obtained for a particular fit intervention (clinician-fitted or self-fitted) against those obtained in the unaided condition, we can determine whether or not the intervention was effective relative to no intervention. By comparing the clinician-fitted intervention against the self-fitted intervention, we can determine whether or not one intervention was more effective than the other.
The APHAB (Cox & Alexander, 1995) is a 24-item questionnaire designed to assess hearing aid benefit. The APHAB is composed of four subscales: Ease of Communication (EC), Reverberation (RV), Background Noise (BN), and Aversiveness (AV). Each subscale is composed of six questions, and for each question, participants indicate the extent to which they agree with a statement on a 7-point response scale. Participants completed the APHAB questionnaire electronically.
The QuickSIN (Killion et al., 2004) is an objective listening test designed to assess intelligibility of speech in noise. QuickSIN scores are typically reported in units of signal-to-noise ratio (SNR) loss, which refers to the difference between the SNR required to understand speech in noise for a hearing-impaired individual relative to the SNR required by the average normal-hearing listener. While individual QuickSIN scores are obtained for single-sentence lists, QuickSIN scores are typically reported as an average over multiple-sentence lists. To obtain a QuickSIN score, the participant was seated in the sound booth with a loudspeaker oriented at 0° azimuth at a distance of 1.5 meters. Both the target speech and the noise masker (four-talker babble) were presented from the loudspeaker, with the target speech being presented at a fixed level of 70 dB(A) SPL. For each sentence list, six different sentences were presented, with the presentation level of the colocated noise increasing in 5 dB SNR increments (starting from 25 dB SNR and ending at 0 dB SNR) for each successive sentence. For each sentence, participants were instructed to verbally repeat the sentence that they heard, while the audiologist monitored and scored (number of keywords correctly identified) their verbal responses. Each participant completed two sentence lists, and their QuickSIN score was computed as the average SNR loss between the two sentence lists.
Study Design
A within-subject crossover study design was used, in which participants were randomly assigned to one of two study arms: AB and BA. Each participant completed a single clinician-fitting session and a single self-fitting session. Outcome measures for each fit were obtained following a 2-week field-use period. As depicted in Figure 1, in visit 1, eligible participants completed APHAB and QuickSIN outcome measures in the baseline condition where no amplification was provided (unaided). They were then alternately assigned to study arm AB (clinician-fitting followed by self-fitting) or study arm BA (self-fitting followed by clinician-fitting). After random assignment to a study arm, participants completed their first fitting session. In the intervening 2-week field-use period between visit 1 and visit 2, participants were instructed to wear their hearing aids. Besides a volume control rocker on the hearing aid itself, no adjustments to hearing aid parameters were made available to participants during this field-use period. Participants returned to the lab for visit 2, where at the outset APHAB and QuickSIN outcome measures were obtained for the fit received during visit 1. Participants then completed their second fitting session, following the AB/BA crossover design and study arm assignment they had received. In the intervening 2-week field-use period between visit 2 and visit 3, participants were once again instructed to wear their hearing aids. During this field use period, participants in both study arms were only able to adjust the volume on their hearing aids. Following their second 2-week field use period, participants returned to the lab for visit 3, where APHAB and QuickSIN outcome measures were obtained for the fit received during visit 2.

(Study Design) After enrollment, participants underwent a pre-study evaluation where eligibility was determined. Eligible participants were administered Abbreviated Profile of Hearing Aid Benefit (APHAB) and Quick Speech-In-Noise (QuickSIN) outcome measures in the unaided control condition and were randomly assigned (alternating) to study arm AB or study arm BA. At the end of visit 1, participants in study arm AB completed the clinician-fitting session, while participants in study arm BA completed the self-fitting session. At the start of visit 2, APHAB and QuickSIN outcomes were measured for the fit obtained during visit 1. Participants in study arm AB then completed the self-fitting session, while participants in study arm BA completed the clinician-fitting session. During visit 3, APHAB and QuickSIN outcomes were measured for the fit obtained during visit 2.
Participants
Two clinical sites were involved in the data collection: (1) University of Minnesota, Minneapolis, MN (UMN) and (2) San Jose State University, San Jose, CA (SJSU). Research participants at each clinical site were recruited through clinic referrals and through local advertisements. All procedures were reviewed and approved by the Institutional Review Boards at each clinical site. After being informed of the study procedures, each potential participant signed an informed consent form.
Potential participants then completed a pre-study evaluation, conducted by a research audiologist. This evaluation began with a questionnaire assessing their hearing history, including previous hearing aid use. This was followed by an audiological assessment. After an otoscopic evaluation, tympanograms and ipsilateral acoustic reflexes were obtained to ensure that each participant had normal middle ear function. Pure-tone air-conduction thresholds were obtained. The clinician conducting the pre-study evaluation then determined eligibility using the following key inclusion criteria: must be at least 18 years of age, must be able to understand spoken and written English, must have mild-to-moderate hearing loss (at least one threshold greater than 20 dB HL and thresholds at 0.5, 1, 2, and 4 kHz less than or equal to 55, 65, 70, and 80 dB HL, respectively) in both ears, and must have normal middle ear function. Participants were also excluded if they experienced dizziness/vertigo, if they had a history of chronic middle or outer ear disease, if they had a significant cerumen impaction, or if they had a sudden worsening of hearing loss in the last 6 months. A total of 36 participants were recruited across both sites. A total of 23 participants across both sites passed the pre-study evaluation and were enrolled. Of these, a total of 21 participants successfully completed the study (13 participants from UMN, 8 participants from SJSU). Given this relatively small sample size compared to previously published studies evaluating OTC effectiveness, even when considering the within-subjects design employed here, it may be fair to consider this a pilot study. Important summary statistics for these 21 participants are shown in Table 1. Summary statistics for pure-tone averages (PTAs) were computed on pooled PTAs across all ears. Audiograms from these participants are shown in Figure 2.

Pure-tone audiometric thresholds for all participants (n = 21). Individual left-ear audiograms are shown in blue, and individual right-ear audiograms are shown in red. The average audiogram over all ears is shown as a solid black line, where error bars represent standard deviation.
Participant Characteristics.
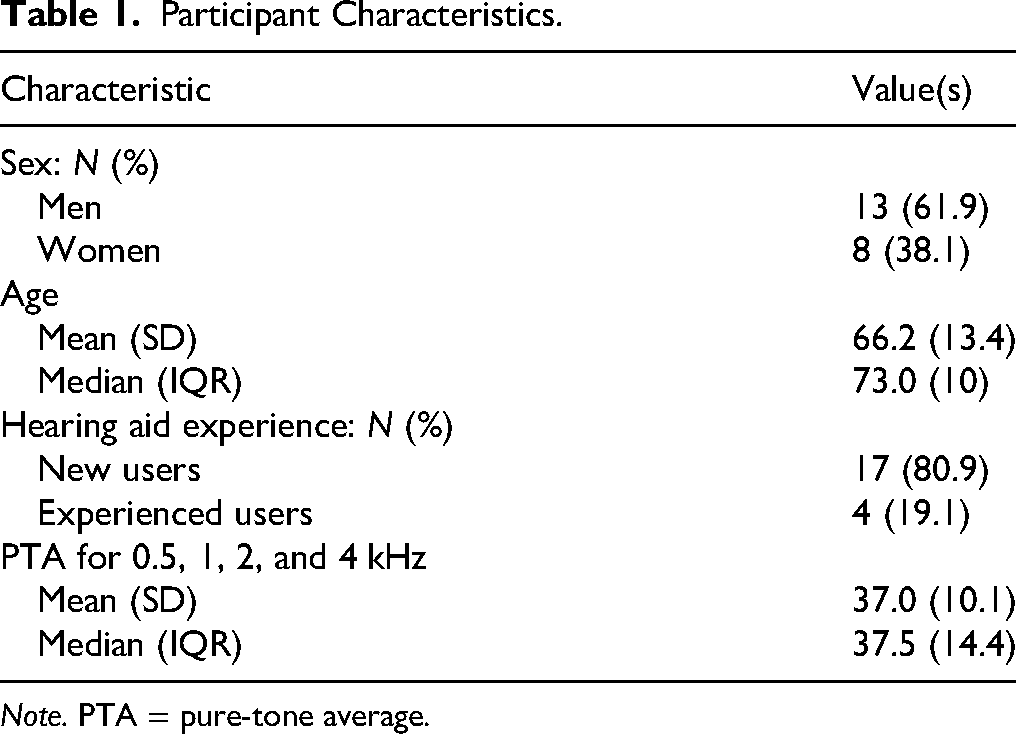
Note. PTA = pure-tone average.
Physical Device Fitting
For each participant, at the start of their first fitting session (clinician-fitting or self-fitting), the audiologist determined the appropriate receiver length and open-dome size. This physical fitting was only done once for each participant, with the same physically fit devices being used in each of their two fitting sessions.
Clinician-Fitting Session
Participants were fitted bilaterally with Concha Sol hearing aids by a research audiologist in a professional double-walled sound-attenuating booth with hearing aid fitting equipment. Concha Sol hearing aids are FDA-approved, receiver-in-canal digital hearing aids with 16 wide-dynamic range compression (WDRC) channels. Since Concha Sol hearing aids are manufactured by a third-party company, to perform the clinician fit the audiologist used the fitting software provided by this device manufacturer. Using this fitting software, the audiologist was instructed to generate prescription targets from the participant's audiogram by selecting the Comfort Logix fitting rationale, designed by the manufacturer to be optimized for their hearing aids (NAL-NL2 was not made available to us through the manufacturer's fitting software). They were also instructed to select the Sound Zoom (static directional) microphone setting. Real-ear verification was not performed, though audiologists were instructed to manually adjust the WDRC parameters (gain and compression) if participants expressed immediate sound quality complaints. Audiologists were instructed not to modify the feedback cancellation or noise reduction settings, ensuring that these settings were the same between self-fits and clinician-fits. Audiologists were also instructed to disable the automatic scene detection feature, which detects a configurable number of different acoustic scenes and automatically switches to different preset fits corresponding to the detected scene. This feature was also disabled in the self-fitted session, so as above, this was done to ensure that aside from gain parameters, clinician-fit and self-fit parameters/functionality were equivalent. Upon completion of the fitting procedure, the fit was saved to the hearing aids. During their field-use period, participants could adjust the volume of their devices using a physical rocker switch.
Self-Fitting Session
At the start of the self-fitting session, the participant's hearing aids were paired with the Concha Labs mobile app installed on an iPhone 14 (the same iPhone was used for each participant at a given site). The participant was directed to the Soundscope tab in the Concha Labs app, where they were able to generate a self-fitted gain profile. After directing the participant to the Soundscope tab, the audiologist left the booth and the participant followed the instructions in the app. Upon obtaining a bilateral fit through completing the self-fitting process, the participant exited the booth and returned the iPhone to the research audiologist. During their field-use period, participants could adjust the volume of their devices using a physical rocker switch.
Self-Fitting Approach
The Concha Labs app contains a self-fitting feature called Soundscope. When this feature is selected, users can create a sound “profile” by answering a series of questions, where “profile” refers to a set of amplification parameters. Users are prompted to create a profile for each ear, and when a left and right profile are obtained, they are linked under a single profile name, selectable from the profile menu. To obtain a profile for a particular ear, users begin by listening to a series of narrow-band noises, delivered through the hearing aid receiver, and adjusting a slider until the sound is just audible. The bandwidth of these narrow-band noises was narrow enough to roughly follow the “standard” bandwidth curve reported by Walker et al. (1984). Users are then asked to listen to synthesized female speech stimuli being played from the loudspeakers on their mobile phones while different A/B pairs of sound profiles alternate on their hearing aids. After listening to each A/B comparison, users must make a selection from four available choices: “A is clearer,” “B is clearer,” “Both are clear,” “Neither are clear.” Gain targets are adjusted in response to user preference following a proprietary decision tree logic, and gain parameters are written to the device following a proprietary fitting rationale. While the exact number of preference selections is not fixed, around 10 preference selections are typical to complete this decision tree, and it is not possible to exceed twenty selections. When Soundscope has been completed for each ear, the user can balance the overall gain in each ear if they feel there is an overall loudness asymmetry.
Results
Comparison of Gain Targets
Following Sabin et al. (2020), we computed the four-frequency (0.5, 1, 2, and 4 kHz) average (4FA) hearing loss for each participant, along with the 4FA gain “targets” obtained in the clinician-fitted and self-fitted interventions. Gain “targets” are operationally defined here as the digital gain values read directly from the hearing aid firmware, rather than from a fitting software display, and do not reflect any coupler or real-ear corrections. To obtain 4FA gain targets from these nonlinear fits, we calculated the frequency-dependent gain targets for a 60 dB speech input (Moore et al., 2008) and obtained the 4FA from these gain targets, separately for each ear. When computing 4FA gain targets, negative gain was treated as zero gain. This was done to prevent negative gains from disproportionately influencing the average, since negative gains are not as salient as positive gains. In Figure 3, we see that while correlations between average hearing loss and average gain targets from both clinician-fitted and self-fitted interventions are similarly high, there are notable differences in the relationship between hearing loss and average gain targets for the two interventions. Specifically, we see that at milder hearing losses, self-fitted average gain targets tend to be lower than their clinician-fitted counterparts, while at more moderate hearing losses, average gain targets tend to be similar.
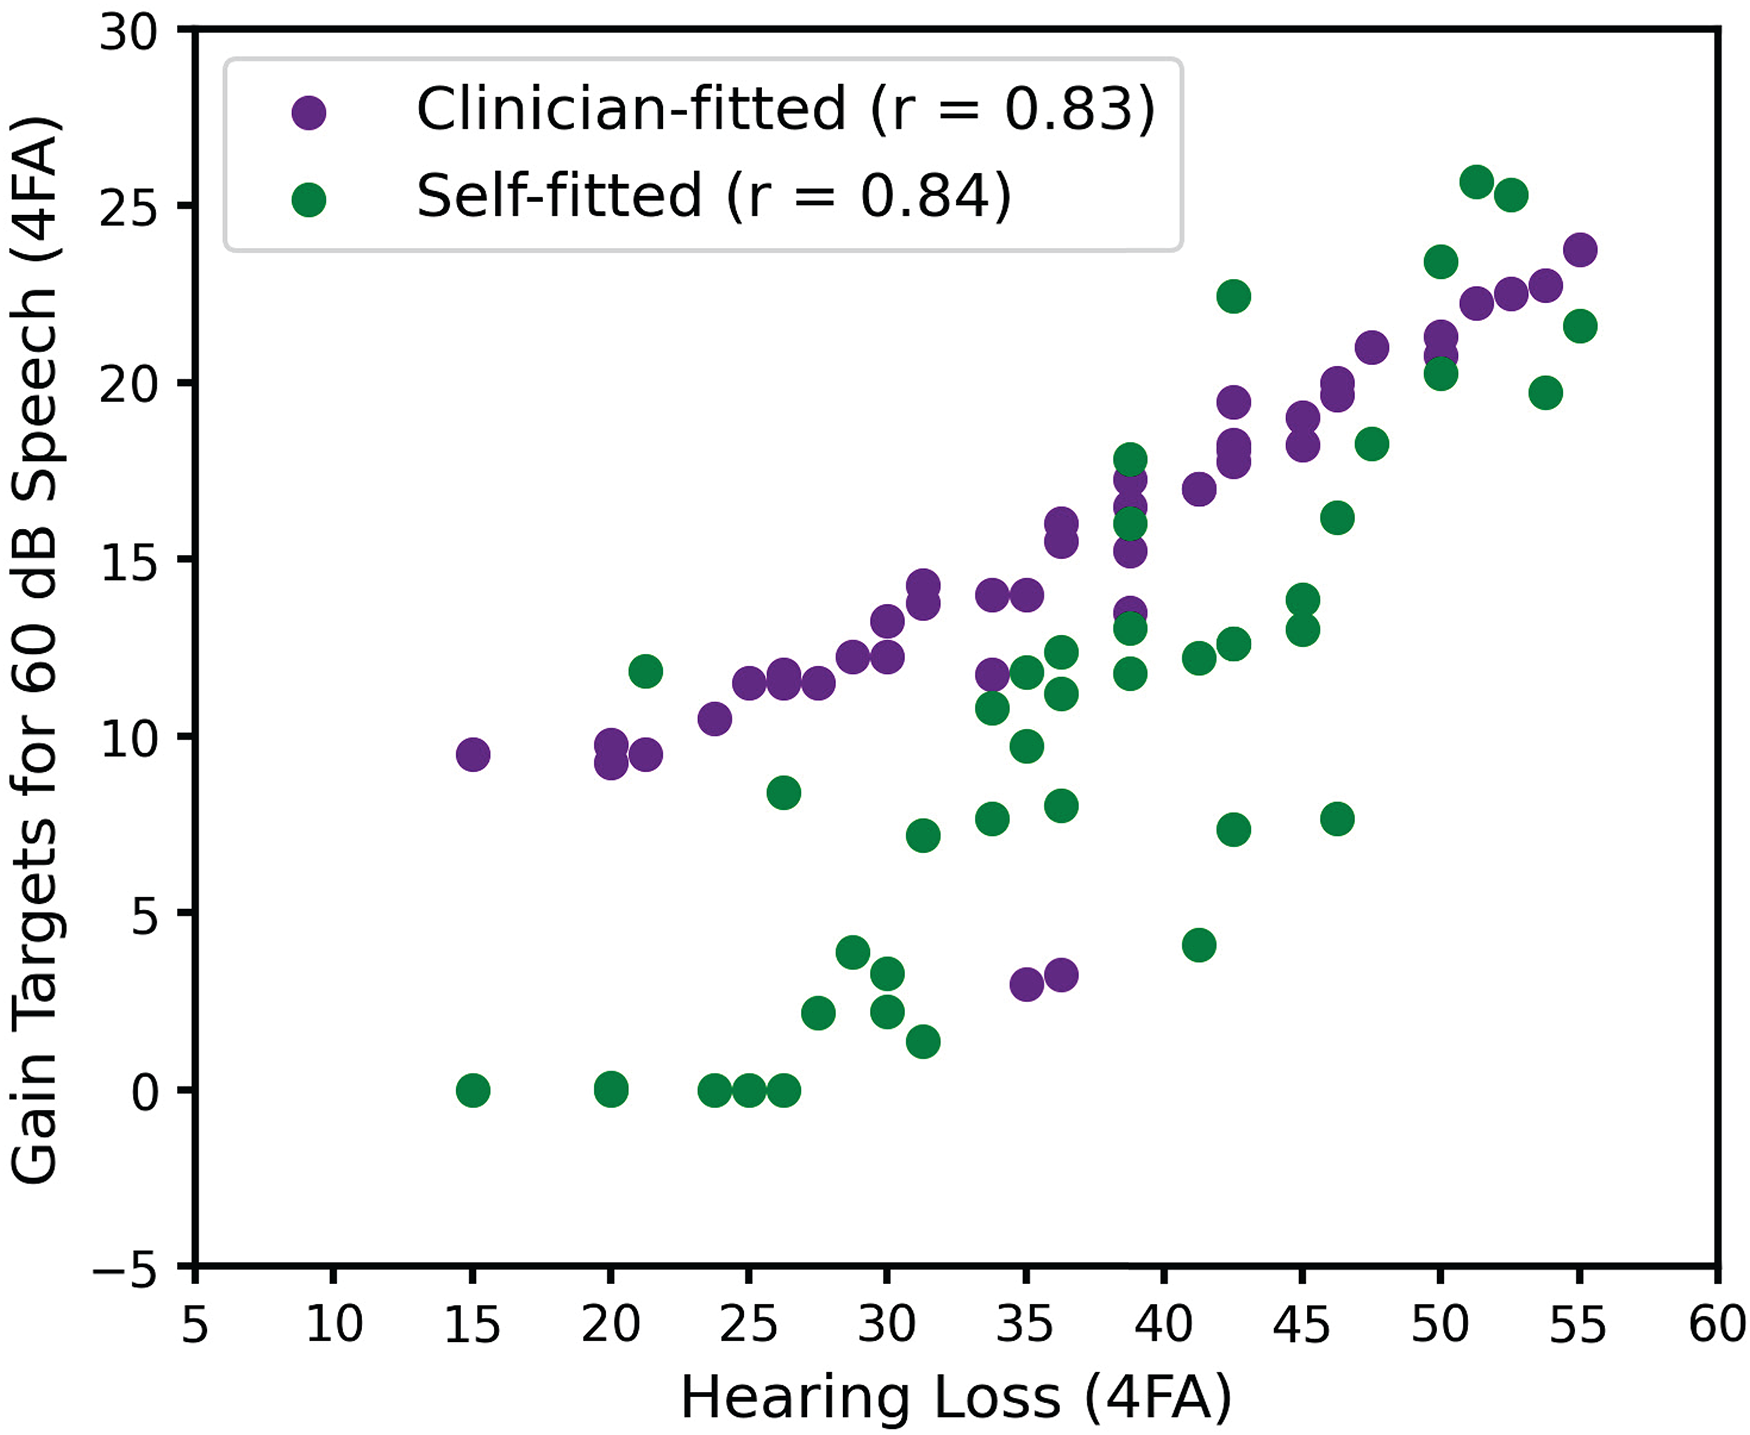
Relationship between hearing loss and gain targets for each fit intervention.
With respect to this tendency to self-adjust gains lower in the self-fitted intervention relative to the prescriptive targets used in the clinician-fitted intervention, it is perhaps worth noting that experienced users tended to have greater 4FA hearing loss (µ = 48.1, σ = 5.2) than inexperienced users (µ = 34.3, σ = 8.5), and as suggested by Figure 3, these experienced users also tended to have smaller 4FA gain target differences between self-fitted and clinician-fitted interventions (µ = 1.7, σ = 3.3), relative to inexperienced users (µ = 5.3, σ = 5.6).
Statistical Approach
Having adopted a within-subject crossover experimental design, we used a repeated-measures analysis of variance (ANOVA) to determine statistical significance. For both APHAB and QuickSIN outcome measures, there were three factors: two interventions (clinician-fitted and self-fitted) and one baseline control (unaided). Statistical analyses were performed on the raw self-fitted and clinician-fitted scores (raw scores were not transformed into benefit scores by subtraction from the unaided score). Performing the analyses on raw scores follows naturally from our repeated-measures design and allows us to report differences between aided intervention and unaided baseline scores. While the crossover design should mitigate the influence of temporal order effects on comparisons between fitting interventions, previous studies have observed that for inexperienced HA users, there can be an overall preference for the second intervention relative to the first (e.g., Naylor et al., 2015). In order to be aware of potential order effects in the interpretation of our results, we performed paired t-tests, separately for each outcome measure, to determine if there were differences in outcomes obtained during visit 2 versus visit 3 (see Figure 1). Statistical analyses were performed in R.
We cautiously adopt the operational definition of “clinically meaningful” introduced by De Sousa et al. (2023). As mentioned above, they used standard effect size conventions, with Cohen's d interpreted as small (d ≤ 0.2), small-to-medium (0.2 < d < 0.5), medium (d = 0.5), medium-to-large (0.5 < d < 0.8), or large (d ≥ 0.8), and considered medium or larger effect sizes to be clinically meaningful. In the absence of a better definition of clinically meaningful (or clinically significant), we find this approach elegant. We therefore report effect sizes for observed differences in outcomes and follow the above convention for interpreting these differences as clinically meaningful. We also acknowledge, however, that the primary advantage of considering the effect size rather than statistical significance of a particular paired comparison is that for large sample sizes, even a small effect can be statistically significant. Given the sample size of our study, we expect statistical significance and clinical meaningfulness to tell a similar story.
Following Sabin et al. (2020) and De Sousa et al. (2023), we were also interested in determining the extent to which observed differences across interventions could be explained by test–retest variability. For each intervention, they report the proportion of individuals whose outcome scores exceed a 90% critical difference (CD) from published test–retest distributions. Test–retest distributions capture the extent to which measurements from the same individual vary, and so are direct reflection of measurement error (Matheson, 2019). We therefore understand this analysis as quantifying the proportion of individuals, for a given outcome and intervention, whose scores cannot be reasonably attributed to measurement error. While this is a perfectly reasonable analysis, it makes comparing proportions across interventions somewhat descriptive. We therefore chose to adopt a slightly different approach, the details of which can be found in Supplement. Specifically, we sought to obtain 90% CDs at the group level, such that we could determine if the group-level difference across interventions we observed for a particular outcome could be reasonably attributed to measurement error. We also report results following the approach of Sabin et al. (2020) and De Sousa et al. (2023), which can be found in the To Facilitate Comparison With Previous Studies section in Supplement.
APHAB Outcomes
Self-reported hearing aid outcomes were obtained using the APHAB questionnaire (Cox & Alexander, 1995), designed to quantify hearing aid benefits using four subscales: AV, BN, EC, and RV. Higher APHAB scores indicate greater self-reported difficulty. These outcomes are shown in Figure 4. To determine the effect of condition (self-fitted, clinician-fitted, unaided) on APHAB subscores, we fit a full linear mixed-effects model (“lme4” package) treating condition, site, and subscale as fixed effects, and treating participant (intercept) as a random effect. We ran an ANOVA (“lmerTest” package, Satterthwaite method for degrees of freedom) on the model output, and found a significant main effect of condition [F(2,38) = 29.1, p < 0.001] and subscale [F(3,57) = 4.8, p = 0.004], as well as a significant condition-by-subscale interaction [F(6,114) = 3.0, p = 0.009]. The main effect of site was not significant [F(1,19) = 0.56, p = 0.47] nor were any of the interactions involving site (all p > 0.37).

Abbreviated Profile of Hearing Aid Benefit (APHAB) scores across condition, shown separately for each subscale and for the global score. Box plots span from the first quartile to the third quartile, with the second quartile (median) indicated with a black line. Whiskers extend to farthest point within 1.5 times the interquartile range. Individual traces are also shown. Horizontal bars indicate significant paired comparisons.
In order to more effectively pursue post hoc paired comparisons, we fit a reduced mixed-effects model having removed the effect of site. A likelihood ratio test was performed to determine if the reduced model fit was significantly different from the full model fit (both fit using maximum likelihood). Since the difference was found to be nonsignificant [χ²(12) = 10.99, p = 0.53], the full model was discarded in favor of a reduced model, treating condition and subscale as fixed effects, and treating participant (intercept) as a random effect. An ANOVA on the model output revealed a significant main effect of condition [F(2,40) = 28.6, p < 0.001], a significant main effect of subscale [F(3,60) = 5.8, p = 0.002], and a significant condition-by-subscale interaction [F(6,120) = 2.5, p = 0.023]. Post hoc paired comparisons were performed on the estimated marginal means obtained from the reduced model fit (using “emmeans” package). Since the statistical model (here and below) did not include covariates nor random participant slopes, estimated marginal means were effectively identical to the raw means, and we used them only to follow best practice. Paired t-tests were performed using the Tukey method of adjustment for multiple comparisons. Effect sizes (Cohen's d) were also calculated for each paired comparison. The results of these post hoc comparisons are shown in Table 2. Consistent with De Sousa et al. (2023), the only significant difference between clinician-fitted and self-fitted interventions observed on a subscale was on the BN subscale (self-fitted better than clinician-fitted). However, we also found that for the BN, EC, and RV subscales, both clinician-fitted and self-fitted interventions were significantly better than the unaided control. We found that all significant differences were also clinically meaningful (following the d ≥ 0.5 convention).
Abbreviated Profile of Hearing Aid Benefit (APHAB) Statistical Outcomes.

Note. AV = Aversiveness; BN = Background Noise; EC = Ease of Communication; RV = Reverberation.
When reporting APHAB outcomes, it is typical to compute a global APHAB score for each participant, which is computed as the average score across the BN, EC, and RV subscales (AV subscale score is excluded). In order to determine the effect of condition on the global APHAB score, we fit a separate linear mixed-effects model treating condition as a fixed effect and treating participant (intercept) as a random effect. An ANOVA on the model output revealed a significant effect of condition [F(2,40) = 28.6, p < 0.001]. Post hoc paired comparisons were performed on the estimated marginal means (Tukey adjustment for multiple comparisons), revealing significant differences between all paired comparisons (Table 2). All of these significant differences were also clinically meaningful (d ≥ 0.5).
Beyond simply reporting effect size, previous studies investigating the clinical effectiveness of self-fitting OTC hearing aids have attempted to determine the extent to which the observed results can be attributed to measurement error, as quantified by test–retest variability (see RESULTS: Statistical Approach). As described in Supplement, there are a set of equations (and assumptions) that allow us to determine group-level 90% CDs from published APHAB test–retest distributions (Chisolm et al., 2005). Having estimated a reliability value of 8.8 (defined in this case as the standard deviation of the test–retest difference distribution), we used equation (3) in Supplement to calculate the two-sided 90% CD (n = 21). This CD of 4.47 is smaller than the observed mean differences in global APHAB scores between unaided and self-fitted (14.73), between unaided and clinician-fitted (7.92), and between clinician-fitted and self-fitted (6.81), suggesting that none of these observed differences can be reasonably attributed to measurement error.
Finally, in order to be aware of potential temporal order effects, a paired t-test was performed comparing outcome scores obtained in visit 2 (first) versus visit 3 (second). The effect of temporal order was not significant (t(40) = −1.0, p = 0.32).
QuickSIN Outcomes
Objective outcomes were obtained using the QuickSIN listening test (Killion et al., 2004), designed to assess speech-in-noise listening abilities. Each participant completed two sentence lists, and their individual QuickSIN score was based on the average score across the two lists. Lower QuickSIN scores indicate better speech perception in noise. These outcomes are shown in Figure 5. To determine the effect of condition (self-fitted, clinician-fitted, unaided) on QuickSIN scores, we fit a linear mixed-effects model treating condition and site as fixed effects, and treating participant (intercept) as a random effect. We ran an ANOVA (Satterthwaite method for degrees of freedom) on the model output and found a significant main effect of condition [F(2,38) = 5.4, p = 0.008]. The main effect of the site was not significant [F(1,19) = 1.3, p = 0.27] nor was the condition-by-site interaction [F(2,38) = 0.2, p = 0.833]. Post hoc comparisons on the estimated marginal means (Tukey adjustment for multiple comparisons) revealed a significant difference between unaided and self-fitted and between clinician-fitted and self-fitted (see Table 3). These significant differences may also be considered clinically meaningful (d ≥ 0.5). The difference between unaided and clinician-fitted was not significant.

Quick Speech-In-Noise (QuickSIN) scores across condition. Box plots span from the first quartile to the third quartile, with the second quartile (median) indicated with a black line. Whiskers extend to farthest point within 1.5 times the interquartile range. Individual traces are also shown. Horizontal bars indicate significant paired comparisons.
Quick Speech-In-Noise (QuickSIN) Statistical Outcomes.

Note. SNR = signal-to-noise ratio.
To determine the extent to which the observed results can be attributed to measurement error, we first calculated reliability following equation (1) in Supplement, which for two sentence lists yielded a reliability estimate of 0.99 dB (Killion et al., 2004). We then calculated the group-level 90% CD following equation (3) in Supplement, yielding a CD of 0.5 dB. This CD is larger than the observed mean difference in QuickSIN scores between unaided and clinician-fitted (0.36 dB), suggesting that this difference can be reasonably attributed to measurement error. However, this CD is smaller than the observed difference between unaided and self-fitted scores (1.74 dB), and between clinician-fitted and self-fitted scores (1.38 dB), suggesting that these differences cannot be reasonably attributed to measurement error.
In order to be aware of potential temporal order effects, a paired t-test was performed comparing outcome scores obtained in visit 2 (first) versus visit 3 (second). The effect of temporal order was not significant (t(40) = 0.53, p = 0.6).
Discussion
Consistent with our hypothesis, and consistent with previous studies evaluating the effectiveness of OTC delivery models against clinician delivery models, we found that the self-fitted intervention was not inferior to clinician-fitted intervention. This is the primary finding we wish to report. However, unlike previous studies, we found that the self-fitted intervention was also superior to the clinician-fitted intervention for both self-reported benefit and objective speech-in-noise outcomes. Notable limitations of the present study though should caution against a strong interpretation of this superiority result. As with all studies evaluating the effectiveness of a particular self-fitting OTC device or delivery model, the generality of results is limited by the specifics of the delivery model, the specifics of the study design, and the specifics of which clinical practices were adopted when obtaining a fit through a clinician. For this reason, it is important to publish the results of OTC effectiveness studies so that the influence of these particulars on outcomes may begin to emerge. After discussing our results, we will consider our study limitations, and after considering these limitations, we will discuss more generally different self-fitting approaches in the OTC landscape.
Study Outcomes
We found that global APHAB scores for both the clinician-fitted intervention and the self-fitted intervention were significantly better than the unaided control. As shown in Table 2, we find improvements of 7.9 for the clinician-fitted intervention and 14.7 for the self-fitted intervention. These improvements are similar to those reported by Sabin et al. (2020) and De Sousa et al. (2023), who found clinician-fitted improvements of 11.9 and 6.7, and self-fitted improvements of 14.6 and 16.3, respectively. If we adopt the definition of clinically meaningful introduced by De Sousa et al. (2023), we find that these improvements are clinically meaningful. Finally, as shown in Table 2, both clinician-fitted and self-fitted outcomes were significantly better than the unaided control for all subscales except AV.
With respect to the difference in APHAB scores between interventions, we found a statistically significant (and clinically meaningful) improvement in BN and global APHAB scores for the self-fitted relative to the clinician-fitted intervention, while finding no statistically significant differences between interventions for the other APHAB subscales. Keeping in mind that the field use period was 2 weeks in the present study, these results are highly consistent with those of De Sousa et al. (2023), who found clinically meaningful improvements in BN and global APHAB scores for the self-fitted relative to the clinician-fitted intervention after a 2-week field use period. As in the present study, De Sousa et al. (2023) did not find clinically meaningful differences between interventions for the other APHAB subscales.
We found that QuickSIN scores for the clinician-fitted intervention were not significantly different from the unaided control. While Sabin et al. (2020) and De Sousa et al. (2023) do not directly report statistical outcomes for this comparison, the benefit scores they report do not suggest a significant improvement in clinician-fitted relative to unaided outcomes (though as discussed below the clinician-fitted benefit at the 6-week evaluation appears to be marginally significant in the latter study). Somewhat surprisingly, we found a statistically significant (and clinically meaningful) improvement in QuickSIN scores for the self-fitted intervention relative to both the unaided control and to the clinician-fitted intervention. Sabin et al. (2020) report a 0.42 dB improvement for the self-fitted intervention relative to unaided, while we observed a 1.7 dB improvement. De Sousa et al. (2023) do not directly report their QuickSIN outcomes, though a visual inspection of their Figure 2 (C) suggests that while QuickSIN benefit scores tended to be low, the benefit observed for the clinician-fitted intervention at the 6-week evaluation looks reasonably substantial. Indeed, they report an effect size of 0.4 for this benefit. While the literature evaluating the effect of hearing aid interventions relative to an unaided control is surprisingly sparse, it is worth noting that aided benefits for QuickSIN scores have been reported. In a group of 21 experienced hearing aid users, Mendel (2007) found a 2.15 dB improvement for aided relative to unaided QuickSIN scores. In a group of 22 experienced hearing aid users, Saunders et al. (2018) found a 4.3 dB improvement in aided relative to unaided QuickSIN scores. Interestingly, in a group of 24 hearing-impaired individuals who were not hearing aid users, they observed a 1.8 dB degradation in aided relative to unaided QuickSIN scores. Rather than wearing hearing aids, these inexperienced users wore a Pocketalker personal sound amplification device, which they adjusted to a comfortable listening level during speech testing. QuickSIN scores have been shown to improve, stay the same, or even get worse as a function of amplification relative to unaided.
Since our participants had mild-to-moderate hearing loss (Figure 2), and since the four-talker babble noise used in the QuickSIN test is relatively dense, we would not expect amplification to provide a significant change in audibility. Instead, we suspect that listening at self-fitted amplification levels may have led to a greater tolerance of background noise, relative to both unaided and clinician-fitted amplification levels. At a minimum though, the results suggest that performance in noise using self-fitted gain is no worse than using clinician-fitted gain.
Gain Targets
We found that users tended to obtain less target gain in the self-fitted intervention compared to the clinician-fitted intervention. As discussed below, since we did not perform real-ear verification, we could not compare differences in real-ear insertion gains between self-fitted and clinician-fitted interventions. Nonetheless, this finding is consistent with previous studies that report lower real-ear insertion gains in self-fitting interventions compared to clinician-fitted interventions (e.g., Humes et al., 2017; Sabin et al., 2020; Urbanski et al., 2021), though interestingly, we also observed that this tendency to prefer lower gains in the self-fitted intervention was more pronounced for individuals with milder losses (see Figure 3).
We also considered whether differences in outcomes were correlated with differences in gains, which may be expected to the extent that differences in outcomes across interventions were determined by differences in gains across interventions. To examine this, we calculated Pearson correlations between absolute differences in 4FA gain (averaged across pairs of ears) and absolute differences in outcome across interventions. These correlations were not significant for APHAB (r = 0.27, p = 0.24) nor for QuickSIN (r = −0.06, p = 0.8) outcomes, suggesting that larger absolute differences in 4FA gains across interventions do not straightforwardly predict a larger absolute difference in outcomes across interventions.
Study Limitations
Next, we consider four key limitations that arise from not strictly adhering to audiological best practices in our clinician-fitted intervention.
First, the initial fitting rationale adopted by the clinician was not NAL-NL2 but was instead a proprietary fitting rationale provided by the device manufacturer. It is possible that had NAL-NL2 been used instead, clinician-fitted outcomes would have been better overall and not significantly different from self-fitted outcomes. While to our knowledge, the available literature does not suggest that NAL-NL2 yields significantly better outcomes than other established fitting rationales (e.g., Moore & Sęk, 2013; Portelli et al., 2024), the use of a manufacturer-specific fitting rationale should nonetheless be considered a significant limitation on the generalizability of the current findings, even in the absence of studies demonstrating the superiority of NAL-NL2 over manufacturer-specific fitting rationales.
Second, insertion gain targets were not verified with real-ear measurements. While real-ear verification is not uncommon in clinical settings, it is a step often skipped in real-world clinical settings (Anderson et al., 2018). As discussed by Almufarrij et al. (2021), while the published literature suggests that real-ear verification tends to confer a statistically significant improvement in self-reported and objective outcomes, the effect sizes are small (the authors estimate a 4% improvement in APHAB scores and a 0.5 dB SNR improvement with real-ear verification), possibly small enough that the estimated improvement in fit outcome is not worth the estimated cost of real-ear verification in real-world settings. Nonetheless, it is quite possible that had insertion gain targets been verified with real-ear measurements, clinician-fitted outcomes would have been better overall.
Third, the traditional clinician delivery model allows for multiple follow-up fitting sessions where device parameters can be fine-tuned. De Sousa et al. (2023) neatly captured this aspect of audiological best practice by measuring outcomes after an initial fitting session with a 2-week field use period, and then again following a fine-tuning follow-up with a 4-week field use period. In our study, outcomes were only measured after an initial fit with a 2-week field use period. It is possible that had participants been provided a follow-up fine-tuning session, clinician-fitted outcomes would have improved relative to self-fitted outcomes. Indeed, De Sousa et al. (2023) found that self-fitted APHAB benefit scores were better than clinician-fitted scores by a clinically meaningful amount (d = 0.5) after 2 weeks of field use following an initial fit, but that this difference was no longer clinically meaningful (d = 0.4) after a fine-tuning session followed by an additional 4-week field use period, though perhaps this latter difference may be considered marginally clinically meaningful.
Self-Fitting Approaches in the OTC Hearing Aid Space
As mentioned above, the results of studies evaluating the effectiveness of a particular self-fitting OTC device or delivery model are tied to, amongst other specifics, the specifics of the device or delivery model. In what follows we will attempt to summarize the strategies adopted in the commercial OTC hearing aid space, and to point out a possible uniqueness of the approach adopted in the present study.
In our opinion, there are three main self-fitting features typically made available by different commercially available self-fitting approaches. One of these features is the availability of selectable preset fits. In some commercially available OTC devices, and in some lab-based OTC approaches (e.g., Chang & Lo, 2024), a single preset fit is made available to the user. More commonly though, for both commercially available OTC devices and lab-based OTC approaches, users have access to multiple preset fits and can choose amongst them. A second feature is the availability of what we might call post-fitting adjustments. In many commercially available OTC devices, users are able to modify aspects of their fit after it has been selected (change gains through some multichannel equalizer interface, change microphone directionality, etc.). A third feature is an in situ hearing test, where users begin the self-fitting process by providing detection thresholds for presented narrowband stimuli. These detection thresholds are used to estimate an audiogram from the user, and an initial fit is provided to the user following some fitting rationale. Different commercially available and lab-based OTC approaches may adopt one or more of these features. A possible exception to this characterization of the OTC space is a feature that allows users to adjust a pair of sliders controlling sets of gain parameters to obtain a fit (see Nelson et al., 2018; Sabin et al., 2011). Also worth noting is that for the preset selection feature, or for post-fitting adjustment feature, a particular self-fitting approach might present controlled speech stimuli to aid the user in making their selections (e.g., Boothroyd & Mackersie, 2017).
The uniqueness of the self-fitting approach evaluated in the present study is the focus on paired comparisons to adjust an initial fit. After detection thresholds are measured and an initial fit is obtained, Soundscope provides pairs of candidate fits and asks users to provide preference judgments on these candidates, while controlled speech stimuli are presented to aid users in their preference judgments. Based on the user response, new candidate fits are provided. This process iterates until a final fit is obtained.
This approach shares similarities with a feature developed by Widex to augment the traditional clinician-fitting approach. As described by Jensen et al. (2019), the goal of the SoundSense Learn feature is to allow users to modify their fit in specific real-world situations in which their hearing needs are not being optimally addressed. Like Soundscope, this SoundSense Learn feature uses paired preference comparisons to obtain a preferred fit modification. Relative to a fixed preset fit through Widex's proprietary fitting rationale, Jensen et al. (2019) showed better “basic audio quality” ratings for a modified fit obtained through SoundSense Learn. However, they did not observe significant differences in ratings for listening comfort or speech clarity. Speech intelligibility was not investigated because previous work had not revealed improvements in speech intelligibility with SoundSense Learn. SoundSense Learn relies on a Bayesian paired-comparison preference learning framework, where a Gaussian process is used to model a user’s hypothetical internal preference response function and is updated based on their paired preference judgments (see Nielsen et al., 2015). While this approach has been shown to be somewhat effective in other lab-based settings (e.g., Baltzell et al., 2018), these approaches can suffer significantly from inconsistent user preference (Brochu et al., 2010). For this reason, as the preference space being optimized over extends to more dimensions, there is a greater risk that users may provide inconsistent preference judgments by focusing on different aspects of the fits being compared. To this end, when examined experimentally, significant test–retest variability has been observed for self-fitting approaches that allow users to take steps in high-dimensional parameter spaces (Nelson et al., 2018; Perry et al., 2019).
Soundscope does not rely on this preference learning framework, and the proprietary decision tree focuses on one dimension at a time rather than jointly finding a maximum in a multidimensional space. One untested hypothesis is that if Soundscope is taken multiple times, resulting fits will be more consistent than those observed using other paired comparison self-fitting approaches.
Conclusions
The present study evaluated the effectiveness of a self-fitting approach adopted by a commercially available OTC hearing aid, the Concha Sol. The effectiveness of this approach was validated against a clinician-fitted approach, although this clinician-fitted approach deviated from audiological best practices in a number of ways. These deviations may have contributed to our finding that the self-fitted intervention yielded superior outcomes compared to the clinician-fitted intervention.
While the effectiveness of different self-fitting approaches has been previously demonstrated, the present study adds to this relatively small body of literature. Broadly establishing the effectiveness of commercially available self-fitting OTC hearing aids, as well lab-based self-fitting approaches, is critical for facilitating the public adoption of self-fitting OTC hearing aids. Adoption of OTC hearing aids has the potential to address existing service gaps, and in doing so improve hearing health and mitigate known social and cognitive consequences of nonadoption, including increased risk for dementia (Lin et al., 2023; Livingston et al., 2020).
Supplemental Material
sj-docx-1-tia-10.1177_23312165251328055 - Supplemental material for Validation of a Self-Fitting Over-the-Counter Hearing Aid Intervention Compared with a Clinician-Fitted Hearing Aid Intervention: A Within-Subjects Crossover Design Using the Same Device
Supplemental material, sj-docx-1-tia-10.1177_23312165251328055 for Validation of a Self-Fitting Over-the-Counter Hearing Aid Intervention Compared with a Clinician-Fitted Hearing Aid Intervention: A Within-Subjects Crossover Design Using the Same Device by Lucas S. Baltzell, Kosta Kokkinakis, Amy Li, Anusha Yellamsetty, Katherine Teece and Peggy B. Nelson in Trends in Hearing
Footnotes
Ethical Considerations
Two clinical sites were involved in the data collection: (1) University of Minnesota, Minneapolis, MN (UMN) and (2) San Jose State University, San Jose, CA (SJSU). Research participants at each clinical site were recruited through clinic referrals and through local advertisements. All procedures were reviewed and approved by the Institutional Review Boards (IRBs) at both UMN (IRB ID: STUDY00017664) and SJSU (IRB Tracking Number: 23028). After being informed of the study procedures, each potential participant signed an informed consent form.
Consent to Participate
After being informed of study procedures, each potential participant signed an informed consent form.
Funding
The author(s) received no financial support for the research, authorship, and/or publication of this article.
Conflicting Interests
The authors declared the following potential conflicts of interest with respect to the research, authorship, and/or publication of this article: L. S. B., K. K., and A. L. are employees of Concha Labs.
Data Availability
The data supporting this study are available upon reasonable request to the corresponding author. Data will be shared under a Creative Commons CC BY-NC license, which permits noncommercial reuse with appropriate credit to the authors.
Supplemental Material
Supplemental material for this paper is available online.
References
Supplementary Material
Please find the following supplemental material available below.
For Open Access articles published under a Creative Commons License, all supplemental material carries the same license as the article it is associated with.
For non-Open Access articles published, all supplemental material carries a non-exclusive license, and permission requests for re-use of supplemental material or any part of supplemental material shall be sent directly to the copyright owner as specified in the copyright notice associated with the article.