
Abstract
A major goal of hearing-device provision is to improve communication in daily life. However, there is still a large gap between the user's daily-life aided listening experience and hearing-aid benefit as assessed with established speech reception measurements in the laboratory and clinical practice. For a more realistic assessment, hearing-aid provision needs to be tested in suitable acoustic environments. In this study, using virtual acoustics, we developed complex acoustic scenarios to measure speech-intelligibility and listening-effort benefit obtained from hearing-aid amplification and signal enhancement strategies. Measurements were conducted using the participants’ own devices and a research hearing aid, the Portable Hearing Laboratory (PHL). On the PHL, in addition to amplification, a monaural and a binaural directional filter, as well as a spectral filter were employed. We assessed the benefit from different signal enhancement strategies at the group and the individual level. At the group level, signal enhancement including directional filtering provided a higher hearing-aid benefit in challenging acoustic scenarios in terms of speech intelligibility compared to amplification alone or combined with spectral filtering. However, no difference between monaural and binaural signal enhancement occurred. On an individual level, we found large differences in hearing-aid benefit between participants. While some benefitted from signal-enhancement algorithms, others benefitted from amplification alone, but additional signal enhancement had a detrimental effect. This shows the importance of an individual selection of signal enhancement strategies as a part of the hearing-aid fitting process.
Introduction
A major goal of hearing-device provision is to improve communication in daily life. However, the adoption rates of hearing aids (HA) are still insufficient. The most frequent reason hearing-impaired people do not wear their HAs is dissatisfaction with speech intelligibility (SI) in noisy situations (EHIMA, 2022). This could be due to large differences in the acoustic environments occurring between laboratory tests assessing HA benefit and the user's everyday life. In Germany, the “Hilfsmittelrichtlinie” (directive on the prescription of medical aid accredited by statutory health insurance, Gemeinsamer Bundesausschuss, 2021) states that a HA benefit is successfully demonstrated in the laboratory if the speech recognition threshold (SRT) at 50% SI is at least 2 dB lower in the measurement with HAs than in an unaided measurement. However, these measurements are conducted in very simplified acoustic scenarios. It is required that SI assessments are conducted in background noise, but the spatial configuration of speech and noise can be chosen by the HA acoustician or the audiologist performing the measurement. Common measurement configurations entail target speech from the front, and a stationary speech-shaped noise source from the side or the back. This configuration, however, differs greatly from acoustic environments that HA users encounter in real life, which involve multiple sound sources, reverberation, fluctuating sounds and much more. This gap likely contributes to the fact that a benefit of HAs observed in the laboratory is not necessarily reflected in the user's daily life, which can lead to dissatisfaction with the HAs.
The effect of reverberation and spatial noise source configurations on HA processing was investigated by Ricketts (2000). They showed that reverberation leads to a significant decline in directional-microphone benefit compared to non-reverberant measurement setups. Also, the benefit was higher in a listening situation with a noise source from the back than in more realistic conditions with several sound sources spatially distributed across the room. Furthermore, studies (e.g., Best et al., 2017; Kidd, 2017) demonstrated that the benefit from a directional filter in HAs is more robust in energetic- than in informational-masking conditions. These results show that the directional-filter benefit differs between typical laboratory setups and setups that include components relevant for real life, and strongly motivate the consideration of more realistic, complex acoustic scenarios when assessing HA benefit.
In recent years, there has been a growing body of research that uses complex acoustic scenes to investigate HA performance with higher ecological validity. For example, Mansour et al. (2022) assessed the effect of dynamic range compression on SI in simulated realistic sound environments and compared it to SI in artificial noise configurations. The realistic environments were generated using Ambisonics recordings from a public lunch and an office meeting. All stimuli were presented via loudspeakers. For realistic HA processing, the open Master Hearing Aid software (Kayser et al., 2022) was used, combined with two behind-the-ear HA shells containing a microphone and a receiver for realistic sound capture and output. The authors found a significant benefit of dynamic range compression only in the realistic sound environments. A similar study was conducted by Best et al. (2015). They compared HA benefit in terms of SI in a simulated reverberant cafeteria presented via a 3D loudspeaker array using virtual acoustics with a standard laboratory noise configuration. The participants used their own HAs in their most common setting, which means that additionally to amplification different signal enhancement algorithms may have been activated. Since there was no further information available in this regard, the effect of the amplification and the effect of the signal enhancement algorithms could not be disentangled. In the complex cafeteria environment, SRTs were on average higher and HA benefit was larger than in the standard laboratory setup. The authors argue that the larger benefit observed in the complex setup might be attributed to measuring at higher signal-to-noise ratios (SNRs) compared to the standard noise configuration. They also found that inter-individual differences in SRT were larger in the complex setup. Miles et al. (2022) assessed the effect of HA amplification in a variety of realistic listening environments. As noise they used recordings of six different acoustic environments, which were presented over headphones. Additionally, HA processing featuring wide dynamic range compression (WDRC) was performed on the signal. A dependency of HA benefit on the noise scenario as well as on hearing loss was found: The highest benefit was observed for listeners with severe hearing loss in rather quiet acoustic surroundings. For listeners with mild hearing loss in loud environments the authors even found a detrimental effect of HA amplification. Not only the effect of HA amplification but also the effect of digital noise reduction on SI in complex acoustic environments was investigated by Ellis et al. (2024). They used simulated HA processing and a virtual restaurant scenario and presented the processed stimuli over headphones. They found an interaction between WDRC and digital noise reduction, with noise reduction only being beneficial in combination with fast-acting WDRC but having a detrimental effect in combination with slow-acting WDRC.
With regard to the playback devices, most of the above literature on HA benefit in complex acoustic scenarios presented stimuli over headphones, which does not take into account individual parameters that play a role in real HAs, such as individual head-related transfer functions, effects of ear molds and head movements. Others used commercial HAs, which has the disadvantage (for research) that such devices are essentially a black box, and researchers only have very limited control over the applied features and no insights into the actual implementation. In this study, we overcome these limitations by using a research HA, the Portable Hearing Laboratory (PHL; Kayser et al., 2022; Pavlovic et al., 2018) and presenting complex acoustic scenarios over loudspeakers with virtual acoustics. The PHL allows for real-time signal processing and the use of common signal-enhancement strategies, but with full control over the applied HA features and detailed knowledge about their implementation. Furthermore, it uses a pair of BTE devices with a usual form factor and therefore includes all relevant acoustic features of commercial HAs. Recent studies have shown that the PHL performs in the same range as commercial HAs in technical evaluations (Denk et al., 2022; Jürgensen et al., 2021), supporting the assumption that significant and interpretable data can be obtained with the PHL.
With regard to the compensation of hearing loss and speech enhancement, the described literature on HA benefit in complex scenarios mostly focused on the effects of amplification and compression alone, or the interaction between amplification and digital noise reduction. None of the studies assessed the differential benefit of signal enhancement algorithms, especially directional filters. However, such algorithms are implemented by default in commercial HAs. Three classes of common signal enhancement algorithms are (a) binaural beamformers, (b) monaural directional filters and (c) spectral filters. With a binaural beamformer (a) an improvement in SNR is achieved by combining the microphone signals captured by the hearing devices at the left and the right ear (usually two microphones in each hearing device). The use of four microphones and an extended microphone array geometry allows for a narrow beam and therefore a large increase in SNR (Derleth et al., 2021). The combination of microphone signals from the left and the right ear results in a monaural output signal that is presented diotically, and therefore spatial information about the target and interfering sources are lost. However, spatial information is important for speech perception in complex acoustic environments. A minimum of spatial information can be preserved by using two binaural beamformers, each referenced to one ear such that their binaural output signal is perceived from one given direction. Nevertheless, the benefit for the spatial hearing is limited since spatial cues of all sound sources must be preserved to help to segregate different sounds and focus the attention on the speaker of interest (auditory object formation and selection (e.g., Darwin, 2006)). There are binaural beamformers available that facilitate binaural-cue preservation also for interfering sources. Preserving binaural cues, however, comes at the expense of the achievable SNR improvement (Marquardt & Doclo, 2018). A monaural directional filter (b) usually uses two microphones per HA and when employed in a bilateral setup both instances operate independently at each ear. Furthermore, their microphone array geometry underlies stronger constraints due to the limited space available in one HA shell and therefore limits the choice of suitable methods to those that can exploit small microphone spacings such as a differential microphone. Hence, the SNR improvement is typically lower than in binaural directional filters. In the case of a fixed directionality, i.e., non-adaptive processing, most binaural cues can be preserved, while adaptive processing that is mutually independent in the left and the right hearing device may disrupt binaural cues (Derleth et al., 2021). Spectral filtering (c) does not change binaural cues available in the original signal. However, the achievable SNR improvement is typically lower than in the directional filtering strategies. In summary, there is a trade-off between SNR improvement and preservation of spatial cues that are essential for understanding speech in noise. A study by Völker et al. (2015) investigated the benefit in terms of SI of several signal processing strategies that differed in their amount of binaural cue preservation. The authors used (amongst others) a monaural directional filter, a fixed binaural directional filter, and a spectral coherence filter in combination with the monaural directional filter. The algorithms were implemented on a research HA platform. For stimulus presentation, binaural synthesis was used, i.e., pre-recorded stimuli were convolved with head-related impulse responses recorded on a dummy head in a cafeteria. This means that effects such as acoustic coupling and head movement were neglected. The authors did not find significant differences in SI between the mentioned signal enhancement strategies. In our study we expand these findings by assessing the differential benefit of signal processing strategies in a more realistic setup using the PHL and virtual acoustic scenarios. The signal enhancement strategies we used were representatives of a binaural beamformer, a monaural directional filter, and a spectral filter. With this choice we aimed at covering a variety of classes of HA signal enhancement with different amounts of spatial cue preservation.
Another factor that affects the benefit of signal enhancement strategies in addition to differences in the amount of the methods’ binaural cue preservation, is the interaction with the HA user. There are large inter-individual differences in hearing-impaired people with respect to the utilization of binaural cues (for an overview see Gallun et al., 2021), which might potentially influence the achievable benefit on an individual level. Neher et al. (2017) evaluated five directional filters that differed in the amount of binaural-cue preservation, and additionally investigated the correlation to the participants’ binaural hearing abilities. They found that a hybrid directional filter with binaural-cue preservation in the low frequencies and directional filtering in the high frequencies was most beneficial for participants with intact binaural hearing, whereas participants with impaired binaural hearing profited most from SNR improvement only. The authors also noted that, due to the use of virtual headphone simulations and non-individual acoustic head transfer characteristics, properties of real, wearable HAs were not considered, such as the transmission of low-frequency direct sound and the coupling of the HA to the user's ears. In our study, we further explore the interplay between signal enhancement strategies and the individual HA user by investigating individual HA benefit from different signal enhancement strategies, using virtual acoustics and realistic stimulus presentation with the PHL.
Hearing impairment does not only affect SI, but also listening effort (LE). There are several studies that investigated the effect of HA amplification on subjective LE (for an overview, see Ohlenforst et al., 2017). Only a few have tackled the effect of different signal enhancement strategies. Desjardins (2016) assessed the effects of directional filtering and noise reduction in HAs on LE. They presented sentences in a 4-talker-babble noise, which was spatially separated from the speech. Participants wore commercial HAs and rated perceived effort. No significant benefit from signal enhancement algorithms was found. Luts et al. (2010) investigated subjective LE in an office room. Speech was presented from the front in a pseudo-diffuse noise field. HA processing was simulated, including individual amplification and different signal enhancement strategies. HA shells with microphones and a receiver were used for sound capture and output. The authors found a significant benefit of a directional filter compared to providing only amplification for a wide range of SNRs. A spectral filter only yielded a significant benefit at 0 dB SNR. In this study, we used LE as a measure beyond SI to assess HA benefit. To our knowledge, no study thus far has compared the differential benefit of amplification and signal enhancement strategies on subjective LE in complex virtual acoustic environments.
In the current study we used a research HA and different virtual acoustic scenarios that capture aspects of real-life listening to explore the role of different HA processing strategies on (individual) speech reception. We measured SI and also assessed subjective LE as an additional metric. SI and LE are summarized under the term speech reception for the remainder of this paper. The use of the PHL allowed for realistic HA provision and also the assessment of the differential benefit from four types of HA signal processing: individualized amplification alone, amplification combined with either a monaural or a binaural directional filter, or amplification combined with a spectral filter.
The following research questions were tackled:
Which of the four hearing-aid signal processing strategies provides the greatest benefit for speech reception at the group level? Can we derive optimal individual processing strategies on the basis of the results obtained at the group level? What is the role of listening effort as a measure for hearing-aid benefit beyond SI?
Methods
Participants
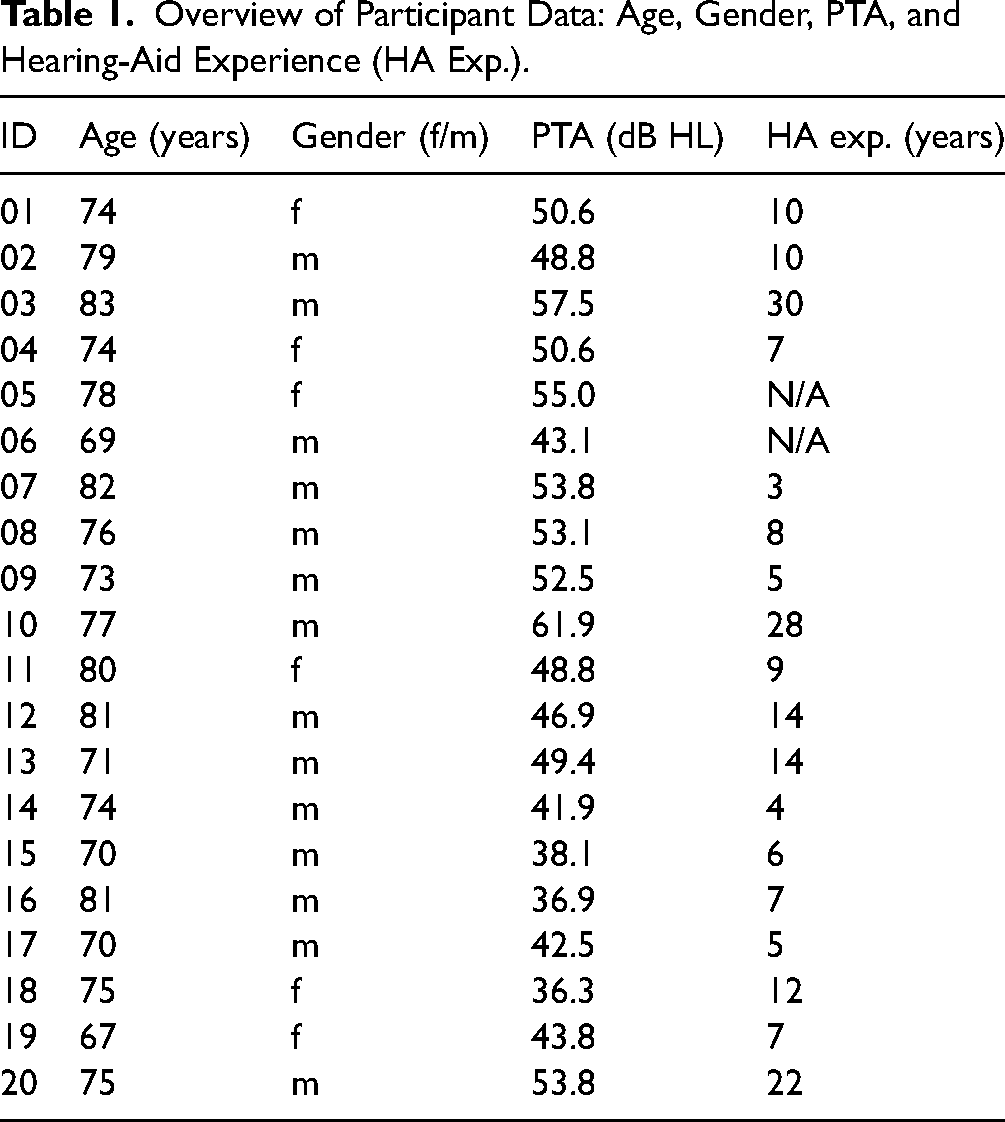
Twenty hearing-impaired people participated in the study. An overview of the participants’ characteristics is given in the Appendix (Table 1). Six participants identified as female, 14 as male, and the age range was 69–83 years (M = 75.5 ± 4.5 years). The Pure Tone Average (PTA)—mean of the hearing threshold at 500, 1000, 2000, and 4000 Hz, averaged over both ears—lay between 36.25 and 61.88 dB HL. Two participants did not provide information about the time span of their HA use, all others could be identified as experienced HA users. Figure 1 shows the median audiogram of all participants. Circles and crosses depict the median hearing threshold of the right and the left ear, respectively. The shaded area illustrates the interquartile range, the dashed lines show the minimum and maximum at each frequency.

Median audiogram of participants for the left (crosses) and right (circles) ear. The shaded area illustrates the interquartile range, the dashed lines show the minimum and maximum at each frequency.
Overview of Participant Data: Age, Gender, PTA, and Hearing-Aid Experience (HA Exp.).
Listening Tests
Two different listening tests were carried out with the participants. One was the Oldenburg Sentence Test (OLSA; Wagener et al., 1999), the other was a LE rating, using the scale of the Adaptive CAtegorical Listening Effort Scaling (ACALES; Krueger, Schulte, Brand et al., 2017) procedure. The OLSA is a sentence test designed for measuring SI in noise. The speech material consists of a matrix of 50 German words, a table with the words can be found in Wagener et al. (1999). The syntax of the sentences is fixed in the order noun-verb-numeral-adjective-object, with 10 words per word category being available. Here, we used pre-existing test lists to assess SI, with one test list being randomly chosen for each measurement condition. Each test list contains ten sentences with five words each. Each of the 50 words available in the matrix occurs exactly once in each test list. During the development of the OLSA, Wagener et al. (1999) optimized the speech material with regard to word intelligibility, so that all test lists lead to very similar speech recognition results. Therefore, no significant effect of word or test list on SI is expected, which means that a random test list can be chosen for each measurement. We conducted the OLSA in a closed design, such that after each sentence presentation the participant saw the whole matrix of possible words and chose the ones they understood. The SNR in each measurement was fixed, see section Virtual Acoustic Scenarios for details. The percentage of correctly repeated words was calculated as an outcome measure. After each OLSA measurement, i.e., each test list, the participants were asked to rate the subjective LE experienced during the OLSA measurement on a 13-point-scale from "effortless" (ger: "mühelos") to "extremely effortful" (ger: "extrem anstrengend"), with an additional category "only noise" (ger: "nur Störgeräusch"). The LE results are expressed as Effort Scaling Categorical Units (ESCU) from 1 ESCU being “effortless” and 13 ESCU being “extremely effortful”.
Virtual Acoustic Scenarios
Both listening tests were conducted in six different virtual acoustic scenarios that were designed to provide a listening situation closer to real life than typical laboratory measurements. The scenarios were generated and rendered with the Toolbox for Acoustic Scene Creation and Rendering (TASCAR; Grimm et al., 2019). Rendering of virtual sound sources was performed using two-dimensional, horizontal seventh-order ambisonics. Figure 2 sketches the different scenario configurations. In each scenario target speech was presented by a female voice (F3 talker from Hochmuth et al., 2015) from the frontal direction with a level of 65 dB SPL, measured at the listener's position. The distance between virtual source and receiver was 1.5 m. The virtual room acoustics remained the same in each scenario, whereas noise type and noise level varied from scenario to scenario. The room acoustics were based on those of the cafeteria at the natural sciences campus of the University of Oldenburg. An outline of the virtual cafeteria space with the sound sources is shown in Figure 3. The area indicated by the solid line approximates the dimensions of a gallery with a floor space of 178.63 m2 and a clearance height of 9.37 m that was part of the real open cafeteria space. Surfaces in the proximity of the sound sources such as floor, ceiling, windows, and nearby tables as sketched in Figure 3 were simulated as reflective surfaces. Further diffuse reverberation characteristics were generated in TASCAR using a feedback delay network approximating the whole cafeteria space with an area of 20 × 30 m and a height of 9 m. Parameters for absorption, gain, and damping were adapted to approximate the reverberant part of an energy-decay curve computed from a room impulse response measured in the cafeteria (Kayser et al., 2009) with a reverberation time T60 of 2.3 s. The reverberation was applied to the target source and all noise sources. The critical distance of the room was 4.2 m. It was determined with a simulation in TASCAR, presenting stationary noise (with the same spectrum as the target speech) from the position of the target speech source, changing the position of the receiver along the axis between target source and receiver, and measuring the level of a stationary noise at the receiver position. At 4.2 m distance, the direct sound and the reverberation had the same level.

Virtual acoustic scenarios. Each panel describes one scenario. The scenario titles are shown on the bottom right in gray. The subject position is indicated by the orange figure.

Outline of the virtual cafeteria space. The black lines show the reflective surfaces. The orange circle, blue circle, and blue crosses depict the listener, target speech source and interfering ISTS sources, respectively.
In the first scenario (None), no noise was presented. All other scenarios contained either the International Speech Test Signal (ISTS; Holube et al., 2010) located at ±60° azimuth in 1.5 m distance relative to the listener position, a diffuse cafeteria noise (Grimm & Hohmann, 2019; Hendrikse et al., 2019) or both combined. The ISTS consists of segmented and mixed speech snippets from five different languages. It is unintelligible, but resembles speech in terms of spectrum, modulation spectrum, harmonics, and fundamental frequency. The cafeteria noise was an Ambisonics audio recording in B-format captured at the cafeteria of the University of Oldenburg. In this recording, different sounds can be heard, such as babble noise, moving chairs, and rattling dishes/cutlery. In total, six scenarios were designed: None, S55, S55/C60, S65, S65/C60, and S65/C70. The different names represent the different noise-source configurations. S stands for speech, i.e., the ISTS talkers at ±60°, C stands for the cafeteria noise. The numbers refer to the sound pressure level of the respective noise source measured at the listener's position. As depicted in Figure 2, S55 and S65 only entail localized noise sources at 55 and 65 dB SPL, respectively, whereas in S55/C60, S65/C60, and S65/C70 diffuse cafeteria noise was additionally present. With the use of localized and diffuse sound sources, we expected differences in effectiveness of the signal-enhancement algorithms and in the importance and benefit of binaural-cue preservation. In Table 2, the resulting SNRs in each scenario are shown, the SNR decreased from scenario to scenario. Changing the SNR in such a way should also change the difficulty of the listening task.
Signal-to-Noise Ratios (SNRs) for Each Listening Scenario.

The audio presentation was conducted in an acoustically treated room with the dimensions 5.93× 5.01 × 2.74 m (length × width × height) and a reverberation time T60 of 0.17 s. Signals were presented via a 16-loudspeaker array composed of Genelec 8030s arranged in a horizontal circle with a radius of 1.56 m. One of the loudspeakers was located at the front of the listener (0° azimuth), and the angular distance between all loudspeakers was 22.5° azimuth. The listener was seated in the center of the circle, with the loudspeakers at a height of 1.18 m which was approximately the height of the ears. The virtual acoustic scenarios, which were presented via the loudspeaker array, were designed and rendered with TASCAR.
Hearing Aid Provision Types
All participants conducted the measurements with six different HA Provision Types: Unaided, Own HA, Ampl. only, Ampl. & Coh, Ampl. & ADM and Ampl. & MVDR. In the first configuration (Unaided) the participants performed the measurements without hearing devices. In the second (Own HA) the participants wore their own HAs. In the other four conditions, the participants were treated with the PHL (Pavlovic et al., 2018), see below for technical details. The hardware of the PHL includes a BeagleBone Black wireless single-board computer with an additional multi-channel audio board. Two cables connected the main body of the PHL with behind the ear (BTE) devices, each featuring two microphones. For sound presentations, receivers in the outer ear canal were used. Each participant received individualized earmolds without a vent, chosen to minimize the direct sound reaching the ear drum. This allowed for the signal-enhancement algorithms to work most efficiently. The open Master Hearing Aid (openMHA; Kayser et al., 2022) software for real-time processing of audio was used on the PHL. It was developed for hearing research and performs different HA operations, such as dynamic range compression and several signal-enhancement algorithms. 1
Individualized Amplification
For the provision type Ampl. only, individual amplification was applied through the PHL without activation of any additional signal-enhancement algorithms. For each subject, individual amplification was determined using a loudness-based gain prescription rule (Oetting et al., 2016, 2018) that takes the individual binaural broadband loudness summation (Oetting et al., 2016) into account. It aims at restoring normal loudness perception. In the fitting procedure, narrowband loudness functions are estimated based on the participant's audiogram and a narrowband gain is applied to compensate for deviations from normal loudness perception (Suck et al., 2020). After the application of the narrowband gain, binaural broadband loudness functions are measured, and in case of deviations from normal loudness perception, a correction of the narrowband gain is carried out. This procedure results in gain values for input levels of 50, 65, and 80 dB SPL in six different frequency bands: 250, 500, 1000, 2000, 4000, and 6000 Hz (comparable to other HA fitting software). Based on these values, a fixed gain table for input levels from 0 to 120 dB SPL is generated and transferred to the PHL to set up the dynamic range compressor. Attack and release times of 50 and 500 ms were chosen, respectively.
In order to validate the individual amplification, the Loudness Validation Measurement (LVM; Exter et al., 2024; Jansen et al., 2020) was conducted. To detect deviations from normal loudness perception, it measures the aided loudness perception for natural signals in different frequency regions and for different levels. Using this procedure, gains can be corrected if the exerted loudness is not in the normal range after application of the loudness-based gain prescription rule.
Signal Enhancement Algorithms
For the provision types Ampl. & Coh, Ampl. & ADM and Ampl. & MVDR different signal-enhancement algorithms were activated in addition to individual amplification: The coherence filter (Coh; Grimm et al., 2009), the adaptive differential microphone (ADM; Elko & Pong, 1995), and the fixed Minimum Variance Distortionless Response beamformer (MVDR; Bitzer & Simmer, 2001). All signal processing was run with a sampling frequency of 16 kHz. A short-time Fourier transform (STFT) framework was used to conduct processing in the spectral domain that used frames with a length of 64 samples with additional zero-padding by 64 samples resulting in an STFT length of 128 samples.
The coherence filter is a noise-reduction algorithm that aims at improving the SNR by attenuating those spectral components in the audio signal that have a low spatial coherence, such as diffuse sounds. The coherence between the frontal left-ear and the frontal right-ear microphone signal was computed in 14 rectangular-shaped, non-overlapping frequency bands with center frequencies ranging from 250 to 8000 Hz in 1/3 octaves. The coherence was obtained by averaging the phase differences between the two microphone signals over short time segments using a time constant τ(f) of 3.5 ms for high frequencies decreasing to 200 ms for low frequencies. The coherence value C(f) was transformed into a short-term spectral gain value G(f) for each 64-ms (4-ms) STFT frame using a non-linear mapping G(f) = C(f)α(f), with α(f) values ranging from 0 to 1.34 roughly following the band importance function for the calculation of the SI index (ANSI, 1997). The choices for τ(f) and α(f) were adopted from Baumgärtel et al. (2015), the detailed values are found in the Appendix (Table A1). G(f) was applied in the respective frequency channel to the signals at both ears. The application of similar, real-valued gains at both sides enables the preservation of binaural differences.
Following the method introduced by Elko and Pong (1995) the ADM uses two microphone signals to generate two differential microphones (DM): a front-facing cardioid with a spatial zero pointing to the back and a back-facing cardioid with a spatial zero pointing to the front, respectively. To obtain the ADM the output of the back-facing DM is scaled with the adaptive weighting factor β and subtracted from the output of the front-facing DM. β is used to steer a spatial zero using a gradient-descent procedure, aiming at minimizing the sound energy at the output of the ADM. The position of the spatial zero is constrained to the back hemisphere by allowing the values of β to lie between 0 – resulting in a front-facing cardioid pattern—and 1—resulting in a figure-of-eight pattern. The ADM is a monaural directional filter, which means that in our bilateral setup the left and the right hearing device work independently. This might lead to a reduction in binaural information available to the listener due to the distortion of interaural-level differences.
The MVDR beamformer employed here is a fixed directional spectral-domain filter with a single beam directed in the frontal direction, as defined by its steering vector
Measurement Procedure
In this study, each participant attended three appointments. In the first appointment, an audiogram was recorded and imprints for the earmolds were taken. During the second appointment, to determine the individual amplification with the loudness-based fitting method, binaural broadband loudness functions were measured for each participant, the gains were then transferred to the PHL, and the participants conducted the aided LVM with the research HA to check if loudness normalization was achieved. Afterwards, SI and LE measurements were performed. To familiarize the participants with the measurement procedure, a training session was conducted during which they wore their own HAs. The training consisted of one OLSA measurement (i.e., one test list/10 sentences) with the subsequent LE rating in each of the six scenarios. In total, 60 OLSA sentences were presented in the training. Afterwards, measurements in the two conditions Unaided and Own HA were performed, with the measurement condition being randomized. Within each of the conditions the scenarios were also presented in a random order. During the third appointment the remaining four conditions Ampl. only, Ampl. & Coh, Ampl. & ADM and Ampl. & MVDR were measured, also in a randomized order, with the scenarios also being randomized. Before the actual measurements, the training was performed again for each scenario. This time, the participants were aided with the PHL, with amplification according to the loudness-based fit (Ampl. only condition), but no additional signal enhancement was activated.
In total, 36 SI measurements and 36 LE ratings were performed by each participant (training excluded), resulting from the combination of each scenario (None, S55, S55/C60, S65, S65/C60 and S65/C70) with each provision type (Unaided, Own HA, Ampl. only, Ampl. & Coh, Ampl. & ADM and Ampl. & MVDR). The first appointment took approximately 45 min per subject, the second and third appointments were longer with approximately 2 h. The elapsed time between the second and third appointment were scheduled to be approximately one week for all participants to avoid large differences in training between participants. The time between the first and second appointment was often longer and differed between participants.
All participants gave their written informed consent prior to inclusion in the study and received a monetary compensation for their participation. The experiment was approved by the ethics committee (“Kommission für Forschungsfolgenabschätzung und Ethik”) of the Carl von Ossietzky University in Oldenburg, Germany (Drs. EK/2019/032-02).
Statistical Analysis
In the experiments, SI was measured using word scoring, which means for each presented word we stored whether it was correctly repeated (1) or not (0). Per measurement condition 50 words had to be repeated, because each test list consisted of 10 sentences with five words each. The binary data was used for the statistical analysis. For the figures presented in this paper, the percentage of correctly repeated words in a measurement condition was calculated.
LE was measured as a single rating after each OLSA measurement. These ratings are used as input data for statistical analysis and are also presented in the figures.
Binomial Generalized Linear Mixed Model
To assess the effect of Provision Type and Scenario on SI scores, a binomial Generalized Linear Mixed Model (GLMM) was utilized for the statistical analysis. The dependent variable was the word intelligibility, i.e., 0 (not correctly repeated) or 1 (correctly repeated). A logit link function was used. The advantage of a binomial GLMM is that it does not assume a normal distribution and is therefore suitable to cope with data that contains ceiling and floor effects such as it is the case in this study. The fixed effects included in the model were Scenario and Provision Type and the interaction between the two (Scenario*Provision Type). We added a random effect for the subjects. Pairwise comparisons of Provision Types for each Scenario were performed using pairwise contrasts with Bonferroni-Holm correction, which is less conservative than Bonferroni correction. This fits the explorative nature of this study. Bonferroni-Holm-corrected p-values are indicated by p* during the remainder of this paper. The analysis was performed using IBM SPSS Statistics 29.
Analysis of Variance
To assess the effect of Provision Type and Scenario on LE ratings, we conducted an analysis of variance (ANOVA) using IBM SPSS Statistics 29. More specifically the repeated-measures design with two factors (Provision Type and Scenario) was performed. Data was tested for sphericity using Mauchly's test. According to Girden (1992), Greenhouse–Geisser correction is recommended if the severity of sphericity violation ɛ∗ is smaller than or equal to 0.75. This was the case for all our data. For post-hoc testing, two-sided t-tests for dependent samples with Bonferroni-Holm correction were applied. Effect sizes for the t-test results were calculated using Cohen's d, with
Correlation Analysis
To explore the relationship between SI and LE, we conducted a correlation analysis using Matlab R2021b. The Pearson correlation coefficient R was calculated. The probability p was used to determine whether the correlation was significant. As a critical value α = .05 was chosen. Significant correlations are denoted with asterisks, in which * indicates p < .05, ∗∗ indicates p < .01 and ∗∗∗ indicates p < .001.
Confidence Intervals for SI Data
To investigate differences in SI between participants and within participants for different measurement conditions, we computed 95%-confidence intervals for single data points. The underlying assumption is that a speech recognition experiment can be interpreted as a Bernoulli experiment, in which each word is either correctly (1) or incorrectly (0) repeated. For each data point the 95%-confidence boundaries were taken from a table for binomially distributed data in pages 434 and 435 of Sachs (1992). In the case of confidence intervals for benefit data, as opposed to absolute performance, also the uncertainty of the reference variable needs to be taken into account. We calculated the uncertainty
Results
Speech Intelligibility and Listening Effort Results
Figure 4 shows the SI results (word scoring, ordinate) for each scenario (panels A to F) and each provision type (abscissa). The dots mark the performance of single participants, the boxplots depict the median and interquartile range of the word scores. Outliers are defined as data points more than 1.5 times the interquartile range distant from the 25th and 75th percentile. For each provision type the median word scoring decreased with scenario complexity (from None to S65/C70), covering the whole range of ratings from 100% to 0%. For None (Figure 4, A), 15%–45% of the data were found at 100% SI, depending on provision type, which indicates a ceiling effect for this scenario. Floor effects were observed in S65/C70 (Figure 4, F), with up to 50% of the data being at 0% SI. We tested the data for normal distribution using the Shapiro-Wilk test at a significance level of 0.05. For S65 and S65/C60 data was normally distributed with one exception, while for all the other scenarios, no normal distribution was found. The results of the Shapiro-Wilk test can be found in the Appendix (Table A2). Furthermore, there is a trend visible that data spreads more in S65/C60 (Figure 4, C) and S65 (Figure 4, D) than in the others. This indicates larger individual differences for these scenarios.
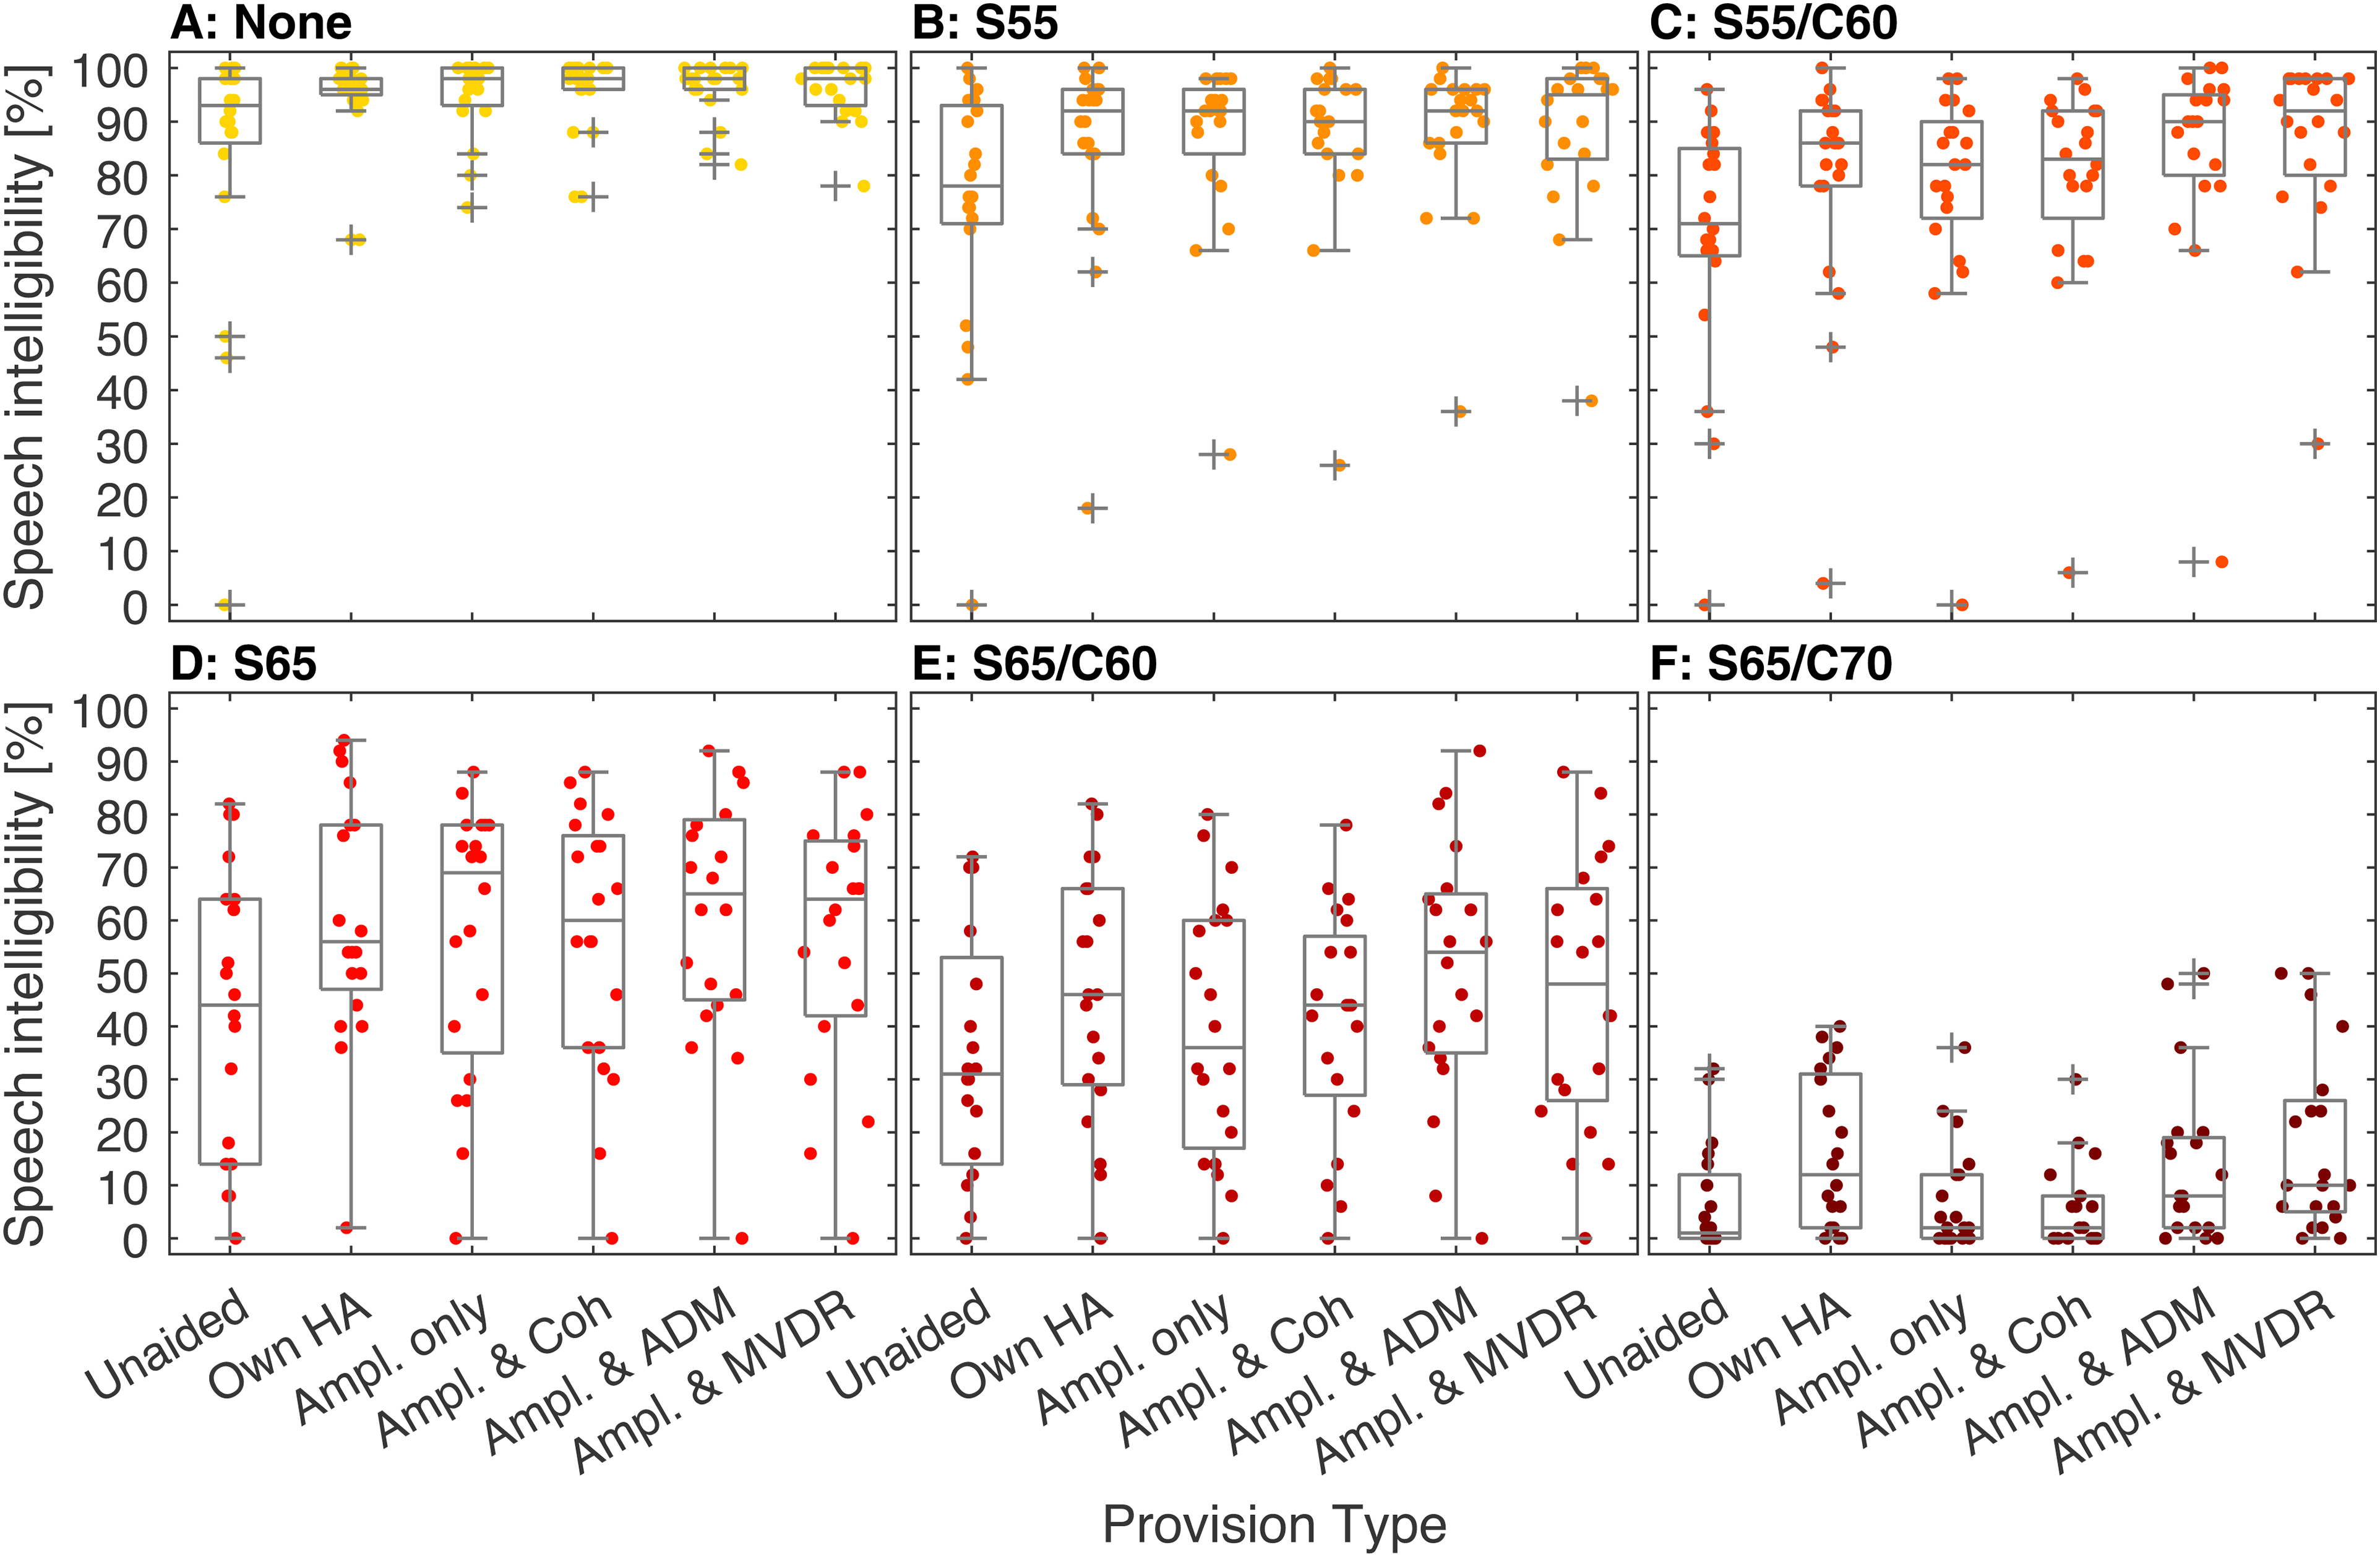
Speech intelligibility, expressed as word scoring in %, for each scenario (panels A–F) and each provision type. The colored dots show the single data points. In the boxplots the median and the 25th and 75th percentile are depicted. Outliers (+) are defined as data points more than 1.5-times the interquartile range distant from the 25th and 75th percentile.
In Figure 5, the LE results for each scenario and each provision type are depicted, in the same manner as for SI. Here, as expected, we observed an increase in median subjective LE rating with increasing scenario complexity. The whole range of ratings from 1 (“no effort”) to 13 ESCU (“extremely effortful”) was covered for each provision type. Floor and ceiling effects can be observed for None (Figure 5, A) and S65/C70 (Figure 5, F), indicating minimum and maximum LE. In None, between 15% and 30% of the LE results are at 1 ESCU, except in the condition Unaided with none of the results being at 1 ESCU. In S65/C70, between 50% and 80% of the results lie at 13 ESCU. The data was checked for normality with the Shapiro-Wilk test. Similarly to the SI data, the majority of the LE data was not normally distributed. The results of the Shapiro-Wilk test can be found in the Appendix (Table A3).

Listening effort, expressed in effort scaling categorical units (ESCU), for each scenario (panels A–F) and each provision type. The colored dots show the data points. In the boxplots the median and the 25th and 75th percentile are depicted. Outliers (+) are defined as data points more than 1.5-times the interquartile range distant from the 25th and 75th percentile.
Group Effect of Hearing-Aid Provision Type and Scene on Speech Intelligibility and Listening Effort
The binomial GLMM analysis of the SI data showed that all three fixed effects, Scenario, Provision Type, and Scenario*Provision Type were significant, with F(5, 684) = 114.862, p < .001 for Provision Type, F(5, 684) = 1628.619, p < .001 for Scenario, and F(25, 684) = 7.430, p < .001 for Scenario*Provision Type. To assess differences in SI between the provision types, we conducted pairwise contrasts separately for each scenario. The p*-values can be found in Table 3, along with the median SI difference ΔSI between the two corresponding measurement conditions. Positive values of ΔSI indicate that a better SI was achieved with a provision type in comparison to a reference (indicated by bold font in Table 3; e.g., in case of Unaided vs. Own HA a positive value indicates better SI with Own HA than with Unaided). Values for the test statistic can be found in the Appendix (Table A4). As shown in the Table 3, in the scenarios None, S55, S55/C60, and S65 HA provision always significantly improves SI, independently of the type of processing. In S65/C60, SI is significantly improved by all provision types except Ampl. only. In S65/C70, Ampl. only and Ampl. & Coh do not significantly improve SI.
Comparison of Speech intelligibility for Each Provision Type in Each Scenario.

Note. Every column shows the results from the pairwise contrasts for a specific scenario. The value of p* indicates a significant difference between two provision types. To account for multiple comparisons, Bonferroni-Holm correction was used. ΔSI denotes the median SI difference between the two measurement conditions. Positive values indicate a better SI compared to the reference indicated in bold print in the first column.
For most comparisons of Own HA and any other provision type, no significant differences were found. However, there are a few exceptions. In S55/C60 Ampl. & ADM and Ampl. & MVDR lead to significantly better SI than Own HA. In S65/C60, Own HA is significantly better than Ampl. only. Lastly, in S65/C70 Own HA leads to significantly better results than Ampl. only and Ampl. & Coh.
When comparing Ampl. only to measurement conditions with additional signal enhancement a pattern is visible. Ampl. & Coh does not improve SI significantly compared to Ampl. only, regardless of scenario. Ampl. & ADM and Ampl. & MVDR perform very similarly. They significantly improve SI in all scenarios including a diffuse noise, i.e., S55/C60, S65/C60, and S65/C70, but not in the case without noise (None) and in the presence of interfering talkers (S55, S65).
When comparing the signal enhancement algorithms with one another, no differences between Ampl. only & ADM and Ampl. only & MVDR are found. In the scenarios with diffuse noise both Ampl. & ADM and Ampl. & MVDR perform significantly better than Ampl. & Coh (except for Ampl. & MVDR in S65/C60, which is close to significance level).
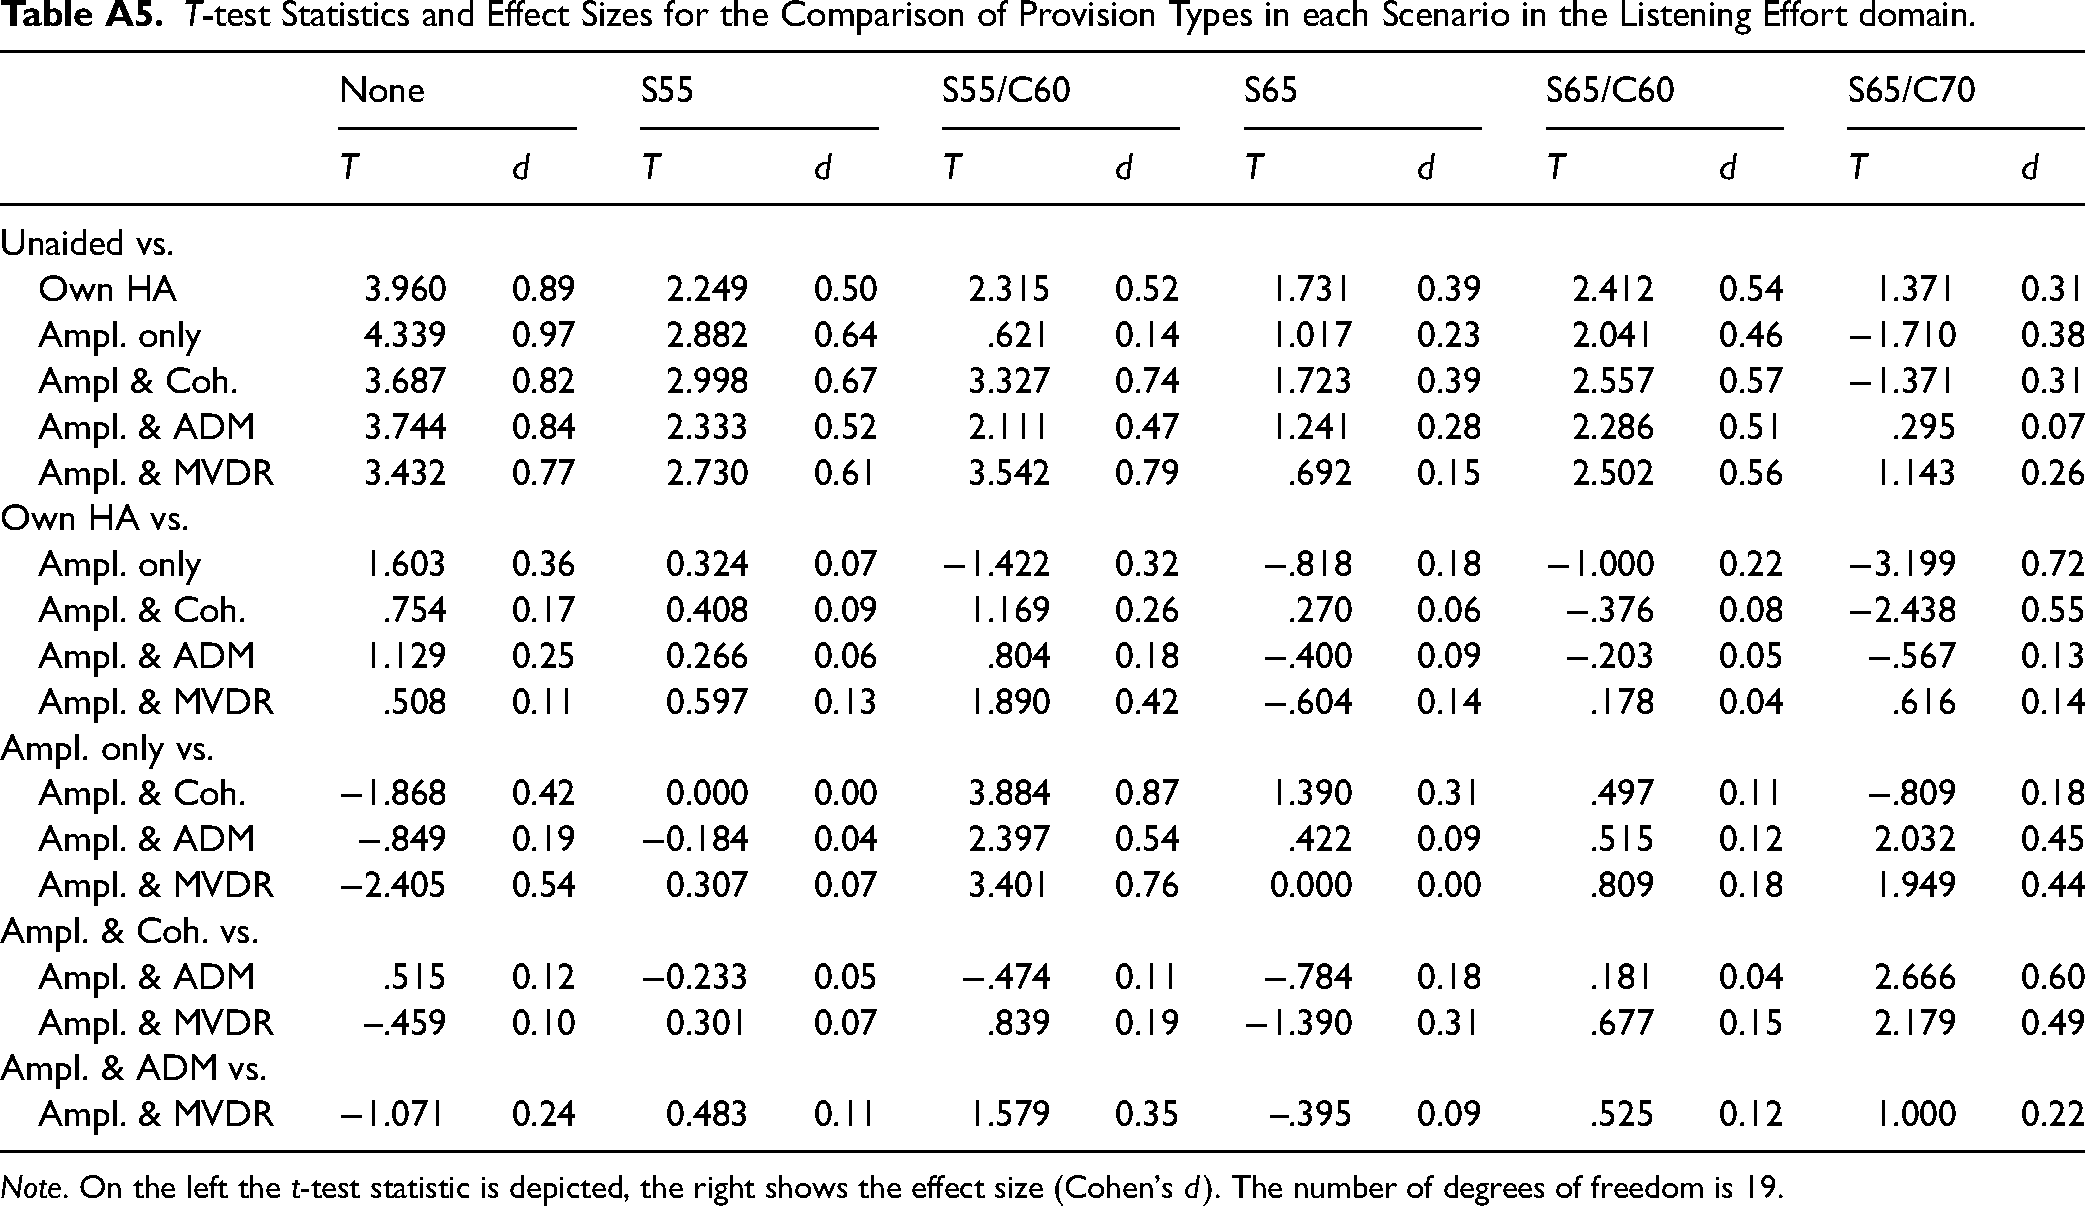
In the LE domain, we conducted a repeated measures ANOVA with the factors Scenario and Provision Type. We found a significant main effect (α = 0.05) of Provision Type, F(2.982, 56.660) = 6.077, p < .001, ɛ∗ = 0.596, and Scenario, F(2.373, 45.084) = 143.057, p < .001, ɛ∗ = 0.475, on LE ratings, as well as a significant interaction, F(8.383, 159.275) = 3.107, p = .002, ɛ∗ = 0.335. We conducted t-tests to compare between Provision Types in each Scenario. The p*-values can be found in Table 4, along with the median LE difference ΔLE between the two corresponding measurement conditions. T-test statistics and effect sizes can be found in the Appendix (Table A5). Positive values of ΔLE indicate that a better LE was achieved with a provision type in comparison to a reference (indicated by bold font in Table 4; e.g., in case of Unaided vs. Own HA a positive value indicates better LE with Own HA than with Unaided).
Comparison of Listening Effort for Each Provision Type in Each Scenario.

Note. Every column shows the results from the pairwise t-tests for a specific scenario. The value of p* indicates a significant difference between Two provision types. To account for multiple comparisons, Bonferroni-Holm correction was used. ΔLE denotes the median LE difference between the two measurement conditions. Positive values indicate a lower LE compared to the reference indicated in bold print in the first column.
In most cases the measurement conditions did not significantly differ from one another. However, there are a few exceptions. In the scenario None, HAs significantly improved LE compared to Unaided, independently of the type of HA processing. In S55/C60, LE was significantly improved by Ampl. & Coh as well as Ampl. & MVDR compared to Unaided. Also, Ampl. & Coh and Ampl. & MVDR led to better results compared to Ampl. only.
Correlation of Speech Intelligibility and Listening Effort Benefit
To further explore LE as an additional measure beyond SI, SI, and LE benefits (compared to unaided) were correlated (α = 0.05). Figure 6 shows the Pearson correlation coefficients, coded by color, for all scenarios and HA Processing Types (i.e., Own HA, Ampl. only, Ampl. & Coh, Ampl. & ADM, Ampl. & MVDR). Significant correlations are marked by * for p < .05, ** for p < .01 and *** for p < .001, respectively. For the two directional-filtering conditions Ampl. & ADM and Ampl. & MVDR, correlations reached significance in all scenarios except S65/C70. In the other two conditions Ampl. only and Ampl. & Coh significant correlations were only found for the least-difficult scenarios (None and S55). SI and LE benefits were significantly correlated in S55/C60, S65, and S65/C70 for the measurements with the participants’ own HAs. The squared correlation coefficient (coefficient of determination, R2) for the significant results ranged from 0.21 to 0.64, meaning that between 21% and 64% of the variance in LE benefits can be accounted for by SI benefits. All significant correlation coefficients are positive, which shows that a positive benefit in SI is associated with a positive benefit in LE.

Correlation of speech-intelligibility and listening-effort benefit in all scenarios and HA Processing Types. The color in each panel (color scale on the right) depicts the Pearson correlation coefficient R. Significant correlations are marked by * for p < .05, ** for p < .01 and *** for p < .001, respectively.
Individual Effect of Hearing-Aid Processing Type and Scenario on Speech Intelligibility Benefit
In the following, we present SI results from four specific participants that differed markedly in the characteristics of the benefit obtained in the different HA Processing Types, see Figure 7. The results of all participants can be found in the Appendix (Figure A1). Please note that LE results are not analyzed here, since the ESCU values are based on only one rating for each condition and thus are not appropriate for individual statistical analysis. For each subject, the benefit from amplification is shown on the abscissa and the additional benefit from the signal-enhancement algorithm is shown on the ordinate. To calculate the amplification benefit, the Unaided scores were subtracted from Ampl. only scores. To obtain the additional benefit from signal-enhancement algorithms, the Ampl. only score was subtracted from the respective score obtained with the Coherence filter, the ADM or the MVDR beamformer. Please note that this is different from benefit calculations in the group-based analysis, in which a benefit was always defined with respect to Unaided. Each symbol represents a different algorithm (Coh, ADM, and MVDR) and each color denotes a different scenario (least complex scenario in yellow, most complex scenario in brown). The 95%-confidence intervals of the benefits are depicted as whiskers (see Section Statistical Analysis for more information). In most cases the characteristic differences become obvious in moderate to high complexities (S65, S65/C60, S65/C70), that are denoted by red, dark red, and brown symbols, respectively.
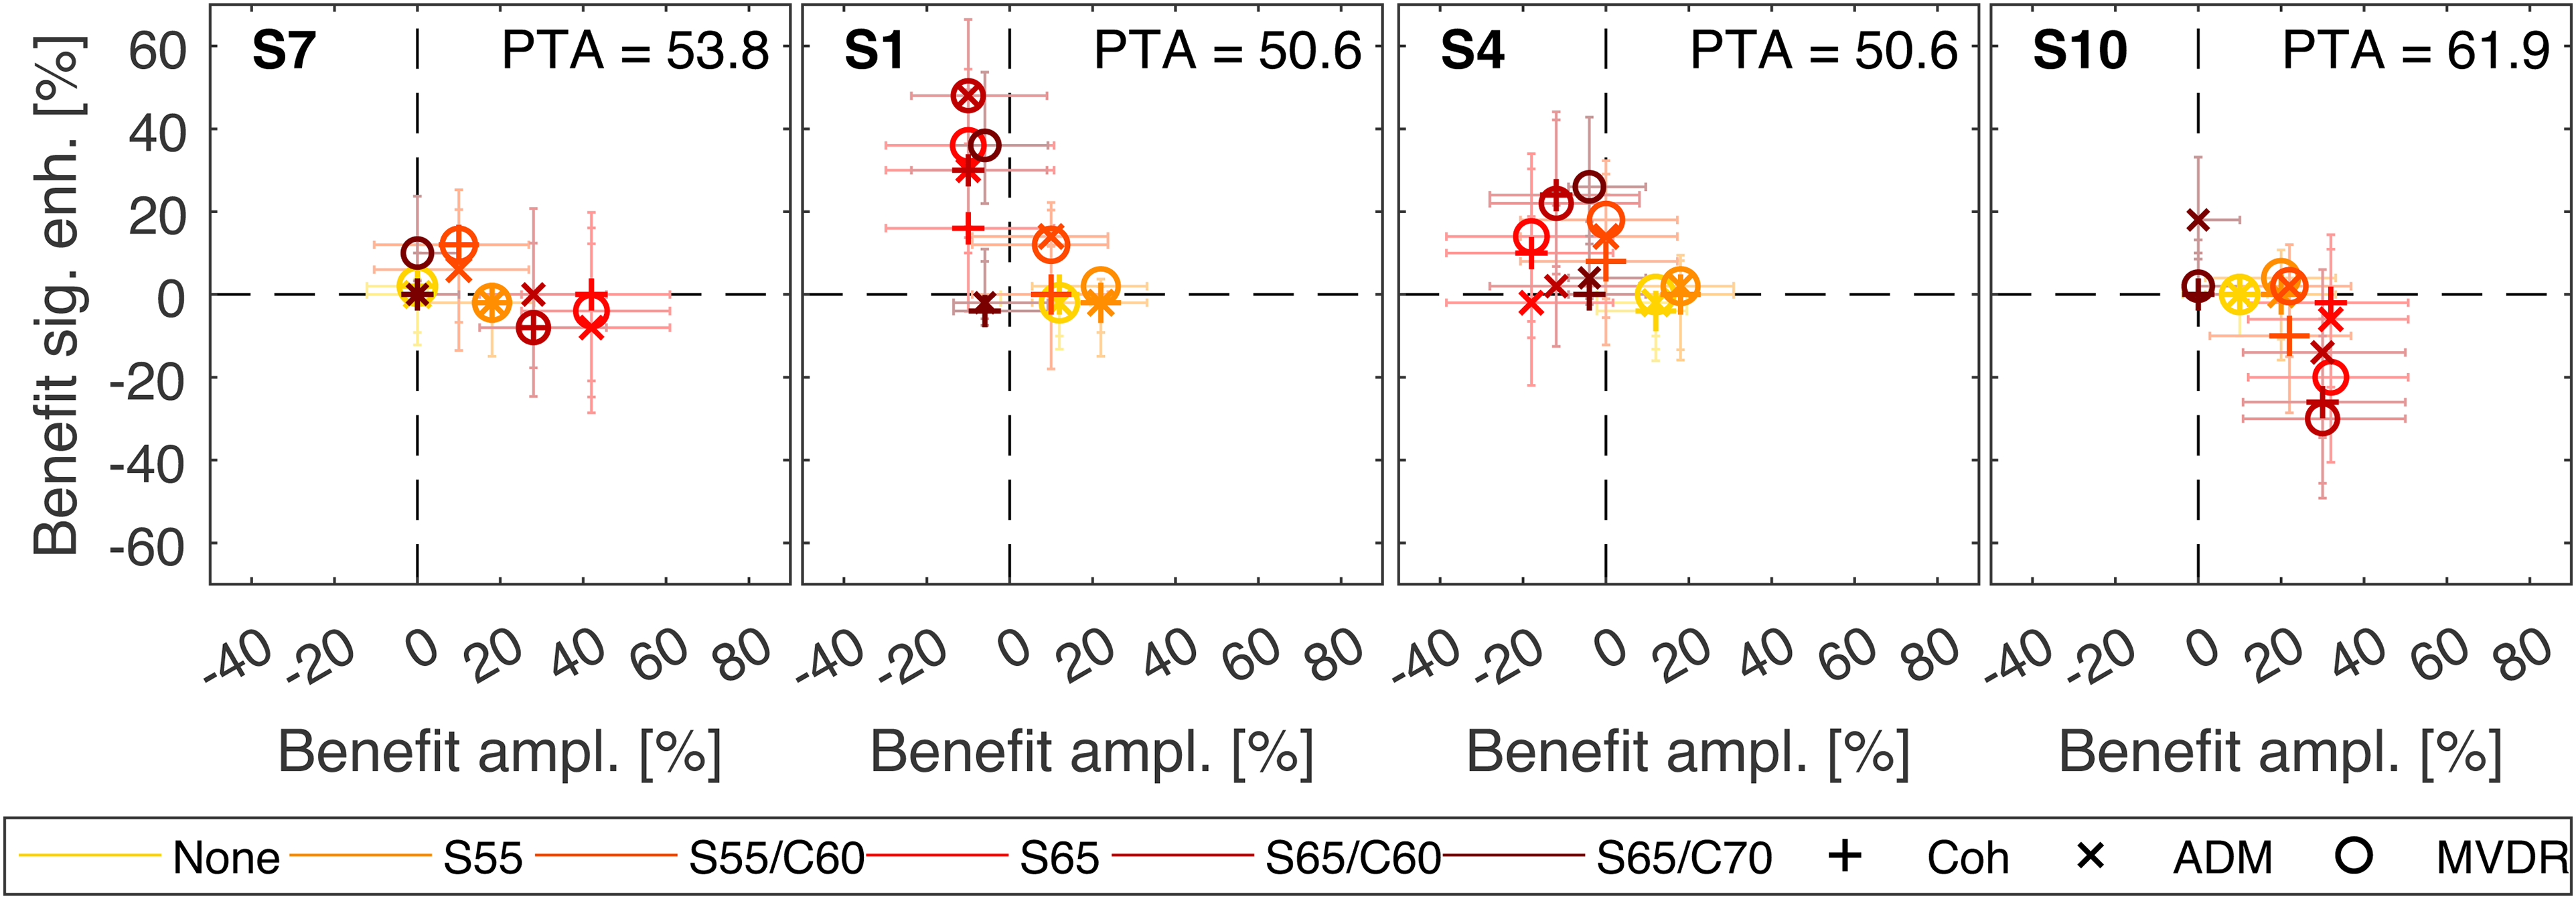
Individual amplification and signal-enhancement algorithm benefit in terms of SI for participants 7, 1, 4, and 10. Abscissa: benefit from amplification, Ordinate: additional benefit from signal-enhancement algorithms (coherence filter, Adaptive Differential Microphone (ADM) and Minimum Variance Distortionless Response (MVDR) beamformer). The different scenarios are marked by different colors, algorithms are marked by symbols. The whiskers show the 95% confidence intervals.

Individual amplification and signal-enhancement algorithm benefit in terms of SI. Abscissa: benefit from amplification, Ordinate: additional benefit from signal-enhancement algorithms (coherence filter, Adaptive Differential Microphone (ADM) and Minimum Variance Distortionless Response (MVDR) beamformer). The different scenarios are marked by different colors, algorithms are marked by symbols. The whiskers show the 95% confidence intervals.
S7: Subject 7 mostly benefitted from amplification alone. For this person, signal-enhancement algorithms do not provide a large additional benefit; in some cases they can even lead to a decrease in SI.
S1: For Subject 1, a benefit from amplification alone was limited to scenarios with low complexity. In more complex scenarios, amplification alone did not provide a benefit, but the addition of signal-enhancement algorithms, in particular direction filtering, did lead to a large increase in SI.
S4: Similarly to subject 1, subject 4 profited from amplification in scenarios with low complexity and from additional signal- enhancement algorithms in scenarios with higher complexity. However, here the type of signal enhancement played an important role, as the subject profited from the binaural MVDR beamformer much more than from the (bilateral) monaural ADM.
S10: Subject 10 profited from amplification, but obtained no notable additional benefit from signal-enhancement algorithms. In S65/C60, the use of signal-enhancement algorithms even resulted in a large decrease in SI. This was also observed for the MVDR beamformer in S65.
Discussion
Relevance of Scenarios for Real Life
In this study, we developed complex acoustic scenes with the aim to assess HA benefit in environments that are closer to real life than common lab measurements. Our scenes include acoustic features that are often present in the real world, such as a reverberation, fluctuating sounds from different directions and informational masking. These features are known to affect speech reception (e.g., Best et al., 2017; Kidd, 2017; Ricketts, 2000). Therefore, we can assume that our scenarios are more informative for real-life listening than traditional laboratory setups, even though we did not compare outcomes of our complex scenarios with outcomes of such traditional measurements. We used two types of noise configurations, which were combined in some of the scenarios: localized interfering ISTS talkers from ±60° and a diffuse cafeteria noise. Scenarios containing only the interfering talkers from left and right (S55 and S65) are similar to a small gathering with family or friends. The other scenarios are closer to listening in crowded public spaces, such as a cafeteria or a restaurant.
In addition to the noise type, spatial arrangement, and room acoustics, the scenarios are characterized by the SNR at which speech and noise were presented. According to Smeds et al. (2015) people with hearing impairment mostly spend their time in listening situations with a positive SNR. In our study, half of the scenarios under test (None (in which no noise was present), S55, and S55/C60) involved a positive SNR. The others had a negative SNR, which might influence their relevance for real life. Mansour et al. (2021) systematically analyzed listening environments based on ecological momentary assessment data and categorized them into three types of scenarios: common, difficult, and important. One environment that fell into all three categories was a workspace meeting. For a detailed assessment, they staged a workspace meeting including 12 participants conversing in pairs at a table. SI in noise was measured at a fixed SNR of −2.5 dB. The SNR was chosen on the basis of another study by the same authors (Mansour et al., 2019), in which −2.5 dB was found to be the median conversational SNR in the workspace meeting. Their SNR of −2.5 dB was rather close to that of the S65 scenario with −3.2 dB. In another study, Weisser and Buchholz (2019) measured conversational SNRs in different realistic noise scenarios. They found that for a fixed distance of 1 m between two talkers, negative SNRs are observed for noise levels above 66 dB SPL (women) and 69 dB SPL (men). These studies indicate that listening situations with negative SNRs can be ecologically valid. In our most difficult scenario S65/C70 the SNR was −6.8 dB and the percentage of correctly repeated words was not higher than 50% for all participants. It is very unlikely that hearing-impaired people would try to have a conversation in such an environment, so the relevance for real-life is assumed to be low.
Speech Intelligibility and Listening Effort Results
We measured SI as well as LE. Our results both cover the whole range of possible scores/ratings. Hence, the acoustic scenarios designed for this study cover a wide range of difficulty from None, being on average the easiest, to S65/C70, being on average the hardest. On the one hand, this yields ceiling and floor effects that can limit the informative value of statistical analyses, but on the other hand it ensures a constant SNR in each scenario and hence comparability of the HA signal processing across participants. Further, as opposed to an adaptive measurement, a constant SNR was chosen to make the scenarios as realistic as possible, and keep them close to the application scenarios of HAs. Adaptive measurement procedures that are typically used for SI and LE measurements mean that the SNR varies from one subject to another for the same measurement condition. Consequently, HA processing algorithms would be compared at different operation points. It would remain unclear which effects on the results should be attributable to the limits of a signal enhancement method, and which effects could be attributed to the individual. Here, we saw large differences in the spread of the SI results, in particular for the rather complex scenarios S65 and S65/C60 where localized interfering sources dominated. This suggests that spatial information in the output signal of a HA and the way it is affected by a signal enhancement method is a highly individual factor for speech reception.
Group Effect of Hearing-Aid Provision Type
Speech Intelligibility
We found a benefit of Ampl. only compared to Unaided for the scenarios None to S65. This is in line with studies by Mansour et al. (2022) and Best et al. (2015), who also assessed the effect of HA amplification on SI in complex acoustic environments and found a benefit of amplification. In the difficult scenarios S65/C60 and S65/C70 we did not observe a significant improvement for Ampl. only. Compared to S55/C60 these two scenarios only differed in SNR, which suggests that the benefit of HA amplification disappears toward low (negative) SNRs. In Mansour et al. (2022) SI was reported in terms of SRTs, which were measured by adapting the level of the speech. The majority of unaided and aided SRTs were at positive SNRs, with the lowest SRT being approximately −2 dB SNR. This means that the authors did not assess SI at SNRs as low as in the current study (S65/C60: −3.6 dB; S65/C70: −6.8), which could explain the discrepancy to our results in the scenarios S65/C60 and S65/C70. Furthermore, data shown in Best et al. (2015) suggest that the SRT improvement due to HA provision is highest for high unaided SRTs and decreases toward low (negative) SRTs, which also supports our assumption about the benefit of amplification depending on the SNR.
For most measurement conditions, no significant difference was observed between the participants’ own HAs and the PHL. This shows that the PHL performs similarly to a commercial HA in perceptual experiments, which supports the deployment of the PHL in future research. There were however a few exceptions, for which differences between the PHL and the commercial HAs were found. In scenario S55/C60, Ampl. & ADM and Ampl. & MVDR performed significantly better than Own HA. One reason for this might be that many commercial HAs analyze the acoustic environment and automatically activate/deactivate signal processing features depending on the analysis. For additional signal enhancement, such as directional filtering, to be activated, an according sound environment needs to be detected, e.g., by a scene classifier in the HA, which is more likely for scenes with higher complexity and low SNR. We did not have access to this functionality in commercial hearing devices and have to regard them as black-box systems. We speculate that in the less complex scenario S55/C60 the activation of advanced signal enhancement features occurred rather rarely and therefore directional filtering was not active, which might explain the significant difference between Own HA and Ampl. & ADM / Ampl. & MVDR. In the two most difficult scenarios, a difference between Own HA and Ampl. only (S65/C60 and S65/C70) as well as Own HA and Ampl. & Coh. (S65/C70) was observed. In these scenarios with a negative SNR, additional signal enhancement features were likely activated in the participants’ HAs, which might explain the difference.
In scenarios with diffuse noise, amplification combined with directional filtering (Ampl. & ADM, Ampl. & MVDR) led to a higher benefit in SI than amplification alone (Ampl. only). A benefit of directional filtering over amplification alone has also been shown by other studies, such as Picou and Ricketts (2017) and Gnewikow et al. (2009) which illustrates that directional filtering plays an important role in HA provision. In S55 and S65 such a benefit was not observed, which might be explained by the placement of the localized interferers. The ADM is constrained to suppress noise in the rear hemisphere, but in this study the ISTS interferers were placed in the front hemisphere at ±60°. The MVDR beamformer used here is optimized for diffuse noise. As expected that it would perform best in the diffuse-noise scenarios. The results for the MVDR beamformer are in line with the findings by Baumgärtel et al. (2015), who assessed the performance of different signal enhancement strategies with objective measures in different complex listening scenarios. They also found that the MVDR beamformer achieved the best performance in scenarios with diffuse noise.
With regard to spatial filtering versus spectral filtering, we found a significant difference between both Ampl. & ADM / Ampl. & MVDR and Ampl. & Coh in scenarios with diffuse noise. From this, it can be concluded that directional filters provide a larger benefit for SI compared to spectral filtering in complex scenarios. In practice, directional filters are often used in combination with a spectral post filter, which was not done in this study.
The two types of directional filters (ADM and MVDR beamformer) did not differ significantly from one another. The MVDR is a binaural directional filter, which means that the inputs from the microphones at the left and the right ear are processed together. This leads to a high SNR improvement but at the cost of binaural information. The ADM is a monaural directional filter, meaning that the left and the right HA input signals are processed independently. Thus, on the one hand the SNR improvement that can be achieved with the ADM in the scenarios used here is lower compared to the MVDR beamformer, but on the other hand binaural cues are maintained to a certain degree in contrast to the MVDR beamformer. Both directional-filtering strategies perform similarly on average, showing that a large SNR improvement does not necessarily lead to a large SI improvement. The large inter-individual differences rather indicate that the choice of the optimal directional filter depends on the individual subject. Our findings are similar to the observations by Völker et al. (2015). They also measured SI with hearing-impaired participants provided with a research HA. Hearing loss was compensated using a NAL-NL1 first fit. Additionally, the ADM or the MVDR beamformer were applied. The authors also performed the OLSA in complex noise environments (e.g., ambient cafeteria noise) and found no significant difference between the benefit obtained with ADM and the MVDR beamformer.
Listening Effort
For LE we found a significant benefit of HA provision for the scenario None. All types of HA processing reduced LE compared to Unaided. This was expected since a HA improves audibility of speech, which is the only sound source in this scene. In almost all measurement conditions with noise (S55 to S65/C70) there were no differences between Unaided and the aided conditions. Ohlenforst et al. (2017) conducted a systematic review of articles investigating the effect of HAs on LE. They found mixed results for the benefit of HA amplification for subjective LE, with some studies observing a benefit, while others did not. These discrepancies may occur due to different measurement paradigms being used.
No difference between the measurements with the PHL and with the participants’ own HAs were observed. This indicates that also in the LE domain the PHL performs similarly to commercial HAs.
In general, LE results for the different PHL conditions were very similar. Only in two cases we did observe a significant difference between provision types: In S55/C60, where Ampl. & MVDR and Ampl. & Coh perform better than Ampl. only. Desjardins (2016) also compared subjective LE for different types of HA processing. Similar to our study, participants rated LE on a scale. Speech was presented from the front and a multi-talker babble noise from the back. They found no difference between the types of processing (only amplification, directional filtering and spectral filtering (noise reduction)), which is in line with the results from our study. A contradictory result was found by Luts et al. (2010). They assessed the benefit of directional and spectral filtering on LE in real office rooms across different test sites. Speech was presented in a pseudo-diffuse noise field at different SNRs. When averaged across test sites, they found a significant benefit of directional filtering for LE compared to only amplification for a wide range of SNRs. This is also in contrast to our study results, where only in one scenario (with an SNR of 3.2 dB) a benefit of directional filtering over amplification alone was observed. With regard to spectral filtering, Luts et al. (2010) only found a benefit at 0 dB SNR, which is more in line with the results from our study. One reason for the discrepancy between study results may be the type of listening environment. All studies used different types of background noise, which might have interacted differently with the signal processing in the HAs. Also, the methods used to assess LE differed between studies. In the study of Luts et al. (2010) LE was rated in a total of 30 measurement conditions (different SNRs, types of HA processing) that were presented back-to-back, which makes a comparison across measurement conditions, and therefore an adaptation of the rating possible. In the study of Desjardins (2016) and in the current study LE was rated subsequently to a speech reception measurement, asking how effortful listening during the speech reception task was. Here, the ratings of the different measurement conditions are further apart in time and participants have another task in between, which might lead to a more absolute rating of LE rather than comparing LE across conditions.
Correlation of SI and Listening Effort
To further investigate the role of subjective LE as a measure beyond SI, we examined correlations between LE and SI benefits. For measurements performed with directional filters (Ampl. & ADM and Ampl. & MVDR) significant correlations were found in most scenarios. For measurements without directional filters (Ampl. only and Ampl. & Coh) we only saw significant correlations of SI and LE benefits in the least difficult scenarios None and S55. The reasons for this remain unclear. One might conclude that if directional filtering does not help with SI, it will not help with LE either. However, even if no improvement in SI can be achieved with the HA, it is possible that amplification and spectral filtering yield an improvement in LE.
In contrast to our findings, which showed significant correlations between LE and SI for several HA processing types and scenarios, Krueger, Schulte, Zokoll et al. (2017) found no correlation between SI and LE benefit when measured with HAs. However, in that study a co-located presentation of speech and noise from the front was used. They also only examined the relationship for effortless and extremely effortful listening situations, with the participants using their own HAs. When looking at our measurement conditions that are closest to the study design of Krueger, Schulte, Zokoll et al. (2017), which are Own HA in the scenarios None and S65/C70, also no significant correlations were observed. Overall the results show that the role of LE as a measure of HA benefit beyond SI depends on the listening scenario and the HA processing.
Individual Effect of Hearing-Aid Processing Type and Scenario on SI Benefit
An examination of the individual SI scores of specific participants showed how different the reaction to different kinds of HA processing can be: We found a subject (S7) who profited mostly from amplification, but additional signal enhancement did not lead to further improvement. For another subject (S10) additional signal enhancement had a large detrimental effect in some scenarios. Yet another subject (S1) mostly did not benefit from amplification, but signal-enhancement algorithms had a large benefit. We also found that the type of directional filter can play a role. One subject (S4) obtained a much larger benefit from the binaural directional filter MVDR than from the monaural directional filter ADM. Since all four participants had similar PTAs, these differences in benefit for the different HA processing types cannot be attributed to differences in hearing threshold. They might, however, be attributed to the ability to make use of binaural cues. Binaural cues are disrupted by the directional filters, especially the MVDR, with the aim to achieve a large SNR improvement. We hypothesize that S7 and S10 had access to binaural cues, and used them to analyze the listening environment, whereas S1 and S4 could not use binaural cues to the same extent and were therefore better aided by directional filters that provided a large SNR improvement. Not only might the use of binaural cues play a role in signal-enhancement benefit, however, cognitive abilities also seem to be associated with it. It was shown by Keidser et al. (2013) that auditory selective-attention abilities and the benefit obtained by directional processing in HAs are correlated. Poorer selective attention was associated with more perceptual benefit from directional filtering.
Limitations
We see some limitations to our study, as follows. In acoustic scene design, there is always a trade-off between control over the measurement procedure and realism of the scene. To allow for accurate results and comparability, it was important for us that the SNR remained constant throughout each measurement. This excluded highly fluctuating stimuli, such as music and transient sounds. Also, no visual stimuli were presented in this study. However, according to Sumby and Pollack (1954), the visual component is important in conversational situations. This is especially true for hearing-impaired people (Puschmann et al., 2019), and can increase SRTs by 20% or more (Neely, 1956). In this regard, our scenarios (as in most listening experiments) lack a form of realism.
Due to restrictions in measurement time we carried out only 10 trials per SI measurement. Therefore, confidence intervals for the measurement points were relatively large. For future studies looking more into individual data, more trials per measurement are recommended. In terms of LE measurement, the ACALES (Krueger, Schulte, Brand et al., 2017) procedure, which adaptively measures the subjective LE function for different SNRs, could be applied to achieve more reliable and informative results for individual analysis.
Furthermore, we observed ceiling- and floor-effects in the measurement results. This could be avoided by using an adaptive procedure and estimating the complete psychometric functions from measurements at different positions. However, the measurement effort per subject would be noticeably increased which makes it desirable to decrease the number of measurement conditions.
Conclusions
In this study, we assessed the benefit of hearing-aid amplification and signal enhancement algorithms on speech intelligibility and listening effort in complex acoustic scenarios with a research hearing aid. Our most important findings are:
The PHL is a suitable representation of a commercial hearing aid for measuring SI and LE in a research study. Directional filtering in addition to amplification provides, on a group level, an increased benefit in SI in challenging acoustic scenarios compared to non-directional methods. User-specific selection of signal enhancement algorithms, as fitting parameters beyond amplification and dynamic range compression, is required to maximize individual speech reception benefit. The value of LE as a measure for hearing-aid benefit beyond SI depends on the listening scenario and signal enhancement strategy.
Footnotes
Acknowledgments
We would like to thank Kirsten Wagener and Inga Holube for their advice on the statistical analysis and Julia Zimmer for her support with the preparation of the experimental setup and for carrying out the subject measurements.
Data Availability Statement
Research data for this article are available from the corresponding author upon reasonable request.
Declaration of Conflicting Interests
The authors declared no potential conflicts of interest with respect to the research, authorship, and/or publication of this article.
Funding
This work was funded by the Deutsche Forschungsgemeinschaft (DFG, German Research Foundation) under Germany's Excellence Strategy—EXC 2177/1—Project ID 390895286.
Notes
Appendix
T-test Statistics and Effect Sizes for the Comparison of Provision Types in each Scenario in the Listening Effort domain.
| None | S55 | S55/C60 | S65 | S65/C60 | S65/C70 | |||||||
|---|---|---|---|---|---|---|---|---|---|---|---|---|
| T | d | T | d | T | d | T | d | T | d | T | d | |
| Unaided vs. | ||||||||||||
| Own HA | 3.960 | 0.89 | 2.249 | 0.50 | 2.315 | 0.52 | 1.731 | 0.39 | 2.412 | 0.54 | 1.371 | 0.31 |
| Ampl. only | 4.339 | 0.97 | 2.882 | 0.64 | .621 | 0.14 | 1.017 | 0.23 | 2.041 | 0.46 | −1.710 | 0.38 |
| Ampl & Coh. | 3.687 | 0.82 | 2.998 | 0.67 | 3.327 | 0.74 | 1.723 | 0.39 | 2.557 | 0.57 | −1.371 | 0.31 |
| Ampl. & ADM | 3.744 | 0.84 | 2.333 | 0.52 | 2.111 | 0.47 | 1.241 | 0.28 | 2.286 | 0.51 | .295 | 0.07 |
| Ampl. & MVDR | 3.432 | 0.77 | 2.730 | 0.61 | 3.542 | 0.79 | .692 | 0.15 | 2.502 | 0.56 | 1.143 | 0.26 |
| Own HA vs. | ||||||||||||
| Ampl. only | 1.603 | 0.36 | 0.324 | 0.07 | −1.422 | 0.32 | −.818 | 0.18 | −1.000 | 0.22 | −3.199 | 0.72 |
| Ampl. & Coh. | .754 | 0.17 | 0.408 | 0.09 | 1.169 | 0.26 | .270 | 0.06 | −.376 | 0.08 | −2.438 | 0.55 |
| Ampl. & ADM | 1.129 | 0.25 | 0.266 | 0.06 | .804 | 0.18 | −.400 | 0.09 | −.203 | 0.05 | −.567 | 0.13 |
| Ampl. & MVDR | .508 | 0.11 | 0.597 | 0.13 | 1.890 | 0.42 | −.604 | 0.14 | .178 | 0.04 | .616 | 0.14 |
| Ampl. only vs. | ||||||||||||
| Ampl. & Coh. | −1.868 | 0.42 | 0.000 | 0.00 | 3.884 | 0.87 | 1.390 | 0.31 | .497 | 0.11 | −.809 | 0.18 |
| Ampl. & ADM | −.849 | 0.19 | −0.184 | 0.04 | 2.397 | 0.54 | .422 | 0.09 | .515 | 0.12 | 2.032 | 0.45 |
| Ampl. & MVDR | −2.405 | 0.54 | 0.307 | 0.07 | 3.401 | 0.76 | 0.000 | 0.00 | .809 | 0.18 | 1.949 | 0.44 |
| Ampl. & Coh. vs. | ||||||||||||
| Ampl. & ADM | .515 | 0.12 | −0.233 | 0.05 | −.474 | 0.11 | −.784 | 0.18 | .181 | 0.04 | 2.666 | 0.60 |
| Ampl. & MVDR | –.459 | 0.10 | 0.301 | 0.07 | .839 | 0.19 | −1.390 | 0.31 | .677 | 0.15 | 2.179 | 0.49 |
| Ampl. & ADM vs. | ||||||||||||
| Ampl. & MVDR | −1.071 | 0.24 | 0.483 | 0.11 | 1.579 | 0.35 | –.395 | 0.09 | .525 | 0.12 | 1.000 | 0.22 |
Note. On the left the t-test statistic is depicted, the right shows the effect size (Cohen's d). The number of degrees of freedom is 19.