
Abstract
This study compared the behavioral minimum audible angle (MAA) and the electrophysiological acoustic change complex (ACC) elicited by an azimuthal shift in sound location. To examine age effects, 63 participants with normal or near-normal hearing were divided into three age groups (Young, Mid-Aged, and Older). The stimuli were narrow bands of noise centered at 500 Hz to facilitate reliance on primarily binaural temporal cues. Putative spatial location was manipulated by means of head-related transfer functions under headphones. MAA results showed that performance was dependent on the reference location, with performance becoming poorer as the reference location shifted away from midline. The Young group had smaller MAAs than the Older group, and performance of the Mid-Age group was intermediate. Measurement of the ACC was restricted to shifts away from midline, and results showed no ACC for shifts of 4.5° and 9° but present ACCs for shifts of 13.5°, 18°, and 36°. The robustness of the ACC, as measured with the intertrial phase coherence metric, grew with increasing azimuthal shift. For shifts of 13.5° and 18°, Young participants had more robust ACCs than Older participants. Although age-related deficits were found in both the MAA and in the robustness of the ACC, no associations were observed at the individual level between MAA and ACC measures. Further work is necessary to evaluate the ACC elicited by shifts from off-midline reference locations before a firm conclusion can be reached that the ACC is not a viable objective proxy for the MAA.
Introduction
This study examined the question of whether an objective measure of spatial discrimination can be used as a proxy measure for behavioral spatial discrimination in the context of age-related degradations in spatial hearing. The study compared the acoustic change complex (ACC) elicited by an azimuthal shift in source location to the behavioral minimum audible angle (MAA).
Auditory spatial acuity can be gauged by measuring the MAA—the smallest angular shift from a reference location that can be detected. When measured in the horizontal plane, sensitivity to an azimuthal shift is most acute for a midline reference (0°), and declines as the reference location moves further away from midline (Mills, 1958). Spatial sensitivity to location also depends on the spectral content of the stimulus. For example, Abel et al. (2000) showed that, across a wide age range, localization performance was better for a wide-band noise than for narrow bands of noise restricted to either the low frequencies or the high frequencies. This is because wide-band noise allows for utilization of both interaural level difference (ILD) cues—dominant for high frequencies—and interaural time difference (ITD) or interaural phase difference (IPD) cues—dominant for low frequencies (e.g., Macpherson & Middlebrooks, 2002). Restricting the stimulus to low frequencies is appropriate when the interest is primarily in evaluating the role of temporal processing in spatial acuity.
One area where the interplay of temporal processing and spatial acuity is important is in the study of age-related degradations in binaural hearing. There is substantial evidence that binaural temporal processing, including the use of ITD and IPD cues, declines with age (e.g., Eddins & Eddins, 2018; Fullgrabe et al., 2018; Grose et al., 2025; Grose & Mamo, 2012; Kane et al., 2021; Ozmeral et al., 2016; Sammeth et al., 2025). By extension, a concomitant age-related decline in spatial hearing is expected (e.g., Abel et al., 2000; Briley & Summerfield, 2014; Dobreva et al., 2011; Freigang, Schmiedchen, et al., 2014; Sammeth et al., 2025). For example, the study by Abel et al. (2000) showed that localization performance declined systematically with age and that this was particularly striking for low-frequency stimuli. With specific reference to the MAA, Freigang, Schmiedchen, et al. (2014) found that older listeners had significantly poorer thresholds than young adults for all reference locations of a 500-Hz narrow band of noise (±9°, ±30°, ±64°). Sammeth et al. (2025) also found age-related deficits in MAA for low-frequency noise bands, especially for off-midline reference locations. A challenge in interpreting some studies of age-related degradations in auditory processing, including spatial hearing, is that they do not always clearly differentiate between effects of age and effects of hearing loss (presbycusis). For example, Briley and Summerfield (2014) measured the MAA for pink noise in young adults with normal hearing, “younger-old” adults with mild high-frequency loss, and “older-old” adults with moderate high-frequency loss. Whereas the young and “younger-old” adults performed relatively similarly, the “older-old” adults showed elevated MAA thresholds, particularly for the off-midline reference locations; however, the authors acknowledged that these group differences could not be clearly attributed independently to either age or hearing loss. In contrast, Sammeth et al. (2025) carefully controlled for these two factors and established that age, independent of hearing loss, does result in deficits in MAA. One purpose of the present study is to further investigate age-related effects in MAA performance while controlling for hearing status.
Whereas the MAA is traditionally measured with a behavioral task, there is increasing interest in the development of an electrophysiological test that can gauge the capacity for spatial discrimination without active participant involvement—that is, an “objective” measure. One option has been the mismatch negativity which is a derived response elicited by an infrequent shift in spatial location, but the pattern of results for this response has not clearly paralleled the behavioral performance (Freigang, Rubsamen, et al., 2014). Another response that has been gaining traction is the ACC, which is a cortical potential consisting of a P1–N1–P2 complex that is elicited by a change in an ongoing sound along some acoustic axis—in this case, a shift in the azimuthal location of a sound. Several studies have demonstrated that a change in spatial source location within an ongoing sound can elicit an ACC (Fan et al., 2022; Nie et al., 2024; Wang et al., 2024). As a related finding, ACCs have also been elicited by a shift in lateralization due to a change in ITD (Fan & Gifford, 2024; Ozmeral et al., 2016, 2019). Fan et al. (2022), testing young normal-hearing adults in the sound field, found that all but one of their 33 participants generated an ACC for a 10° shift across midline (i.e., from −5° to +5°, or vice versa [−5° ↔ +5°]), which was higher than the measured behavioral MAA of approximately 2°. Nie et al. (2024), using the same apparatus, tested two groups of older participants—one with clinically normal hearing and the other with mild/moderate hearing loss. They found that most participants generated a detectable ACC for shifts greater than 10° (−5° ↔ +5°), although they computed the ACC discrimination threshold to be about 8° (−4° ↔ +4°) for the group with clinically normal hearing and about 14°(−7° ↔ +7°) for the group with hearing loss. Again, these objective thresholds were higher than the behavioral MAAs, which were about 2° for the group with clinically normal hearing and about 5° for the group with hearing loss. In terms of morphological changes in the ACC, this pair of studies found that response amplitude decreased and latency increased as the azimuthal shift was reduced. As a final note, Nie et al. (2024) reported a moderate correlation between behavioral MAA and the ACC discrimination threshold.
The Fan et al. (2022) and Nie et al. (2024) studies of the ACC elicited by azimuthal shifts relied on expert opinion for response detection; that is, the comparative ratings of two experienced judges, with a third arbitrator judge consulted in cases of disagreement. Whereas there is usually little question of response presence for robust ACCs elicited by large spatial shifts, visual interpretation of response morphology becomes more challenging as the ACC approaches the noise floor for smaller spatial shifts. To reduce reliance on subjective judgments and increase reproducibility, statistical metrics are increasingly being used to define response presence, removing expert opinion from the decision process. These include Fsp or Fmp (F-ratio for single- or multipoint data), Hotelling's T2, bootstrap resampling methods, and template-matching procedures (e.g., Akis et al., 2025; Chesnaye et al., 2021, 2023). Another metric is the Inter-Trial Phase Coherence (ITPC), which determines the sweep-to-sweep phase consistency within particular frequency bands of the recorded region of interest (ROI) time-locked to the evoking stimulus (e.g., Grose et al., 2025). That is, for each time point in those frequency bands, the ITPC reflects how synchronized the response is across sweeps, regardless of response amplitude. Similar to a correlation coefficient, the higher the value the greater the degree of phase locking. The ITPC, also known as the phase-locking value, has gained traction as a measure of neural synchrony (Harris et al., 2014; Harris & Dubno, 2017; He et al., 2024). A second purpose of this study was to measure the ACC evoked by varying degrees of spatial shift and to quantify the response in terms of the ITPC.
In summary, the purpose of this study was to assess sensitivity to azimuthal shifts, measured both behaviorally and electrophysiologically in the same participants. Age-related effects were tested by including participants across a wide age range and restricting audiometric status to normal or near-normal audiometric hearing. The overall goal was to determine the extent to which the ACC can be used as an objective proxy for the MAA in exploring age-related deficits in binaural hearing.
Experiment 1. Psychophysical Measurement of MAA
The primary purpose of this experiment was to assess behavioral sensitivity to azimuthal shifts as a baseline against which to compare electrophysiological sensitivity in Experiment 2. Because the backdrop to the study was an interest in age-related degradations in binaural temporal processing, the stimulus was restricted to a low-frequency region and the participant population spanned a wide age range.
Method
Participants
Participants were 63 adults divided into three age groups: Young (20–29 yrs, median = 24 years, n = 20, 16 female); Mid-Age (38–54 yrs, median = 47 years, n = 20, 17 female); and Older (65–74 yrs, median = 70 years, n = 23, 16 female). The three additional participants enrolled in the Older group reflect anticipated attrition in this group which did not occur; all participants completed the study. All participants had normal or near-normal hearing below 4,000 Hz as defined by the following criteria: Young and Mid-Age groups had audiometric thresholds ≤ 20 dB HL at the octave frequencies 250–4,000 Hz; the Older group had audiometric thresholds ≤ 20 dB HL at the octave frequencies 250–2,000 Hz, with no greater than 35 dB HL at 4,000 Hz. There were two exceptions to these criteria in the Older group: one participant had a threshold of 25 dB HL at 1,000 Hz in one ear and another had a threshold of 40 dB HL at 4,000 Hz in one ear. The participants all had symmetric hearing, where asymmetric hearing was defined as an interaural difference >10 dB at three consecutive octave frequencies. Figure 1 displays the group mean audiograms collapsed across ears showing that, on average, all age groups had audiometric thresholds within normal limits to 4,000 Hz. Beyond this, the Older group mean exhibited a presbycusic decline. In addition, otoscopic exams were normal and tympanometric testing indicated normal (Type A) tympanograms (GSI TympstarPro; GSI, Eden Prairie, MN). All 63 participants completed both the psychophysical and electrophysiological portions of the study. Every participant signed an informed consent approved by the Institutional Review Board and was reimbursed for participation.

Group Mean Audiograms Collapsed Across Ears.
Stimulus
The stimulus was a 200-Hz-wide band of noise centered at 500 Hz, digitally generated at a sampling rate of 48,828 Hz. A fresh noise sample, 400 ms in duration including 10-ms cosine-squared onset/offset ramps, was generated prior to each trial of a three-alternative, forced-choice (3AFC) threshold estimation track. The putative spatial location of the stimulus was determined by passing it through a pair of generic head-related transfer functions (HRTFs) associated with the desired location. Although most early studies of MAA have taken place in the free field, advances in digital signal processing allow virtual locations to be generated under headphones using HRTFs (or complementary head-related impulse responses [HRIRs]). Studies have shown a good correspondence between spatial performance in the free field and that measured under headphones using both individualized HRTFs (Wightman & Kistler, 1989) and, when localization is restricted to the horizontal plane, generic (nonindividualized) HRTFs (Sampath et al., 2023; Wenzel et al., 1993). Jakien et al. (2017) have also shown close correspondence between spatial performance under headphones using generic HRIRs and performance in the free field. In the present study, five reference azimuthal locations were tested: 0°, ±18°, ±36°, ±54°, and ±72°. The off-midline references were presented either to the left (−) or to the right (+), counterbalanced across participants. The variable shift of the target relative to the reference location was always towards midline except in the case of the 0° reference, where the shift was to the left or right as determined by the counterbalanced selection. Stimuli were presented at a level of 65 dB SPL through HD 300 Pro Sennheiser headphones (Wedemark, Germany). Stimuli were calibrated using a flat-plate coupler (Larson Davis model AEC101) attached to a sound level meter (Larson Davis System 824).
Procedure
The MAA was determined using a 3AFC procedure incorporating a 2-down, 1-up stepping rule to converge on the 71% correct point. In each interval of a trial, marked by a response box light, three 400-ms noise bursts were presented sequentially separated by 10 ms of silence. In the two standard intervals, all three noise bursts were identical. In the target interval, the first and third noise bursts were identical standards while the second noise burst was shifted in location. The participant therefore had the opportunity to monitor for a within-interval spatial shift as well as to compare across the three intervals. The participant pressed a response box button associated with the selected interval and correct feedback was provided by blinking the light indicating the interval that contained the spatial shift. The initial size of the spatial shift was 4° and this step was reduced by half after the second and fourth reversal in angular shift size to its final value of 1°. A threshold estimation track was terminated after eight reversals and the average of the final six reversals was taken as the threshold estimate. For each reference location, three estimates were collected, with a fourth estimate collected if the first three differed by more than a factor of 1.5. Final threshold for that condition was taken as the mean of all estimates collected. Testing was blocked by condition, and the order of conditions was randomized across participants. The frontal quadrant associated with the reference location (left or right) was counterbalanced across participants. Stimulus generation and presentation, and the 3AFC procedure, were implemented by means of custom MATLAB (Mathworks, Natick, MA) code controlling a digital signal processing platform (RZ6, Tucker-Davis Technologies, Alachua, FL).
Statistical Analysis
Log-transformed MAA data were submitted to repeated-measures analyses of variance (RMANOVAs), incorporating Greenhouse-Geisser corrections, with one within-subjects factor (Ref Location, five levels) and one between-subjects factor. In the preliminary analysis, the between-subjects factor was side of presentation (Side, two levels); in the main analysis, it was participant age group (Age Group, three levels). Post-hoc testing was undertaken with Tukey's HSD. The significance level was set at alpha = .05. Bivariate correlations were performed using the Pearson test. Statistical analyses were performed with IBM SPSS Statistics, version 29.0.1.0 (IBM Corp, Armonk, NY).
Results
As a preliminary step, it was necessary to determine whether performance depended on the frontal quadrant in which the reference was located since each participant was randomly assigned to having the reference located on the left or right of midline. The key result of this RMANOVA was that the side of the reference location had no effect, F (1, 61) = 0.353; p = .555. The data were therefore collapsed with respect to side of reference location.
Results for all participants are shown in the boxplots of Figure 2 which plot MAA as a function of reference location, with age group as the parameter. The visual impression is that the MAA worsens (larger angular shifts) as the location of the reference moves further off midline. It also appears that the Young group tends to have lower MAAs than the Mid-Age and Older groups. To assess these visual impressions, a RMANOVA was undertaken which showed a significant effect of Ref Location, F (3.287, 197.214) = 234.232; p < .001, a significant effect of Age Group, F (2, 60) = 3.657; p = .032, but no interaction between these factors, F (6.574, 197.214) = 1.296; p = .257. Post-hoc testing indicated that the Young group differed significantly from the Older group (p = .029) but not from the Mid-Age group (p = .145). The Mid-Age and Older groups did not differ (p = .792). In summary, the analysis confirmed that the Younger group had smaller MAAs than the Older group, but that performance of the Mid-Age group was intermediate to both of these groups. The decline in performance with increasing off-midline reference locations was essentially parallel for all groups.
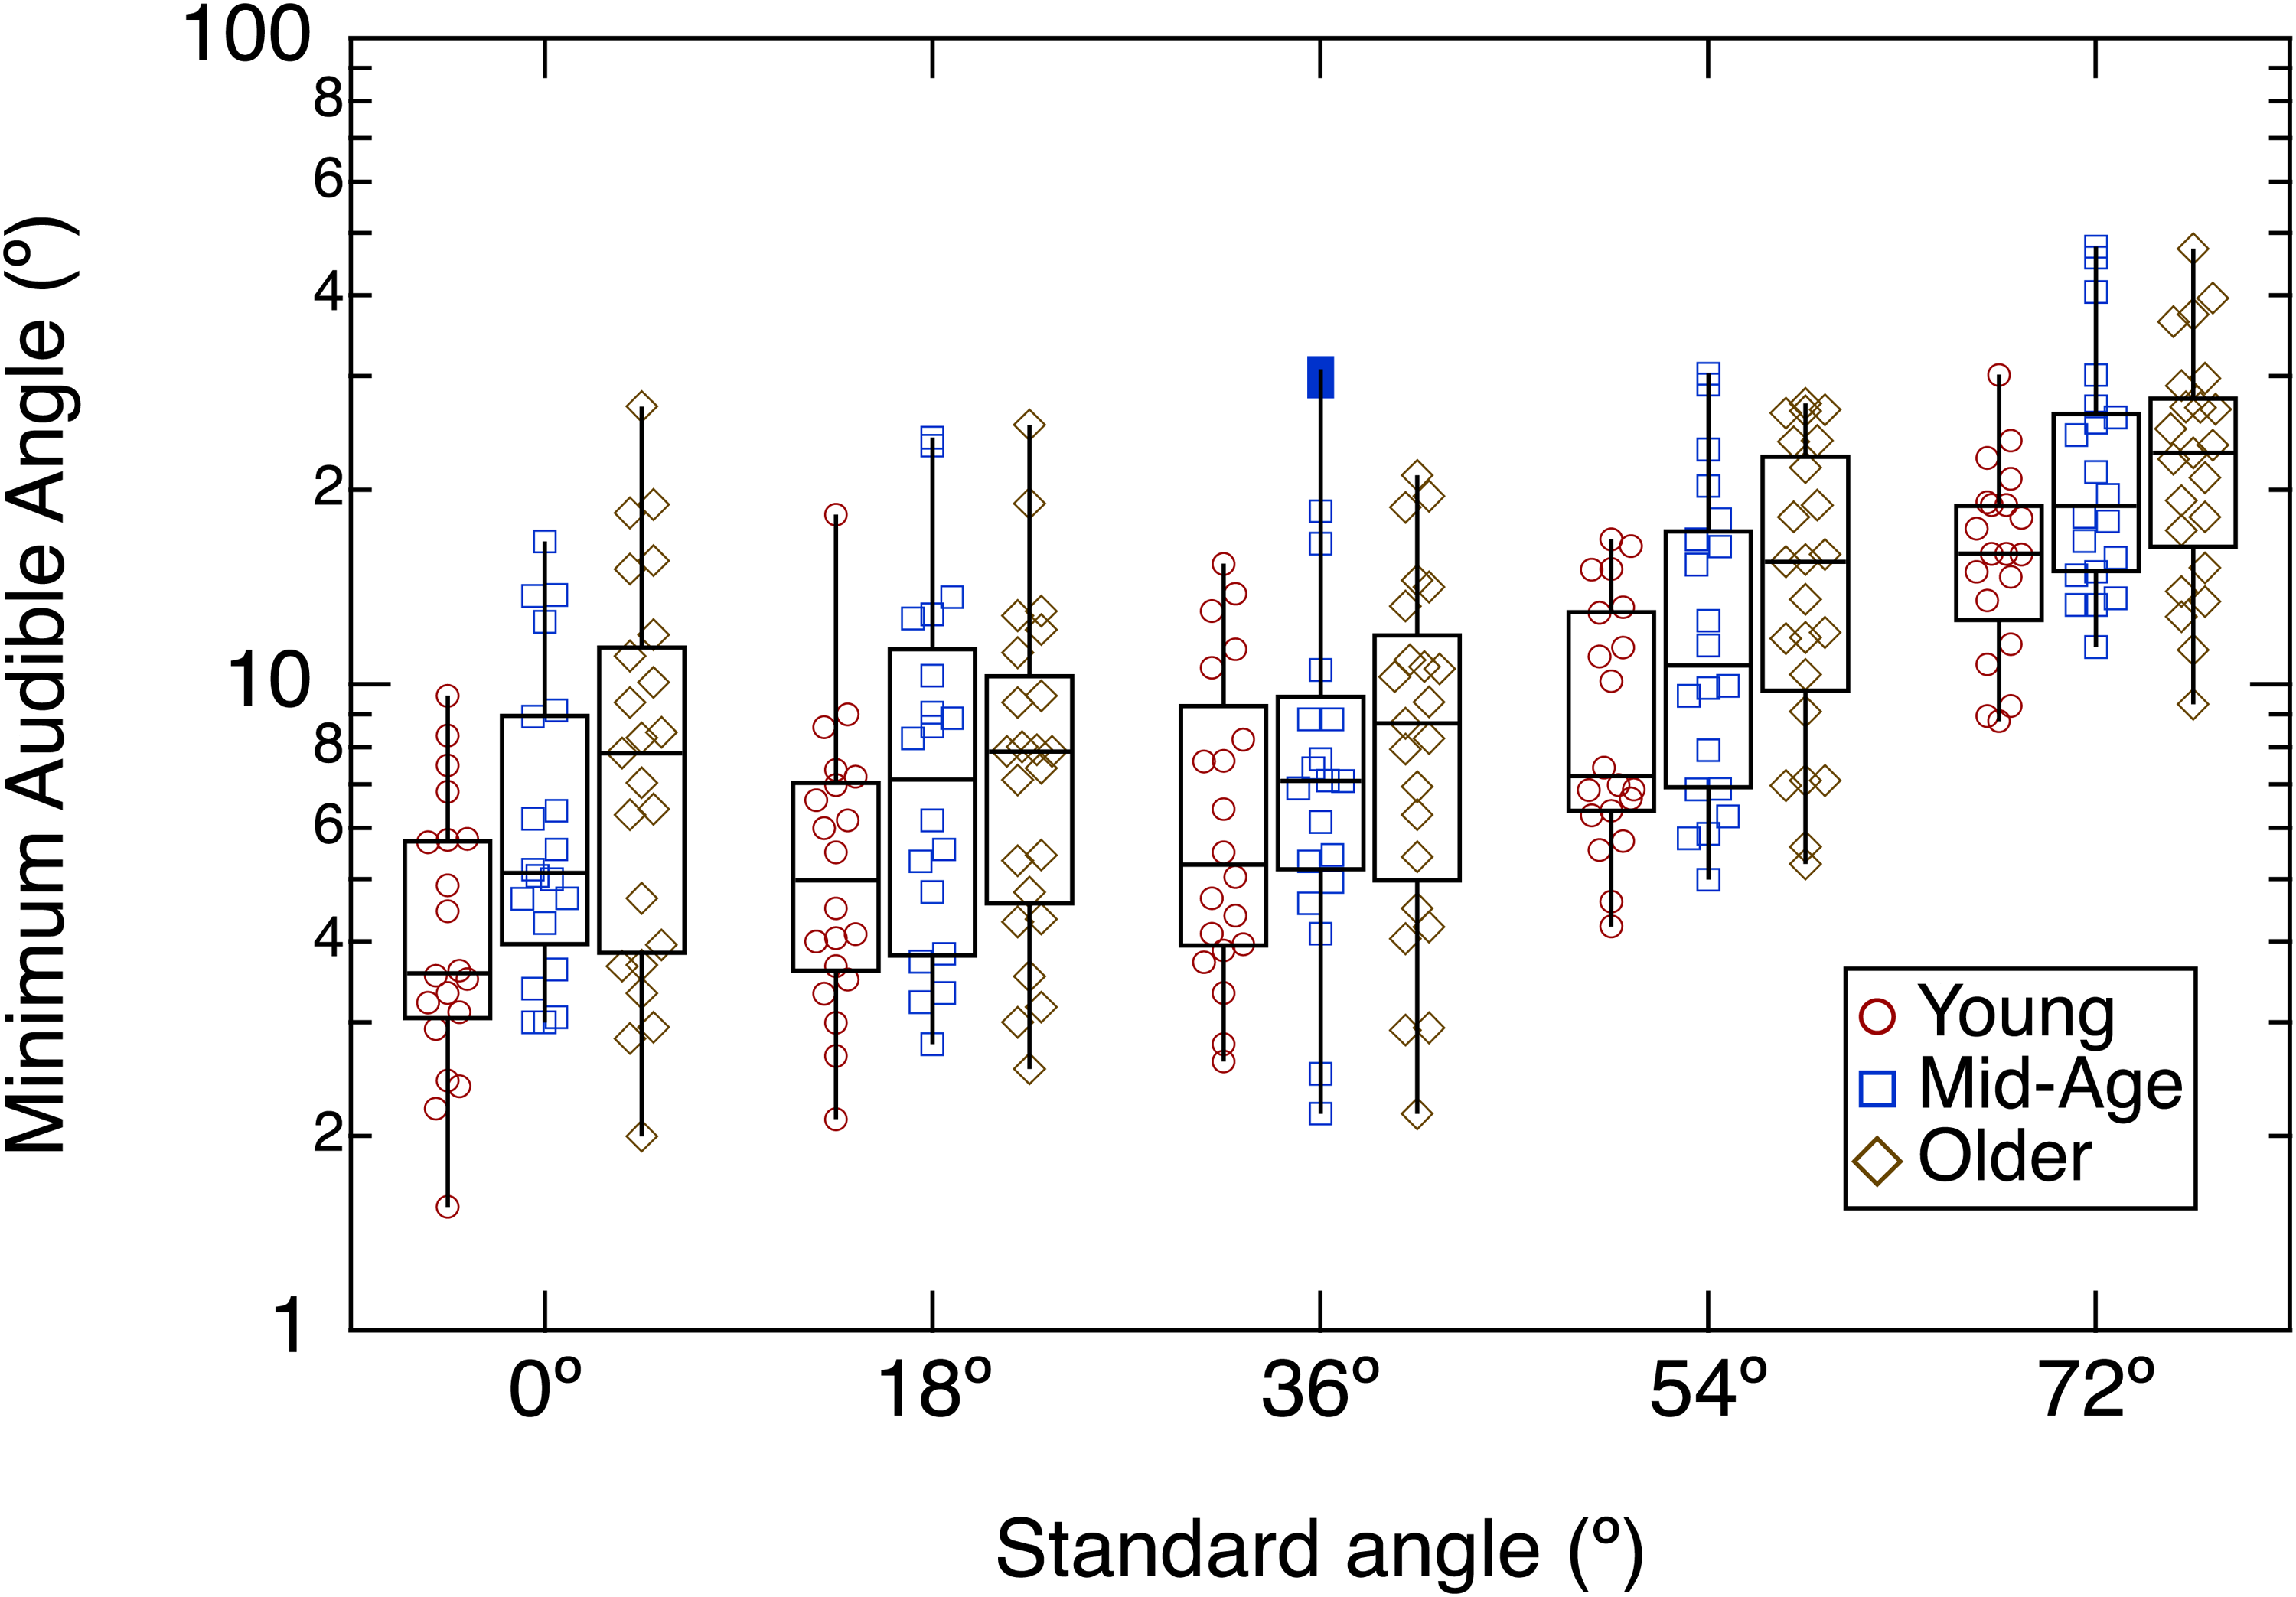
MAA as a Function of Reference Location, With age Group as the Parameter.
It is evident from Figure 2 that, within each age group and reference location, MAA varied across participants. To determine if this spread of performance reflected consistent differences across participants, bivariate Pearson correlations were performed on all pair-wise comparisons of reference locations within each age group. These correlations and associated scatterplots are shown in Figure 3. The uniformly high correlations indicate that, within each age group, participants could be consistently ranked by spatial sensitivity. This consistency is also captured by the intraclass correlation coefficient which, for each age group, exceeded 0.9 and was significant at the p < .001 level.

Bivariate Scatterplots for Each Possible Combination of Reference Location, as Identified Along the out Edge of Each Column and row.
Interim Discussion
The pattern of results for the behavioral MAA experiment confirms the well-established observation that sensitivity to angular shifts deteriorates as the reference location of the sound source moves increasingly off midline (Mills, 1958). The MAA for the Young group increased from a median of about 4° for a midline reference to about 16° for a reference location of 72°. For the midline reference, this performance is not as good as that reported for wideband stimuli, which can be as low as 1° (e.g., Grantham et al., 2003). However, recall that the stimuli in this experiment were 200-Hz wide noise bands centered at 500 Hz. Figure 4 plots the mean MAA for the Young and Older groups as a function of reference location and also incorporates mean data for young and older listeners from Freigang, Schmiedchen et al. (2014), who used a noise with bandwidth 375–750 Hz, and Sammeth et al. (2025), who used a noise with bandwidth 397–630 Hz (third-octave wide centered at 500 Hz). This compilation shows a consistent trend for older listeners to perform more poorly than young listeners across all reference locations, with the greatest deterioration in threshold occurring for reference locations greater than about 40°. Because this occurs in populations with normal or near-normal audiometric hearing, this suggests that senescence, independent of hearing loss, can lead to deficits in spatial hearing for low-frequency sounds. This interpretation in terms of senescence is in line with other work showing age-related deficits in binaural temporal processing (e.g., Eddins & Eddins, 2018; Fullgrabe et al., 2018; Grose et al., 2025; Grose & Mamo, 2012; Kane et al., 2021; Ozmeral et al., 2016; Sammeth et al., 2025).

Comparison of Mean MAA as a Function of Reference Location for Young and Older Listeners for low-Frequency Bands of Noise.
Experiment 2. ACC Elicited by Azimuthal Shifts in Source Location
The purpose of Experiment 2 was to obtain an objective gauge of the sensitivity of the auditory system to azimuthal shifts in sound location by measuring the ACC elicited by these shifts. By using the same low-frequency stimulus, and the same participants, as in Experiment 1, the goal was to determine the extent to which an objective measure parallels the behaviorally assessed MAA, particularly in terms of any age-related effects.
Method
Participants
The same participants from Experiment 1 undertook Experiment 2.
Stimulus
The stimulus was a 200-Hz wide band of noise centered at 500 Hz, generated with the same procedures as in Experiment 1. Two 400-ms segments of this noise band, shaped with 10-ms onset/offset ramps, were generated and passed through independent pairs of HRTFs to create stimuli at the putative stimulus locations. The spatial location assigned to the leading noise band was always 0° (midline) and the spatial location assigned to the lagging noise band was associated with one of six azimuthal shifts from midline: 0°, ±4.5°, ±9°, ±13.5°, ±18°, or ±36°. The azimuthal “shift” of 0° was the control condition wherein no change in spatial location occurred. The leading and lagging noise bands were ramped with 10-ms onset and offset ramps that crossed at the 6-dB down point, such that initiation of the leading band offset occurred synchronously with initiation of the lagging band onset. This resulted in a seamless transition between the two noise segments midway through the overall stimulus. The stimulus therefore began with a spatial percept of midline (0°) which either continued for the remainder of the stimulus or shifted off-midline, depending on the azimuthal shift of the lagging segment. For the off-midline azimuthal shifts, the application of shift to the right (+) or left (−) of midline was randomly selected for every stimulus presentation. This stimulus configuration consisting of a single long-duration noise band transitioning smoothly in spatial location at the midpoint differs from the behavioral stimulus configuration where, in the target interval, two reference noise bands flanked the spatially shifted noise band in time with 10-ms gaps between them. The rationale for this difference was that ACC stimuli are, classically, single sounds containing a mid-stimulus “change” rather than consisting of a sequence of discrete sounds. In the latter case, there can be ambiguity regarding whether an observed P1-N1-P2 complex is an ACC or another onset response evoked by a lagging discrete segment. The nominal interval between stimulus presentations was 1.2 s, but this interval was randomly varied across a range of ±15 ms to introduce some temporal jitter into the presentation pattern. The stimuli were presented at a level of 65 dB SPL through ER2 insert earphones (Interacoustics US, Eden Prairie, MN) encased in custom electromagnetic (EM) shielding. Stimuli were calibrated with a 2-cc coupler (GRAS model RA0038) attached to a sound level meter (Larson Davis System 824).
Procedure
Each participant undertook six recording conditions, with each condition corresponding to one of the six possible azimuthal shifts. The order of conditions was randomized across participants. The recording sessions took place within an EM-shielded sound booth. The participant sat in a comfortable armchair and either watched a captioned, silent movie or read quietly. Electrodes were placed on the participant's scalp at vertex (Cz, noninverting), low forehead (Fpz, ground), and on each earlobe (A1, A2, inverting). The electrode impedances were maintained at ≤ 5 kΩ throughout the recording session. Stimulus generation and presentation was controlled by means of custom MATLAB code interfacing with an RZ6 digital signal processing platform. This system also generated pairs of triggers, one coincident with the onset of the leading band and one coincident with the onset of the lagging band. These trigger pairs were laid down as event markers on the continuously recorded electroencephalogram (EEG) by a CompuMed Neuroscan system (Charlotte, NC) operating at a sampling rate of 1 kHz. An artifact rejection criterion of ±70 µV was applied to the in-coming EEG. For each of the six conditions, recordings were continued until approximately 200 artifact-free epochs had been acquired.
Analysis
Following completion of the recording sessions, the two-channel recordings for each condition were baseline corrected, digitally combined to derive a single mid-line recording, and bandpass filtered from 1–30 Hz. By means of the pair of event markers, this recording was then sorted into two sets of epochs: one set associated with the stimulus onset, and one set associated with the azimuthal shift for that condition. For one analysis, these two sets of epochs were separately averaged to provide a mean onset response and a mean ACC response to that specific azimuthal shift. For another analysis, the epochs associated with the azimuthal shift were used to calculate the ITPC. The ITPC was calculated using the newtimef function in EEGLAB (2024.1, Swartz Center for Computational Neuroscience, La Jolla, CA). The replicate epochs were evaluated in 20 bands, computed via convolution with 1-cycle complex Morlet wavelets, equally spaced between 4 and 8 Hz on a log scale. The summary ITPC value was taken as the mean of the absolute values within the time window 50 to 250 ms after the onset of the azimuthal shift (the ROI). This temporal ROI and the spectral parameters of the 20 analysis bands were the same as those used in Grose et al. (2025). Note that the ITPC computed for the control condition (0° shift) represents the null response since no acoustic change occurred. For an ACC response to be deemed present in any of the conditions containing an angular shift, the ITPC for that condition had to differ from the ITPC for the null response by an amount that reached statistical significance.
Statistical Analysis
The log-transformed ITPC values were submitted to RMANOVAs, incorporating Greenhouse–Geisser corrections where appropriate. The RMANOVAs had one within-subjects factor (Azimuthal Shift, five levels) and, when testing for age effects, one between-subjects factor (Age Group, three levels). Post-hoc testing was undertaken with Tukey's HSD. Bivariate correlations were performed using the Pearson test. The significance level was set at alpha = .05. Statistical analyses were performed with IBM SPSS Statistics, version 29.0.1.0 (IBM Corp, Armonk, NY).
Results
Figure 5 plots the mean waveforms for the 300-ms window following the onset of the lagging band, which includes the ROI for an expected ACC. Columns 1–3 show results from the Young, Mid-Age, and Older groups, respectively, with the fourth column showing the mean response from each age group overlaid. Rows 1–6 show results for each of the angular shifts from midline, with the seventh row showing the mean response from each angular shift overlaid. Each panel in the matrix of Columns 1–3: Rows 1–6 show the mean group response as a heavy line with the 95% confidence interval as a shaded region. The first row is the control condition where no shift occurred (0°). The visual impression from these panels is that ACCs emerge for angular shifts of 13.5° or greater (Rows 4–6), with the magnitude of the ACC growing with increasing angular shift. This impression is distilled in the lower row where, in the overlaid traces for each age group, the ACC appears most robust for a 36° shift whereas the responses for shifts of 4.5° and 9° do not appear to be different from the no-response control. Looking at the fourth column, the visual impression is that the ACC for the Young group appears to be more robust than those of the two older groups for shifts ≥ 13.5°.

Group Mean Waveforms for the 300-ms Window Following the Azimuthal Change in Source Angle, Which Includes the ROI in Which the ACC Would Occur.
To quantify and evaluate the significance of these impressions, the ITPC results for each participant and condition were computed. These results are shown as box-and-whisker plots in Figure 6. The ITPCs associated with the control condition (0° shift) represent the null response. The first step in the analysis was to determine whether the ITPCs for the conditions with angular shifts differed from this baseline. To assess this, the log-transformed ITPCs for each age group were separately submitted to a RMANOVA. These analyses showed, for each age group, a significant effect of Azimuthal Shifti, Young: F (5, 95) = 49.964; p < .001; Mid-age: F (5, 95) = 55.615; p < .001; Older: F (5,110) = 54.558; p < .001. Post-hoc simple contrasts referenced to the control condition determined that the ITPCs associated with angular shifts of 4.5° and 9° did not differ from baseline (p ranging from 0.144–0.986), whereas those for angular shifts of 13.5°, 18°, and 36° did (p ranging from < .001 to .002). This confirms the observation from Figure 5 that no ACC responses were associated with shifts of 4.5° and 9°, and that ACCs were only elicited for shifts ≥ 13.5°.

ITPC as a Function of Azimuthal Shift, With age Group as the Parameter.
To test for age effects, the log-transformed ITPCs for the three largest angular shifts (13.5°, 18°, and 36°), where significant ACCs were determined to be present, were submitted to a RMANOVA. The results showed a significant effect of Azimuthal Shift, F (2, 120) = 133.45; p < .001, and no effect of Age Group, F (2, 60) = 1.884; p = .161. Although the interaction between these two factors failed to reach significance, F (4, 120) = 2.184; p = .075, post-hoc pairwise comparisons showed that ITPCs for the Younger group differed from the Older group at the 13.5° and 18° angular shifts (p = .029 and .03, respectively), but not for the 36° shift (p = .759). The ITPCs for the Mid-Age group did not differ significantly from either of the two other groups for any of the three angular shifts. These results reinforce the visual impression from Figure 5 that the ACC for the Younger group is more robust than that of the Older group for the 13.5° and 18° angular shifts, but that all groups showed robust, and relatively similar, responses for the 36° shift.
It is evident from Figure 6 that ITPCs varied across participants for any given azimuthal shift. To determine the consistency of performance across the three angular shifts that elicited significant ACCs within each age group, bivariate Pearson correlations were performed for the three possible pair-wise comparisons. These correlations and associated scatterplots are shown in Figure 7. It can be seen that, with one exception, all correlations were highly significant. This consistency is also captured by the intraclass correlation coefficient which ranged from 0.75 for the Mid-Age group to 0.89 for the Young group. These strong associations indicate that, within each age group, the ordering of the robustness of the ACC was generally uniform; that is, the ACCs generated by some participants were consistently more robust than others.

Bivariate Scatterplots for Each Possible Combination of Azimuthal Shift from Midline, as Identified Along the out Edge of Each Column and row.
Interim Discussion
The results of Experiment 2 indicate that, for a reference location of 0° (midline), shifts in the azimuthal location of a low-frequency sound can elicit an ACC, providing the angular shifts exceed at least 9°. Presence of an ACC was determined by a significant ITPC, and this metric increased with increases in angular shifts up to the maximum shift tested of 36°. Within this region of increasingly robust ACCs, Young participants had significantly larger ITPCs than Older participants, with Mid-Age participants being intermediate to these two age groups. At the largest shift, ACCs from all participants were relatively robust and no age-related effects were evident.
The dependence of the ACC on the magnitude of angular shift has been reported previously. Using a wide-band noise presented in the sound field, Fan et al. (2022) observed that virtually all young, normal-hearing participants exhibited an ACC for an angular shift of 10° across midline (−5° ↔ +5°) but only a third of them exhibited an ACC for a 4° shift across midline, the smallest shift tested. Using the same set-up, but testing older participants, Nie et al. (2024) found that only about 13% of participants exhibited an ACC for a 4° shift across midline, but the proportion grew as the angular shift across midline increased. The same research group reported slightly higher proportions in a separate paper that also included children (Wang et al., 2024). All three studies focused on amplitude and latency measures of the P1–N1–P2 peaks, and all studies found a systematic increase in latency and decrease in amplitude as the magnitude of the angular shift decreased. Although the present study did not focus on amplitude and latency measures, similar trends are evident in the mean waveforms shown in Figure 5. For example, taking the responses from the Young group (lower left panel), it can be seen that the N1-P2 amplitude systematically decreased as the angular shift was reduced from 36° to 13.5°. This was confirmed with a RMANOVA which indicated a significant effect of N1-P2 amplitude, F (2, 38) = 37.247; p < .001, and post-hoc pair-wise comparisons showed that the amplitudes for the three angular shifts differed significantly from each other. The latency shifts, however, were less striking. Using the Young group as the exemplar again, a RMANOVA showed no overall effect of Latency, F (2, 38) = 1.179; p = .319, although post-hoc pair-wise comparisons showed that the latency for the 18° response was significantly longer than that for the 36° response.
General Discussion
The primary purpose of this study was to measure sensitivity to azimuthal shifts both behaviorally (MAA) and electrophysiologically (ACC) in the same participants to determine the extent to which the ACC can be used as an objective proxy for the MAA. The overarching focus was to assess whether expected age-related degradations in spatial hearing could be observed in both behavioral and electrophysiological domains and whether measurements in these two domains were associated. Participants across a wide age range were tested with audiometric status restricted to normal or near-normal audiometric hearing. Experiment 1 found that Young participants had smaller MAAs than the Older group, with MAAs for the Mid-Age group being intermediate. This difference in MAA between Young and Older participants is in line with previous work (Freigang, Schmiedchen, et al., 2014; Sammeth et al., 2025), and supports the consensus of age-related deficits in binaural temporal processing (e.g., Eddins & Eddins, 2018; Fullgrabe et al., 2018; Grose et al., 2025; Grose & Mamo, 2012; Kane et al., 2021; Ozmeral et al., 2016; Sammeth et al., 2025). Irrespective of age group, MAAs increased with increasing off-midline reference locations, as expected (Mills, 1958). Experiment 2 found that, for a midline reference, significant ACCs did not occur for any age group until the angular shift exceeded 9°. Beyond this, the ACC emerged and, within the range of angular shifts from 13.5° to 18°, the ACCs from Young participants were more robust than those of Older participants. Once the angular shift reached 36°, no age-related differences were observed. The dependence of the ACC on magnitude of angular shift, and the presence of age-related deficits in the ACC, have been observed previously (Fan et al., 2022; Nie et al., 2024; Wang et al., 2024). In summary, the present study found evidence for age-related degradations in both the behavioral (MAA) and electrophysiological (ACC) domains.
The present study also found that for both the MAA and the ACC, separately, significant correlations existed among the respective conditions. For the MAA, significant correlations were found among all pairings of the reference location within each age group. For the ACC, significant correlations were measured across all pairings of the size of angular shift from midline, except for the 13.5° versus 36° pairing for the Mid-Age group. These bivariate correlations, along with the high intraclass correlation coefficients, suggest that ranking of individual performance was relatively consistent across conditions within both the behavioral and electrophysiological domains separately. The key question, therefore, is whether these consistencies in performance translated across domains. Since the ACC was only measured for angular shifts away from midline, the crux comparison is between these measures and the MAA for a reference location of 0°. Bivariate correlations between the MAA for a 0° reference location and the ITPC for shifts away from 0° of 13.5°, 18°, and 36° within age groups revealed no associations for any pairing (p = .25–.92). This absence of association suggests that individual participants’ performance on the electrophysiological ACC does not predict behavioral MAA performance. Thus, although at the group level complementary age effects are seen in both electrophysiological and behavioral domains, this does not reflect individual participants’ performance within age groups, at least for the midline reference. This result was not expected given the moderate association between MAA and ACC seen by Nie et al. (2024). That study used wide-band noise stimuli delivered in the sound field in contrast to the low-frequency stimuli processed with generic HRTFs used in this study; methodological differences might contribute in part to disparities across studies. However, other measures of binaural hearing have also shown associations between behavioral and ACC measures. For example, Grose et al. (2025) found weak, but significant, associations between behavioral and ACC sensitivity to interaural phase modulations at low frequencies. In a recent systematic review examining the relationship between the ACC and psychophysical behavioral measures, Meehan et al. (2025) found a wide range of association strengths between the behavioral and electrophysiological domains, from strong correlations to absent correlations, and cautioned that the wide parameter space within each measurement domain presented a challenge for interpreting strengths of association. For example, here, although the behavioral MAA task and the electrophysiological ACC task made use of the same stimulus noise-band parameters in terms of bandwidth, center frequency, level, etc., the presentation configuration of these noise bands differed between the two tasks. Furthermore, in the present case, the ACC was measured only for a midline reference (0°). The MAA data suggested that age effects are more robust for off-midline references. Thus, in retrospect, including measurements of ACC for off-midline references might have been more revealing, and is an area for future study.
Summary and Conclusion
The purpose of this study was to determine the extent to which the ACC elicited by azimuthal shifts in sound source location can be used as an objective proxy for the MAA in the context of evaluating age-related deficits in binaural hearing. The study found age-related deficits in the MAA and in the robustness of the ACC. Within each of the behavioral and electrophysiological domains, separately, there was consistency of participant performance. However, for a midline reference, no associations were observed between MAA and ACC measures. Although this result was not expected, further work is necessary to evaluate the ACC at off-midline references before a firm conclusion can be reached that the ACC is not a viable objective proxy for the MAA.
Footnotes
Ethical Approval
This study was approved by the Biomedical Institutional Review Board at the University of North Carolina at Chapel Hill (IRB Study Number 21-1780).
Informed Consent
All participants signed an approved written informed consent form.
Funding
The authors disclosed receipt of the following financial support for the research, authorship, and/or publication of this article: This work was supported by a grant from the National Institute on Deafness and Other Communication Disorders (Grant No. R01DC019444).
Declaration of Conflicting Interests
The authors declared no potential conflicts of interest with respect to the research, authorship, and/or publication of this article.
Data Availability Statement
Data will be made available upon reasonable request.