
Abstract
The purpose of this study was to measure the binaural interaction component (BIC) derived from click-evoked auditory brainstem responses (ABRs) using stimuli configured to elicit the Precedence Effect. The hypothesis was that the contribution of binaural processing to echo suppression can be evidenced by a diminished or absent BIC associated with the echo. Ten normal-hearing young adults provided ABRs generated by sequences of click pairs. Results showed that BICs elicited by diotic clicks in isolation were obliterated when those diotic clicks were preceded by a click pair having an interaural time difference of 400 µs and where the interclick interval was 8.4 ms. The presence of the leading click pair increased the latency of the ABR generated by the lagging diotic click pair but did not decrease its amplitude. The results were interpreted as indicating a contribution of binaural processing at the level of the brainstem to echo suppression, at least for the conditions tested here.
The Precedence Effect refers to the general phenomenon wherein the first-arriving sound wave from an acoustic source is given precedence over later-arriving reflected sound waves in the determination of the location of that acoustic source (for review, see Brown et al., 2015; Litovsky et al., 1999; Wallach et al., 1949). For short intervals between the arrival of the direct wave and its reflection, a single fused image is heard whose location is dominated by the source location of the direct wave. As the interval increases, this fused image begins to break down, and the time interval at which this occurs is referred to as the echo threshold. Echo threshold depends on factors such as stimulus type and the number of sequential presentations of those stimuli. As the number of sequential stimuli increases, there is a build-up of the Precedence Effect such that the echo threshold prolongates. In the transition region around the echo threshold, prior to intervals at which the reflected wave is perceived as a distinct separate event, the direct wave can continue to exert a perceptual influence over the image such as its spatial extensiveness (Litovsky et al., 1999). Since, in the Precedence Effect, the reflected waves are given less weight than the direct-path waves in determining spatial origin, the term echo suppression is also used in this context. There has been a long-standing interest in the basis of echo suppression within the auditory system, particularly in terms of the extent to which it reflects peripheral versus central mechanisms.
To illustrate this interest in the basis of echo suppression, the study of Bianchi et al. (2013) will be showcased since it also provides direct context for this study. Bianchi et al. employed the well-established Precedence Effect stimulus paradigm wherein the direct-path sound and the echo are simulated with simple pairs of clicks presented binaurally under headphones; the leading binaural click pair constitutes the direct-path stimulus and the lagging binaural click pair constitutes the echo. By using clicks, Bianchi et al. were able to record both click-evoked otoacoustic emissions (CEOAEs) and click-evoked auditory brainstem responses (ABRs), in addition to obtaining psychophysical measures of echo threshold and suppression. They found that the echo threshold was a little over 4 ms, and that the perceptual influence between the leading and lagging click pairs in terms of spatialization had largely dissipated by 8 ms, the longest interclick interval they tested. That is, even at intervals longer than the measured echo threshold, lateralization of the lagging click pair was still influenced by the leading click pair. The CEOAE results showed that the emission elicited by the lagging click was strongly suppressed by the leading click emission at short interclick intervals (maximal suppression at about 2 ms) and that this suppressive effect was largely mitigated at the longest interval of 8 ms. Similarly, the ABR evoked by the lagging click was significantly reduced in amplitude by the presence of the leading click at short interclick intervals of about 2 ms but little amplitude reduction was observed for the longest interval of 8 ms. Comparing their behavioral and objective measures, Bianchi et al. observed that the suppressive effects of the leading clicks on the lagging clicks in the CEOAE and ABR domains were maximal for click intervals below the subjective echo threshold, supporting the conclusion that perceptual echo suppression is dominated by peripheral mechanisms—at least for this stimulus configuration. In other words, basilar membrane interactions, with possible contributions from auditory nerve adaptation, predominantly underlie the suppressive effects at short interclick intervals, although residual suppressive effects seen at longer interclick intervals presumably reflect contributions of more central mechanisms. The conclusion that peripheral mechanisms predominantly underlie echo suppression implies that the suppression has an inherently monaural basis. In support of this, Bianchi et al. compared ABRs elicited with monaural stimulation with those elicited with binaural stimulation and found essentially the same suppressive effects in both modes of stimulation, leading them to infer that binaural processes did not contribute substantively to the suppression for interclick intervals less than about 4 ms.
Other studies have argued for contributions to echo suppression from more central processes, particularly for on-going sounds (Freyman et al., 2018). Even for transient sounds such as clicks, there is evidence for central contributions. For example, Fitzpatrick et al. (1999) demonstrated that the suppressive effect of a leading click pair on a lagging click pair was increasingly long-lasting as the intracranial recording site shifted up the auditory pathway. For peripheral recording sites up to the superior olivary complex, recovery from suppression (50% point) occurred within about 2 ms, whereas the same degree of recovery took about 7 ms at the inferior colliculus and about 20 ms at the auditory cortex. In terms of surface-recorded responses, Liebenthal and Pratt (1999) measured evoked responses to binaural click pairs in an effort to define an electrophysiological correlate of echo suppression. The study compared ABR and middle latency responses (MLRs) elicited by monaural and binaural click pairs where the interclick intervals ranged from 4 to 20 ms. They observed marked differences between the binaural responses and those derived by summing the left and right monaural responses, particularly in the region of the Pa component of the MLR. Since this component is associated with generators in the primary auditory cortex, and since the behavior of this component correlated with the behavioral measures of echo-lateralization suppression, they concluded that the primary auditory cortex is likely involved in echo suppression. A similar conclusion was reached by Damaschke et al. (2005) who measured ABRs and mismatch negativities (MMNs) to sequences of leading and lagging binaural click pairs in order to gauge both peripheral (ABR) and cortical (MMN) responses to Precedence Effect configurations. They found that ABRs elicited by lagging click pairs were unaffected by leading click pairs once the interclick interval exceeded about 5 ms, and that this monotonic recovery from forward masking did not correlate with behavioral measures of the Precedence Effect. In contrast, the MMN responses showed a similar nonmonotonic function with respect to interclick interval as observed for the behavioral results. This led them to conclude that the Precedence Effect relied on central stages of auditory processing whereas the ABR reflected solely stimulus features (de facto monaural effects) and did not index binaural processing associated with the Precedence Effect.
Returning to the Liebenthal and Pratt (1999) study, a point of interest is that their data appear to show some differences between the binaural response and the summed monaural responses at earlier response latencies within the ABR time window (see their Figure 5B). It is possible that such differences could have been highlighted by derivation of the binaural interaction component (BIC). The BIC is a residual waveform that is derived by subtracting the sum of responses evoked independently with monaural right and left stimulation from the response evoked with binaural stimulation (for review, see Laumen et al., 2016). Physiological evidence indicates that the site of BIC generation is the superior olivary complex and, in particular, the lateral superior olive (Benichoux et al., 2018; Tolnai & Klump, 2020). A purpose of this study is to determine whether derivation of the BIC within the time frame of the ABR can shed light on the binaural processing associated with echo suppression.
In summary, electrophysiological investigations of the Precedence Effect and echo suppression using the paradigm of sequential binaural click pairs have suggested that, for interclick intervals less than about 4 ms, any observed effects are likely to be peripheral—and therefore monaural—in nature and do not require binaural processing (Bianchi et al., 2013; Damaschke et al., 2005). However, for longer interclick intervals, the evidence points to more central contributions involving binaural processing. Juxtaposing the MLR findings of Liebenthal and Pratt (1999), who showed that binaural processing is integral to an MLR correlate of echo suppression, with the ABR findings of Bianchi et al. (2013), who noted an absence of a binaural contribution to echo suppression for short interclick intervals, the question arises as to whether binaural processes associated with echo suppression can indeed be demonstrated in the ABR domain at longer interclick intervals. The purpose of this study was to address this question by measuring the BIC derived from click-evoked ABRs using a stimulus configuration designed to elicit the Precedence Effect. The residual BIC waveform was interpreted as reflecting activity within the auditory system at the level of the brainstem that is uniquely associated with binaural processing (e.g., Benichoux et al., 2018; Tolnai & Klump, 2020). Given that the first stage of binaural processing occurs at the level of the brainstem, it was hypothesized that if echo suppression represents a physical diminishment of the encoded representation of the reflected wave, then this reduction should be evident at the level of the brainstem in the form of a diminished or absent BIC associated with the echo.
Method
Participants
A total of 10 young adults with normal hearing bilaterally participated in this study. They ranged in age from 19.6 to 32.8 years (mean = 25.3 years), and eight were female. All had audiometric thresholds less than 20 dB HL across the octave frequencies 250 to 8000 Hz. An additional four young adults who also met these criteria were initially recruited but their ABR recordings did not meet the strict artifact rejection criterion (see below) due to excessive myogenic activity, and so their participation was stopped early and their data excluded.
Stimuli and Conditions
The full stimulus configuration consisted of two pairs of clicks presented binaurally as shown schematically in Figure 1. Each click was 100 µs in duration and was presented at a level that was peak-to-peak equivalent to an 85-dB SPL, 1-kHz pure tone. The leading click pair had a 400-µs interaural time difference (ITD) leading to the right ear which was designed to yield a lateralized image shifted toward the right side. Early work by Feddersen et al. (1957) has shown that an ITD of 400 µs corresponds to an azimuthal angle of incidence of about 50° with regard to the midline. The onset of this leading right-ear click was designated as time 0 ms. A lagging pair of clicks was subsequently presented at 8.4 ms. This lagging pair had no ITD and was designed to generate a centralized image. As an aside, note that this configuration where the leading click pair has an ITD but the lagging click pair has no ITD is opposite to that implemented in Bianchi et al. (2013). This stimulus configuration was selected to satisfy several criteria. First, it was necessary to implement leading and lagging click pairs that, presented singly, resulted in different spatialized images; that is, the direct wave and the echo, when presented alone, should appear to come from different spatial locations. Second, it was desired that the ITD applied to the leading click pair should be sufficient to lateralize the image off midline yet still result in a robust BIC. Several studies have shown that as the ITD of a click pair increases, the magnitude of the BIC elicited by the click pair declines (Furst et al., 1985; McPherson & Starr, 1995; Riedel & Kollmeier, 2006). However, it is evident from the data of Riedel and Kollmeier (2006) that changes in BIC amplitude are minimal out to ITDs of about 400 µs. Third, since the BIC elicited by the lagging click pair (i.e., the echo) was the crux measurement in this study, optimization of the stimuli for this measurement was essential. The studies of McPherson and Starr (1995) and Riedel and Kollmeier (2006) have shown that the BIC amplitude should be maximal for diotic click pairs (no ITD) and so this setting was selected for the lagging click pair. Fourth, and finally, it was necessary to implement a maximal delay between the leading and lagging click pairs such that the leading click pair maintained a spatial influence over the predominantly fused (single) image; that is, the interval between the click pairs should not exceed the echo detection threshold to the point where the echo is perceived as a clearly distinct separate acoustic event. As noted earlier, Bianchi et al. (2013) measured an echo threshold of somewhat over 4 ms for the type of click-pair stimuli used here. However, the echo threshold is not a static interval but depends on the temporal context of the leading and lagging click pairs. Specifically, the echo threshold for a train of identical leading–lagging click pairs is substantially longer than for a single leading-lagging click pair presented in isolation, an effect sometimes referred to as the build-up of echo suppression. For example, Krumbholz and Nobbe (2002) showed that for click pairs having ITDs of 300 µs presented under headphones, the echo threshold for a single presentation of the leading–lagging click pairs is about 7 ms whereas that for a train of 12 identical leading–lagging click pairs is about 16 ms. Given that the leading–lagging click pairs in the ABR paradigm employed in this study were to be presented continuously for thousands of repetitions, it was assumed that buildup of echo suppression would be maximal and therefore a delay of 8.4 ms for the lagging click pair with regard to the leading right-ear click was selected. This delay also corresponds approximately to the maximum interclick interval tested in Bianchi et al. (2013).
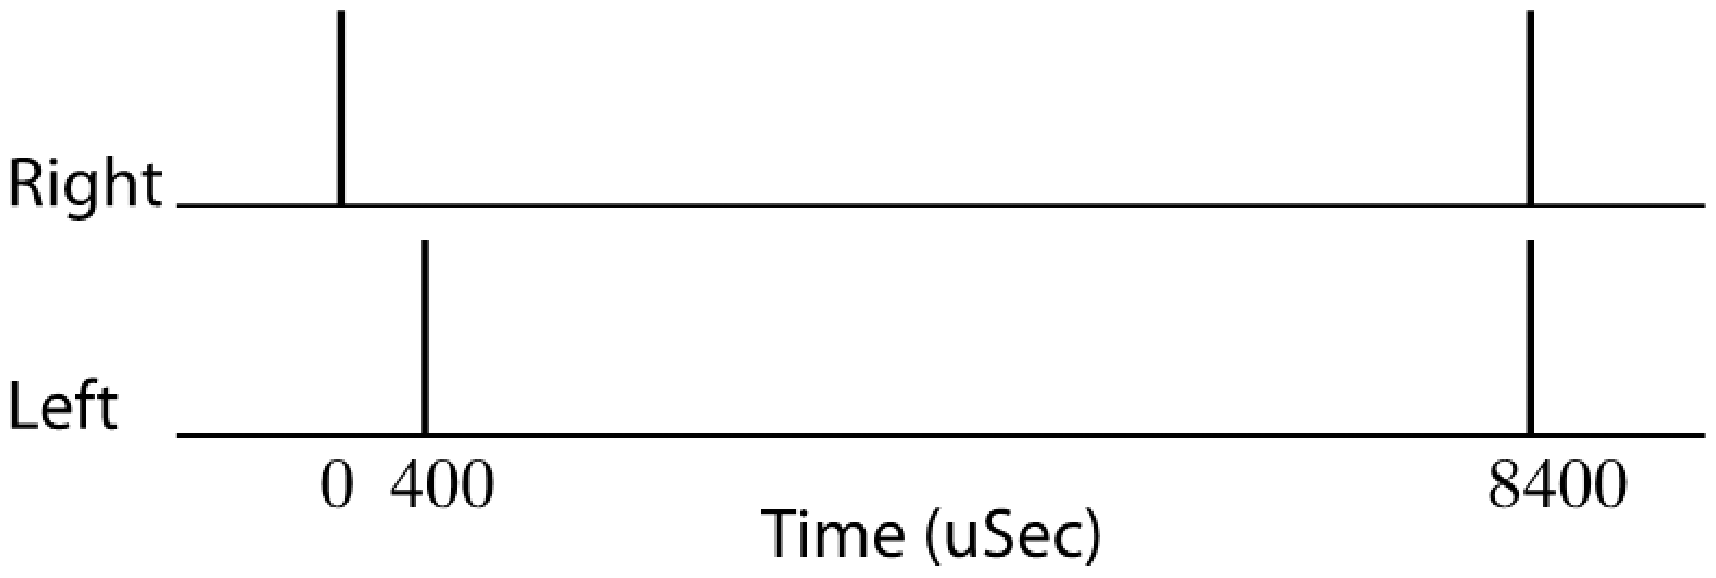
Stimulus schematic of LeadLag condition showing temporal positioning of right- and left-ear click pairs.
Presentation of the full stimulus configuration, as shown in Figure 1, was termed the LeadLag condition. Two further conditions were created by subdividing the full configuration into either the leading click pair alone (Lead condition) or the lagging click pair alone (Lag condition). For each of these three conditions, ABRs were collected for three modes of stimulation: right ear alone (Lead-R, Lag-R, and LeadLag-R), left ear alone (Lead-L, Lag-L, and LeadLag-L), and binaural (Lead-Bin, Lag-Bin, and LeadLag-Bin).
Procedure
The ABR recordings were undertaken in a large double-walled sound booth that was electromagnetically shielded. This booth was located within a room that was itself electromagnetically shielded. The participant was seated in a recliner chair that could be adjusted to a supine position, and insert earphones (ER2, Etymotic, Elk Grove, IL) were placed securely in the ears. Using a midline montage, Ag–AgCl electrodes were placed at the vertex (Cz, noninverting) 1 , nape of neck (∼C7, inverting), and low forehead (∼Fpz, ground). This montage optimizes the recording of Wave V for either ear stimulation but is not optimal for recording the earlier ABR waves. Electrode impedances were maintained below about 2 kΩ. Prior to starting the ABR, the three binaural stimulus conditions (Lead-Bin, Lag-Bin, and LeadLag-Bin) were played sequentially to the participant at the same rate as used for the ABR recordings. For each condition, the participant marked on a schematic horizontal cross section of the head the perceived position of the lateralized image associated with that stimulus. This informal indexing was intended to provide a qualitative verification that the Lead-Bin and Lag-Bin configurations generated different spatial percepts, and that the LeadLag-Bin configuration was not lateralized to the same location as the Lag-Bin configuration. However, participants were not specifically queried as to the nature of the percept (unitary image, diffuse image, etc.). Following this step, the recliner was then adjusted to the supine position, the lights dimmed, and the participant instructed to lay still and preferably nap for the duration of the study.
Single-channel ABRs were recorded using an Intelligent Hearing Systems SmartEP platform (IHS, Miami, FL). The electroencephalographic input was filtered between 100 and 3000 Hz, amplified with a gain of X100K, and subjected to an artifact rejection cut-off of 15 µV. The presentation rate for each stimulus configuration was 19.3/sec. Each recording constituted the average of 2048 artifact-free sweeps. A strict acceptance criterion was implemented wherein a 2048-average recording was accepted only if fewer than 10 artifact rejections had occurred during the course of that recording, indicating an overall quiet recording condition. The recordings progressed sequentially through the nine stimulus configurations (three presentation modes for each of the three conditions). That is, one 2048-average recording was collected for each stimulus configuration before the sequence of stimulus configurations was cycled through again. At least three, but often four if time permitted, replications of each stimulus configuration were collected. A complete recording session lasted approximately 2 to 3 hr.
Offline, the 3 or 4 replications were themselves averaged, yielding a final average of 6144 sweeps (three replications) or 8192 sweeps (four replications) per stimulus configuration. For each participant and for each of the three conditions (Lead, Lag, and LeadLag), the BIC was computed by adding together the respective right-ear and left-ear responses and subtracting this summed monaural waveform from the binaural response. No baseline correction was incorporated in these waveform computations.
Results
The perceived image positions marked on the schematic head cross sections by the individual participants indicated that the image position for the Lead-Bin configuration was clearly to the right of Lag-Bin image position, as expected. In only two cases did the marked positions suggest that the Lead-Bin and LeadLag-Bin images were collocated; in the remainder of the cases, the LeadLag-Bin condition image was somewhat intermediate between the other two positions suggesting that the presence of the leading click pair continued to influence the perceived location of the overall stimulus complex. Although participants were not queried about the nature of the images, all but one of the participants marked the image positions with a punctate point, suggesting that a single image was perceived. The one exception indicated a range of positions for each configuration, suggesting a general difficulty with lateralization judgments; however, even here the ranges were not identical across the three stimulus configurations, and shifted leftwards between Lead-Bin and Lag-Bin, with LeadLag-Bin being intermediate.
Figure 2 shows the individual and group mean ABR waveforms for the nine stimulus configurations (three presentation modes for each of the three conditions) as well as the summed monaural waveforms. Within each panel, the light traces are the individual waveforms and the heavy dark trace is the group mean. The major positive peak in each of the Lead and Lag waveforms was designated ABR Wave V, and the two major peaks in the LeadLag waveforms were also designated Wave Vs—the earlier one being elicited by the leading clicks and the later one being elicited by the lagging clicks. For reference, these peaks have been marked in the upper row of panels in Figure 2. To quantify these traces, the latency and amplitude of the ABR Wave V peaks were measured for each individual trace. Latency was measured as the time to the absolute peak of this wave, and amplitude was measured as the voltage difference between this peak and the following trough. The mean and standard deviation of these measurements are shown in Figures 3 and 4. Several general observations can be made. First, in terms of response latencies (Figure 3), the latencies to the leading clicks were always shorter for the right-ear click (Lead-R and LeadLag-R) than for the left-ear click (Lead-L and LeadLag-L). The average difference was 400 µs which corresponds precisely to the ITD of the leading click pair. The response latencies to the lagging clicks were essentially the same for the right-ear and left-ear clicks, which is to be expected since they were presented with no ITD. A second general observation in terms of response latencies is that the peak latencies for each stimulation mode were always longer when the two click pairs were presented together (LeadLag) than when they were presented separately (Lead or Lag). However, these latency shifts were longer for the lagging click pair than for the leading click pair. To verify this, the individual latency shifts across the 10 participants were submitted to a linear mixed model analysis implemented using RStudio (RStudio, Inc., Boston, MA). The factors were condition (Lead and Lag) and presentation mode (Left, Right, and Binaural). The analysis indicated a significant effect of condition, t(42) = −4.87; p < .002, with the latency shifts for Lag being consistently longer than for Lead. The effect of mode was also significant, with the latency shifts for Binaural being longer than for either Left t(42) = −2.48; p = .017, or Right, t(42) = −2.35; p = .023. 2 No other interaction terms were significant.

Individual (Light Gray) and Group Mean (Heavy Black) ABRs. Waveforms are shown for the three conditions: Lead (left column), Lag (middle column), and LeadLag (right column). From upper to lower, the rows depict stimulation mode: right ear alone, left ear alone, binaural, and the sum of left- and right-ear monaural responses. Wave V is marked in the upper row of panels.

Mean Wave V latencies as a function of stimulation mode. Parameter is condition (see insets for key).

Mean Wave V amplitudes as a function of stimulation mode. Parameter is condition (see insets for key).
In terms of response amplitudes (Figure 4), one general observation is that, as expected, the amplitudes were always larger for binaural stimulation than for monaural stimulation alone. However, the response amplitudes did not vary as a function of whether the two click pairs were presented together (LeadLag) or whether they were presented separately (Lead or Lag). This was confirmed with a linear mixed model analysis on the individual amplitude changes across the 10 participants which showed no significant differences (p’s ranging from 0.36 to 0.91).
Figure 5 shows the derived individual and group mean BIC waveforms, with the light traces again being the individual waveforms and the heavy dark trace the group mean. Note that the amplitude scale is expanded relative to that for the raw traces in Figure 2. For all participants, a BIC was elicited in the Lead and Lag conditions, as demonstrated by the derived negativity that aligned in time across all participants. When both click pairs were presented together in the LeadLag condition, a BIC was elicited for all participants only by the leading click pair. On average, no BIC was evident for the lagging click pair in this configuration; that is, no waveform negativities that aligned in time across participants were observed in the latter part of the response. Quantification of the individual BICs is challenging because of their small and variable amplitudes even under optimum conditions. The approach taken here was to define a region of interest (ROI), or latency window, based on the group average response. The ROI extended from ±1 ms with regard to the most negative point of the group-average BIC, as shown by the vertical dashed lines in the Figure 5 panels. For each individual, the BIC amplitude was defined as the voltage difference between the most negative value within the ROI and the average amplitudes of the two ROI boundary values. The BIC latency was defined as the time to the most negative value within the ROI. Figure 6 displays the group mean BIC amplitudes for the three conditions. A linear mixed model analysis indicated that the Lag BIC was larger than either the Lead BIC, t(17) = −2.26; p = .037, or the LeadLag BIC, t(17) = −4.06; p < .001, but that the latter two BICs did not differ in amplitude, t(17) = −1.64; p = .119. In terms of latency, the means (standard deviations) of the BICs for each of the three conditions were Lead = 6.74 (0.25) ms, LeadLag = 6.90 (0.37) ms, and Lag = 15.00 (0.21) ms. A linear mixed model analysis confirmed that, although the Lag BIC latency was obviously the longest, the latencies of the Lead and LeadLag BICs did not differ, t(17) = 1.21; p =.244.
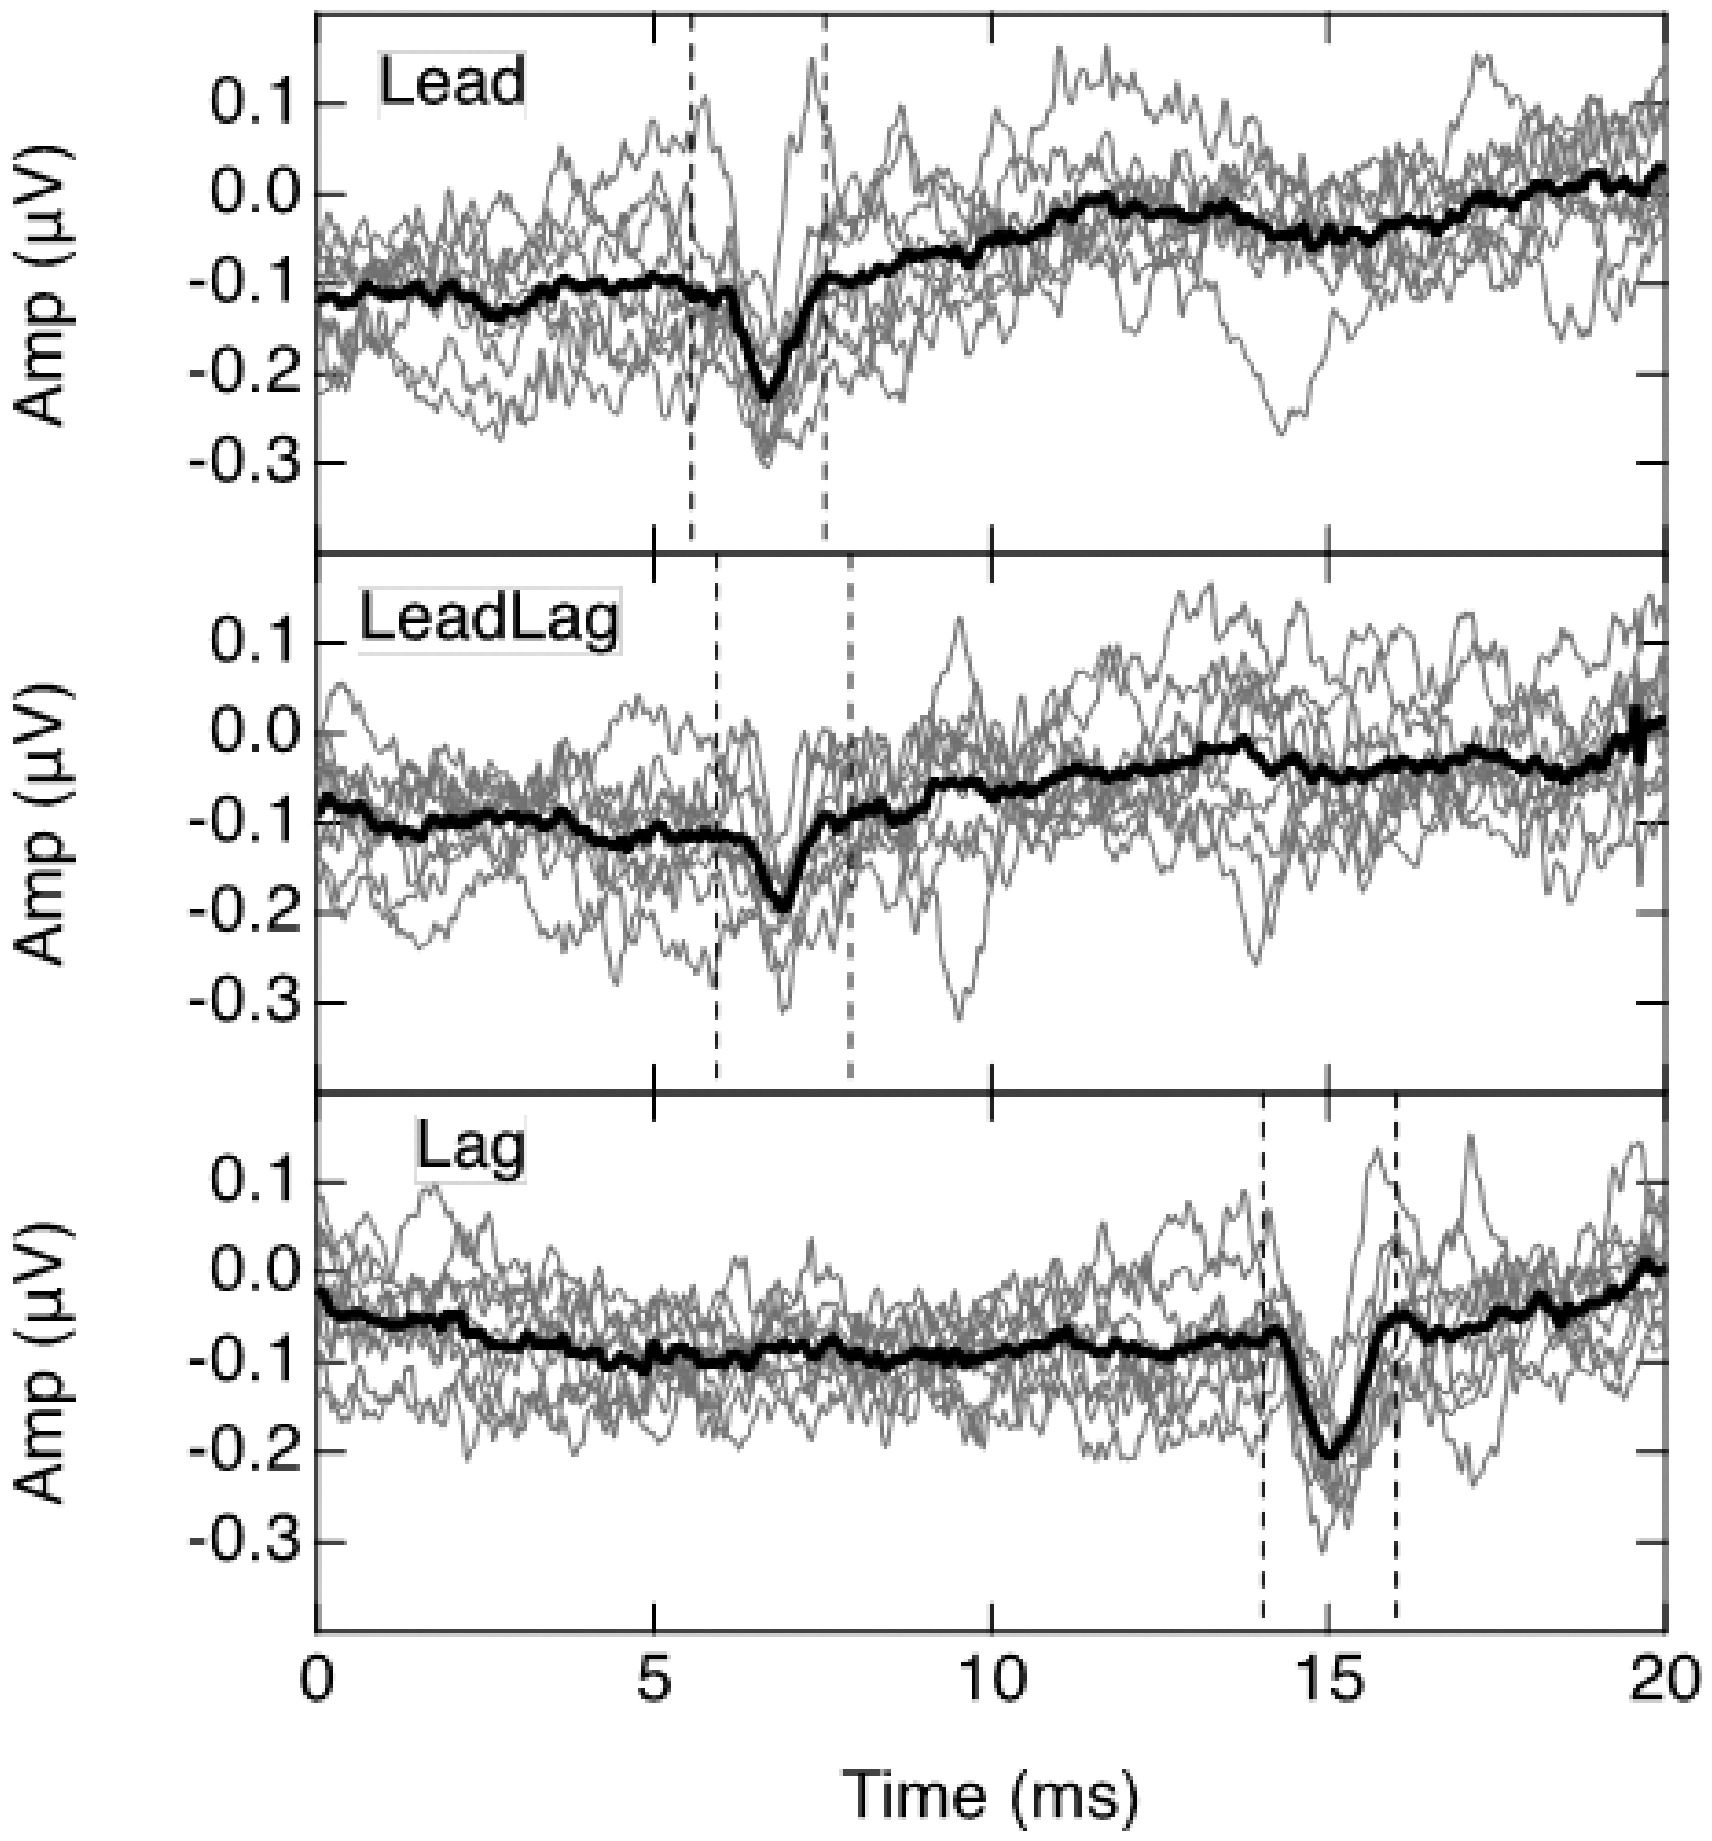
Individual (Light Gray) and Group Mean (Heavy Black) BIC waveforms. Panels (upper to lower) show results for Lead, LeadLag, and Lag conditions. Vertical dashed lines indicate BIC window.

BIC Amplitudes for the three conditions. Error bars are ±1 standard deviation.
Discussion
The purpose of this study was to determine whether binaural processes associated with echo suppression could be demonstrated using the ABR. Whereas monaural contributions to echo suppression have been demonstrated for short interclick intervals (e.g., Bianchi et al., 2013), the interest here was specifically in binaural processes. The hypothesis being tested was that a binaural contribution is evident at the level of the brainstem in the form of a diminished or absent BIC associated with the echo. The results of the study show that both the leading pair of binaural clicks, with their 400-µs ITD, and the lagging pair of diotic binaural clicks were capable of generating a BIC. The most robust BIC was obtained for the diotic click pair alone (Lag condition) where the average amplitude was about 0.17 µV. This is smaller than the average of 0.24 µV reported by Riedel and Kollmeier (2006). However, they noted that there is marked variation in individual BIC amplitudes which, in their participants, ranged from 0.13 to 0.42 µV. The BIC amplitude for the Lead condition was about 0.14 µV.
The key finding of this study was that the BIC elicited by a diotic pair of clicks presented in isolation (Lag condition) is obliterated when that diotic pair of clicks constitutes the echo of a leading pair of clicks—at least for the click levels and 8.4-ms interclick interval employed here. This finding supports the hypothesis of a binaural contribution to echo suppression being evident at the level of the brainstem. However, it could be argued that the observed obliteration of the BIC does not explicitly signify a binaural contribution but could instead simply reflect a suppression of the lagging clicks by the leading clicks due to monaural processes, with this monaural suppression being sufficient to undermine the generation of a BIC. In counter to this argument, the results of Bianchi et al. (2013) showed that monaural suppression in the ABR was evident as an amplitude reduction in the response to the lagging clicks due to the presence of the leading clicks. This amplitude reduction for short interclick intervals is evident also in the data of Damaschke et al. (2005) who further showed that the reduction is no longer evident for interclick intervals in excess of about 5 ms. In the present data, with an interclick interval of 8.4 ms, there was no amplitude reduction (see Figure 4), but a latency shift was observed. That is, the presence of the leading pair of clicks prolonged the latency of the response to the lagging pair of clicks by about 0.4 ms. A similar latency shift is also evident in Damaschke et al. (2005). This latency shift is reminiscent of the ABR findings of Burkard and Hecox (1987) who sought to distinguish between adaptation effects associated with repetitive stimulation and those associated with forward masking due to prior stimulation. Adaptation associated with repetitive stimulation referred to the influence that each click within a click-train stimulus had on the response to succeeding clicks, whereas forward masking associated with prior stimulation referred to the influence that a preceding noise burst had on the response to each click within the click-train stimulus. They showed that forward masking associated with prior stimulation both increased the latencies and decreased the amplitudes of the ABRs to the individual clicks in the click-train stimulus. However, the effect of repetitive stimulation was only to increase the latencies of responses to successive clicks in the click-train stimulus to an asymptotic shift of about 0.5 ms, but without any decrease their amplitudes. Although the interclick interval in their click-train stimulus (12.5 ms) was longer than the 8.4 ms interval between the leading and lagging click pairs in this study, their finding suggests that the increased latency but stable amplitude observed here was due to the repetitive stimulation.
In terms of binaural processing, the repetitive stimulation associated here with ABR testing also has bearing on the echo threshold. Because echo suppression builds up with repetitive stimulation (e.g., Krumbholz & Nobbe, 2002), the thousands of stimulus repetitions associated with ABR collection are expected to extend the interval over which echo suppression holds. Recall that the behavioral echo threshold of about 4 ms measured by Bianchi et al. (2013) is shorter than the 8.4-ms interclick interval implemented here. However, because of build-up of echo suppression associated with repetitive ABR stimulation, it was anticipated that the time window of suppression would be extended to include this interclick interval. That is, the presence of the leading click pair would maintain an influence over the lateralization of the whole stimulus complex as expected by the Precedence Effect. The qualitative perceptual index used to gauge lateralization suggested that this expectation was met in the current stimulus configuration. The simple premise, therefore, was that the disappearance of the BIC to the lagging click pair in the LeadLag condition was an electrophysiological parallel to the perceptual report. As such, the pattern of results supports the interpretation that the absence of a BIC to a diotic click pair when that click pair constitutes the echo to a preceding click pair reflects binaural, rather than monaural, processing under the conditions tested here. Furthermore, since the BIC reflects activity at the brainstem level that is uniquely associated with binaural processing (e.g., Benichoux et al., 2018; Tolnai & Klump, 2020), the results suggest a contribution of binaural processing at the level of the brainstem to echo suppression.
In summary, this study showed that the BIC elicited with a pair of diotic clicks can be obliterated when that click pair constitutes the echo of a leading pair of clicks and when the interclick interval is 8.4 ms. This configuration of click pairs conformed to the Precedence Effect in that the perceptual spatialization of the stimulus complex was dominated by the lateralization associated with the leading click pair. The obliteration of the lagging BIC was associated with a latency prolongation of Wave V at the monaural level but not with an amplitude decrement. In light of the findings of Bianchi et al. (2013), this suggests that forward masking at the level of the cochlea was not the predominant mechanism underlying the effect.
Footnotes
Acknowledgments
The assistance of Katie Sobon and Taylor Nicol in data collection and analysis is gratefully acknowledged.
Declaration of Conflicting Interests
The authors declared no potential conflicts of interest with respect to the research, authorship, and/or publication of this article.
Funding
The authors disclosed receipt of the following financial support for the research, authorship, and/or publication of this article: This work was supported by the National Institute on Deafness and other Communication Disorders (Grant number R01-DC001507).