
Abstract
In addition to speech intelligibility, listening effort has emerged as a critical indicator of hearing performance. It can be defined as the effort experienced or invested in solving an auditory task. Subjective, behavioral, and physiological methods have been employed to assess listening effort. While previous studies have focused predominantly evaluated listening effort at clearly audible levels, such as in speech-in-noise conditions, we present findings from a study investigating listening effort for soft speech in quiet. Twenty young adults with normal hearing participated in speech intelligibility testing (OLSA), adaptive listening effort scaling (ACALES), and pupillometry. Experienced effort decreased with increasing speech level and “no effort” was reached at 40 dB sound pressure level (SPL). The difference between levels rated with “extreme effort” and “no effort” was, on average, 20.6 dB SPL. Thus, speech must be presented well above the speech-recognition threshold in quiet to achieve effortless listening. These results prompted a follow-up experiment involving 18 additional participants, who completed OLSA and ACALES tests with hearing threshold-simulating noise at conversational levels. Comparing the results of the main and follow-up experiments suggests that the observations in quiet cannot be fully attributed to the masking effects of internal noise but likely also reflect cognitive processes that are not yet fully understood. These findings have important implications, particularly regarding the benefits of amplification for soft sounds. We propose that the concept of a threshold for effortless listening has been overlooked and should be prioritized in future research, especially in the context of soft speech in quiet environments.
Introduction
Listening effort has emerged as an important indicator of hearing performance (McGarrigle et al., 2014; Pichora-Fuller et al., 2016). It can be defined as the effort experienced or invested in solving an auditory task such as understanding speech in various types of background noise (Koelewijn et al., 2018). While most studies have examined listening effort at clearly audible presentation levels with background noise, recent work highlights the relevance of listening effort under low sound pressure levels in quiet conditions (Ferschneider & Moulin, 2023). The present study therefore aims to investigate listening effort for soft speech in quiet in normal-hearing listeners.
The rising interest in listening effort reflects growing awareness that hearing performance involves not only how well an auditory task is completed, but also how effortful it is (Shields et al., 2022) and how it relates to fatigue (McGarrigle et al., 2014). Listening effort thus extends traditional hearing assessment. This is particularly relevant when task performance remains constant, such as with noise reduction in hearing aids, which may not improve intelligibility but can reduce effort (Husstedt et al., 2021; Sarampalis et al., 2009). To assess listening effort, subjective, behavioral, and physiological methods are used. For subjective ratings, a participant is typically asked directly how effortful the task was perceived (Schulte et al., 2015), though indirect questions are also employed, e.g., willingness to stay in the situation (Slugocki et al., 2024). Adaptive procedures provide graded effort levels akin to a psychometric function (Krueger, Schulte, Brand et al., 2017). Behavioral measures include response time in single-(Gatehouse & Gordon, 1990; Houben et al., 2013; Pals et al., 2015) or multi-task paradigms (Gagné et al., 2017; Kwak & Han, 2018; Picou & Ricketts, 2014; Seeman & Sims, 2015; Wu et al., 2014, 2016). Physiological measures reflect central and autonomic nervous system activity, such as functional magnetic resonance imaging (fMRI) (Alain et al., 2018; Francis & Love, 2020; Peelle, 2018; Wild et al., 2012), electroencephalography (EEG) (Alhanbali et al., 2019; Bernarding et al., 2012, 2017; Fiedler et al., 2021; Haro et al., 2022; Miles et al., 2017; Obleser et al., 2012), event-related potentials (ERPs) (Obleser & Kotz, 2011), functional near-infrared spectroscopy (fNIRS) (Rovetti et al., 2019; Shatzer & Russo, 2023), skin conductance (Alhanbali et al., 2019; Mackersie & Cones, 2011; Seeman & Sims, 2015), pupil dilation (Haro et al., 2022; Koelewijn et al., 2012, 2018; Miles et al., 2017; Ohlenforst et al., 2018; Visentin et al., 2022; Wendt et al., 2017; Winn et al., 2015), heart rate, and heart rate variability (Mackersie & Calderon-Moultrie, 2016; Seeman & Sims, 2015).
Most studies on listening effort share the common feature that auditory tasks are performed at clearly audible levels, typically in the context of speech-in-noise paradigms. However, many everyday listening situations involve speech presented at lower sound levels in quiet environments (Wu et al., 2018). Stronks et al. (2021) noted that soft speech in the range of 30–45 dB sound pressure level corresponds to the level of a quiet whisper or the ambient noise in a quiet office. Such levels can also occur when being spoken to by children or when listening to someone speaking from another room. In response to this, Stronks et al. (2021) investigated a feature in cochlear implants designed to enhance the perception of soft speech. Similarly, Ferschneider and Moulin (2023) measured experienced listening effort in both normal-hearing individuals and hearing aid users, finding that listening effort is especially pronounced in quiet conditions for hearing aid users. Schulte et al. (2024) also emphasized the importance of quiet listening environments, noting that fewer than 20% of all acoustic situations are noisy or very noisy. They evaluated a feature designed to enhance soft speech for hearing aid users and included scenarios such as conversing with a person in another room or from a distance (Husstedt et al., 2022), both of which typically involve low speech levels. Additional real-world situations that involve low-level speech include conversations where speakers are behind barriers or wearing face masks (Badh & Knowles, 2023). Taken together, these findings support the relevance of soft-speech listening scenarios in everyday life, particularly for individuals with elevated hearing thresholds due to hearing loss (Ferschneider & Moulin, 2023). We therefore believe that understanding listening effort in such situations is of practical and clinical importance.
The aim of the present study is to provide basic data characterizing both experienced and invested listening effort, as well as the relation to speech intelligibility for soft speech in quiet. It is well-known that reduced audibility at low speech levels limits intelligibility both with and without masking noise (Plomp, 1978), which expectably leads to increased listening effort with decreasing speech levels. In Denk et al. (2024), experienced listening effort and speech recognition thresholds were measured across various noise levels. During that study, we incidentally observed that self-reported listening effort increased more at lower sound pressure levels than could be accounted for by changes in speech intelligibility alone. However, the lowest noise level tested was 30 dB SPL, and a true quiet condition was not included. Measurements in the current study thus included an assessment of experienced listening effort using an adaptive rating procedure, an estimation of the individual psychometric function of speech intelligibility, and pupillometric responses at levels covering the individually relevant ranges for speech intelligibility and listening effort. This comprehensive test battery allowed to investigate the relation between experienced and invested listening effort to speech intelligibility, which has been well characterized in conditions with background noise (Kemper et al., 2025). Given that significant differences to conditions in background noise were indeed observed, a follow-up experiment with additional participants was conducted to test the hypothesis that these differences might mainly originate from the fact that in quiet the spectrum of the (internal) noise at hearing threshold is poorly matched to speech. This experiment included measurements of speech recognition and experienced listening effort using both a spectrally matched noise masker and hearing threshold-simulating noise (HTSN) presented at conversational levels.
Methods
Study Design and Experimental Sequence
The primary aim of this study was to investigate both perceived and invested listening effort during the perception of soft speech in quiet among individuals with normal hearing. To assess these types of listening effort, two methods were employed: the Adaptive CAtegorical Listening Effort Scaling (ACALES) procedure for experienced effort (Krueger, Schulte, Brand et al., 2017), and pupil size measurements for invested effort. Additionally, speech intelligibility was evaluated using the German matrix sentence test OLSA (Wagener et al., 1999).
Participants attended one appointment lasting a maximum of 2.5 hr. After the participants had been instructed and had given their written consent, their age, gender, and other information was queried. A medical history was taken, the ears were visually examined for abnormalities and pure tone hearing thresholds were measured. The intended data were then collected as illustrated in Figure 1. The process began with adaptive scaling of experienced listening effort, followed by adaptive speech intelligibility testing, and concluded with pupillometry during a speech test.

Visualization of the experimental sequence. The Adaptive CAtegorical Listening Effort Scaling (ACALES) procedure (Krueger, Schulte, Brand et al., 2017) was conducted first, consisting of two runs: a training run followed by an evaluation run. Next, speech intelligibility was assessed using the German matrix sentence test OLSA (Wagener et al., 1999), which included two training lists and the adaptive procedure to determine SRT50 and SRT80. Finally, individual speech levels were derived from the ACALES and OLSA results for the subsequent pupil size measurements.
Participants
Overall, 20 adults (15 female) aged between 18 and 35 years (M: 27 years) were recruited via a mailing list of the University of Lübeck and personal contacts. Written informed consent from all participants was obtained before the study, and participants received financial compensation for their effort. Inclusion criteria were German language skills comparable to a native speaker, no hearing impairment, no acute cold or other illnesses affecting hearing. Hearing threshold was tested for both ears between 0.25 and 8 kHz and was verified to be below
Facilities and Hardware
All experiments were conducted in a sound-isolated and acoustically treated auditory booth (2.6 × 3.6 × 2.5 m, T20 = 0.1 s) fulfilling the requirement on free field audiometry according to ISO 8253-2. Stimuli were presented via a Fireface 802 soundcard (RME, Germany) and HDA 200 headphones (Sennheiser, Germany), visual instructions were given on a FlexScan EV2451 monitor (EIZO, Japan), and vocal responses of the participants were recorded with a MKE600 microphone (Sennheiser, Germany). Pupil dilation was tracked with a Pro Spectrum Eye Tracker (Tobii AB, Sweden) at 300 Hz, and illuminance at the position of the participant was adjusted with a Voltcraft LX-1108 luxmeter (Conrad Electronic, Germany) to 100 ± 10 lux in the direction of the ceiling, which was equivalent to approx. 144 lux measured in the direction of the monitor showing the experimental interface that was designed in dark grey.
Speech Intelligibility
Speech intelligibility was assessed using the Oldenburg Sentence Test OLSA (Wagener et al., 1999). Each sentence in the test follows a fixed syntactic structure, comprising a name, verb, numeral, adjective, and object, drawn from a closed set of 50 words. These sentences are grammatically correct but have no semantic meaning, making them difficult to memorize and impossible to predict unintelligible words from context. Despite this, the OLSA is known to exhibit a significant training effect. To account for this, and in accordance with the manufacturer's guidelines (Hörzentrum Oldenburg, Germany), two training lists were administered prior to the actual test. Both the training and actual test sessions employed the adaptive procedure with 20 sentences, beginning at a speech level of 30 dB SPL. An open-set test design was applied, with the examiner evaluating the participants’ responses. The test was conducted twice to individually determine the speech-recognition thresholds (SRTs) corresponding to 50% and 80% speech intelligibility in quiet. These thresholds are referred to as

Description of the Eight Conditions Considered in the Experiment.
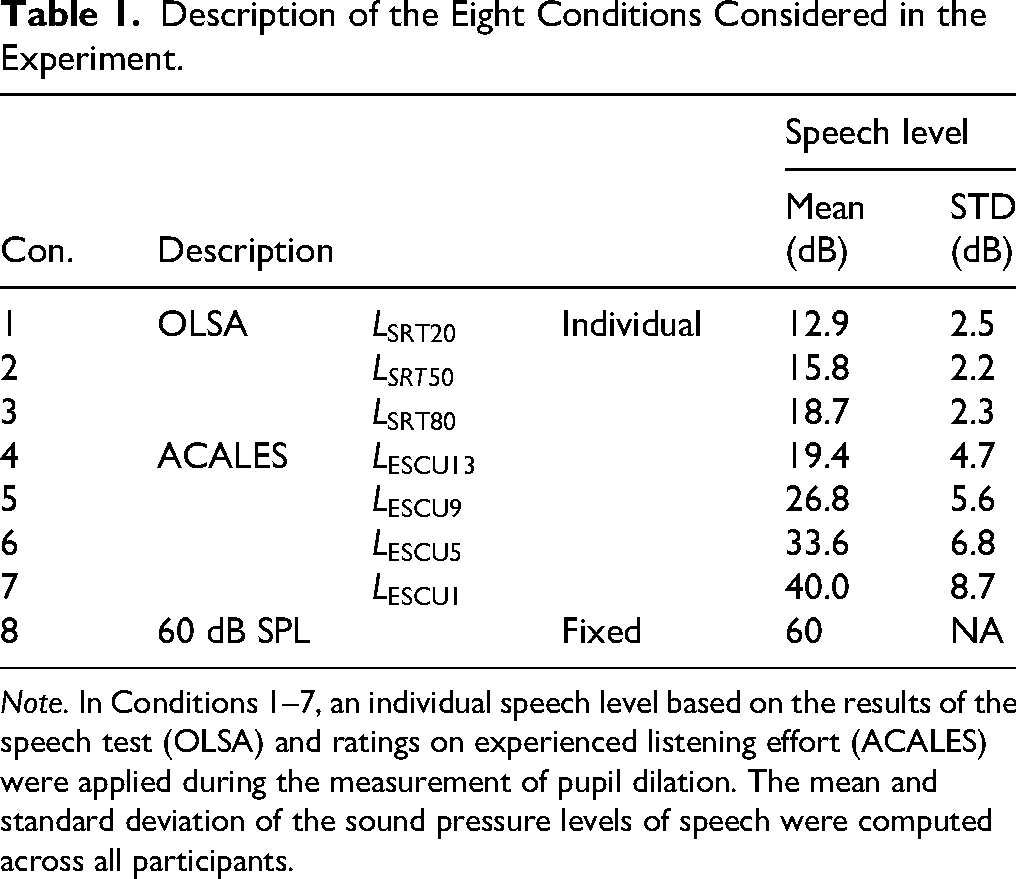
Note. In Conditions 1–7, an individual speech level based on the results of the speech test (OLSA) and ratings on experienced listening effort (ACALES) were applied during the measurement of pupil dilation. The mean and standard deviation of the sound pressure levels of speech were computed across all participants.
Experienced Listening Effort
Subjective or experienced listening effort was measured using the ACALES procedure (Krueger, Schulte, Brand et al., 2017), which involves the same speech material as the OLSA. ACALES was performed before speech testing and the measurements of pupil dilation (see Figure 1). The adaptive procedure consists of multiple trials. During each trial, two sentences of the OLSA are presented and the participants are asked “How much effort do you need to follow the speech?.” The participants gave their feedback via touch screen on a 14-point scale measured in Effort Scale Categorical Units (ESCU). The original scale ranges from “no effort” (ESCU1) to “extreme effort” (ESCU13) and includes the extra category “only noise,” which can be selected during the adaptive procedure but is excluded from the results. After completing the adaptive procedure, all ratings from ESCU1 to ESCU13 are fitted to a piecewise linear function, which consists of two segments connected at ESCU7. Basically, the same evaluation was used for the measurements in quiet, but with minor modifications, i.e., the presentation of noise was disabled, the initial speech level of the adaptive procedure was set to 40 dB SPL, and the category “only noise” was replaced by “nothing heard.” Participants completed two ACALES procedures: the first served as training, and the second was used for evaluation. After completion, the individual speech levels for
Pupillometry
Pupil dilation was evaluated at eight different speech levels as listed in Table 1. Before the first block, the pupillometer was calibrated and recalibrated between blocks as needed. The speech levels in Conditions 1–7 were individually determined during the speech intelligibility and experienced listening effort evaluation as explained previously. Condition 8 included a fixed speech level at a conversational level of 60 dB SPL. All eight conditions were tested within 256 trials grouped into eight blocks each with 32 trials (see Figure 1). In each block, all eight conditions were tested equally often in randomized order. After each block, the participants were allowed to take a break at their own discretion but were required to remain seated. After four blocks, there was always a break of around 10 min, during which the participants were able to leave the measuring booth and rest.
Each trial consisted of a pre-sentence pause (mean 2.3 s, min 1.9 s, max 3 s, right-skewed function), one sentence of the OLSA (mean 2.2 s), and post-sentence pause (mean 3 s, min 2.6 s, max 3.7 s, right-skewed function). Randomized pauses were employed to make the task less predictable and more varied. In this context, “right-skewed” means that the probability density function is not symmetric and that the tail on the right side of the peak is longer than the tail on the left side. We used the following probability density function with the minimal and maximal duration 
During the presentation of the sentences, a loudspeaker symbol was shown on the display. Care was taken to ensure that the brightness does not change significantly due to screen output. In 3/4 of the trials, participants were asked to repeat the sentence and a response window lasting 3 s was added after the post-sentence pause (on average ranging from 5.2 to 8.2 s after OLSA onset). A speech bubble on the display indicated trials requiring a response. Participant's answers were recorded and manually scored after the experiment. No response window was added when no answer was requested. The omission of responses in 25% of the trials was intended to save testing time and did not serve any other purpose in this study.
Pupil data were continuously recorded from both eyes, but only the left eye's data were analyzed using a custom-written toolbox in Matlab (The MathWorks, Inc., USA). The processing followed the guidelines of Geller et al. (2020), since various factors can impair the results of pupil size measurements (Naylor et al., 2018; Seropian et al., 2022; Zekveld et al., 2010, 2018). The direction of the gazes was recorded but not further evaluated. Missing and corrupt data due to movements or blinks were automatically detected by the eyetracker and were marked as missing values. Owing to the effects of eyelid closure on pupil size, gaps of missing data were extended to 100 ms before and 100 ms after the gap. Trials with more than 20% missing data were excluded. Missing values were interpolated linearly and afterward, data were smoothed by a 4-Hz (Butterworth, fourth-order filter) low-pass filter. Furthermore, by usage of a median absolute deviation, rapid pupil size interferences were removed. Then, pupil traces were segmented into trials ranging from −2.5 to 10 s relative to the listening task onset, downsampled to 50 Hz and averaged for each condition and participant. A baseline window from −0.25 s to stimulus onset was defined, and pupil size, measured as area, was expressed as a percentage relative to this baseline. In Figure 2, the mean pupil responses, aligned with the onset of OLSA, are plotted against time across all eight conditions. The analysis window (marked in red) was predefined to last 1 s and its central position was adapted to the first peak after stimulus onset across all conditions. This peak was found at 2.8 s so that analysis window spanned from 2.3 to 3.3 s. The response window (indicated in blue) on average ranged from 5.2 to 8.2 s but was jittered due to the random post-sentence pause.
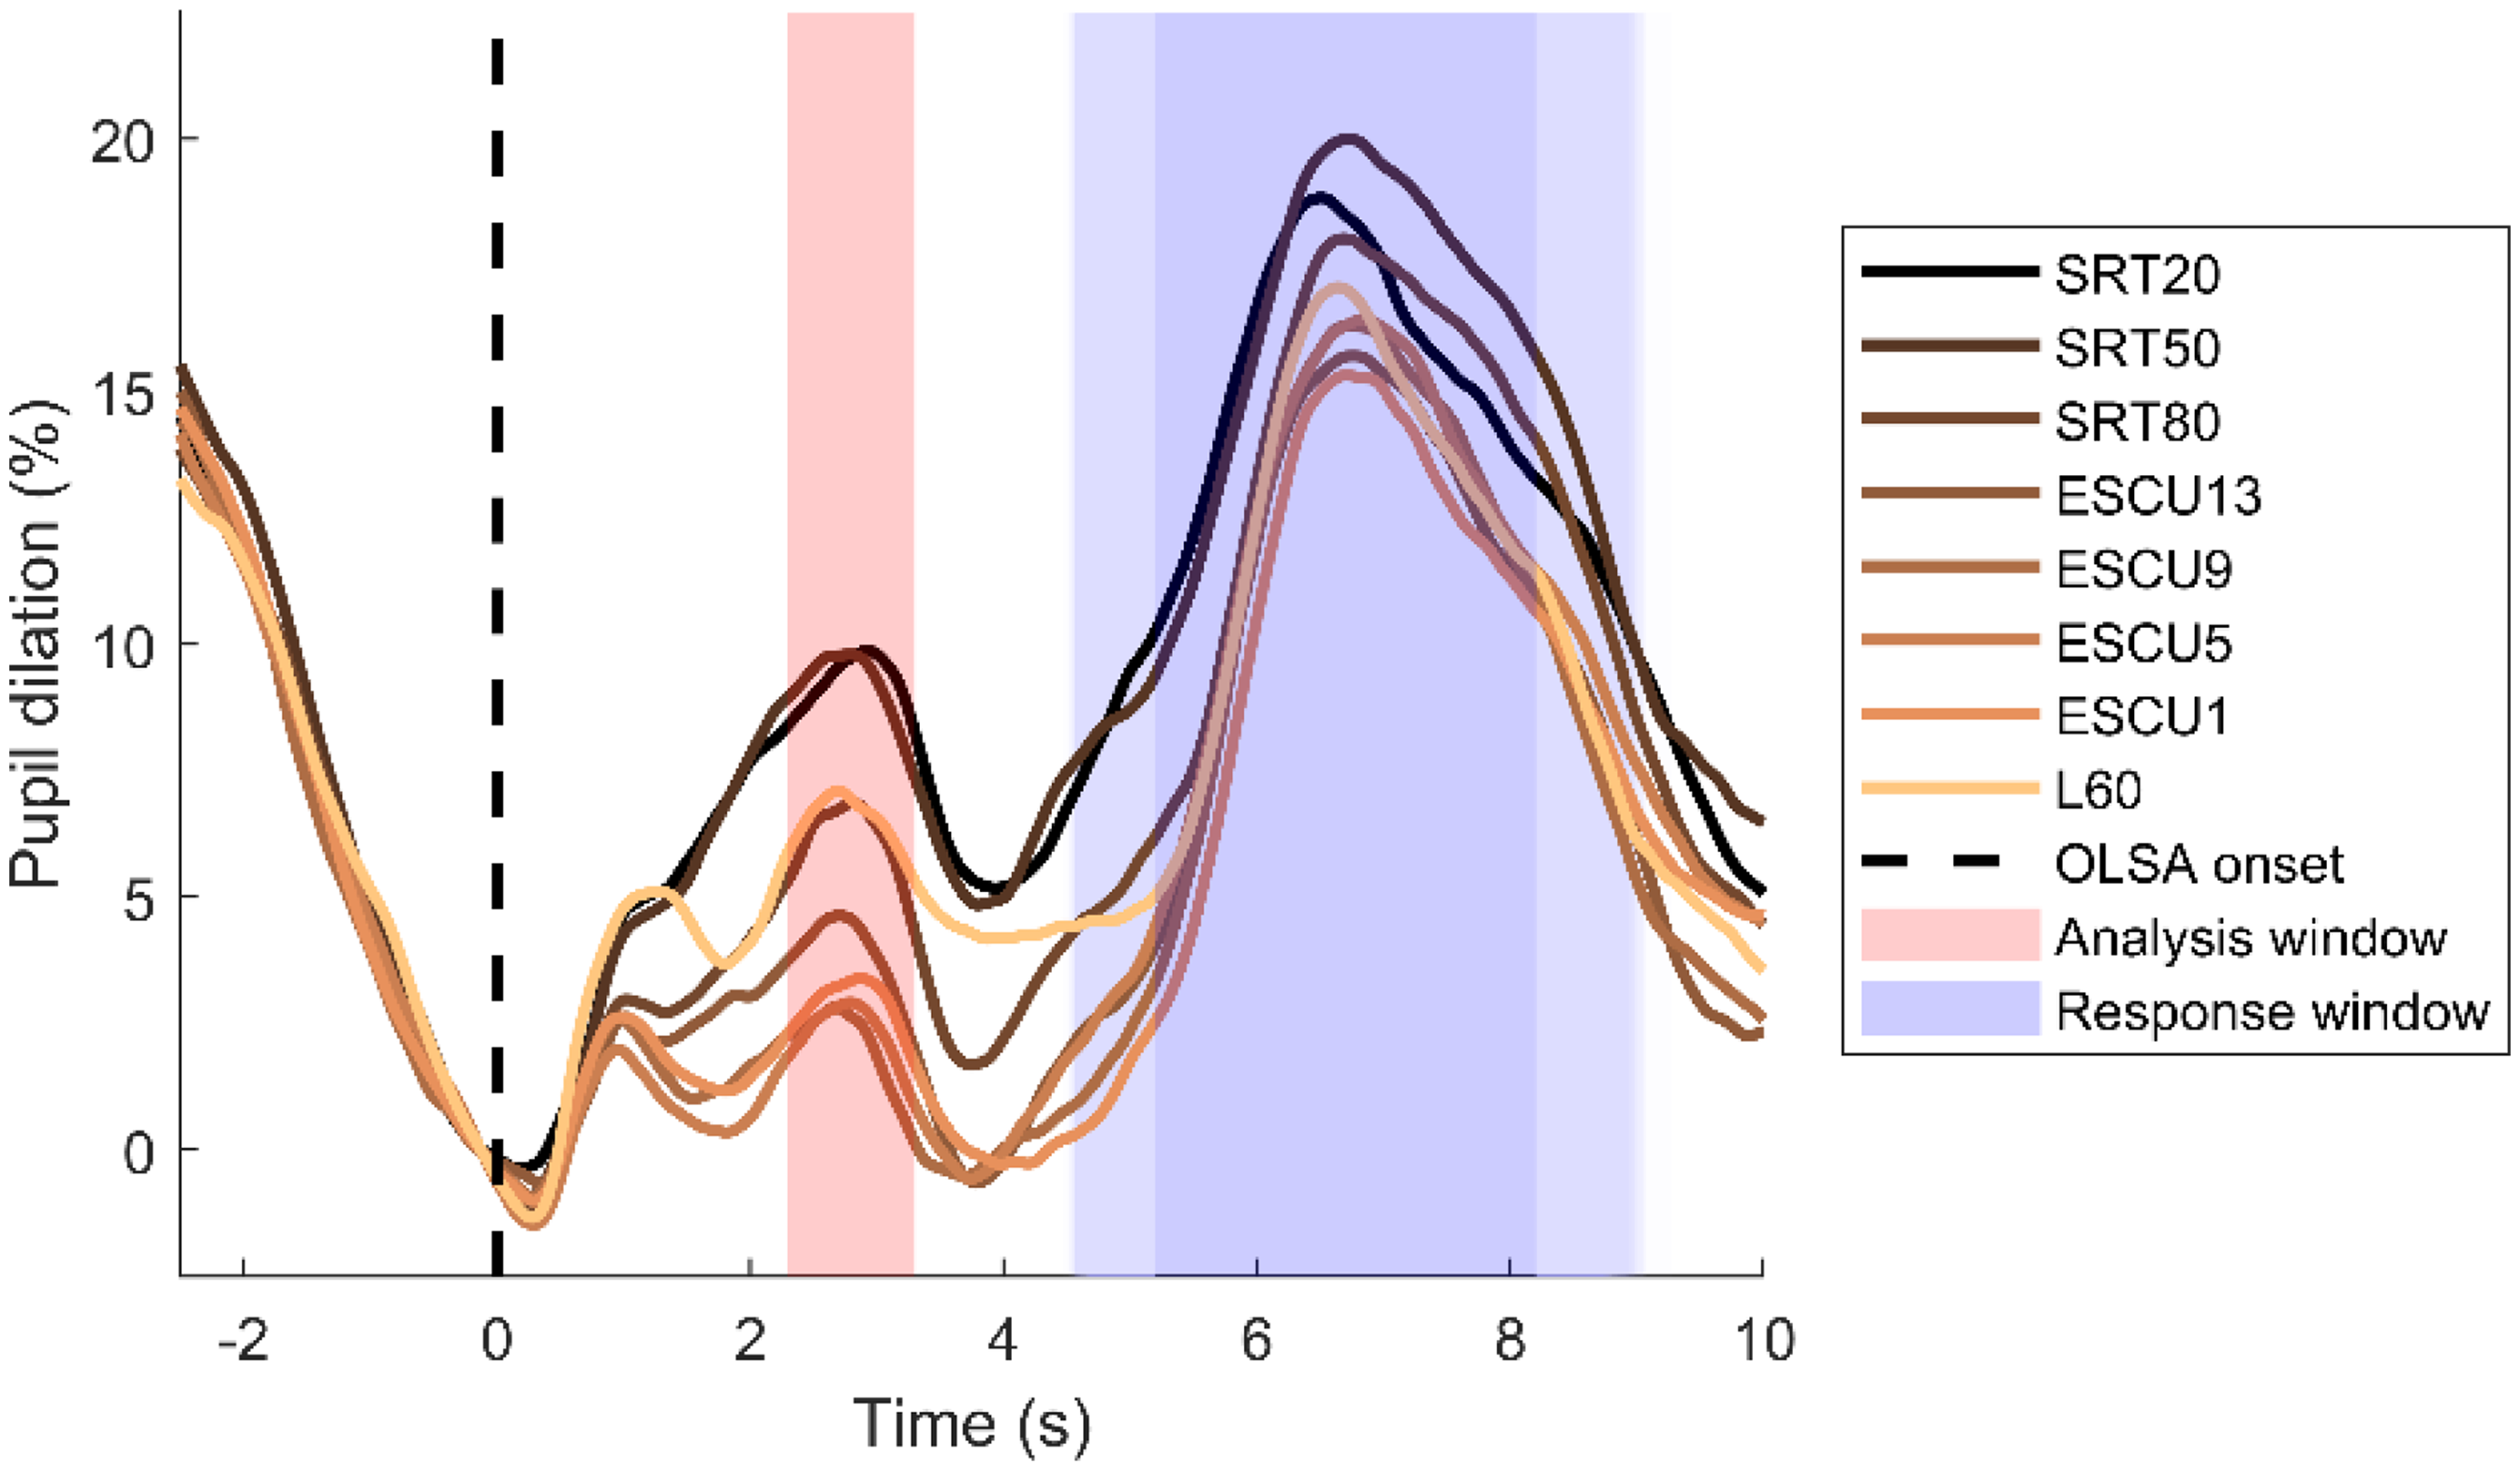
Pupil size relative to baseline, aligned with the onset of OLSA, across all eight conditions. The analysis window (marked in red) spanned from 2.3 to 3.3 s. The response window (indicated in blue) on average ranged from 5.2 to 8.2 s but was jittered due to the random post-sentence pause.
Follow-Up Experiment
The findings of the main experiment led to a follow-up study involving 18 additional normal-hearing participants (13 female), aged between 19 and 29 years (M: 24 years). None of these participants had taken part in the main study. These participants completed the OLSA and ACALES tests both in the standard speech-matched noise and in HTSN presented at conversational levels in a free field. The rationale for this follow-up experiment was based on the common assumption that speech intelligibility at low levels in quiet may be limited by internal noise resembling the hearing threshold, which has a different spectrum from that of the external masker typically used in noise conditions (Plomp, 1978). Therefore, the follow-up study aimed to investigate whether the observed differences in quiet could be explained by variations in the noise spectrum. Specifically,
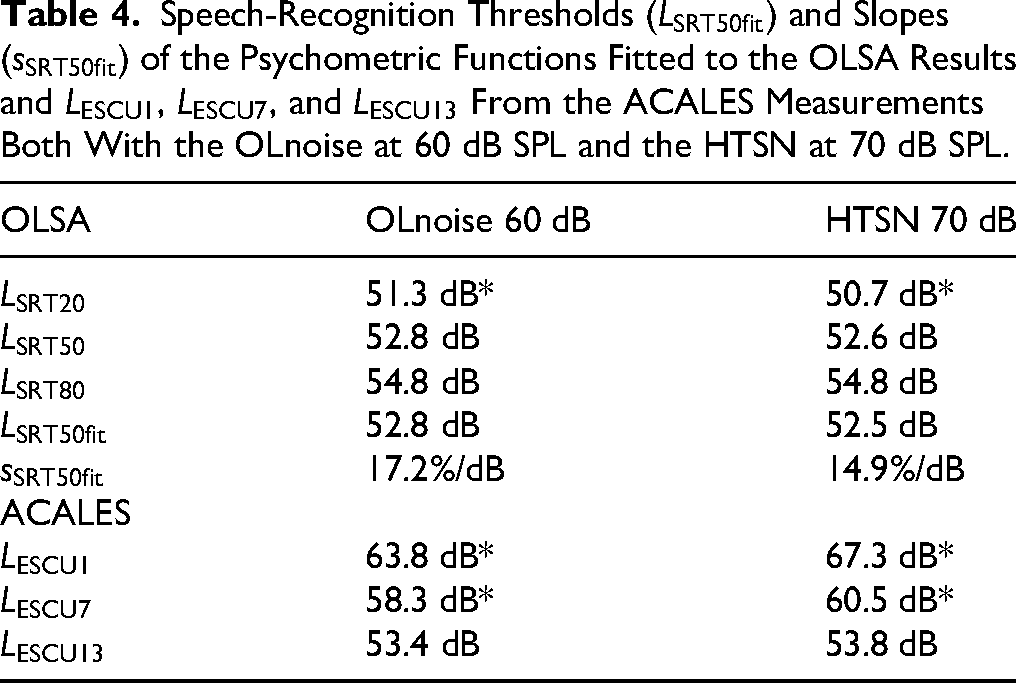
For the HTSN, the 1/3 octave band levels between 0.1 and 10 kHz were set to the free field hearing thresholds (from 0°) according to ISO 389-7. For each 1/3 octave band, independent 1/f noise signals were generated, bandpass-filtered, set to the desired level, and then added together. Pilot testing revealed that the SRT for the HTSN is approx. −17 dB which is about 10 dB lower than with the standard, spectrally matched noise (OLnoise). Participants were tested with the OLnoise at 60 dB SPL and with the HTSN at 70 dB SPL, so the speech level at 50% speech recognition
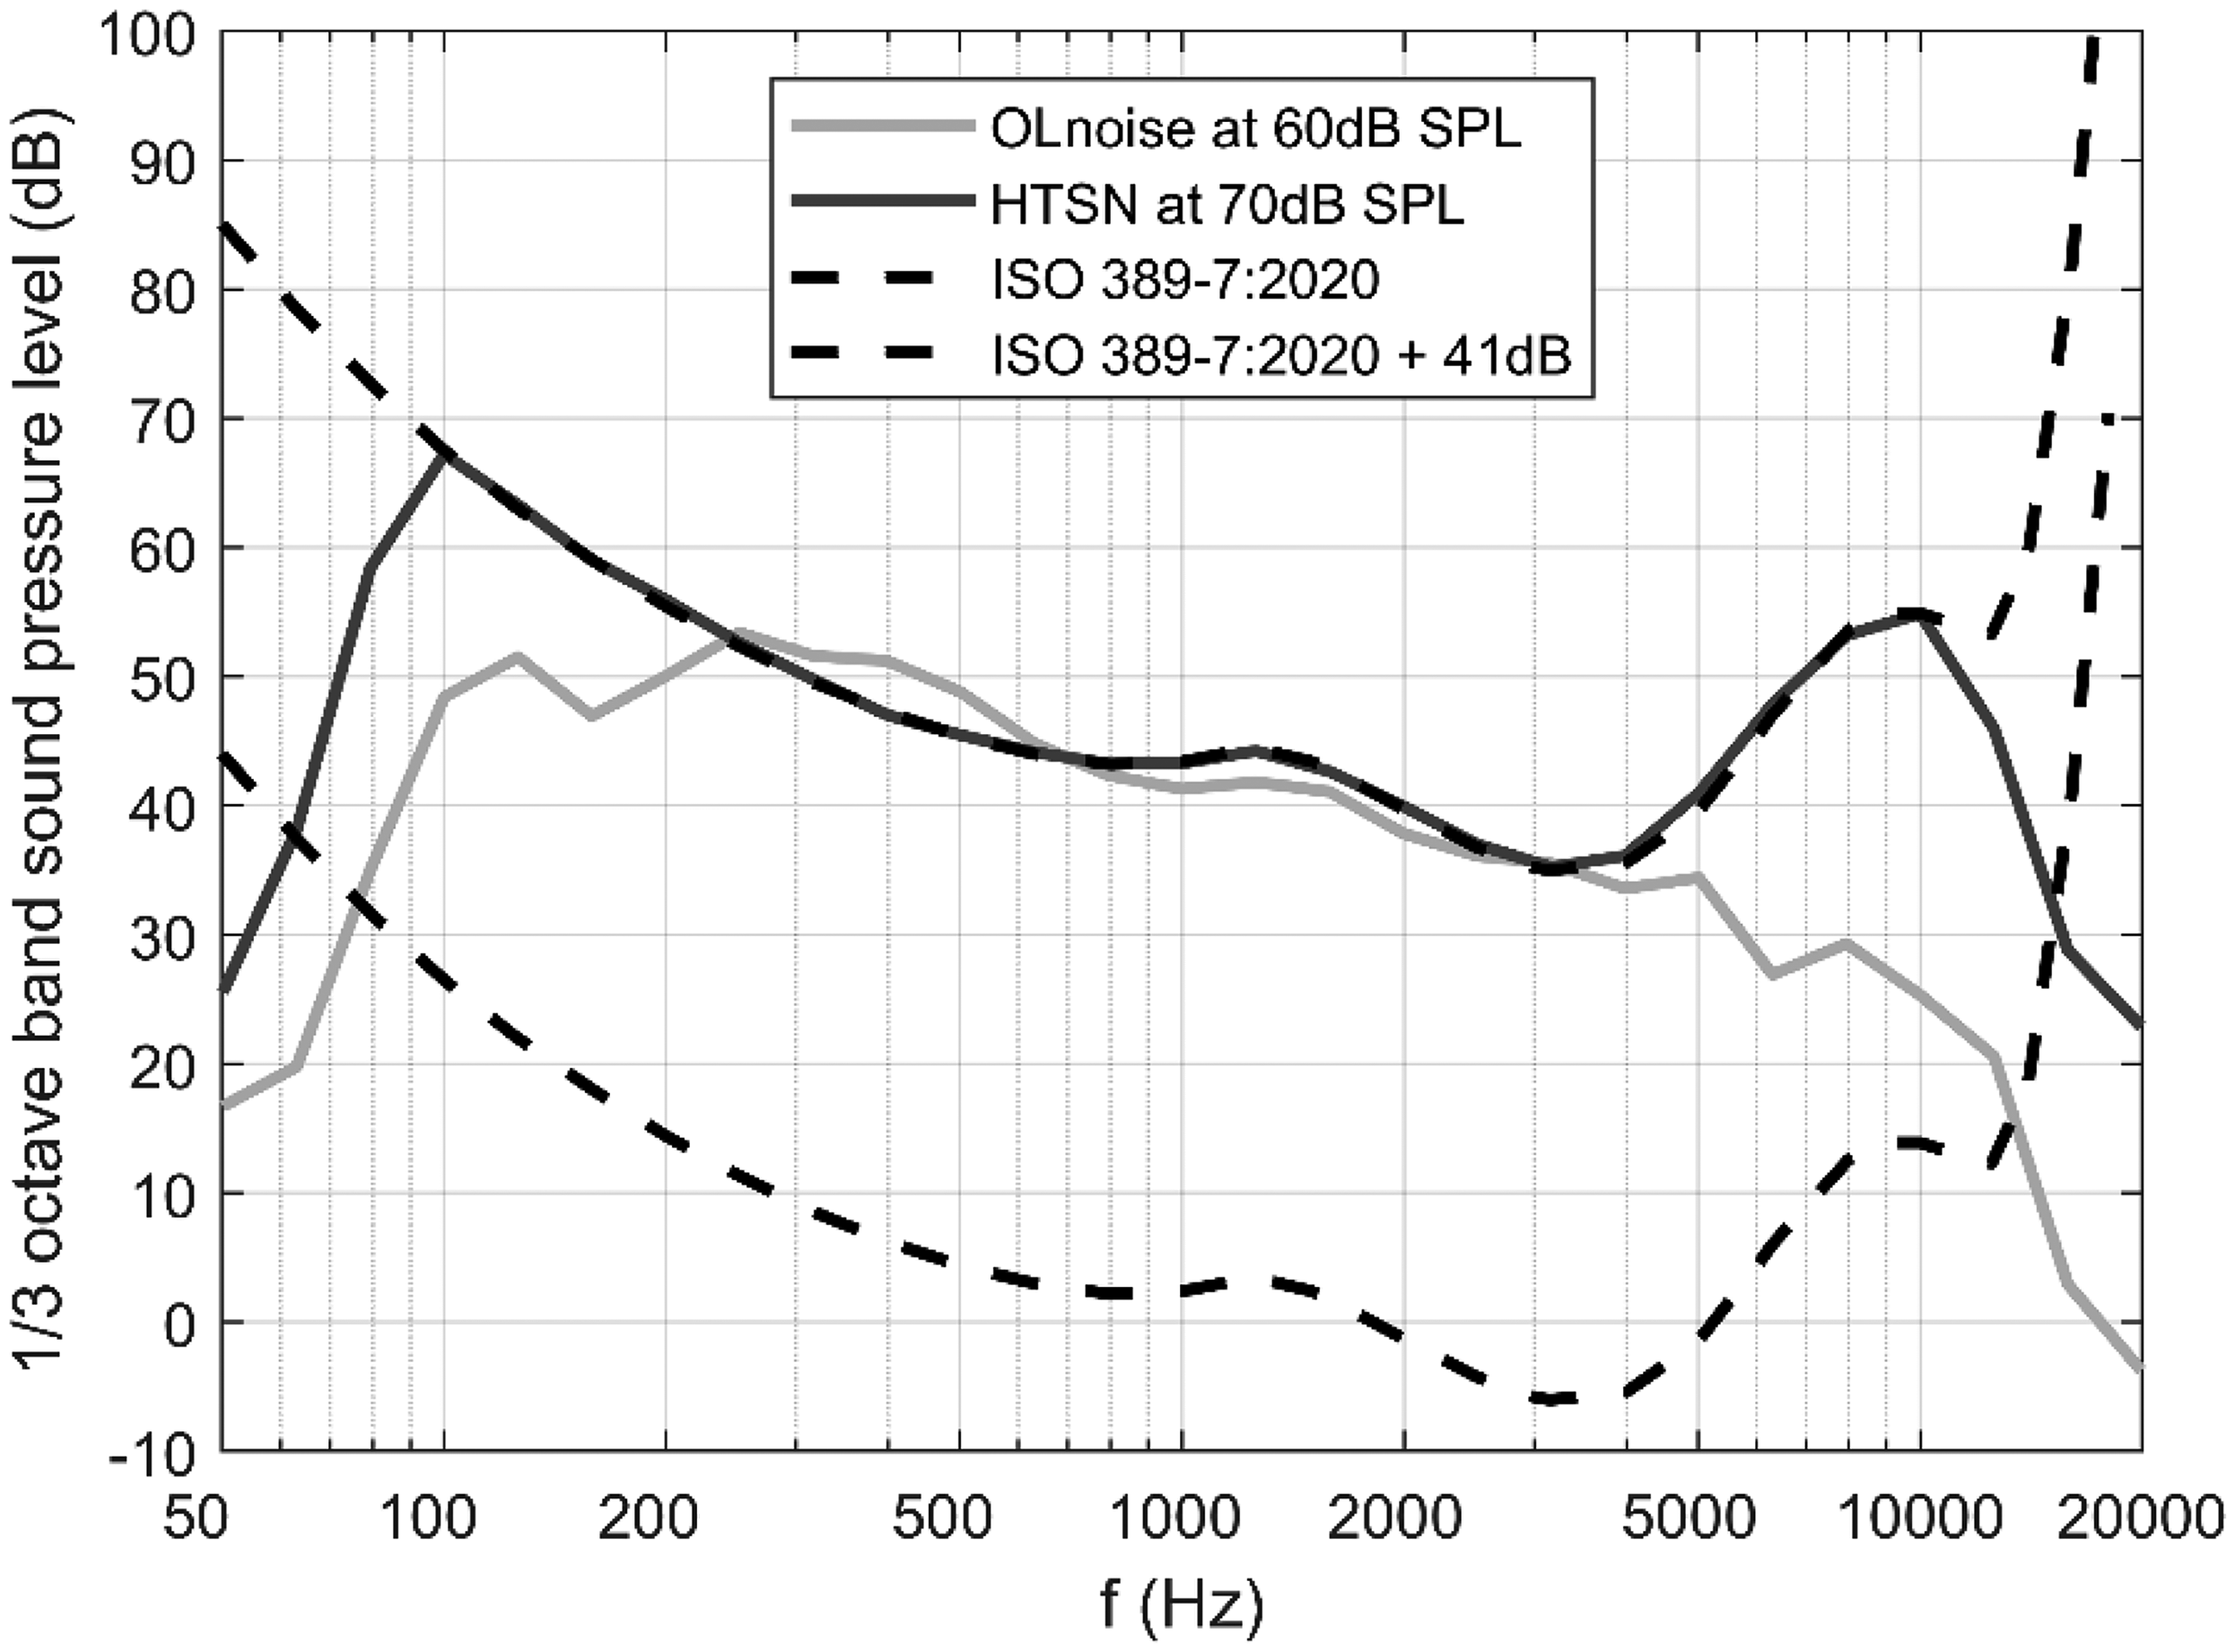
1/3 octave band levels of the OLnoise at 60 dB SPL and of the hearing threshold simulating noise (HTSN) at 70 dB SPL. In addition, free field hearing thresholds (from 0°) according to ISO 389-7 are plotted unchanged and shifted by 41 dB.
Statistics
Normality of the data was initially assessed using the Shapiro-Wilk test. Comparisons were performed using paired or unpaired t-tests or the Wilcoxon signed-rank test, as appropriate. For multiple tests, Bonferroni's correction and for multiple comparisons, the Tukey honestly significant difference (HSD) test was utilized. An asterisk (*) indicates statistically significant differences with
Plomp Model
To better compare results in quiet with results in noise, a visualization similar to Plomp (1978) was used. That means the speech levels for 
Results
Speech Intelligibility
Speech intelligibility was not only measured using the adaptive procedure of the OLSA to determine individual speech levels for Conditions 1–3 (

Speech level and speech intelligibility during the evaluation of pupil size. The thin markers depict the individual (ind) means of all trials per participant and condition. The bold markers represent the mean across all participants per condition and include error bars indicating the 25th and 75th percentiles.
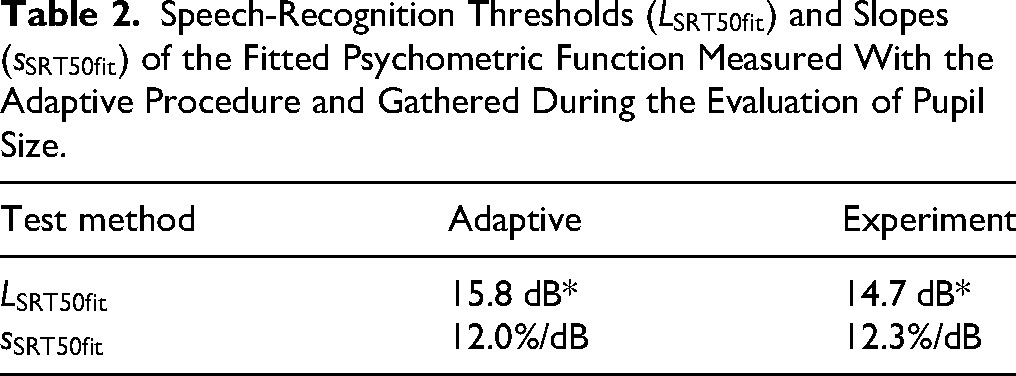
Individual and mean psychometric functions of speech intelligibility were also computed for the results gathered during the evaluation of pupil size (see Table 2 and Figure 5). A statistically significant difference in the fitted speech-recognition thresholds

Psychometric functions for speech recognition fitted to individual data and group averages are shown in red: solid curves represent data from the adaptive procedure, while dashed curves correspond to data collected during pupil size evaluation. Experienced listening effort curves for individuals and the group average are shown in blue. Mean pupil responses, averaged within the analysis window, are plotted in green. Error bars indicate standard errors (unlike in Figure 4, where they indicate the 25th and 75th percentiles).
Speech-Recognition Thresholds
Experienced Listening Effort
The mean and all individual curves for the experienced listening effort are shown in Figure 5. On average “extreme effort” (ESCU13) was reached at 19.4 dB SPL which corresponds to approx. 85% speech intelligibility using the adaptive procedure (see also Table 1). Experienced effort decreased with increasing speech level and “no effort” was reached at 40 dB SPL. The difference between levels rated with “extreme effort” and “no effort” was, on average, 20.6 dB SPL.
Pupil Dilation
The mean pupil responses averaged in the analysis window are plotted against speech level in Figure 5. The error bars indicate the standard errors (and not the 25th and 75th percentile as in Figure 4). A one-way repeated measures ANOVA revealed a highly significant effect of condition
p-Values for the Statistical Comparison of Pupil Size Averaged in the Analysis Window (See Figure 2) Across Conditions.

The highest pupil dilations of approx. 9% were noticed for the conditions SRT20 and SRT50 at speech levels between 13 and 16 dB SPL. For higher speech levels, the pupil response decreased and reached a minimum of approx. 2% at speech levels between 27 and 34 dB, i.e.,
Follow-up Experiment: Influence of Noise Spectrum
The results of the follow-up experiment are listed in Table 4. Unlike the conventional practice for data in noise, the results are expressed as speech levels to facilitate comparison with data obtained in quiet. For the OLSA, the mean results for
Speech-Recognition Thresholds
Additionally, in Figure 6, the mean psychometric functions for the OLSA and ACALES curves from both the main and follow-up experiments are plotted together against a normalized speech level. The normalization was performed by subtracting the fitted speech-recognition threshold

Mean psychometric functions of the OLSA and ACALES curves of the main experiment (ME) and follow-up experiment (FE) plotted against the speech level relative to the fitted speech-recognition thresholds
Combining Measurement Results in Noise and in Quiet
To better compare our new results in quiet with previous measurements in noise by Denk et al. (2024) and Kemper et al. (2025), we fitted a model according to Plomp (1978, eq. (3) to the data combined from the present and our previous investigations. The results summarized in Table 5. Since
Parameters Fitted by a Nonlinear Least-Squares Algorithm to the Model Function (2).

Note. The values for SRT80 and SRT20 in brackets were defined differently.
All data points and the fitted models are also visualized in Figure 7. The curves depict the fitted model function for SRT50 and ESCU7, and the contours of the red and blue area represent the model functions for the conditions ESCU1/ESCU13 and SRT80/SRT20, respectively.

Results of the current (new) and our previous studies, (Denk et al., 2024) and (Kemper et al., 2025), plotted together similar to Plomp (1978). The curves depict the fitted model function for the conditions SRT50 and ESCU7 as listed in Table 5. The contours of the red (speech intelligibility) and blue (speech intelligibility) area represent the model functions for ESCU1/ESCU13 and SRT80/SRT20, respectively.
Discussion
While listening effort has frequently been studied under clearly audible conditions, most notably in speech-in-noise paradigms, fewer investigations have addressed listening effort for speech presented in quiet at low sound pressure levels. In the present study, we examined this condition in young adults with normal hearing. The results indicate that, in quiet, speech must be presented significantly higher above the speech recognition threshold than in noise to achieve effortless listening (see Figure 7). One hypothesis was that, in quiet, speech intelligibility is limited by internal noise whose spectral characteristics do not match those of the speech signal, and that this spectral mismatch may account for the observed differences between quiet and noise conditions. To test this, a follow-up experiment was conducted using hearing-threshold-simulating noise at conversational levels. Comparisons between the two experiments suggest that the increased listening effort in quiet cannot be fully explained by spectral mismatches of target and masker alone. Instead, the findings point to additional effects that are not yet fully identified, like cognitive demands or nonlinear cochlear amplification at low input levels. These results highlight the importance of considering listening effort in quiet environments and suggest potential benefits of amplifying soft speech to reduce cognitive load.
Effortless Speech Comprehension Based on Subjective Ratings
It is well understood that sounds require a certain sound pressure level or SNR to be audible. In noise, it has often been shown that effortless speech comprehension is reached at higher SNRs as full speech intelligibility (Denk et al., 2024; Kemper et al., 2025; Krueger, Schulte, Zokoll et al., 2017). In Figure 7, the blue and red shaded areas expand vertically as the noise level decreases, well reflecting a reduced steepness of the appropriate psychometric functions as depicted in Figure 6. Furthermore, at low levels the range between “extreme effort” (ESCU13) and “no effort” (ESCU1) (blue area) widens much more and appears to be shifted to higher speech levels compared to the range of speech intelligibility (red area). Effortless speech understanding in quiet
Pupil Dilation as Measure of Invested Listening Effort in Quiet
Pupil dilation has been increasingly recognized as indicator of invested listening effort, providing insight into the cognitive resources expended during auditory tasks. However, speech in quiet has not traditionally been considered a situation where listening effort is relevant (Winn et al., 2018), drawing from the findings of Zekveld et al. (2014), concluded that “for listeners with normal hearing, speech perception in quiet can be automatic or effortless if it does not come coupled with particular challenges (e.g., syntactic structure, auditory distortion, etc.).” We believe this conclusion overlooks the case of speech in quiet near the hearing threshold, as Zekveld et al. (2014) presented speech at 70 dB SPL. Our results clearly demonstrate that soft speech in quiet is effortful, since only speech levels on average above 40 dB SPL were rated as effortless on average, while single participants required levels as high as 60 dB SPL. Our finding is also supported by Ferschneider and Moulin (2023). They investigated listening effort in hearing aid users and concluded that both listening effort in noise and quiet are useful to assess hearing aid befit. In our experiment, maximum pupil dilation occurred at the lowest speech levels, between 13 and 16 dB SPL or 20%–50% speech intelligibility. Conversely, minimum pupil dilation was observed at speech levels around 25 dB SPL or ESCU4. As further reductions in speech level would make the sentences inaudible, the absence of an event-related pupil response, and thus a decrease in pupil dilation, is to be expected. However, no inverse-U-shaped curve of pupil dilation was seen within the speech level range assessed. This is different to the situation in noise where the maximum pupil dilation was observed around
Another notable observation is that the shift in maximum pupil dilation toward lower speech intelligibility in quiet compared to noise differs from the shift observed for experienced listening effort, which occurred at higher speech intelligibility in quiet compared to in noise. This suggests that pupil size may offer valuable additional insights into listening effort that subjective ratings alone cannot capture. However, it also raises questions about the validity of using pupil measurements as an indicator of listening effort if the results do not align with participants’ perceptions.
At higher speech levels, pupil dilation again increases up to the highest level of 60 dB SPL. This trend was not seen in noise at comparable speech levels. In Kemper et al. (2025), noise was continuously played throughout all trials at a constant sound pressure level, resulting also in a constant total sound pressure level. Therefore, it can be assumed that this increase reflects a startling, arousal, or loudness effect, likely caused by the abrupt transition from quiet to a conversational level. Future experiments should account for this effect, e.g., by presenting a starting sound before the speech signal.
Influence of Noise Spectrum and the Hearing Threshold
Similar to the hypothesis proposed by Plomp (1978), it can be assumed that speech intelligibility at low levels in quiet is limited by internal noise. Krieger et al. (2017) demonstrated that nonspectrally matched noise—such as the International Female Fluctuating Masker (IFFM) or the Icra5-250 masker—resulted in significantly flatter OLSA and ACALES curves. Additionally, the ACALES curves with nonspectrally matched noise were shifted toward higher speech intelligibility, similar to the pattern observed in quiet. These findings motivated the follow-up study, in which an internal noise at threshold was approximated using HTSN at conversational levels. A similar but weaker effect was observed during experiments conducted with HTSN. Consequently, we believe that the observations in quiet cannot be fully explained by assuming that soft speech is masked by internal noise with a spectrum different from that of speech. While sensory differences in transmission at the hearing threshold exist, such as those caused by cochlear compression (Oxenham & Bacon, 2003), we speculate that these differences may also partially reflect cognitive processes that are not yet fully understood.
Implications
In quiet there is a much wider range of levels where speech comprehension is effortful compared to the situation in noise. This should be considered where sounds are below common conversational levels, e.g., due to the shielding of face mask (Badh & Knowles, 2023), or while listening from a distance or another room (Husstedt et al., 2022; Schulte et al., 2024). Another aspect is the benefit of amplification, both for normal-hearing and hearing-impaired individuals. Several disadvantageous effects of listening through hearing aids were reported (e.g., Cubick et al., 2018; Denk et al., 2024; Kemper et al., 2025; Schepker et al., 2020) which limit their benefit especially for people with normal hearing. Future research must show whether hearing aids with linear amplification can reduce experienced listening effort for normal hearing listeners, and to which extent this might outweigh negative effects of hearing aids. This may lead to a different view on the benefit of personal sound amplification products (PSAP) (Chen et al., 2022). Moreover, further studies with hearing-impaired listeners should show whether similar effects can be observed for people with hearing loss. If this is the case, it raises the question of whether the current gain rules adequately account for experienced listening effort and not only for speech intelligibility and loudness comfort. In literature, there are thresholds considered for detection, classification, and intelligibility of speech. However, a threshold for effortless listening has been missed out so far and should be given more consideration especially for prescribing hearing aid gain for soft speech in quiet.
Conclusion
In quiet, there is a broader range where speech is clearly intelligible, but listening is perceived as effortful. In our study, listeners rated “no effort” only for speech levels above 40 dB SPL on average, while intelligibility exceeded 95% at around 22 dB. These findings suggest that for speech to be understood without significant effort in quiet, it must be presented well above the speech-recognition threshold, other than at higher levels in background noise. We showed that this phenomenon is not solely attributable to masking by internal noise that differs from speech, but also likely reflects cognitive processes or peripheral that are not yet fully understood. Additionally, we argue that the threshold for effortless listening has been overlooked in previous research, especially for soft speech in quiet, and warrant more focused attention in future studies. To better assess the potential benefits of amplification, both for normal-hearing and hearing-impaired individuals, it is crucial to consider listening effort alongside speech intelligibility, particularly for soft sounds. Future research should explore whether the effects observed in normal-hearing listeners in quiet are replicated in hearing-impaired listeners, and whether current hearing aid gain targets for soft sounds adequately account for listening effort.
Footnotes
Acknowledgments
The authors thank the participants for their valuable time. English language corrections were assisted by Google Translate (Google LLC) and ChatGPT (OpenAI, Inc.). The authors take full responsibility of the content.
Funding
The authors received no financial support for the research, authorship, and/or publication of this article.
Declaration of Conflicting Interests
The authors declared no potential conflicts of interest with respect to the research, authorship, and/or publication of this article.