
Abstract
The study aimed to improve outcomes in Nucleus cochlear implant (CI) recipients with single-sided deafness (SSD) by reducing interaural frequency and loudness mismatches through device programming. In Experiment 1a, a modified frequency allocation table (FAT) was created to better match the tonotopicity of the contralateral ear and reduce interaural frequency mismatch. Twenty experienced SSD-CI users completed localization and speech recognition tests with their everyday FAT. Tests were repeated after 6 weeks’ use of the modified FAT. Participants compared both FATs for 2 weeks before being tested again with each. For 10 newly implanted SSD-CI recipients (Experiment 1b), Group A was programmed with the manufacturer's default FAT and Group B with the modified FAT at activation. Speech recognition and localization were completed, after 6 weeks’ use of each FAT. Participants then compared both FATs before testing with each. In Experiment 2, 15 experienced SSD-CI users were evaluated with their everyday program and a modified loudness program, which was created to obtain audibility of ∼20 dB HL from 0.25 to 6 kHz and balanced loudness between ears. Three test sessions occurred, resembling Experiment 1a. Experienced participants in Experiments 1a and 2 showed significant improvement in one speech-in-noise task with a modified program compared to the everyday program. Newly implanted recipients showed no significant difference in results between FATs. Results indicate that modified programs, created to reduce interaural mismatches, may improve outcomes. The first month after activation might be too early to compare FATs as SSD-CI recipients are adjusting to electric hearing.
Introduction
The Food and Drug Administration (FDA) approved the Cochlear Nucleus cochlear implant (CI, Sydney, Australia) for adults and children (≥5 years old) with single-sided deafness (SSD) in January of 2022. FDA guidelines include the following: (a) a four-frequency pure tone average (4fPTA) at 0.5, 1, 2, and 4 kHz of >80 dB HL in the ear to be implanted and ≤30 dB HL in the contralateral ear and (b) an aided monosyllabic word score of ≤5% in the ear to be implanted (Cochlear Americas). While the FDA criteria are stringent, they do allow adults with postlingual SSD, who meet the guidelines, access to cochlear implantation. The importance of FDA approval cannot be overstated as research has shown that a CI can improve speech recognition in noise, localization ability, and quality of life for adults with SSD (Arndt et al., 2011; Buss et al., 2018; Dillon et al., 2018; Finke et al., 2017; Firszt et al., 2018; Lorens et al., 2019; Mertens et al., 2015). However, similar to findings for CI users with moderate-to-profound bilateral hearing loss, variability exists in performance outcomes of CI recipients with SSD, especially when listening in noise and localizing sound (Arndt et al., 2011; Buss et al., 2018; Finke et al., 2017; Firszt et al., 2018; Sladen et al., 2024). In part, outcome variability in SSD-CI users may be due to the challenges in processing binaural cues from a normal hearing or near-normal hearing ear and an implanted ear (Dorman et al., 2015; Pieper et al., 2022; Sheffield et al., 2020). Effective binaural processing depends on many factors, including similar loudness growth functions at each ear (Blamey et al., 2000; Ching et al., 2004; Francart & McDermott, 2013; Francart & Wouters, 2007; Pieper et al., 2022; Wess & Bernstein, 2019) and similar pitch percepts for signals of equal frequency being presented at each ear (Francart & McDermott, 2013; Francart & Wouters, 2007; Pieper et al., 2022; Wess & Bernstein, 2019). Electric hearing in one ear and acoustic hearing in the other can create interaural loudness and pitch mismatches, which may reduce binaural abilities and affect SSD-CI outcomes (Dillon et al., 2022).
Interaural pitch mismatch in CI recipients has been a topic of interest for many years. For an ear with a CI, there is often a frequency-to-place mismatch at each electrode between the spiral-ganglion-based tonotopic frequency at that electrode's insertion angle in the cochlea and the center frequency of the CI band-pass filter assigned to that electrode (Landsberger et al., 2015). For SSD-CI users, this frequency-to-place mismatch at the CI ear is also an interaural frequency or pitch mismatch with the normal hearing (NH) ear; that is, the tonotopic reference is also contralateral to the CI. In contrast, for bilateral CI recipients, interaural pitch mismatch is determined largely by the difference in electrode insertion depth between ears. In adults with bilateral CIs, interaural pitch mismatches are thought to impede binaural abilities (Goupell, 2015; Kan et al., 2013; Svirsky, Fitzgerald et al., 2015a). SSD-CI users, however, present distinct complications because of the large differences in frequency representation between ears (Aronoff et al., 2015; Fu et al., 2017). To what degree an interaural pitch mismatch can be overcome, especially in SSD-CI recipients, is unclear (Dorman et al., 2007; Vermeire et al., 2008). Some research suggests CI users adapt to pitch mismatch, either frequency-to-place or interaural (McDermott et al., 2009; Mertens et al., 2022; Reiss et al., 2008; Svirsky, Talavage et al., 2015b), while other studies show less evidence of adaptation (Carlyon et al., 2010; Dillon et al., 2019; Tan et al., 2017; Vermeire et al., 2015). Several studies indicate that reducing interaural pitch mismatch with a deep electrode insertion may improve speech understanding in quiet and in noise and improve localization abilities (Buss et al., 2018; Dillon et al., 2019; Zhou et al., 2017). Others have shown improved speech recognition for bilateral CIs when interaural pitch mismatch was decreased through self-selectedmodifications of the CI program's frequency allocation table (Fitzgerald et al., 2017; Svirsky, Fitzgerald et al., 2015a).
A frequency allocation table (FAT) operates within a vocoder-based processing strategy and assigns a band-pass filter to each electrode; for example, in Cochlear's Custom Sound Pro v7.0 programming software, the manufacturer's default FAT assigns a frequency range of 188–313 Hz to Electrode 22 and 6,938–7,938 Hz to Electrode 1. In a recent study, Bernstein et al. (2021) examined the interaural place-of-stimulation mismatch of 19 bilateral CI and 23 SSD-CI participants via computed tomography (CT) imaging. The CT images revealed greater interaural place-of-stimulation mismatch for SSD-CI users compared to bilateral CI users because bilateral users had similar electrode insertion depths and therefore less interaural place-of-stimulation mismatch than SSD-CI users. This was especially true for SSD-CI users implanted with a device with an average insertion angle of approximately 380°, i.e., Cochlear Nucleus implants (Landsberger et al., 2015). Bernstein et al. (2021) suggested that modifying the FAT for SSD-CI recipients may reduce mismatches and improve binaural abilities. Toth et al. (2023) evaluated 12 SSD-CI participants implanted with either the Cochlear Nucleus CI522 or CI622 devices. All were experienced CI recipients and used the default FAT in their speech processor program. A pitch-matching task was completed across the CI and contralateral ear, and the results were used to create a new FAT for each participant that reduced the interaural pitch mismatch. Speech recognition testing was administered prior to participants receiving the new FAT and again after 2 weeks’ use. Results revealed a significant improvement in recognition of monosyllabic words in noise and increased participant satisfaction with the new FAT compared to the manufacturer's default FAT.
As noted above, research supports modifying the CI program's default FAT to reduce frequency-to-place mismatch or interaural pitch mismatch and, thus, improve CI outcomes (Bernstein et al., 2021; Creff et al., 2024; Fitzgerald et al., 2017; Svirsky, Fitzgerald et al., 2015a; Tóth et al., 2023; Walia et al., 2024). Methods used to obtain an appropriate FAT, e.g., CT imaging or pitch matching, are not typically part of most CI clinic procedures. Pre- and postoperative CT images can be used to determine the location of the electrodes in the cochlea (Skinner et al., 2007; Teymouri et al., 2011); this technique, however, requires expertise in CT image data collection and imaging analysis. Pitch matching between the CI and the NH ear is time consuming, difficult for some patients, and the procedure can be problematic (Carlyon et al., 2010; Goupell et al., 2019). Therefore, our study developed and evaluated a set of frequency boundaries that are intended to reduce frequency mismatch between the CI and the NH ear for SSD-CI users implanted with a current Cochlear Nucleus device, without either behavioral interaural pitch matching or patient-specific CT imaging. Since interaural pitch matching is not assessed in this study, the term interaural frequency (instead of pitch) mismatch will be used.
Interaural loudness mismatch may also affect SSD-CI outcomes (Pieper et al., 2022). Ensuring balanced loudness between ears can be challenging for audiologists as SSD-CI users tend to prefer, at least initially, electric hearing to be softer than acoustic hearing. There is some evidence that similar loudness between the CI and NH ears can improve performance outcomes (Buss et al., 2018); however, prospective studies are needed that examine outcomes after adjusting programming parameters to achieve balanced loudness (Dillon et al., 2022). Wess et al. (2019) suggested that clinicians optimize the compression parameters in CI programming software. The researchers evaluated a small group of NH participants listening to vocoded speech in one ear and non-vocoded speech in the other ear, i.e., simulating SSD-CI. When amplitude compression was applied to vocoded speech, no advantage was found to speech understanding in noise when participants listened with both the vocoded ear and the non-vocoded ear compared to listening with the non-vocoded ear only. When amplitude expansion was applied to vocoded speech, some binaural processing benefits (squelch) were seen when the vocoded ear was added to the non-vocoded ear. These benefits were observed only at very low signal-to-noise ratios (SNRs) of −8 to −16 dB, but not at more typical SNRs of −4 to +4 dB. These findings suggested that compressive amplitude processing at the CI ear may be detrimental to SSD-CI outcomes and that reducing compression at the CI ear to better balance loudness growth between ears may improve performance. In another study, Buss and colleagues (2018) compared preoperative results to 1-, 3-, 6-, and 12-month postoperative results for a group of 20 MED EL (Innsbruck, Austria) CI recipients with SSD. The results showed improved binaural benefit for the group, i.e., improved speech understanding in noise and localization, 1 month after CI activation. The authors attributed early benefit, in part, to electrode maximum comfortable loudness levels being set to “loud” at CI activation and the fact that participants were encouraged at follow-up visits to match loudness between ears. Given these research findings, reducing interaural loudness mismatch has the potential to improve binaural abilities and, in turn, SSD-CI outcomes.
The current study consisted of two main experiments to reduce interaural frequency and interaural loudness mismatches in SSD-CI users implanted with a Cochlear Nucleus device. We hypothesized that modifying the CI speech processor program to reduce interaural frequency and loudness mismatches would improve binaural abilities, i.e., speech understanding in noise and localization, and decrease outcome variability across participants. Experiment 1 aimed to develop and evaluate a set of frequency boundaries that reduced frequency mismatch between the CI and NH ear without the use of behavioral pitch matching or patient-specific CT imaging. Participants included both experienced SSD-CI users (Experiment 1a) and newly implanted SSD-CI recipients (Experiment 1b). Experiment 2 focused on interaural loudness mismatch with experienced CI users. Speech processor programming procedures were implemented to obtain audibility of ∼20 dB HL across the frequency range and balanced loudness between ears.
Experiment 1: Reducing Interaural Frequency Mismatch
Methods
Creating Modified Frequency Boundaries
As noted in the Introduction, there can be mismatch between the spiral-ganglion-based tonotopic frequencies in the cochlea and the center frequencies of the band-pass filters associated with a CI electrode (Landsberger et al., 2015), a “frequency-to-place” mismatch. Figure 1 shows the natural spiral ganglion tonotopic map (solid green line) from Stakhovskaya et al. (2007) and also the spiral ganglion tonotopic map (dashed green line) shifted by half an octave.

Frequency vs. Cochlear Angle (in Degrees) for the Spiral Ganglion Tonotopic Map (Green Line) and the Spiral Ganglion Tonotopic Map Shifted by Half an Octave (Green Dashes). The Blue Line Represents the Center Frequency (Fc) for Each of 22 Electrodes with the Default FAT vs. Cochlear Angular Insertion. The Orange Line Represents the Fc for Each Electrode with the Modified FAT vs. Cochlear Angular Insertion. Cochlear Angular Insertion is the Average Position of Each Electrode for 120 Cochlear CI Recipients at our Center.
This half-octave shift is from work by Sagi and Svirsky (2024) who reported that the Stakhovskaya “characteristic frequency” spiral ganglion map is based on threshold- or low-level stimuli, while higher-level stimuli shift “best frequencies” basally for cochlear angular locations less than 600°. Blue circles in Figure 1 represent center frequencies of the band-pass filters assigned to each electrode using Cochlear's default FAT (Custom Sound Pro Version 7.0 Programming software) at the average angle of insertion for each electrode. The average insertion angles were obtained via CT imaging (Skinner et al., 2007; Teymouri et al., 2011) from 120 Cochlear Nucleus CI532 and CI632 recipients implanted at our center. The average insertion angle of the most apical electrode (E22) was 395° (range 301°–495°). This is consistent with the average insertion angle of 381° (range 267°–494°) reported by Landsberger et al. (2015) for similar electrode arrays. The average insertion angle of the most basal electrode (E1) for our group was 18° (range −3° to 50°). With the default FAT, the most apical electrode is assigned to a band-pass filter with a center frequency of 243 Hz and a low-frequency boundary of 188 Hz. The most basal electrode is assigned to a band-pass filter with a center frequency of 7,421 Hz and a high-frequency boundary of 7,938 Hz.
To create the modified FAT for this study, the following was done: (a) the low-frequency edge of the entire input bandwidth to the CI was increased from 188 to 500 Hz, (b) the bandwidths of most of the band-pass filters assigned to electrodes were redesigned to approximate those of human auditory filter bandwidths, using the equivalent rectangular bandwidth (ERB, Moore, 2007), and (c) filter assignments for high frequencies (>∼4,000 Hz) were unchanged from those of the default FAT. The modified FAT effectively shifts center frequencies to more apically located electrodes for the frequency range 500–4,000 Hz. An increase in the low-frequency edge of the entire bandwidth assigned to the CI array is acceptable because low frequencies, with their long wavelengths, diffract easily around the head to the NH ear of SSD-CI users (Sheffield et al., 2020). Sheffield et al. (2020) found that for SSD-CI users, the low-frequency edge (the high-pass filter cutoff frequency for the entire CI bandwidth) could be increased to 1,200 Hz without affecting head-shadow benefit. Speech information in the low-frequency region, however, contributes to most of its intensity and, therefore, to its perceived loudness (Byrne et al., 1994; Cox & Moore, 1988). Low-frequency speech information includes voice (glottal source) fundamental frequency (F0) and its first few harmonics (2F0, 3F0) (average adult male talkers’ values: 130, 260, 390 Hz; average adult female talkers’ values: 220, 440, 660 Hz per Hillenbrand et al., 1995), and also the first formant (F1) frequency for some English vowels, e.g., /i/, /u/ (average adult male talkers’ values: 342, 378 Hz; average adult female talkers’ values: 437, 459 Hz per Hillenbrand et al., 1995). Consequently, increasing the low-frequency edge too much could jeopardize the perception of even more speech information. For the majority of electrodes (E22 – E6), assigned bandwidths and center frequencies were those that mimic the ear's auditory filters’ critical bandwidths or ERBs (Moore, 2007). The high-frequency (>4,000 Hz) band-pass filter assignments (E5–E1) were unaltered from the default FAT to preserve high-frequency speech information, take advantage of the head-shadow effect (Sheffield et al., 2020), and avoid any unpleasant, shrill sound quality, which occurs when high-frequency information is assigned to only a few electrodes (Holden, 2010).
To summarize, in the modified FAT, the low-frequency edge of the CI input bandwidth was increased to 500 Hz (from 188 Hz), the spectral region (500–4,063 Hz) was assigned to electrodes using an evenly spaced ERB scale (Moore, 2007, Eq. (3.2), p. 56), and the five remaining bands (>4,000 Hz) were set exactly as in the default FAT. In Figure 1, the orange hash-marked line represents the center frequencies of the modified FAT, with its reduced frequency range of 500–7,938 Hz versus the average angle of insertion for each electrode (i.e., insertion angle averaged across 120 Cochlear Nucleus CI532 and CI632 recipients). Increasing the low-frequency edge of the input spectrum to the CI from 188 Hz (default FAT) to 500 Hz (modified FAT) and redesigning bandwidths to better mimic human auditory filters provides a better tonotopic match to either of the spiral ganglion maps for frequencies <∼2,000 Hz than that of the default FAT (Figure 1). Table 1 shows the filter bands for 22 electrodes for both the default FAT and the modified FAT. Modified FATs were also created for 21, 20, and 19 active electrodes (Supplemental Material 1a–1c).
Default and Modified Frequency Allocation Tables (FATs) for 22 Active Electrodes.

Hz, Hertz.
Participants, Experiment 1a (Experienced CI Users) and 1b (Newly Implanted CI Recipients)
The research was approved by the site's Human Research Protection Office. A total of thirty adults with postlingual onset of SSD participated in Experiments 1a and 1b. All were implanted and had their speech processors programmed at our adult CI centers. In general, our clinic programming procedures for a Cochlear Nucleus device include obtaining electrical threshold levels (T-levels) using a counted T-level procedure (Skinner et al., 1995) and obtaining comfort or C-levels with an ascending loudness judgement procedure. One of our programming goals is to provide patients with good audibility, i.e., sound-field detection levels ≤30 dB HL from 0.25 to 6 kHz. Participants had fully inserted electrode arrays according to the surgeons’ operative notes. Twenty participants were experienced SSD-CI users (Experiment 1a), and 10 were newly implanted (Experiment 1b). Table 2 displays demographic and internal device information for the experienced SSD-CI users. For this group, mean age at study was 59.2 years (range 23–74 yrs, SD 10.8 yrs), mean length of deafness was 4.0 years (SD 5.3 yrs), mean device use was 4.3 years (SD 1.6 yrs), and mean 4fPTA in the contralateral ear was 23.4 dB HL (SD 10.8 dB). Table 3 provides demographic and internal device information for newly implanted SSD-CI recipients. Mean age at study was 53.2 years (range 32–67 yrs, SD 14 yrs), mean length of deafness was 3.8 years (SD 5.9 yrs), and mean 4fPTA in the contralateral ear was 16.6 dB HL (SD 10.3 dB). As shown in Tables 2 and 3, three experienced and two newly implanted participants had a 4fPTA in the contralateral ear between 30 and 40 dB HL. Two other experienced SSD-CI users had 4fPTAs of 41.3 dB HL and 46.3 dB HL. Both wore a hearing aid in the non-implanted ear. A total of four participants in Experiments 1a and 1b used a contralateral hearing aid (see Tables 2 and 3). Regardless of the variations in 4fPTAs, the contralateral ear will be referred to as the NH ear.
Experiment 1a. Demographic and Device Details for Experienced SSD-CI.

4fPTA, 4 frequency pure tone average; CI, cochlear implant; dB, decibel; F, female; FME, frequency mismatch experienced; HL, hearing level; L, left; M, male; NH, normal hearing; R, right; SD, standard deviation; SSD, single-sided deaf. Asterisks denote hearing aid worn in the contralateral ear.
Experiment 1b. Demographic and Device Details for Newly Implanted SSD-CI, Groups A and B.

4fPTA, 4 frequency pure tone average; CI, cochlear implant; dB, decibel; F, female; FMN, frequency mismatch newly implanted; HL, hearing level; L, left; M, male; NH, normal hearing; R, right; SD, standard deviation; SSD-single sided deaf. Asterisk denotes hearing aid worn in the contralateral ear.
Procedures, Experiment 1a (Experienced SSD-CI Users)
Experienced SSD-CI users attended three test sessions. At Session 1, participants were tested with their preferred everyday program, volume, and sensitivity settings. All participants in this study used the ACE speech coding strategy and monopolar stimulation mode (Skinner et al., 2002). No programming parameters were changed prior to testing. The majority of participants used the default FAT (Custom Sound Pro v7.0 programming software) in their everyday program (frequency range, 188–7,938 Hz, n = 13). The other participants (n = 7) used a FAT also in Custom Sound Pro but with a frequency range of 188–6,938 Hz. This FAT was based on work by Fourakis et al. (2004, 2007) and assigned an additional electrode to the F1 and/or the F2 frequency regions compared to the default FAT (188–7,938 Hz). Frequency boundaries below 1,000 Hz were identical with both everyday FATs used by participants. Furthermore, performance was similar for the 13 participants using the default FAT (188–7,938 Hz) and the seven using the other FAT (188–6,938 Hz). The average CI alone Consonant-Vowel Nucleus-Consonant (CNC) word (Peterson & Lehiste, 1962) score was 62% for both groups. Since not all participants used the manufacturer's default FAT, Experiment 1a compared an everyday FAT to a modified FAT.
Testing was performed in the CI and bilateral listening conditions. For CI testing, the contralateral ear was masked (n = 16) or plugged and muffed (n = 4). Participants whose contralateral ear was plugged and muffed reported being distracted by the masking noise. Once plugged and muffed, they reported hearing only from the CI. The three experienced participants who typically wore a contralateral hearing aid used it during bilateral testing. At the end of Session 1, each participant's everyday FAT was replaced with the modified FAT. No other changes were made to the program. All participants reported that the modified FAT sounded fine in the office and wore it for at least 6 weeks. At Session 2, participants were tested with the modified FAT using the same volume and sensitivity settings as used in Session 1. At the end of Session 2, both the everyday and modified FATs were placed on each participant's speech processor for comparison. Participants were asked to use both FATs over a 2–3-week period and determine which they preferred. They were given a questionnaire to help guide comparisons (Supplemental Material 2). Most participants were able to distinguish between programs; therefore, this was not a blind comparison. At Session 3, both FATs were tested a second time. At the end of each session, CI use, i.e., the average hours of CI use per day, was obtained via datalogging within Custom Sound Pro software. Speech processor programming parameters and datalogging are provided in Table 4. For Session 3, when both FATs had been worn and compared at home, specific program use was not examined, i.e., datalogging was the average hours of CI use per day, regardless of program.
Experiment 1a. Programming Parameters and Datalogging at Each Test Session, Experienced SSD-CI.

ADRO, adaptive dynamic range optimization; ASC, autosensitivity control; Avg, average; CI, cochlear implant; DR, dynamic range; Evd, everyday FAT; FME, frequency mismatch experienced; IP, input processing (ADRO, ASC, signal-to-noise ratio-noise reduction [SNR-NR], wind noise reduction [WNR]); Mod, modified FAT; N, Nucleus; Omni, omnidirectional; Part, participant; PW, pulse width; S, session; SCAN, scene classifier; SSD, single sided deaf; Asterisk denotes microphone directionality.
Procedures, Experiment 1b (Newly Implanted SSD-CI Recipients)
Similar to experienced SSD-CI users, newly implanted participants completed three test sessions. At CI activation participants were assigned, in an alternating manner, to Group A or Group B, i.e., the first participant was assigned to Group A and the second assigned to Group B, etc. At CI activation, the manufacturer's default FAT (188–7,938 Hz) was used for device programming for participants in Group A (n = 5), while the modified FAT (500–7,938 Hz) was used for device programming for those in Group B. Participants wore either the default or modified FAT for at least 6 weeks. During this 6-week period, all participants had additional CI programming (FATs were unchanged) and aural rehabilitation sessions, part of routine clinical care. After at least 6 weeks, Study Session 1 was completed. Testing was performed in the CI and bilateral conditions. Masking noise was used in the contralateral ear for all participants when listening with the CI. At the end of Session 1, the FAT that participants had not been wearing was used to create a new speech processor program. No other programming parameters were changed. Test Session 2 was completed after at least 6 weeks’ use of the other FAT. The same volume and sensitivity settings used at Session 1 were used at Session 2. At the end of Session 2, both the default and modified FATs were placed on participants’ processors. Participants were blinded to the location of each FAT on the speech processor. Participants were asked to compare the two FATs over a 2–3-week period. A questionnaire (Supplemental Material 2) was given to participants to guide comparisons. During Session 3, testing with both FATs was completed. Datalogging was obtained at the end of each test session. Programming parameters and datalogging are shown in Table 5. Test sessions for experienced (Experiment 1a) and newly implanted (Experiment 1b) participants are summarized in Supplemental Material 3.
Experiment 1b. Programming Parameters and Datalogging at Each Test Session, Newly Implanted SSD-CI, Groups A and B.
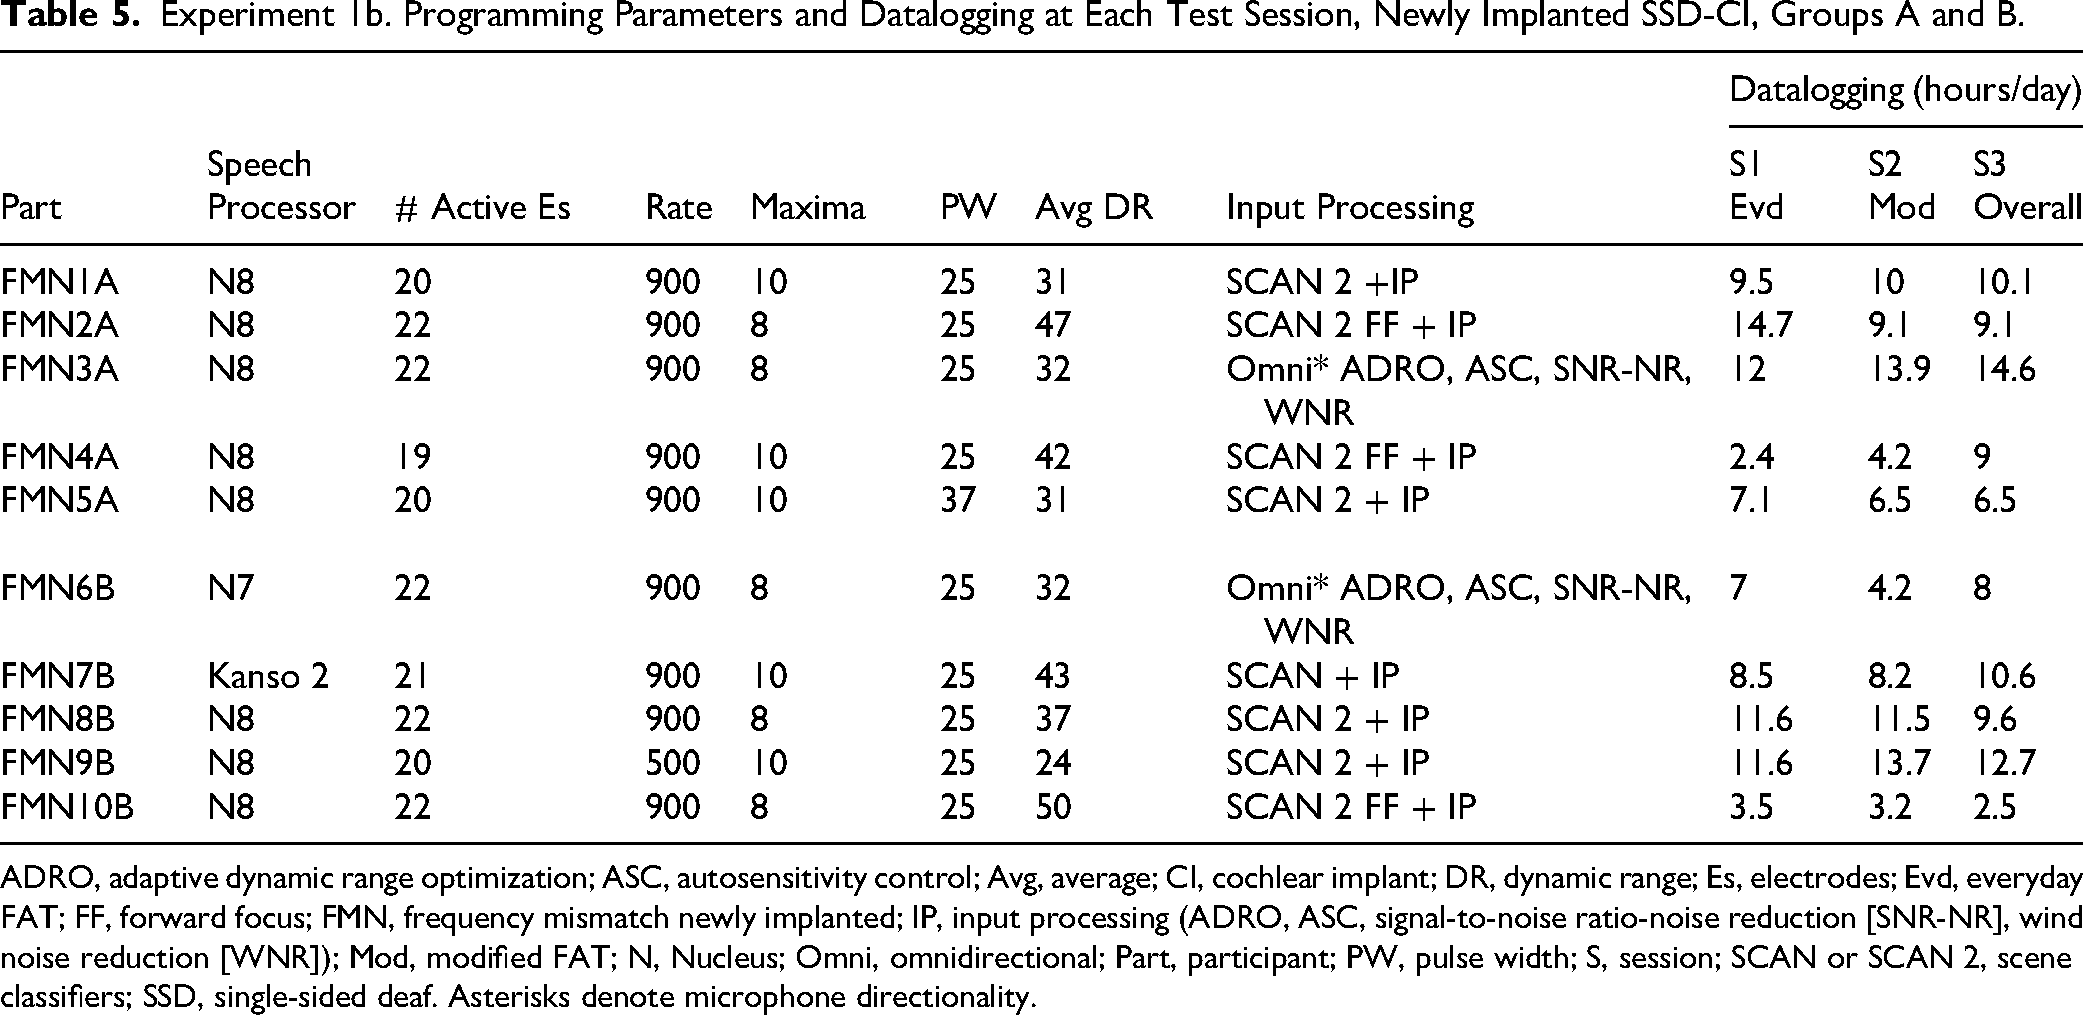
ADRO, adaptive dynamic range optimization; ASC, autosensitivity control; Avg, average; CI, cochlear implant; DR, dynamic range; Es, electrodes; Evd, everyday FAT; FF, forward focus; FMN, frequency mismatch newly implanted; IP, input processing (ADRO, ASC, signal-to-noise ratio-noise reduction [SNR-NR], wind noise reduction [WNR]); Mod, modified FAT; N, Nucleus; Omni, omnidirectional; Part, participant; PW, pulse width; S, session; SCAN or SCAN 2, scene classifiers; SSD, single-sided deaf. Asterisks denote microphone directionality.
Test Measures, Experiments 1a and 1b
Test measures included speech recognition in quiet and in noise, localization, frequency modulated (FM) tone sound-field threshold levels (CI ear), and pure tone air conduction thresholds (contralateral ear). Measures were completed in a double-walled sound booth equipped with two full-frequency JBL LSR6332 loudspeakers, a Crown CT475 power amplifier, and a PC with a Lynx Studio Technology E44 sound card. Participants were seated 1.5 m (Potts et al., 2009; Skinner et al., 1997) from a loudspeaker at 0° azimuth, unless noted otherwise. Sound-field thresholds and speech recognition tests were administered via custom MATLAB code. For sound-field thresholds, 50–55 dB HL of narrow-band noise was delivered through an insert earphone to mask the contralateral ear; for speech testing, 55–60 dB HL of speech-weighted noise was used. A Howard Leight MAX foam earplug and a Howard Leight Thunder T3 earmuff were used to plug and muff those participants distracted by masking noise. To evaluate CI performance, the CNC word test was presented at 60 dBA SPL in the CI listening condition using paired CNC-word lists recommended by Skinner et al. (2006). These lists provide equivalent scores between paired lists.
Testing in noise was performed in the bilateral listening condition to replicate participants’ everyday listening. Sentences from the Bamford–Kowal–Bench Speech in Noise Test (BKB-SIN, Etymotic Research, 2005) were presented from the front always at 65 dBA SPL. Two noise locations were tested: noise 90° toward the NH ear and 90° toward the CI ear. The noise (4-talker babble) began at −21 dB (re: level of target sentences) and increased by 3 dB with each sentence presentation. Scores represent the SNR, in dB, for 50% accuracy (SNR-50). Lists 1–8 with 10 sentences per list were used; two lists were administered for each noise location. Testing in the R-SPACETM (Compton-Conley et al., 2004; Revit et al., 2002) was done via a PC and Digital Performer 9 multitrack audio interface (MOTU Cambridge, Mass), an 8-loudspeaker 360° portable array, Crown CT875 power amplifier, and a MOTU 828mkII Firewire audio interface. HINT sentences (Nilsson et al., 1994) were presented from a loudspeaker at 0° azimuth with diffuse 8-channel restaurant noise (60 dBA SPL) presented from all eight loudspeakers. Loudspeakers surrounded the participant, re-creating a virtual restaurant acoustic space. Sentence level was adjusted (2 dB increments) based on responses; an SNR-50 score was obtained. The R-SPACETM test consists of 24 lists with 20 sentences per list; two test lists were administered. For all speech recognition testing, no lists were repeated within a test session.
The localization test environment consisted of 15 numbered loudspeakers, 10° apart, covering a 140° arc, in a double-walled sound booth. Testing was administered via a PC with custom MATLAB code, two Crown CT875 power amplifiers, and a MOTU 16A USB audio interface. Seventy CNC words (Plant et al., 2007) were presented randomly (60 dBA SPL, roving ±9 dB) from one of 10 active loudspeakers (±70°, ±50°, ±30°, ±20°, ±10°). Each CNC word was preceded by the word “ready”; both “ready” and the CNC word were presented through the same loudspeaker. Participants aligned to 0° azimuth but were allowed to turn their head when they heard “ready” to simulate a natural sound localization experience. Participants then indicated, by loudspeaker number, the location of the word. Prior to the next stimulus presentation, the participant aligned to 0° azimuth. Results yielded RMS error in degrees (Potts et al., 2009). All speech materials were calibrated in dBA SPL with a class 1 sound level meter (Larson Davis 831C). FM tones were calibrated in accordance with the ANSI S3.6-2010 standard for free-field loudspeakers.
Lastly, each participant completed the Speech, Spatial and Qualities of Hearing Scale (SSQ, Gatehouse & Noble, 2004) at Session 1 and at Session 2. The SSQ quantifies perceived abilities across three domains: speech understanding, spatial hearing, and quality of hearing. A higher number on the rating scale (0–10) represents better perceived abilities.
Data Management and Analysis
Study data were collected, stored, and managed on the Washington University instance of REDCap (Research Electronic Data Capture), which is maintained by the Institute for Informatics, Data Science and Biostatistics (I2DB) Informatics Core Services (ICS). REDCap is a secure, web-based software platform designed to support data capture for research studies (Harris et al., 2009; Harris et al., 2019).
Nonparametric tests were used due to the lack of normal distributions in most of the results and due to the relatively small number of participants for each experiment. The Related-Samples Wilcoxon Signed Rank Test was used for paired comparisons. Bonferroni adjustments for multiple comparisons or a more stringent p-value of <.001 were used when appropriate. Results from the two test sessions using the same FAT (e.g., Experiment 1a: Sessions 1 and 3, everyday FAT; Sessions 2 and 3, modified FAT) were averaged when they were not significantly different (p’s >.05).
Results
Experiment 1a: Reducing Interaural Frequency Mismatch in Experienced Users
Audibility
As expected, the modified FATs’ low frequency cut-off of 0.5 kHz resulted in significantly poorer audibility at 0.25 kHz (median = 45 dB HL) when compared to the everyday FAT (median = 18.5 dB HL). Because the 0.5 kHz low-frequency cut-off was intentional, 0.25 kHz was excluded from the analysis. The comparison of CI audibility between the two FATs at 0.5, 1, 2, 3, 4 and 6 kHz identified a significant difference only at 0.5 kHz. Sound-field thresholds at 0.5 kHz for the everyday FAT (median = 24 dB HL) were significantly lower than for the modified FAT (median = 27 dB HL), W = 208, z = 3.9, p < .001. Group mean sound-field thresholds across frequencies (0.5–6 kHz) ranged from 13.6 to 24.8 dB HL with the everyday FAT and from 13.4 to 28.3 dB HL with the modified FAT.
Speech Recognition and Localization
Results for speech recognition tests and localization for the everyday FAT and modified FAT are provided in Table 6 (Experiment 1a, Experienced SSD-CI users). Related-Samples Wilcoxon Signed Rank Test indicated no significant difference between the two test sessions with either FAT; therefore, test results from the two test sessions with the everyday FAT and the two test sessions with the modified FAT were averaged prior to comparison of the two FATs. Results for CNC words, BKB-SIN noise to the NH ear, BKB-SIN noise to the CI, and localization measures were not significantly different between FATs (all p-values >.05). There was, however, a significant difference between FATs for R-SPACETM SNR-50 scores. The SNR-50 score with the modified FAT (median = −3.6 dB) was significantly lower (better) than the SNR-50 score with the everyday FAT (median = −3.0 dB); W = 37, z = −2.54, p = .011. Figure 2 shows the group SNR-50 data in the R-SPACETM for the everyday FAT (left box plot) and the modified FAT (right box plot). Because the difference between median SNR-50 scores was small, individual results are provided along with the box plots. Eight participants had SNR-50 scores that were >1 dB lower (better) with the modified FAT (orange lines) compared to the everyday FAT. Only two participants had SNRs that were >1 dB lower with the everyday FAT (blue dashes) compared to the modified FAT. The difference between SNRs for the other 10 participants was <1 dB between FATs (light gray lines).
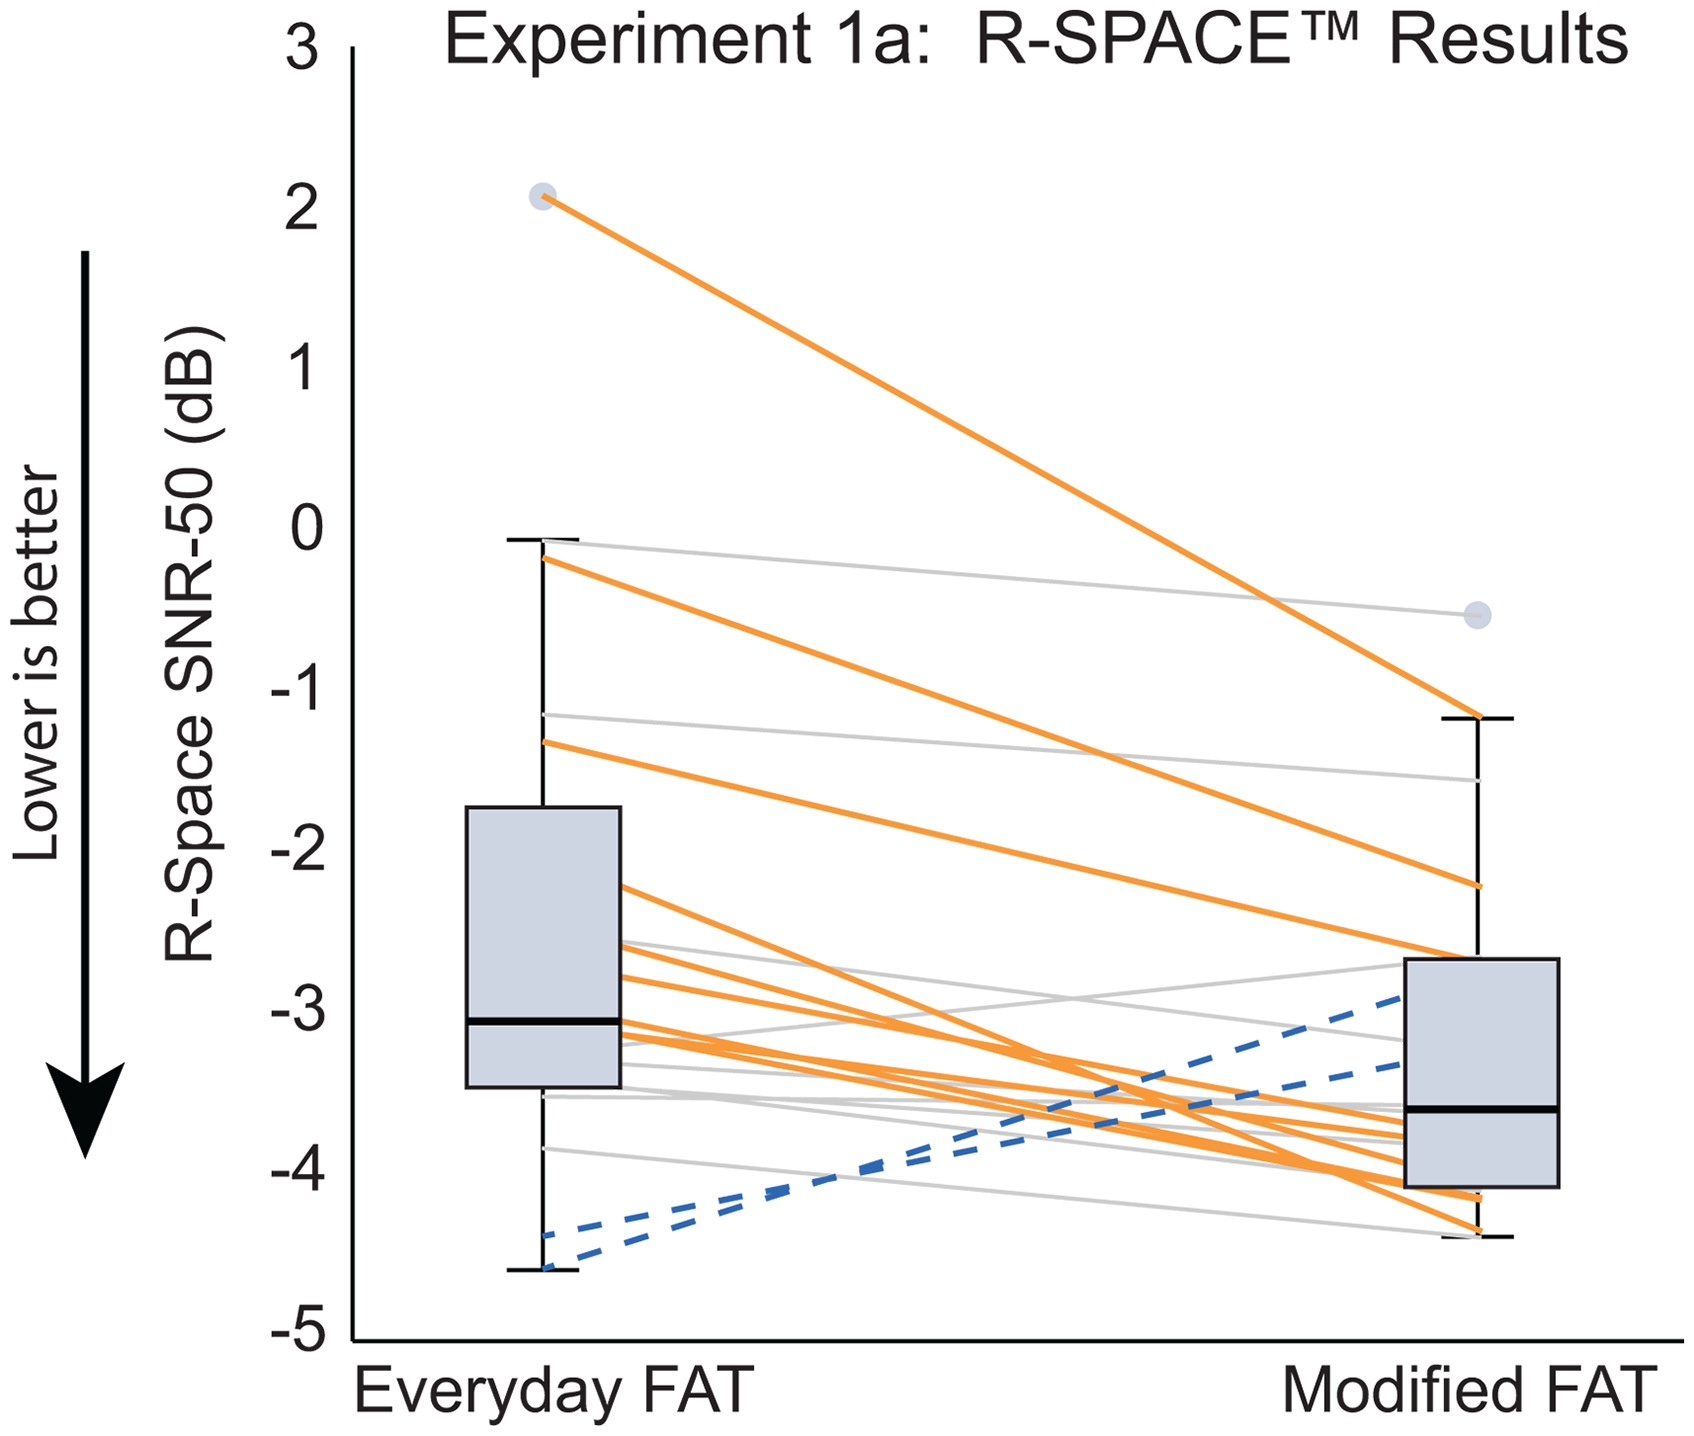
Experiment 1a: Boxplots Represent R-SPACETM SNR-50 Scores for the Everyday FAT (left boxplot) and the Modified FAT (Right Boxplot). The Solid Horizontal lines within the Boxplots Represent Median Scores, and Light Gray Circles Represent Outliers. Orange Lines Denote Participants with >1 dB of Improvement in the R-SPACETM Using the Modified FAT. Blue Dashed Lines Denote Participants with >1 dB of Improvement in the R-SPACETM Using the Everyday FAT. Light Gray Lines Represent Participants with <1 dB Difference in SNR-50 Scores Between FATs.
Test Results for Experiment 1a and 1b, Experienced and Newly Implanted SSD-CI.

BKB-SIN, Bamford–Kowal–Bench speech in noise; CI, cochlear implant; Def, default; Evd, everyday; Max, maximum, Min, minimum; Mod, modified; NH, normal hearing; rms, root mean square; SD, standard deviation; SSD, single-sided deaf; SNR-50, signal-to-noise ratio at which there is 50% correct speech understanding.
SSQ
Results from the three SSQ Domains and the 10 Subscales were compared between the FATs. Due to multiple comparisons, a p-value of ≤.001 was used. There were no significant differences between FATs for the three overall domains (Speech, Spatial, or Qualities of Hearing). When analyzing the 10-subscales described by Gatehouse and Akeroyd (2006), however, ratings for two subscales differed significantly. The modified FAT ratings were significantly higher than everyday FAT ratings for the Multiple Speech Stream Processing and Switching subscale (modified FAT median = 5.3; everyday FAT median = 4.2; W = 162, z = 3.35, p < .001) and for the Localization subscale (modified FAT median = 5.7; everyday FAT median = 4.3; W = 192, z = 3.25, p = .001).
Participant Preferences
At the end of Session 3, experienced SSD-CI users were asked which of the two FATs they preferred to use in daily life. Eight of 20 participants had a distinct preference for the modified FAT. Nine reported no preference. Three participants reported preferences but indicated that both FATs were very similar; two of these had a mild preference for the modified FAT, and one had a mild preference for the everyday FAT. None of the participants disliked either FAT.
Results
Experiment 1b: Reducing Interaural Frequency Mismatch in Newly Implanted Users
Audibility
Similar to results with experienced SSD-CI users, the low frequency cut-off of 0.5 kHz with the modified FAT resulted in significantly poorer detection at 0.25 kHz (median = 51 dB HL) than with the default FAT (median = 21.5 dB HL) in the newly implanted group; consequently, 0.25 kHz was excluded from the analysis. CI audibility between the two FATs at 0.5, 1, 2, 3, 4, and 6 kHz differed only at 0.5 kHz. Sound-field thresholds at 0.5 kHz for the everyday FAT (median = 25 dB HL) were significantly lower than for the modified FAT (median = 29 dB HL), W = 55, z = 2.8, p = .005. Group mean sound-field thresholds for newly implanted SSD-CI recipients were similar to those of experienced SSD-CI users, with means across frequencies (0.5–6 kHz) ranging from 14.0 to 25.6 dB HL with the everyday FAT and from 15.1 to 29.1 dB HL with the modified FAT.
Speech Recognition and Localization
Results for speech recognition tests and localization for the default FAT and modified FAT are shown in Table 6 (Experiment 1b, Newly Implanted SSD-CI recipients). Related-Samples Wilcoxon Signed Rank Test indicated no significant difference between the two test sessions with either FAT; therefore, test results from the two test sessions with the everyday FAT and the two test sessions with the modified FAT were averaged prior to comparison of the two FATs. Results for CNC words, BKB-SIN noise to the NH ear, BKB-SIN noise to the CI, R-SPACETM, and localization were not significantly different between FATs (all p-values >.05).
SSQ
Results from the three SSQ domains and the 10 subscales were compared between the FATs. Due to multiple comparisons, a p-value of ≤.001 was used. No significant differences were found for the three overall domains (Speech, Spatial, or Qualities of Hearing) nor for any of the 10 subscales.
Participant Preferences
For newly implanted SSD-CI recipients, only one participant had a distinct FAT preference, choosing the modified FAT as the favorite. Two participants reported no difference between FATs, and two preferred each FAT for different listening situations. Five participants reported preferences but indicated that both FATs were very similar; four had a mild preference for the modified FAT, and one had a mild preference for the default FAT. Similar to experienced SSD-CI users, none of the participants disliked either FAT. Preferences for both the experienced (Experiment 1a) and newly implanted (Experiment 1b) groups are graphically displayed in Supplemental Material 4.
Experiment 2: Reducing Interaural Loudness Mismatch
Methods
Creating a Modified Loudness Program
A modified loudness program was created to obtain CI sound-field thresholds of ∼20 dB HL from 0.25 to 6 kHz and a report of balanced loudness between ears. The modified program used the same speech coding strategy, stimulation mode, stimulation rate, and FAT as the participants’ everyday program. Using the everyday program as a template, counted threshold levels or counted T-levels (Skinner et al., 1995) were obtained on every other electrode and the two most basal electrodes. To obtain counted T-levels, two, three, four or five stimulus bursts were initially presented at a medium-soft level, i.e., halfway between an electrode's T and comfort (C) level in the everyday program. Each stimulus burst is a constant-magnitude biphasic pulse train, using the biphasic pulse rate and phase duration of the recipeint's speech processor program, and lasting 500 ms, followed by 500 ms of silence. If the participant counted the number of bursts correctly, the current level was lowered by four-level steps, and then two, three, four, or five bursts were presented again. This was done until the participant could no longer count the bursts correctly. Current level was then raised in 2-level steps until the participant could correctly count the number of bursts. The goal was to find the softest level at which participants could correctly count the bursts presented. T-levels were set at the “counted” level, and interpolation was used to obtain T-levels of electrodes not measured. The contralateral ear was typically plugged during the procedure. Electrode C-levels were set just above Ts and then raised to achieve a similar overall electrical dynamic range (DR) as participants’ everyday program. Electrodes were swept at 80% of the electrical DR to ensure the sound was comfortable. C-levels were then swept and raised, if necessary, to obtain a participant report of medium-loud or loud. Adjacent electrodes were balanced for loudness at C-level. In addition, adjacent electrodes were balanced for loudness at 50% of the electrical DR by adjusting T-levels. Volume was set at six and sensitivity at 12 (James et al., 2003). Adaptive Dynamic Range Optimization (ADRO, James et al., 2002) was activated for seven participants for whom it was not already activated. ADRO preprocessing assists in ensuring that soft sounds are detectable and loud sounds are not too loud. When listening to live speech, the volume was adjusted, typically raised, to obtain a participant report of equal loudness between ears.
Participants, Experiment 2
Fifteen adults with postlingual onset of SSD participated. All were implanted and had their speech processors programmed at our adult CI centers. According to the surgeons’ operative notes, all participants had fully inserted electrode arrays. The mean age of participants in Experiment 2 was 61.7 years (range 41–75 yrs, SD 10.9 yrs), mean length of deafness was 3.2 years (SD 2.6 yrs), mean CI use was 4.2 years (SD 2.2 yrs), and mean 4fPTA in the contralateral ear was 16.8 dB HL (SD 9.0 dB). Participants LM1–LM5 participated in the interaural frequency mismatch study after participating in the loudness mismatch study. Table 7 provides demographic and device information.
Experiment 2. Demographic and Device Details for Participants.

4fPTA, 4 frequency pure tone average; CI, cochlear implant; dB, decibel; F, female; HL, hearing level; L, left; LM, loudness mismatch; M, male; NH, normal hearing; R, right; SD, standard deviation.
Procedures, Experiment 2
Participants attended three test sessions. Test sessions were similar to sessions in Experiment 1a with experienced SSD-CI users (Supplemental Material 3). At Session 1, participants were tested with their preferred everyday program, volume, and sensitivity settings. When CI testing was performed, the contralateral ear was masked (n = 14) or plugged and muffed (n = 1). After testing with the everyday program, a modified loudness program was created, which typically took ∼40 min. CI sound-field thresholds were obtained with the modified program to ensure threshold levels were ∼20 dB HL across the frequency range. Participants wore the modified program home; they were asked to return 1 week later, if needed, for continued programming. Four participants returned, and minor adjustments to T- and C-levels were made to ensure sound was comfortable and loudness was still reported to be balanced between ears. After 6 weeks, testing was completed with the modified program, using the participant's preferred volume and sensitivity. At the end of Session 2, both the everyday and modified programs were placed on participants’ processors. They were asked to compare both programs at home for 2–3 weeks and were given a questionnaire (Supplemental Material 2) to assist with comparisons. During Session 3, participants were tested with both programs.
Datalogging was obtained at the end of each test session. Table 8 displays programming parameters and datalogging. One participant, LM13, was using six maxima (the number of electrodes stimulated per analysis cycle, Skinner et al., 2002) and a 37 µs per phase pulse width in the everyday program. During the creation of the modified loudness program, the participant's pulse width was changed to 25 µs per phase, and then counted T-levels and C-levels were obtained as described above. With the new pulse width, T-levels, and C-levels, it was possible to increase the number of maxima in the processing scheme from 6 to 10. With these changes and an increased volume setting, this participant reported better loudness balance between ears with the modified program than with the everyday program. Participant LM9 reported high-pitched sound quality with the modified program; electrode 1 was removed from the modified program, and the participant reported improved sound quality. All other participants had the same number of active electrodes in their everyday and modified programs. To reiterate, all participants, except LM13, had identical programming parameters between the everyday and modified programs. The main differences between the everyday and modified programs were T- and C-levels and for some, volume, sensitivity, and ADRO. Figure 3 displays T- and C-levels for each participant for the everyday program (black solid line) and the modified program (orange dashes).
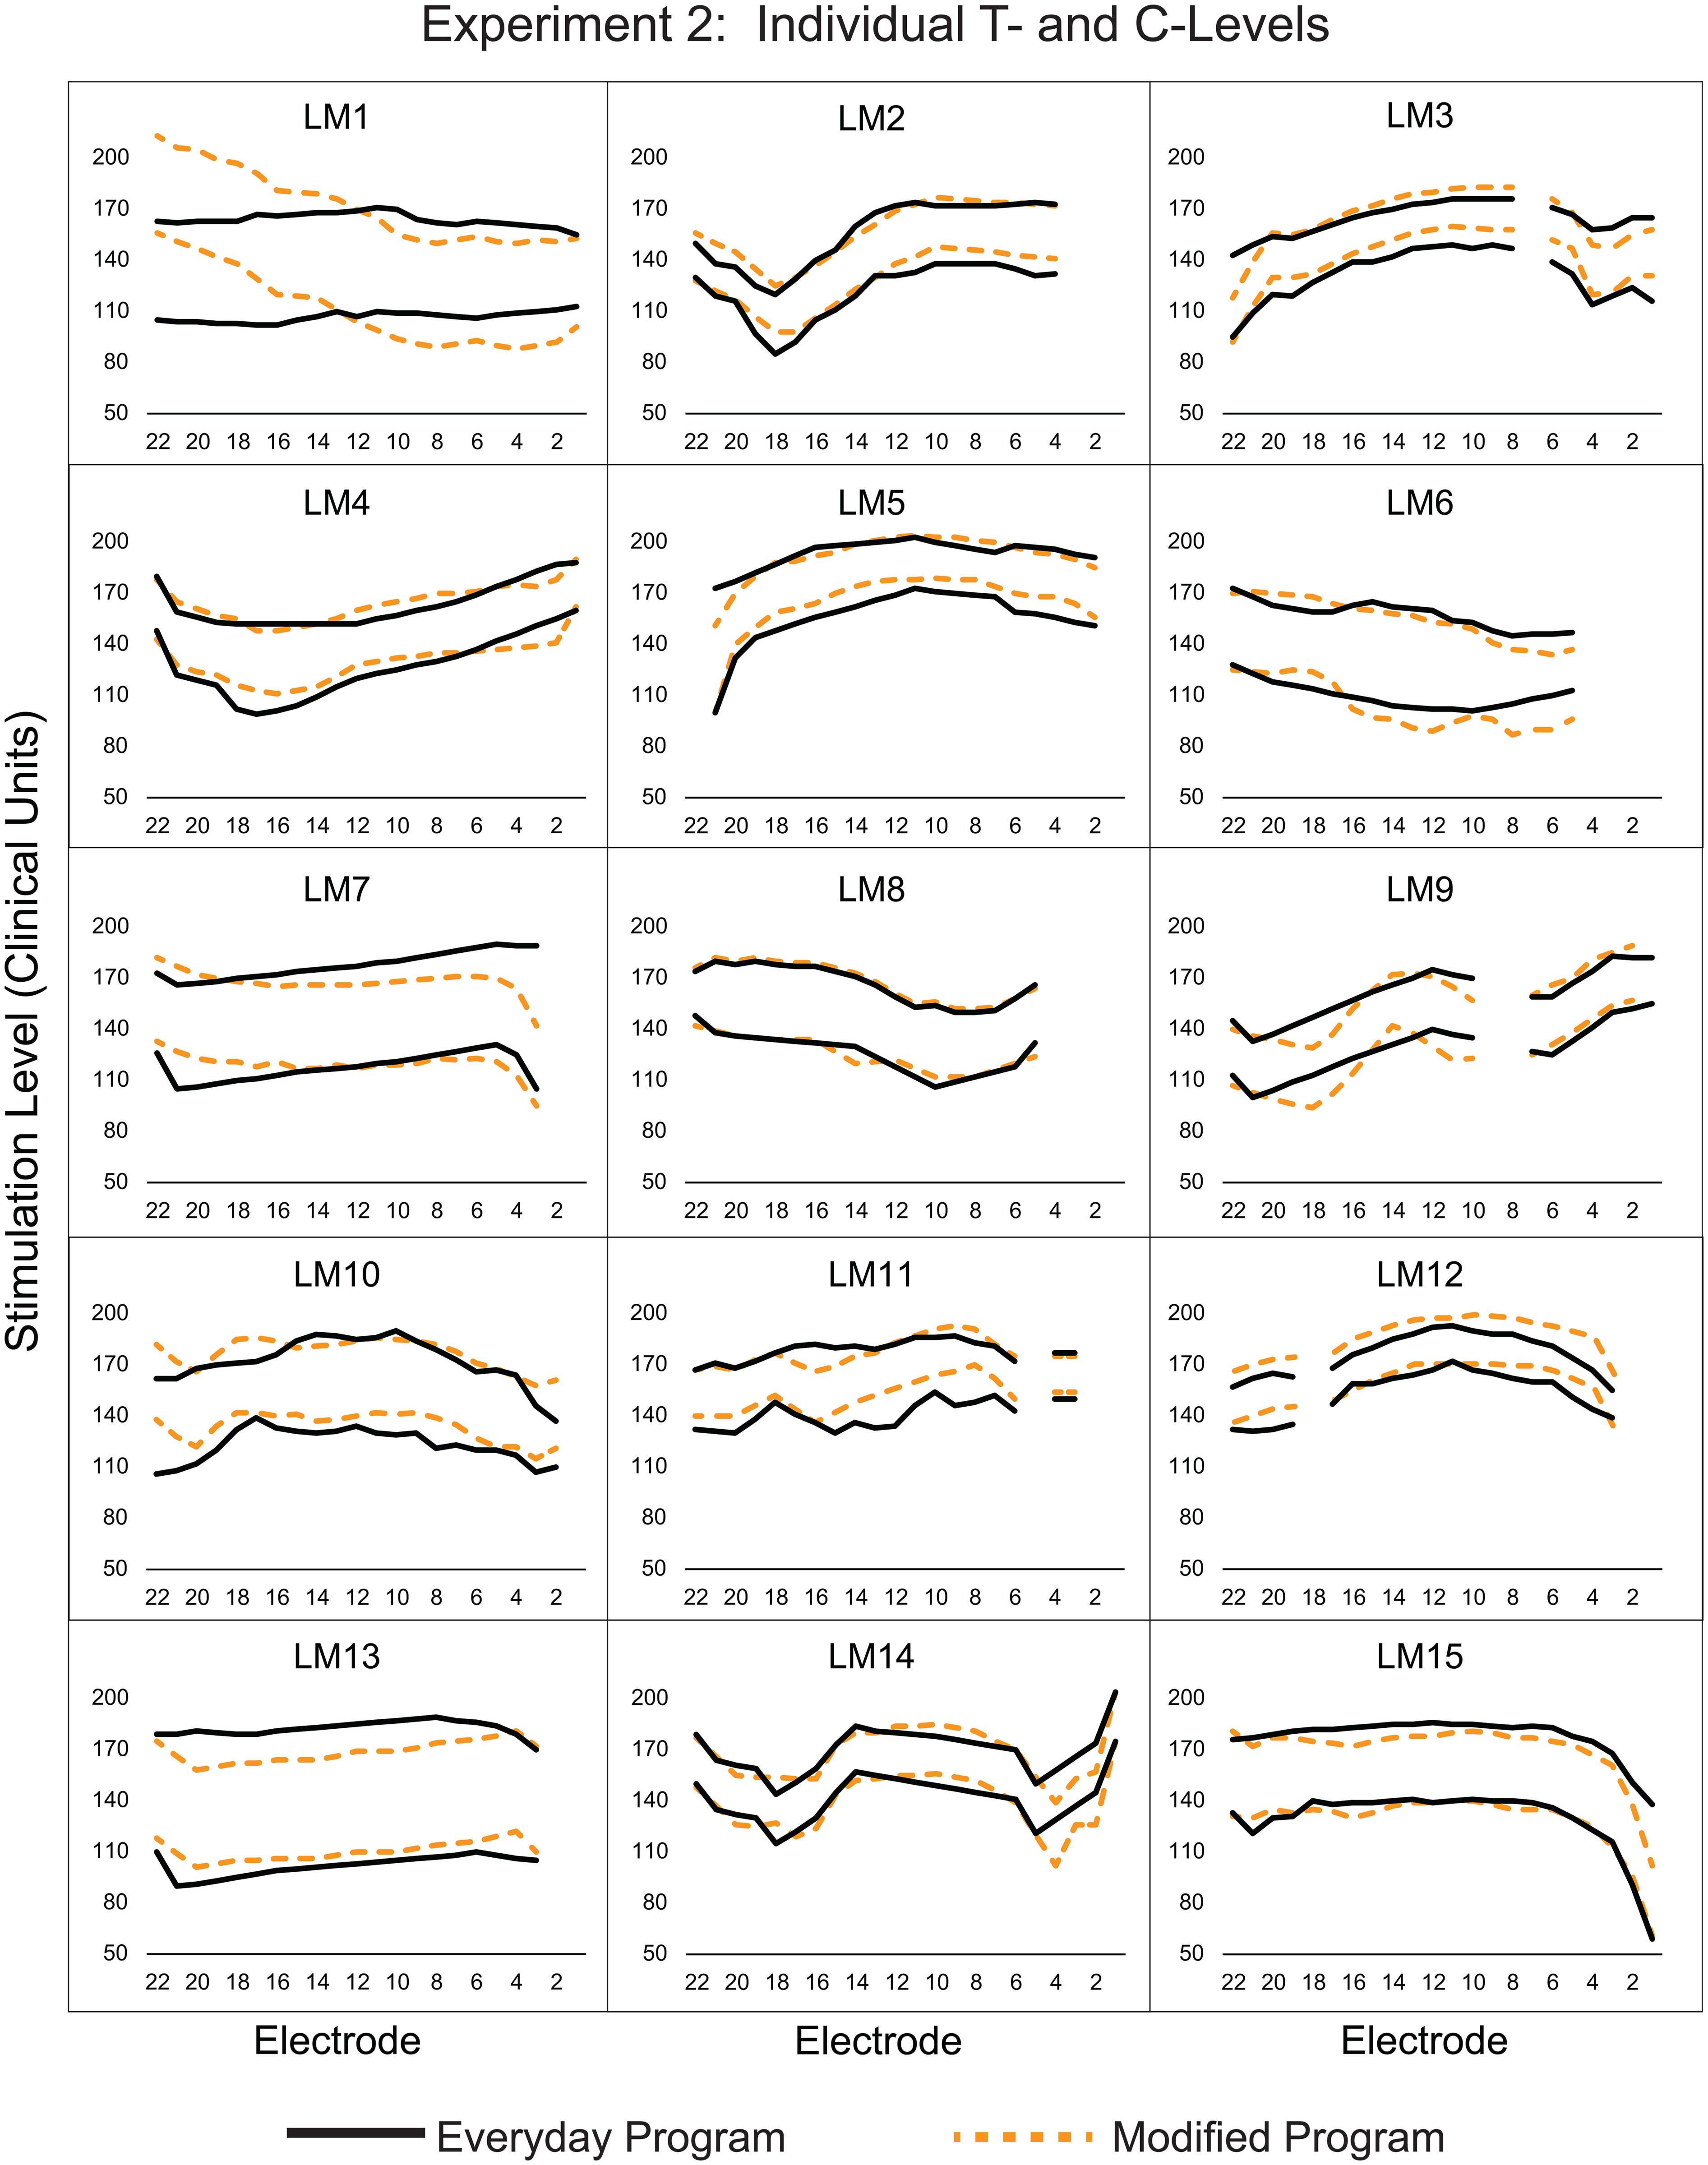
Experiment 2: Threshold (T) and Comfort (C) Levels for Participants’ Everyday Program (T-levels, Lower Black Lines; C-levels, Upper Black Lines) and Their Modified Loudness Program (T-levels, Lower Orange Dashes; C-levels, Upper Orange Dashes).
Experiment 2. Programming Parameters (Everyday Program) and Datalogging at Each Test Session.

ADRO, adaptive dynamic range optimization; ASC, autosensitivity control; Avg, average; DR, dynamic range; Evd, everyday program; IP, input processing (ADRO, ASC, signal-to-noise ratio-noise reduction [SNR-NR], wind noise reduction [WNR]); LM, loudness mismatch; Mod, modified program; N, Nucleus; Part, participant; PW, pulse width; S, session; SCAN, scene classifier. Asterisk denotes microphone directionality.
Test Measures, Experiment 2
Participants in Experiment 2 completed the same speech recognition and localization tasks as participants in Experiment 1. In addition, participants completed a loudness judgment test during Sessions 1 and 2. Custom MATLAB code and the same equipment as described above were used to administer the loudness judgment test in the sound field. Participants made judgments across a range of levels to obtain loudness growth functions for each ear. Testing was done with the NH ear and then with the CI (everyday program) at Session 1, and with the NH ear and then the CI (modified program) at Session 2. The NH ear was masked with 55–60 dB HL of speech-weighted noise when testing the CI. Test stimuli consisted of 2.5-s segments of the speech-like International Speech Test Signal (Holube et al., 2010). The stimuli were presented in the sound field at 0° azimuth. The level of the stimuli was chosen randomly from 25 to 80 dBC in 5-dB steps; participants used a touch screen to rate stimulus loudness along a line anchored by phrases at the left and right of “Heard Something” to “Very Loud” (Steel et al., 2014). The participants also had the option to choose “Heard Nothing” which was a separate box to the left of “Heard Something.”
Results
Experiment 2: Reducing Interaural Loudness Mismatch in Experienced Users
As in Experiment 1, nonparametric tests were used due to the lack of normal distributions in most of the results and due to the small number of participants. The Related-Samples Wilcoxon Signed Rank Test was used for paired comparisons. Bonferroni adjustments for multiple comparisons or a more stringent p-value of <.001 were used when appropriate. Results from the two test sessions using the same program were averaged when they were not significantly different (p’s >.05).
Audibility
Figure 4 shows CI sound-field thresholds at 0.25–6 kHz for each of the 15 participants (solid lines) along with group mean thresholds (dashes) for the everyday program (Panel A) and the modified loudness program (Panel B).
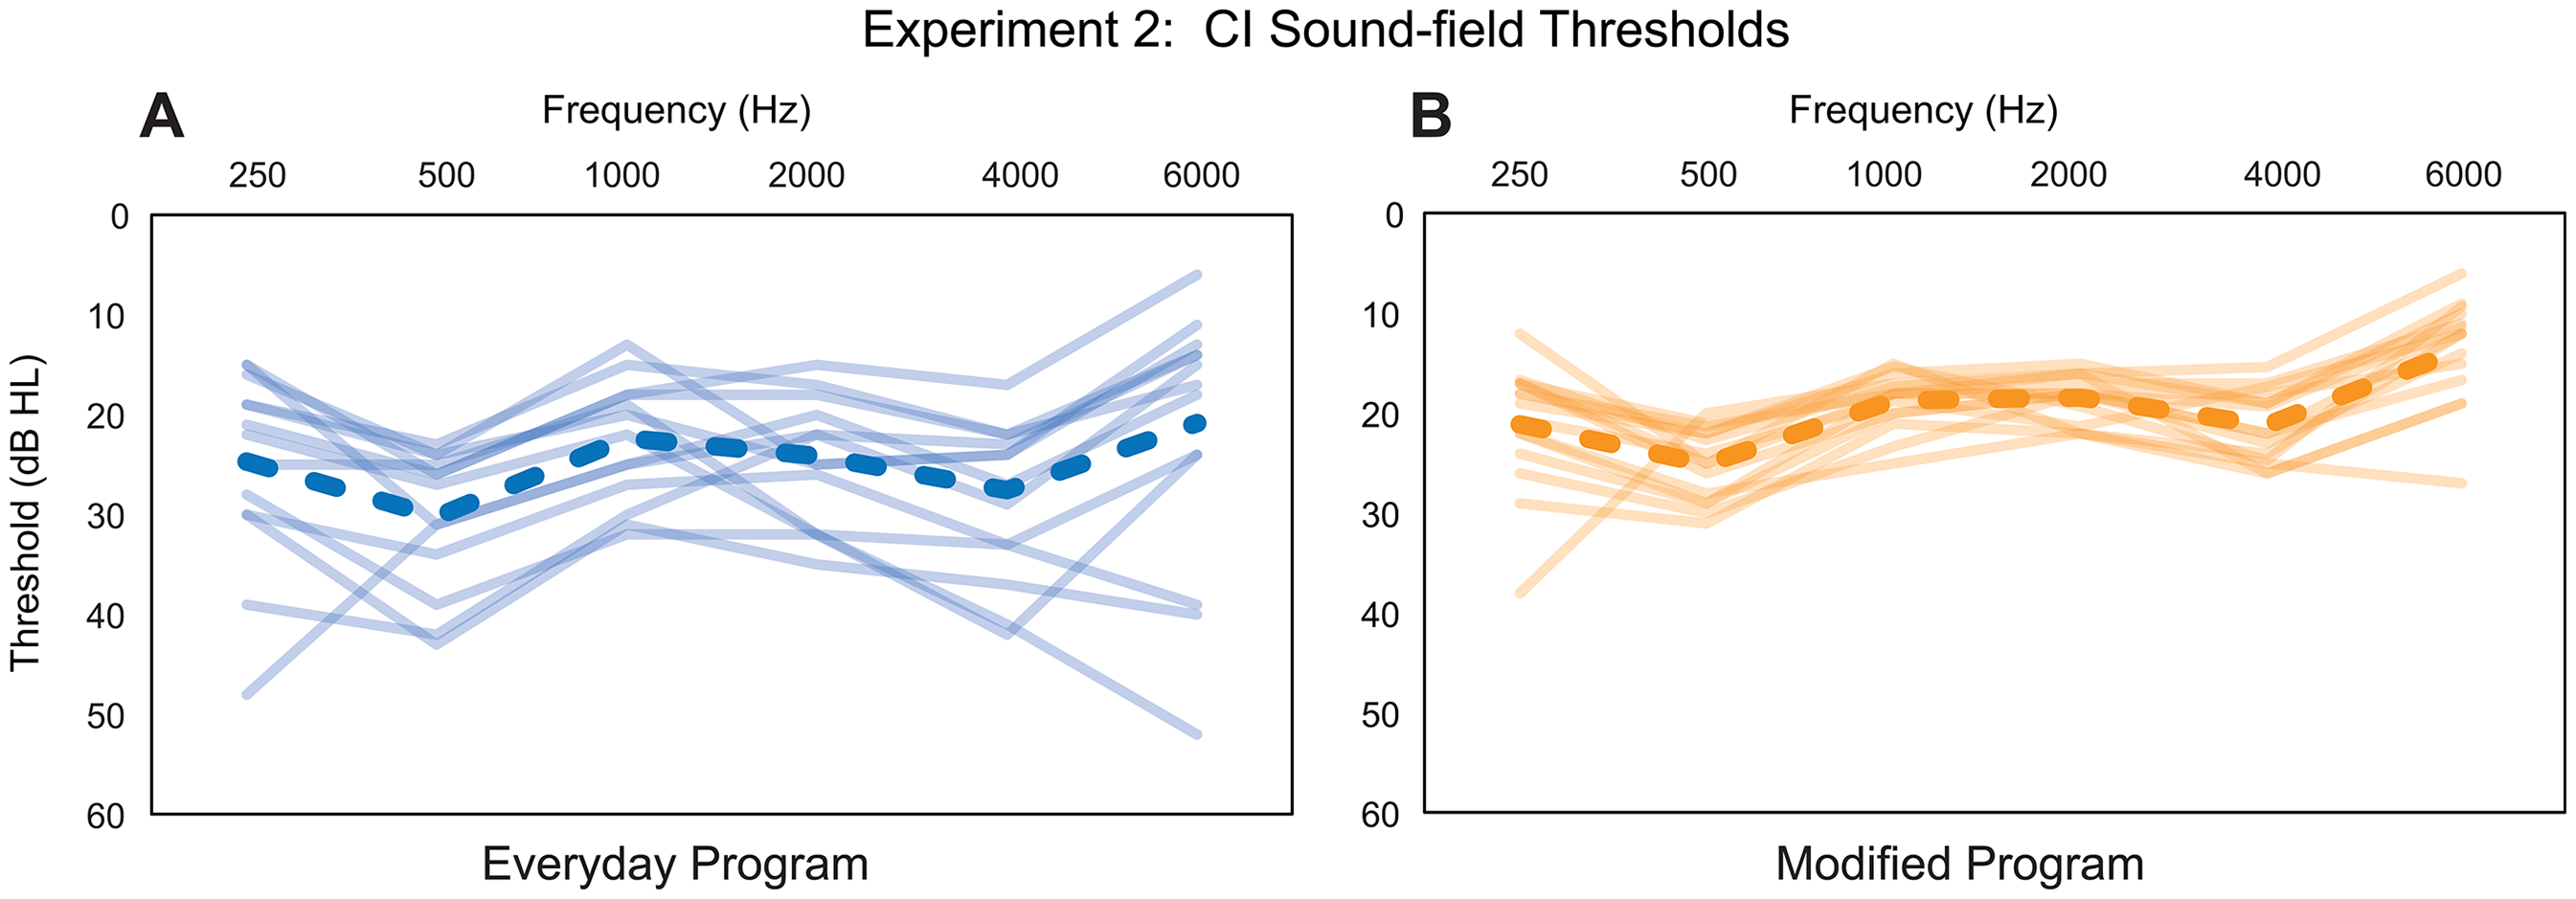
Experiment 2: CI Sound-field Threshold Levels from 0.25 to 6 kHz with the Everyday Program (Panel A) and the Modified Program (Panel B). Group Mean Thresholds are Shown with Dashed Lines; Individual Participant Thresholds are Shown with Solid Lines.
Group mean sound-field thresholds (averaged across frequencies) were significantly higher for the everyday program (median = 24.1 dB HL) in comparison to the modified program (median = 19.4 dB HL), p < .001. Note, group mean sound-field thresholds at each frequency are good (≤30 dB HL) for both programs; however, with the modified program, group mean thresholds are near 20 dB HL, and there is less variability across participants.
Speech Recognition and Localization
Results for speech recognition tests and localization for the everyday and modified loudness programs are shown in Table 9. There was a significant learning effect between the two test sessions for the everyday program on the BKB-SIN noise to the CI (first test median = −5.75 dB; second test median = −6.25 dB; W = 7.00, z = −2.86, p = .004). Consequently, for this measure, the two programs were compared using results from Session 3 only. For all other measures, results from the two sessions (Sessions 1 and 3 [everyday], and Sessions 2 and 3 [modified]) were averaged prior to comparison of the two programs. Results for CNC words, BKB-SIN noise to the NH ear, BKB-SIN noise to the CI, and localization were not significantly different between programs (all p-values >.05). Results for the R-SPACETM (SNR-50 scores) were significantly lower (better) with the modified program than with the everyday program; median everyday SNR-50 = −2.9 dB, median modified SNR-50 = −4.1 dB, W = 7.00, z = −3.01, p = .003. Figure 5 shows group SNR-50 data in the R-SPACETM for the everyday program (left box plot) and the modified program (right box plot).

Experiment 2: Boxplots Represent R-SPACETM SNR-50 Scores for the Everyday Program (Left Boxplot) and the Modified Program (right boxplot). The Solid Horizontal Lines Within the Boxplots Represent Median Scores. Orange Lines Denote Participants with >1 dB of Improvement in the R-SPACETM Using the Modified Program. The Light Gray Lines Represent Participants with <1 dB Difference in SNR-50 Scores Between Programs.
Test Results for Experiment 2.

BKB-SIN, Bamford–Kowal–Bench speech in noise; CI, cochlear implant; Evd, everyday; Max, maximum, Min, minimum; Mod, modified; NH, normal hearing; rms, root mean square; SD, standard deviation; SNR-50, signal-to-noise ratio at which there is 50% correct speech understanding.
Individual results are provided along with the box plots. Eight participants had SNR-50 scores that were >1 dB lower (better) with the modified program compared to the everyday program (orange lines). The difference between SNRs for the other seven participants was <1 dB between programs (light gray lines).
SSQ
Results from the three SSQ domains and the 10 subscales were compared between the two programs. Due to multiple comparisons, a p-value of ≤.001 was used. There were no significant differences between programs for the three overall domains (Speech, Spatial, or Qualities of Hearing) or for any of the 10 subscales.
Loudness Judgment Test
Figure 6 shows loudness judgment data for the NH ear (gray squares), the CI ear with the modified program (orange circles), and the CI ear with the everyday program (blue triangles).

Experiment 2: Group Mean Loudness Growth Functions (Stimulus Intensity Level vs. Loudness Ratings) for the NH Ear (Gray), the CI ear with the Everyday Program (Blue), and the CI ear with the Modified Loudness Program (Orange). For Clarity, Standard Deviations are not Shown. Standard Deviations of Loudness Ratings are Smaller when Sounds are Presented to the NH ear than when Presented to the CI ear (Either Program) and are Smaller for Low-level than for High-level Stimuli. For this Loudness Scale (0–100), Standard Deviations Range from 2 to 18.
Loudness ratings are plotted on the y-axis, and stimulus level (in dBC) is plotted on the x-axis. Data points represent group median ratings at each stimulus level. Note that loudness ratings with the modified program are closer to NH ear loudness ratings than are everyday program loudness ratings, especially for soft and conversational speech levels (40–65 dBC). Additionally, with the everyday program, loudness grows slowly for soft sound (35–45 dBC); whereas, with the modified program, there is a more rapid growth of loudness in this soft range, similar to the NH ear. Lastly, more intense stimuli (75–80 dBC) are not rated as loud with either the modified or the everyday program compared to ratings with the NH ear. This is likely due to the amplitude compression in CI processing.
Participant Preferences
At Session 3, participants were asked which of the two programs they preferred to use in daily life. Twelve of 15 participants chose the modified program and one the everyday program as their favorite. Two reported no difference between programs (Supplemental Material 4).
Correlations, Experienced CI Recipients From Experiments 1a and 2
Correlation analyses were completed with 30 distinct experienced SSD-CI users who participated in Experiment 1a or Experiment 2. As previously noted, five individuals participated in both studies, first completing Experiment 2 (interaural loudness mismatch) and then months later, completing Experiment 1a (interaural frequency mismatch). For these five participants, their outcomes from Experiment 2 were analyzed and reported here; however, results were the same whether correlations were analyzed with outcomes from Experiment 1a or 2.
Age and length of deafness have been shown to affect CI outcomes in previous studies (Blamey et al., 2013; Holden et al., 2013; Lazard et al., 2012). For current study participants, the mean length of deafness was short, ≤4 years; therefore, correlation analyses were completed between age and outcomes, with a particular interest in whether age correlated with CI CNC scores. Results showed that with a modified program (modified FAT or modified loudness program), age did not correlate with CI CNC scores or any other outcome (p's > .05), except for localization (r = .533, p = .002). Older participants had higher RMS errors with a modified program than younger participants. With an everyday program (everyday FAT or everyday loudness program), age was negatively correlated with CI CNC scores (r = −.619, p < .001). Older participants had lower CI CNC scores with an everyday program than younger participants. Age did not significantly correlate with any other outcomes (p's > .05). Also of interest was daily device usage, measured by datalogging; previous studies have found device usage to be correlated with CI outcomes. With a modified program, datalogging did not correlate with any outcome (p's > .05). With an everyday program, datalogging was negatively correlated with one outcome, audibility (r = −.560, p = .001), i.e., low daily device usage was associated with high sound-field thresholds or poor audibility.
The R-SPACETM was the only measure that showed a significant difference in results between a modified and an everyday program, i.e., SNR-50 scores were lower (better) with a modified program. Therefore, for the 30 experienced SSD-CI users, correlations were analyzed between R-SPACETM scores when using a modified program and several variables: age, datalogging, CI CNC scores, CI audibility, and NH ear 4fPTA. There were no significant correlations between R-SPACETM scores with a modified program and any of these variables.
Discussion
Experiments 1a and 1b: Reducing Interaural Frequency Mismatch in Experienced and Newly Implanted Users
We hypothesized that decreasing the interaural frequency mismatch for SSD-CI users would improve binaural abilities, i.e., speech understanding in noise and localization. The frequency boundaries in the modified FAT were created to reduce the interaural frequency mismatch for SSD-CI recipients using a Cochlear device (see Figure 1) without the use of explicit behavioral pitch matching or CT-imaging analysis. Results for the R-SPACETM, a test that simulates communicating in a noisy restaurant, showed significantly lower (better) SNR-50 scores with the modified FAT compared to the everyday FAT. Preference data for the modified FAT was also encouraging. No difference in CI CNC word scores in quiet was seen between FATs. This is in line with results from Li and Fu (2010), where NH listeners were evaluated using 8-channel vocoded speech to simulate listening with a CI. The NH listeners compared spectrally shifted speech (2-, 3-, and 4-mm spectral shifts) to nonspectrally shifted speech (0 mm) in both quiet and noise. For sentences in quiet, outcomes were similar between nonspectrally shifted and spectrally shifted speech. However, in noise, especially in multitalker babble, a decrease in score was seen for spectrally shifted speech compared to nonspectrally shifted speech. The authors hypothesized, based on their results, that frequency-to-place mismatches may be a hindrance to CI recipients’ speech understanding in complex and noisy listening environments, e.g., restaurants.
Additionally, the small but significant difference in R-SPACETM SNRs between FATs is interesting because our group of SSD-CI participants had been using the everyday FAT for years (mean: 4.3 years) while using the modified FAT for only weeks. If a participant had adapted to the everyday FAT (McDermott et al., 2009; Reiss et al., 2008; Reiss et al., 2014; Svirsky, Fitzgerald et al., 2015a), then changing the FAT after years of use could have been detrimental to speech understanding, especially in noise. This was not the case. Even after years of everyday FAT use, many participants performed better in the R-SPACETM with the modified FAT (See Figure 2), suggesting that complete adaptation to the everyday FAT may not have occurred, at least for some participants.
Tan et al. (2017) examined pitch-matching results for 16 CI recipients using either a Cochlear (n = 12) or an Advanced Bionics (n = 4) device. Participants had low-frequency residual hearing in the contralateral ear and had used their CI for 3 months to 8 years, except for one participant who had used the CI for 2 days. Seven participants had adapted to their everyday FAT as pitch-matching results fell near the center frequencies of the analysis bands of their everyday FAT. Three of these seven had used the CI for less than a year. In contrast, nine participants did not adapt to their FAT, including three with a year or more of CI use (see Figure 4 in Tan et al., 2017). These results led to the belief that perhaps the majority of participants in the current study may not have completely adapted to the everyday FAT and therefore, easily adjusted to the modified FAT.
The ability or need to adapt to a FAT may be limited for SSD-CI users. Tan and colleagues (Tan et al., 2017) proposed that those CI users who have an “ecological need” to adapt to a FAT will adapt. For example, those CI users with a short electrode array and traditional CI users who depend on the CI for communication may adapt to their FAT. Conversely, those without an “ecological need,” e.g., those with long arrays that produce less interaural mismatch or SSD-CI users who depend on the NH ear to communicate, may not adapt to their FAT. Not adapting to their everyday FAT due to reliance on the NH ear could be one reason why this group of SSD-CI users was able to easily adjust to the modified FAT. Alternatively, since both center frequencies and bandwidths of the CI band-pass filters were changed, it is possible that spectral information was somehow transmitted in a better way with the modified compared to the default FAT; consequently, participants were able to easily adjust to the modified FAT.
Dirks et al. (2022) evaluated a group of nine SSD-CI participants with at least 6 months of CI use to determine whether reducing the interaural pitch mismatch could improve speech understanding in noise and localization. Six participants were implanted with the MED EL Flex 28 lateral wall array, two were implanted with the MED EL Flex 24 lateral wall array, and one was implanted with the Nucleus CI422 lateral wall array. Dirks and colleagues hypothesized that SSD-CI participants are most sensitive to binaural temporal envelope beats when electric and acoustic signals, presented to each ear (i.e., 50 Hz pulse trains with the same pulse rate or differing in pulse rate by 1 Hz), stimulate the same location in each cochlea (Dirks et al., 2022). Using a two-alternative, forced-choice procedure to determine binaural temporal disparities (Dirks et al., 2020), a modified FAT was created for seven participants; two participants had modified FATs created via CT imaging. With the modified FAT, the center frequency of the most apical electrode was shifted up compared to the everyday or clinical FAT for all participants (e.g., an upward shift from ∼ 200 to 400 Hz for S6, see Figure 2 in Dirks et al., 2022). The amount of shift varied among participants. Participants were first tested with the everyday FAT and then acutely with the modified FAT. Participants wore the modified FAT for 6 months and were tested several times during this period. They then switched back to the everyday FAT and were tested acutely and again after 1 month's use. No significant differences were found for localization or speech recognition in noise between the everyday and modified FATs. Dirks et al. (2022) noted that most participants did not report quality differences between the two FATs. Overall, Dirks et al. (2022) and current study results are similar. However, the current study showed small but significant improvement in noise (R-SPACETM) and significant improvement in perceived ability ratings for the SSQ subscale, Multiple Speech Stream Processing and Switching, with the modified FAT compared to the everyday FAT. No significant differences in localization results were seen between FATs for either study. Though, current study participants’ SSQ ability ratings for the Localization subscale were significantly higher with the modified FAT compared to the everyday FAT. Differences in study design, number of participants (9 versus 20), and implanted devices (MED EL versus Cochlear Nucleus) could account for differences between study results.
As noted in the Introduction, Toth et al. (2023) obtained pitch-matching data with 12 experienced SSD-CI users (1–5 yrs of CI use) to create modified FATs for each participant that reduced interaural pitch mismatch. Participants were implanted with the Cochlear Nucleus CI512 (n = 11) or CI612 (n = 1). Pitch matching was performed for electrodes 22, 17, 11, 5, and 1. After the task, the center frequency of each channel was shifted up (in Hz) with the modified FAT compared to the everyday FAT (default FAT in Cochlear's Custom Sound Pro software). With the modified FAT, the center frequency assigned to electrode 22 ranged from 455 to 807 Hz across participants (see Table 2 in Toth et al., 2023). Conversely, in the current study's modified FAT, the center frequency assigned to electrode 22 was 539 Hz for all participants. Participants in Toth et al. (2023) were first tested with the default FAT. Then, after 2 weeks’ use of the modified FAT, testing was repeated. Group mean data showed a significant increase in monosyllabic word understanding in noise in the sound-field (noise to the NH ear and speech to the CI ear) and in SSQ12 (Noble et al., 2013) ratings. The group had an almost 10-percentage points improvement in word understanding in noise with the modified FAT. This significant improvement may have been due to the pitch-matching task that resulted in individualized FATs for each participant. The time and patient commitment needed to conduct pitch matching, however, is not typically clinically feasible. Current study results indicate that using the modified FAT is efficient and may improve speech understanding in noise; nevertheless, audiologists will need to weigh efficiency against the possibility of greater improvement in outcomes using behavioral pitch matching or CT imaging to reduce interaural frequency mismatch. Given significantly better performance in the R-SPACETM with the modified FAT and participants’ preference data, it seems reasonable to try the modified FAT with SSD-CI recipients using Cochlear devices, even for recipients with years of CI experience.
For newly implanted SSD-CI recipients, a question remains whether the modified FAT should be the only FAT provided at initial CI activation or if both FATs (default and modified) should be provided for comparison. No significant difference in speech recognition, localization, or perceived listening abilities was found between the two FATs for the 10 newly implanted participants in the current study. Only one participant had a distinct preference for either FAT. In that one case, the modified FAT was preferred. Newly implanted participants had 6 weeks with each FAT and then 2–3 weeks to compare FATs at home. It is possible that 15 weeks was not enough time for these SSD-CI participants to adjust to the combination of electric and normal or near-normal acoustic hearing, let alone develop preferences between FATs. Figure 1 indicates that increasing the low-frequency edge of the input spectrum to the CI from 188 (default FAT) to 500 Hz (modified FAT) and redesigning bandwidths to better mimic human auditory filters provides a better tonotopic match to either of the spiral ganglion maps for low and mid frequencies compared to the default FAT. Results from the experienced participants indicated that a FAT that better matches the tonotopicity of the contralateral ear could be beneficial. Since both FATs provided similar outcomes, in the short term, for all test measures for newly implanted SSD-CI recipients, it is recommended to start with a modified FAT at initial activation. After 6 months’ use, the default FAT could be added to the speech processor for comparison to the modified FAT.
Experiment 2: Reducing Interaural Loudness Mismatch in Experienced Users
We hypothesized that interaural loudness mismatch also reduces binaural abilities and contributes to variability in SSD-CI performance. The study aimed to obtain CI sound-field thresholds of ∼20 dB HL across frequencies and to better match loudness between ears, with the objective of improving performance and decreasing outcome variability. With their everyday program, group mean sound-field thresholds for the 15 experienced SSD-CI users in Experiment 2 were ≤30 dB HL from 0.25 to 6 kHz. There was, however, considerable variability across individuals. With the modified loudness program, there was a substantial decrease in variability in sound-field thresholds across participants, and thresholds were closer to 20 dB HL across the frequency range (see Figure 4). Previous research has shown that threshold levels of 20 dB HL are needed for optimal speech understanding with CIs and hearing aids (Holden et al., 2013; Mueller & Killion, 1990; Pascoe, 1980; Skinner, 1998, 2003). Studies with traditional CI recipients have shown a correlation between audibility and CI outcomes. Firszt et al. (2004) evaluated 78 adult CI recipients using CNC words presented at 70, 60, and 50 dB SPL and HINT sentences in noise presented at 60 dB SPL with a +8 dB SNR. Results revealed a significant correlation between sound-field thresholds and outcomes at presentation levels <70 dB SPL, i.e., better audibility correlated with better performance at 50 and 60 dB SPL in quiet and at 60 dB SPL in noise. Holden et al. (2013) reported a similar correlation; the study obtained CNC word scores across a 2-year period, beginning 2 weeks after CI activation, for 114 traditional CI recipients. The participants were grouped, based on rank order, from the lowest performers (Group 1) to the highest performers (Group 6). At 3 months post activation, Group 6 had significantly lower (better) sound-field thresholds than Group 1. It is possible, though, that audibility with a CI is not as important for SSD-CI users with one NH ear as it is for traditional CI recipients with bilateral moderate to profound hearing loss.
In the current study, the significantly better audibility with the modified program compared to the everyday program helped balance loudness between ears, which could be important for speech understanding. Figure 6 shows loudness ratings with the modified program being similar to NH ear ratings for the range of speech levels 35–65 dBC. This better loudness balance between ears likely contributed to the significant improvement in R-SPACETM SNR-50 scores with the modified compared to the everyday program. This may seem counterintuitive as one could theorize that CI audibility of 20 dB HL across the frequency range increases noise in the CI ear, making it more difficult to understand speech; however, we saw no difference in SNR-50 scores between programs when noise was to the CI ear, i.e., BKB-SIN noise to CI. In the R-SPACETM, restaurant noise was held constant at 60 dB SPL, and it was the level of the sentence that varied depending on participants’ responses (a correct response decreased the sentence level while an incorrect response increased the level). Average conversational speech at one meter can vary from 55 dB SPL (casual speech) to 75 dB SPL (loud speech). At distances greater than one meter and in background noise, conversational speech may exhibit an even wider range of levels at the listener's location (Skinner, 1988). With appropriate CI audibility and balanced loudness between ears, participants were able to hear soft speech cues in the R-SPACETM and improve their speech recognition in noise with the modified program.
Correlations
As in other studies (Blamey et al., 2013; Holden et al., 2013; Lazard et al., 2012), age negatively correlated with CI speech recognition, but here only with an everyday program. Outcomes were not affected by age when experienced participants used a modified program, highlighting its potential usefulness with SSD-CI users. Previous research has also indicated that increasing CI-use per day can improve CI CNC scores (Holder & Gifford, 2021); consequently, it was surprising that datalogging did not correlate with CI CNC scores for experienced participants using either a modified program or an everyday program. Tables 4 and 8 show at least eight hours of daily CI use for the majority of participants. The lack of variability in CI use may have precluded a significant correlation between CI CNC scores and datalogging. Lastly, correlation analyses indicated that experienced participants’ R-SPACETM scores with a modified program were not related to age, datalogging, contralateral ear hearing, or CI audibility, suggesting that the program modifications used in this study improved speech recognition in noise for SSD-CI users, irrespective of these variables.
Study Limitations
As with many SSD-CI studies, sample size is limited. Our small group of participants was fairly homogenous in age, length of deafness, length of CI use, CI-alone performance, and daily device use for both the interaural frequency mismatch (Experiment 1a) and interaural loudness mismatch (Experiment 2) studies. Perhaps larger differences in test results between the modified and everyday programs would have been found with more heterogeneous groups. Moreover, the modified FAT may have been more appropriate for some participants than others. The orange dashes in Figure 1 represent the center frequencies of the modified FAT versus the average insertion angle for each electrode (i.e., insertion angle averaged across a group of 120 CI532 and CI632 recipients). The blue line represents the center frequencies of the default FAT versus the average insertion angle for each electrode. For our average apical insertion angle of 395°, interaural pitch mismatch is reduced with the modified FAT compared to the default FAT, i.e., the orange dashed line is closer to the green lines (spiral ganglion maps) than the blue line. For a participant with a shallow apical insertion angle, e.g., 300°, interaural pitch mismatch will be decreased with the modified FAT compared to the default FAT, but interaural pitch mismatch will still be considerable. Varying insertion depths across participants may explain why some participants had a difference in performance between their everyday FAT and the modified FAT in the R-SPACETM, whereas others did not (Figure 2). Having CT imaging for all participants to verify electrode placement and frequency mismatch would have been ideal. That was not the case, however, as CT images are not always obtained clinically.
A decrease in interaural frequency mismatch, from the re-assignment of FAT center frequencies, may have led to the improvement in R-SPACETM and preference data with the modified FAT for some participants; however, the modified FAT filter bandwidths also differed. The ERB scale (Moore, 2007) was used for the majority of electrodes’ (E22–E6) band-pass filter bandwidths. The resulting bandwidths are more similar to those of human auditory filters and narrower than the bandwidths in the default FAT. Perhaps differences in bandwidths between the two FATs accounted for, or contributed to, the improvements seen with the modified FAT.
Lastly, most test results were similar with both FATs; however, in the R-SPACETM, a test that simulates listening in a restaurant, SNR-50 scores were significantly improved with the modified compared to the everyday FAT (Figure 2). Furthermore, participant preferences after comparing FATs at home were encouraging. It is possible that other real-world test measures would be more sensitive to differences between FATs than the measures used.
The results of Experiment 2 were quite promising as the majority of participants preferred the modified loudness program compared to their everyday program, and R-SPACETM results were significantly improved with the modified program (Figure 5). Perhaps better results would have been obtained if compression had been adjusted within the Custom Sound Pro software when creating the modified loudness program (Wess & Bernstein, 2019). The loudness growth parameter, previously referred to as the Q-value and described by Skinner et al. (1999), was unchanged from participants’ everyday program. Decreasing the loudness growth value from the default of 20 to 10 will make soft sounds more audible. In our clinical experience, adjusting the Q-value to increase the audibility of soft sound is not tolerated well by traditional CI recipients. This is likely due to our clinic programming procedures that already provide good audibility of soft sound (Figure 4, Panel A). Adjusting Q-value may be of interest for future studies with SSD-CI users.
Future research could also examine the use of electrical evoked stapedial reflex thresholds (eSRTs) for programming SSD-CI recipients. This objective measure has been shown to be a quick and accurate procedure for setting C-levels in CI users (Holder et al., 2024). Perhaps a combination of eSRTs and counted T levels could efficiently provide SSD-CI users with appropriate audibility and balanced loudness between ears. Finally, Figure 6 indicated that participants’ loudness ratings with the modified program were more similar to their loudness ratings with the NH ear than those with their everyday program. This suggests better loudness balance between ears with the modified program. Still, improved R-SPACETM performance and patient preference may have been due to the optimization of speech processor programs, i.e., updating T and C levels, activating ADRO if not in use, ensuring volume at 6 and sensitivity at 12, and not necessarily due to balanced loudness between ears.
Conclusions
Interaural frequency and loudness mismatch may affect SSD-CI outcomes (Bernstein et al., 2021; Dillon et al., 2022; Pieper et al., 2022; Wess et al., 2017). The results of this study indicate that clinicians can adjust programming parameters to decrease these mismatches and improve performance. Experiment 1 used a modified FAT that better matched the tonotopicity of the NH ear than the participants’ everyday FAT to improve outcomes. Two groups participated, one group of experienced SSD-CI users and another of newly implanted SSD-CI recipients. For experienced SSD-CI participants, results showed some improvement in speech recognition in noise with the modified FAT compared to the everyday FAT; additionally, 18 of 20 participants either preferred the modified FAT or reported no difference between FATs. For the newly implanted group, no significant differences in test results were found between the modified and everyday FATs. This result suggests that the first few months after CI activation may be too early to compare FATs, as newly implanted SSD-CI recipients are likely adjusting to electric and acoustic hearing. In Experiment 2, programming parameters were adjusted (T levels set using a counted T-level procedure, C-levels set to medium loud or loud, ADRO activated, volume to 6, sensitivity to 12) to obtain a report of balanced loudness between ears. Results indicated participants’ audibility and speech recognition in noise improved with the modified loudness program compared to the everyday program. Additionally, 12 of 15 participants preferred the modified program compared to the everyday program. Based on study results, it is recommended that both the modified FAT and the programming procedures used to create a balanced loudness between ears be implemented at CI activation for SSD-CI recipients with Cochlear Nucleus devices. Furthermore, these programming parameters and procedures can be used with SSD-CI users who have many years of device experience.
Supplemental Material
sj-docx-1-tia-10.1177_23312165251359415 - Supplemental material for Improving Outcomes of Single-Sided Deaf Cochlear Implant Users by Reducing Interaural Frequency and Loudness Mismatches through Device Programming
Supplemental material, sj-docx-1-tia-10.1177_23312165251359415 for Improving Outcomes of Single-Sided Deaf Cochlear Implant Users by Reducing Interaural Frequency and Loudness Mismatches through Device Programming by Laura K Holden, Rosalie M Uchanski, Noël Y Dwyer, Ruth M Reeder, Timothy A Holden and Jill B Firszt in Trends in Hearing
Supplemental Material
sj-doc-2-tia-10.1177_23312165251359415 - Supplemental material for Improving Outcomes of Single-Sided Deaf Cochlear Implant Users by Reducing Interaural Frequency and Loudness Mismatches through Device Programming
Supplemental material, sj-doc-2-tia-10.1177_23312165251359415 for Improving Outcomes of Single-Sided Deaf Cochlear Implant Users by Reducing Interaural Frequency and Loudness Mismatches through Device Programming by Laura K Holden, Rosalie M Uchanski, Noël Y Dwyer, Ruth M Reeder, Timothy A Holden and Jill B Firszt in Trends in Hearing
Supplemental Material
sj-docx-3-tia-10.1177_23312165251359415 - Supplemental material for Improving Outcomes of Single-Sided Deaf Cochlear Implant Users by Reducing Interaural Frequency and Loudness Mismatches through Device Programming
Supplemental material, sj-docx-3-tia-10.1177_23312165251359415 for Improving Outcomes of Single-Sided Deaf Cochlear Implant Users by Reducing Interaural Frequency and Loudness Mismatches through Device Programming by Laura K Holden, Rosalie M Uchanski, Noël Y Dwyer, Ruth M Reeder, Timothy A Holden and Jill B Firszt in Trends in Hearing
Supplemental Material
sj-eps-4-tia-10.1177_23312165251359415 - Supplemental material for Improving Outcomes of Single-Sided Deaf Cochlear Implant Users by Reducing Interaural Frequency and Loudness Mismatches through Device Programming
Supplemental material, sj-eps-4-tia-10.1177_23312165251359415 for Improving Outcomes of Single-Sided Deaf Cochlear Implant Users by Reducing Interaural Frequency and Loudness Mismatches through Device Programming by Laura K Holden, Rosalie M Uchanski, Noël Y Dwyer, Ruth M Reeder, Timothy A Holden and Jill B Firszt in Trends in Hearing
Footnotes
Acknowledgments
The authors would like to acknowledge Cochlear Americas for funding the study through an Investigator Initiated Research grant. In addition, we want to acknowledge audiologists Brenda Gotter, Sallie Vanderhoof, Karen Mispagel, Susan Rathgeb, and Lydia Kraus for assistance with participant recruitment. We thank the participants for their time and commitment to the study.
Ethical Approval and Informed Consent
The study was approved by the Human Research Protection Office at Washington University School of Medicine. All participants signed an informed consent document prior to any study procedures.
Author Contributions
All authors helped design the study, analyze and interpret data, and write the paper. LKH collected the data.
Funding
The authors disclosed receipt of the following financial support for the research, authorship, and/or publication of this article: This research was supported by an Investigator Initiated Research (IIR) grant from Cochlear Americas, Lone Tree, CO. The funding organization had no role in the design and conduct of the study; in the collection, analysis, and interpretation of the data; or in the decision to submit the article for publication; or in the preparation, review or approval of the article.
Declaration of Conflicting Interests
The authors declared the following potential conflicts of interest with respect to the research, authorship, and/or publication of this article: JBF serves on the audiology advisory boards for Advanced Bionics and Cochlear Americas. LKH, RMU, NYD, RMR, and TAH declared no potential conflicts of interest with respect to the research, authorship, and/or publication of this article.
Data Availability Statement
The datasets generated during and/or analyzed during the current study are available from the corresponding author on reasonable request.
Supplemental Material
Supplemental material for this article is available online.
References
Supplementary Material
Please find the following supplemental material available below.
For Open Access articles published under a Creative Commons License, all supplemental material carries the same license as the article it is associated with.
For non-Open Access articles published, all supplemental material carries a non-exclusive license, and permission requests for re-use of supplemental material or any part of supplemental material shall be sent directly to the copyright owner as specified in the copyright notice associated with the article.