
Abstract
Music through a cochlear implant (CI) is described as out-of-tune, suggesting that musical intervals are not accurately provided by a CI. One potential reason is that pitch may be insufficiently conveyed to provide reliable intervals. Another potential reason is that the size of intervals is distorted through a CI as they would be when produced by a mistuned piano. To measure intervals through a CI, listeners selected prerecorded vowels with different fundamental frequencies to represent each note in Happy Birthday. Each listener had contralateral normal hearing (NH); repeating the experiment with their NH ear allowed for a within-subject control. Additionally, the effect of listening simultaneously to both a CI and NH ear was measured. The resulting versions of Happy Birthday were analyzed in terms of their contours, interval sizes, magnitudes, consistency, and direction. Intervals with NH ears ranged from perfect to uncorrelated with target intervals. Chosen interval size with the CI was poorer than with the NH ear for all subjects. Across listeners, chosen intervals with the CI ranged from highly correlated to uncorrelated with target intervals. That CI intervals were highly correlated with target intervals for some listeners suggests that accurate intervals can be provided through a CI. For some listeners, chosen intervals were larger than target intervals, suggesting that intervals may be perceived as too small. Overall, intervals with the combination of the NH and CI ears were similar to those with the NH ear alone, suggesting that the addition of a CI has little-to-no effect on interval perception.
Introduction
Although cochlear implants (CIs) are highly successful at restoring speech recognition for profoundly deafened individuals, music perception through a CI is difficult and frequently described as not enjoyable (e.g., Gfeller et al., 2005; Kong et al., 2004; Landsberger et al., 2020; Leal et al., 2003). It is well documented that CI users can accurately describe changes in fundamental frequency as a pitch increase or decrease provided the differences between fundamental frequencies are sufficiently large (e.g., Galvin et al., 2007, 2008; Looi et al., 2007). However, the ability to detect pitch direction is insufficient for music perception; correct musical intervals must also be accurately perceived. For example, a 50% increase in fundamental frequency must be perceived as not just higher but as a musical fifth. If intervals are not correctly maintained, then melodies will be out-of-tune and harmonic structures will sound inharmonic. In addition to being problematic for music, distorted or non-existent representation of musical intervals is also likely to reduce the sound quality of speech.
Music through a CI is frequently described as being out-of-tune (e.g., Jiam et al., 2017; Luo et al., 2014), suggesting that musical intervals are not accurately perceived. There are at least two potential explanations for the out-of-tune perceptions. One potential explanation is that the pitch representation for single notes is poor. That is, electric stimulation is imprecise and stimulation in response to a musical note may not sound like a musical note, making it difficult to discern intervals. Another potential explanation is that although individual notes may sound “note-like,” the perceptual differences between two notes may not correctly represent the intended interval. This situation is analogous to listening to a piano that is out-of-tune. That is, each note would sound like a note in isolation, but intervals and melodies played on the piano would be out-of-tune. However, if a CI listener perceives distorted intervals, then presumably they are also capable of perceiving intervals correctly with improvements in signal processing or transposition of frequencies.
Determining if a CI user can accurately perceive an interval is difficult. For example, there are multiple potential explanations for why a musically-trained CI listener might incorrectly identify a musical interval. One is that they cannot properly hear an interval (perhaps because pitch is poorly encoded). Another is that the CI listener is providing a very accurate description of the interval distortion through the CI. A third is that the task is dependent on the listener's ability to remember what a given interval sounds like, despite not having heard one acoustically represented since before their onset of deafness. Spitzer et al. (2021) addressed this issue by comparing the perceived interval size with a CI with intervals presented to an acoustic-hearing contralateral ear. This allowed the measurement of interval size against a reference known to both the experimenter and participant. They found that an interval of pure tones presented to a CI was nearly always perceived as smaller than when presented to a contralateral acoustic-hearing ear. However, the magnitude of the perceived interval compression with the CI varied greatly both across listeners and across interval size. These results suggest that, by expanding the frequency spacing between notes, a melody could be played such that it sounds in-tune to a CI listener. That is, to play an interval that sounds like a perfect fifth (i.e., a seven-semitone difference) to a CI user, the two notes should be played more than seven semitones apart. To verify this, it is important to design an experiment in which different perceived musical intervals can be compared both within modality (i.e., electric or acoustic) and across modality.
Through a CI, the two potential cues to pitch are temporal coding and place coding. There is evidence that both potentially distort the intervals delivered by the CI. Temporal coding can be provided by the rate of stimulation from an electrode (e.g., 100 Hz is represented by 100 pulses-per-second) or by amplitude modulation of a high-rate carrier pulse train. Place coding is provided by the location of the electrode(s) within the cochlea providing stimulation. Given the tonotopic nature of the cochlea, electrodes that are placed relatively apically within the cochlea are used to encode lower frequencies and electrodes that are placed relatively basally within the cochlea are used to encode higher frequencies. Indeed, changes in temporal coding and place of stimulation are both described as changes in pitch (e.g., Eddington et al., 1978; Landsberger et al., 2016; Luo et al., 2012; Shannon, 1983; Stohl et al., 2008; Tong et al., 1983). However, it is unclear if either cue correctly provides musical intervals.
Pijl and Schwarz found that three subjects could use changes to the rate of stimulation to generate (Pijl and Schwarz, 1995a) or identify (Pijl and Schwarz, 1995b) intervals within approximately a semitone. However, other experiments have been less encouraging about maintaining intervals with rate encoding. Blamey et al. (1996) and Schatzer et al. (2014) conducted pitch-matching experiments in CI users with significant contralateral acoustic hearing. As discussed in Landsberger et al. (2016), both Blamey et al. and Schatzer et al. found that, on most electrodes, a change in rate of stimulation on a single electrode was matched by smaller frequency changes in pure tones presented to the acoustic-hearing ear. The Blamey et al. and Schatzer et al. results suggest that intervals produced by temporal processing may be perceived as smaller than the interval represented by the changes in frequency. Todd et al. (2017) conducted an experiment which demonstrated that when using single-electrode temporal coding, implant users did not rate Happy Birthday to be more in-tune than when the semitone spacings between notes were too large or too small. As the same subjects were highly sensitive to the same manipulation in a contralateral NH ear, the limitation to performance with their CIs were not based on a lack of understanding of the task or a poor memory of the tuning of Happy Birthday. One possible conclusion from the Todd et al. data is that temporal coding does not provide sequential interval pitch. Because the distortion in semitone spacing was consistent across all notes in a trial, an alternate conclusion is that intervals are distorted with rate coding, but the distortion is not uniform across frequencies. Anecdotal reports from the subjects implied that certain sections of the melody would be in-tune for some trials whereas other sections of the melody would be in-tune in other trials (with different distortions). However, in no trials was the entire melody in-tune. Collectively, these data suggest that rate pitch is able to encode pitch and intervals, but the perceived size of intervals with rate pitch may be distorted.
Place coding can also distort perceived intervals. Using x-ray data from Landsberger et al. (2015), Stupak et al. (2021) documented that the average number of semitones per degree represented by the default frequency allocation was smaller than the number of semitones per degree represented by the corresponding characteristic frequency (CF) of the spiral ganglion (Stakhovskaya et al., 2007). Although the number of semitones per degree varied considerably across insertions and devices, the compression of intervals across the cochlea was consistently found for all manufacturers. Assuming CF differences in semitones along the spiral ganglion define musical interval spacing, then CIs would be expected to provide intervals that are perceived as too small. Specifically, place representation along the cochlea is highly compressed for frequencies up until approximately 500 to 750 Hz (∼B4 to G5) (Spitzer et al., 2021). For higher frequencies, the representation of intervals becomes closer to that represented by spiral ganglion CFs. However, even if the interpretation of interval representation from electrodes and frequency allocations is correct, it is overly simple. One issue is that it ignores the plasticity of the auditory system. After implantation, the pitch associated with a given electrode shifts toward the frequency represented by that electrode in the listener's CI strategy (e.g., Aronoff et al., 2019; Reiss et al., 2007, 2014; Svirsky et al., 2004), although this shift is often not complete. This adaptation potentially allows for correction of perceived interval relationships.
Spitzer et al. (2021) measured intervals of piano notes with fundamental frequencies in the range where semitone compression is greatest along the cochlea (e.g., for root notes <300 Hz). They found that intervals presented to a CI were indeed perceived as smaller than the same intervals presented to a contralateral acoustic-hearing ear, although the size of this distortion highly varied across listeners. Stupak et al. (2021) conducted a variant of the Todd et al. (2017) experiment using pure tones presented to a sound processor to emphasize place-pitch coding (Swanson et al., 2009 and the supplemental appendix of Stupak et al., 2021). They found that when presented to an implanted ear, presentations of Happy Birthday were rated as similarly out-of-tune when the semitone spacing was correct, compressed or expanded. Using a manipulation like that used in the Todd et al. experiment, the spacing in semitones between notes were uniformly distorted (i.e., in a given trial they were all equally too large, too small, or correct). However, when the same stimuli were presented to a contralateral NH ear, listeners were highly sensitive to semitone spacing. Conclusions from this experiment parallel those of Todd et al. (2017). Either place-pitch is incapable of providing proper musical interval pitch, or interval pitch is not uniformly distorted across frequencies. Some argue that place-pitch is not useful in a musical context and is actually brightness and not pitch (e.g., Plomp, 1976; Schubert & Wolfe, 2006). However other data suggest that place pitch can be useful for musical intervals (e.g., Swanson et al., 2009, 2019). The concept of nonuniform place-pitch distortions are consistent with the analysis of electrode placement and frequency allocations by Stupak et al. (2021) and Spitzer et al. (2021).
Given the poor sound quality of a CI (Jiam et al., 2017; Landsberger et al., 2020; Leal et al., 2003), it was surprising when Vermeire and Van de Heyning (2009) originally reported that subjects with unilateral normal hearing preferred and received benefit from the addition of a CI in the contralateral ear. These results have been replicated many times (e.g., Firszt et al., 2012; Tavora-Vieira et al., 2013; Vlastarakos et al., 2014) leading to the eventual FDA approval of implantation in patients with single-sided deafness (SSD). Landsberger et al. (2020) demonstrated that SSD CI users preferred listening to music with both their NH ear and their contralateral CI despite demonstrating in the same individuals that music sounds dramatically worse when presented to only the CI ear than when presented to only the NH ear. A follow-up experiment (Spitzer et al., 2019) suggests that the improvement in music perception from listening with a CI and NH ear is not because of improved perception of consonance or dissonance.
It remains unknown why listening to music with a combination of a CI and NH ear is preferable for music. Given the potential distortions of musical intervals through a CI, we hypothesized that the addition of a CI to NH ear would not improve (and might hamper) interval perception. However, by similar logic, the addition of a CI to NH ear should not improve (and might hamper) the enjoyment of music, but Landsberger et al. (2020) demonstrated that it does.
In this study, we examined the perception of intervals in a melodic context by allowing listeners to adjust the tuning of sung vowels until they were perceived as a correct tuning of the song Happy Birthday. Measurements were made by SSD CI users with their CI alone, their NH ear alone, and the two ears together. Measurements with the CI alone will provide insight into the perception and magnitude of intervals presented to the CI in a musical context. Measurements with the NH ear alone allows for a within-subject control for the CI-alone data. Additionally, measurements with the combination of the NH and CI ears provide insight into how acoustic and electric hearing integrate to affect interval perception.
Methods
Participants
Ten individuals with SSD and a CI in their deaf ear participated. Details on the participants are provided in Table 1.
Participant Characteristics.

ACE = advanced combination encoder; CI = cochlear implant; F = female; HL = hearing loss; M = male; SNHL = sensory neural hearing loss; WNL = within normal limits (<25 dB HL).
Stimuli and Procedures
The participants adjusted the pitch of 1-second-long recordings of a sung vowel (/a/) to replicate the song Happy Birthday using a series of computer-based sliders on the graphic user interface illustrated in Figure 1. This process was repeated for two singers (one male and one female) and three listening conditions (using their normal hearing ear alone (NH), using their cochlear implant alone (CI), or both ears together (NH + CI), referred to as the “Both” condition). A sung vowel was chosen instead of a note produced by an instrument for two reasons. First, it allowed comparison with previous studies that have investigated cochlear implant users singing (e.g., Aronoff et al., 2018; Xu et al., 2009). Second, CI users have a noted difficulty with vocal pitch perception (e.g., Gaudrain & Baskent, 2018).
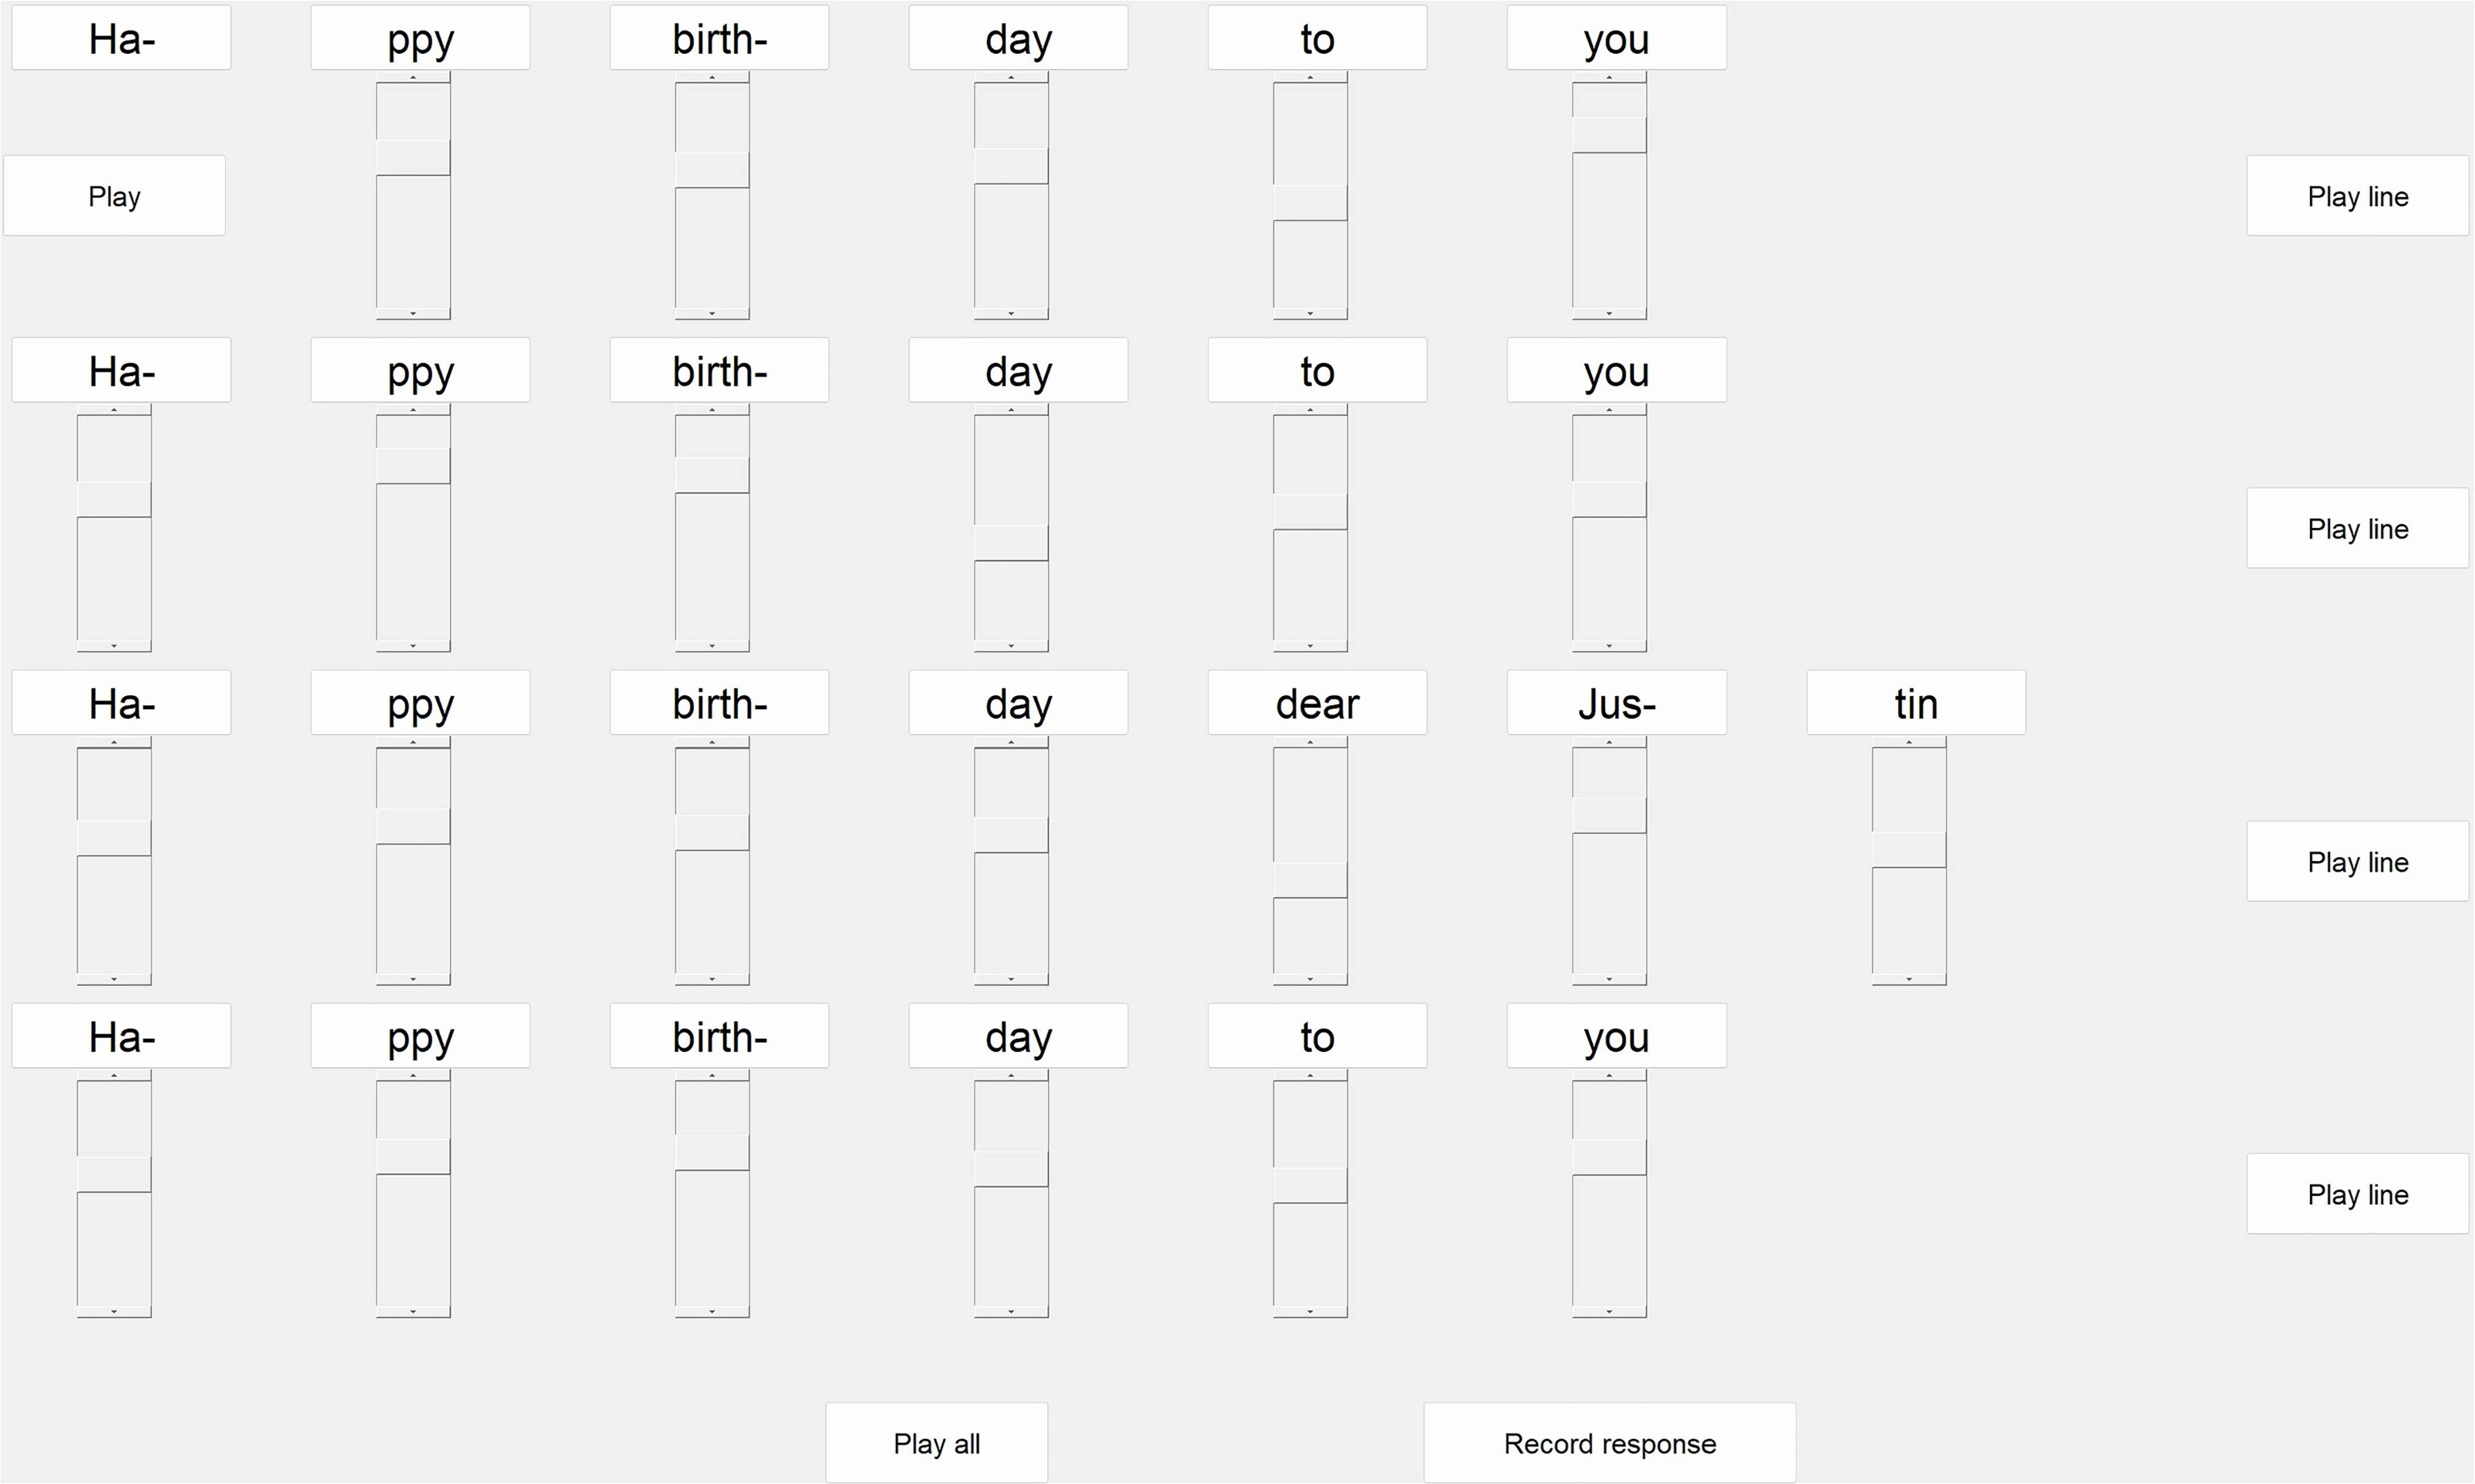
Screen capture of the response screen interface.
Both male and female voices were used in separate trials. The F0 for the male voice ranged from 73 to 238 Hz. The F0 for the female voice ranged from 162 to 544 Hz. Both male and female singers were 40 years old. Stimuli were recorded by having the male and female singers produce the sung vowels for the full range of pitches used in this experiment, each separated by approximately a semitone. The singers were presented with a pure tone with the target frequency prior to each recording to facilitate accurate pitch production. One second from the middle of each recording was used. To make sure that all participants had the same range of available notes above and below the starting note, the first note of the song was preset (94 Hz for the male, 191 Hz for the female voice).
Because all the stimuli were sung /a/, the relevant syllable for each note of the song was indicated above each slider to help participants keep track of their place in the song. Each syllable after the first note initially had the slider set at the lowest pitch (approximately four semitones below the starting note for the male voice and three semitones below the staring note for the female voice). Pitches to choose from were separated by approximately 1 semitone and covered approximately 21 semitones. There was no slider for the first note.
All sliders contained 25 steps, with the highest and lowest pitch repeated for a random number of steps (up to four steps) at the top and bottom of the slider range so that the participants could not solely rely on visual cues. The total number of repetitions for the lowest pitch was four minus the total number of repetitions for the highest pitch; thus, the total number of available steps was held constant across all sliders. After moving the slider, the participants would hear the recording selected. Participants could play the stimulus by the individual note, by line, or the whole song, and repeat the process as many times as necessary. As the song played, the corresponding syllable in the song was highlighted to aid the participant in following the song. There was a 0.5 second pause between each /a/ during the playback. Participants received no feedback. There was no time limit for completing the task. Testing typically took between 1 and 1.5 hours. The testing conditions were first randomized between male and female sung notes and then by ear tested.
The stimuli for the NH ear were presented via headphones (Sony MDR-7506) using a Tascam US-322 soundcard. The stimuli for the CI ear were presented directly from the Tascam US-322 soundcard to the CI sound processor via a direct audio input cable. Stimulus levels were set by playing the first sung note of Happy Birthday and asking the listeners to adjust the volume until it was perceived at a most-comfortable level. When testing both ears together, the participant adjusted the levels until the sound was perceived to be equally loud in each ear.
Results
Robust statistics were used because of the ample evidence that they typically yield more accurate results and better power (Erceg-Hurn & Mirosevich, 2008; Wilcox, 1995, 1998; Wilcox & Keselman, 2003). The following robust techniques were used in the analyses: bootstrap analyses, trimmed means, the minimum generalized variance outlier detection method, Rom's method, and Q value. Each is described below.
Bootstrap Analyses
Bootstrap analyses avoid assumptions of normality by using distributions based on the original data rather than an assumed normal distribution. These are conducted by sampling with replacement from the original data set. The same number of samples occur in each bootstrap distribution as are in the original data set, but because random sampling with replacement is used, any given data point will be included in some bootstrap distributions once, in some bootstrap distributions multiple times, and will not be included in other bootstrap distributions. This technique calculates statistics based on the actual data set, rather than by analyzing a normal distribution with the same mean and standard deviation as the actual data set as is done with traditional statistics. Given that normal distributions rarely if ever occur with behavioral data (Micceri, 1989), analyzing a normal distribution that only approximates some characteristics of the actual data set can be problematic and lead to misleading results (Rousselet et al., 2019; Wilcox, 1998; Wilcox et al., 1998).
Trimmed Means
While using means instead of trimmed means would not change which results were significant in our specific data set, they were used because various simulation studies have demonstrated that trimmed means provide more accurate results than means (Wilcox, 1998, 2005). This is because means are very sensitive to outliers, with a single outlier being able to change the mean such that it is not near any of the data points, preventing it from being an accurate measure of the central tendency of the data. That issue does not occur with trimmed means unless a large proportion of the data contains outliers.
Trimmed means are a cross between means and medians, where the data points are ordered from smallest to largest and the mean is calculated based on the central portion of the data (the central 60% of the data for the 20% trimmed means used in this article). This approach minimizes but does not remove the effect of very large or very small values in the data. Additionally, no attempt is made with trimmed means to determine which, if any, data points are outliers. Instead, calculating the trimmed mean merely involves taking the mean of the central 60% of the data, regardless of how close or far the remaining 40% of the data is from the central 60% of the data.
When combining trimmed means with bootstrap analyses, all data points will appear in the central 60% of the data for at least a subset of bootstrap distributions, meaning that no outlier is completely excluded from the analysis. This is because the central 60% is determined for each bootstrap distribution after each bootstrap distribution is generated. The data points are selected for the bootstrap distribution by randomly sampling from all of the original data points with replacement.
Minimum Generalized Variance Outlier Detection Method
Correlations are extremely sensitive to outliers, although outliers can only be defined in two dimensions for correlations. To minimize the effects of outliers for the correlation analyses, correlations were calculated using bootstrap Pearson correlations with outlier correction based on the minimum generalized variance outlier detection method.
Rom's Method
Family-wise error corrections were conducted using Rom's method (Rom, 1990), which is a robust approach that minimizes both Type I and Type II errors. This is a sequential rejection approach that takes into account both the number of analyses conducted and the number of analyses that yielded significant results. Unlike a Bonferroni correction, if a large number of analyses are conducted and all yield p values <0.05, all results are considered significant with Rom's method. This reflects the low probability of randomly having so many analyses with p values <0.05 when there is no actual effect. However, if the largest p value is >0.05, then alpha is reduced. If the next largest p value is greater than the adjusted alpha, then alpha is further reduced. This continues until all remaining p values are below the adjusted alpha level, at which point all remaining p values are considered significant.
Q Values
Effect size was measured using Q (Wilcox & Muska, 1999), which calculates the probability that a data point, chosen at random, comes from one specific condition. Q ranges from 0 to 1, with 0.5 indicating that the two distributions are identical and 1 indicating no overlap in the distributions. As a point of reference, with normality and homoscedasticity, Cohen's small effect is roughly equivalent to a Q of 0.55 and Cohen's large effect is roughly equivalent to a Q of 0.66 (Wilcox & Muska, 1999). Unlike Cohen's D, Q is not distorted by heteroscedasticity and is sensitive to a broad range of differences across conditions, including differences in measures of central tendency and differences in variance.
Contour accuracy was assessed using five metrics. The first metric was contour correlation. This measured the correlation between individual produced and target notes, providing a global measure of accuracy. However, if a participant changes frequency range part-way through the contour, the contour correlation may be low while most intervals are still correct. To address this, the second metric was interval correlation. This measured the correlation between target and produced intervals. While correlations indicate if the relative interval magnitude is consistent across intervals, they do not indicate the magnitude of any interval errors. To address this, the third metric was interval magnitude error, the magnitude of the difference between produced and target intervals, regardless of the position of those errors within the series of notes. To determine if the size of a perceived interval is dependent on fundamental frequency, a fourth metric, interval consistency, was used. The most common target interval in the melody Happy Birthday is a drop of two semitones. Within the melody, a two-semitone drop occurs from 2 to 0, 4 to 2, and 7 to 5 semitones relative to the first note. The produced intervals for these different occurrences of two-semitone drops were compared. Finally, an error in the direction of pitch change in an interval is separate from an error in the interval magnitude. As such, a fifth metric, interval direction, was also calculated. The interval direction analysis evaluates if a listener is able to identify correctly if a pitch interval increases or decreases in pitch height. An interval error was defined as where the pitch direction as selected by the listener does not match the correct pitch direction for a given interval. The raw data pooled across subjects are presented in Figure 2. Individual subject data is presented in Figure 3.
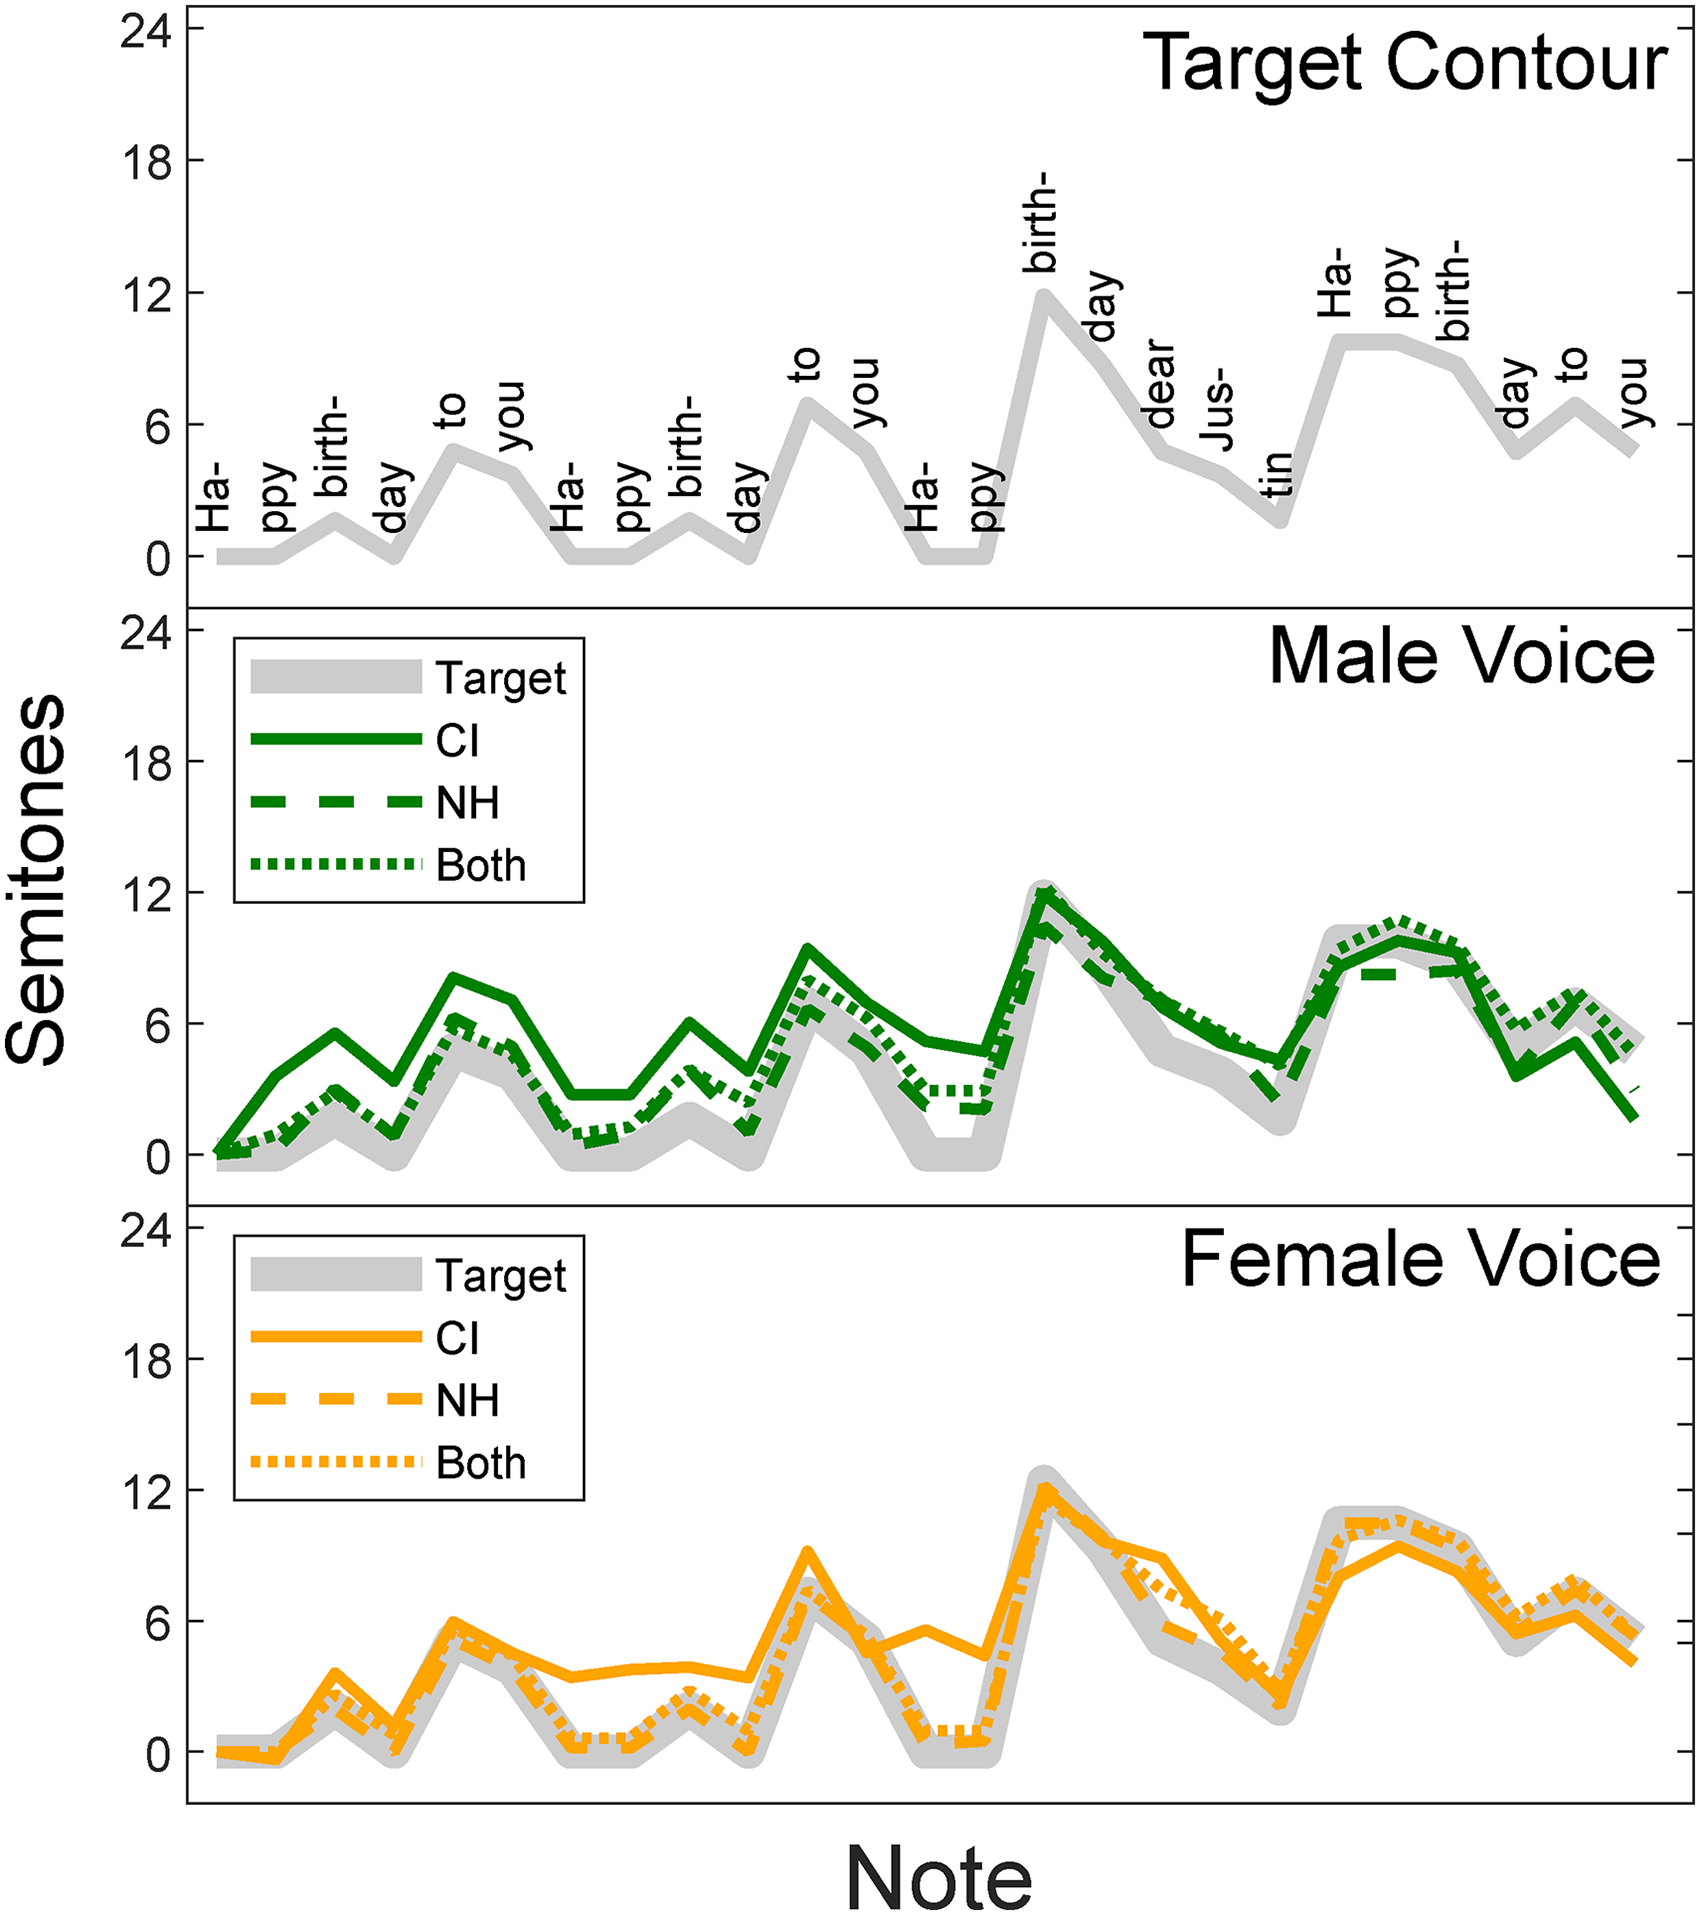
Contours for the melody, Happy Birthday. The top panel shows the physically correct target contour. The middle and bottom panels show the contours with the male (middle) and female (bottom) voice genders. Thick gray lines indicate target intervals. Trimmed mean intervals across subjects are presented for the CI ear (solid line), NH ear (dashed line), and Both ears together (dotted line). All notes are plotted in semitones relative to the root (first) note in the series. CI = cochlear implant; NH = normal hearing.

Raw data contour plots for each subject and condition. The top half illustrates responses to the male voice and the bottom half to the female voice. For each voice gender, the first two rows plot individual subject data with the CI ear, the second two rows plot individual subject data with the NH ear, and the bottom two rows plot the individual subject data with Both ears together. Within each individual subject plot, thick gray lines indicate target intervals, solid lines indicate the CI ear data, dashed lines indicate NH ear data, and dotted lines indicate Both ears together. All notes are plotted in semitones relative to the root (first) note in the series. CI = cochlear implant; NH = normal hearing.
Contour Correlation
The F0s of all recorded notes are reported in semitones relative to the starting note. To determine if there was a difference when using the recordings with the male speaker and the female speaker, a two-way (Speaker × Ear) bootstrap-T repeated measures analysis of variances (ANOVA) based on 20% trimmed means was conducted on the r values for the correlations between target and selected notes. There was no significant main effect of Speaker (p > 0.05). However, there was a significant interaction between Speaker and Ear for the NH versus Both comparisons (p < 0.02), with better performance with both ears for the male voice when adding the CI ear (20% trimmed mean for NH ear: 0.69; 20% trimmed mean for Both: 0.84) and worse performance with both ears for the female voice when adding the CI ear (20% trimmed mean for NH ear: 0.97; 20% trimmed mean for Both: 0.90). There was a significant main effect of Ear (p < 0.0001). Bootstrap pairwise comparisons with 20% trimmed means indicated a significant difference between CI and NH conditions (97.5% confidence interval: 0.1 to 0.8; 20% trimmed mean for the difference score: 0.4, 20% trimmed mean for the CI condition: 0.3; 20% trimmed mean for the NH condition: 0.8; Q = 0.75), and between CI and Both conditions (97.5% confidence interval: 0.05 to 0.8; 20% trimmed mean for the difference score: 0.4, 20% trimmed mean for the Both condition: 0.9; Q = 0.76). There was no significant difference between NH and Both conditions (97.5% confidence interval: −0.1 to 0.1; 20% trimmed mean for the difference score: 0; Q = 0.52).
Interval Correlation
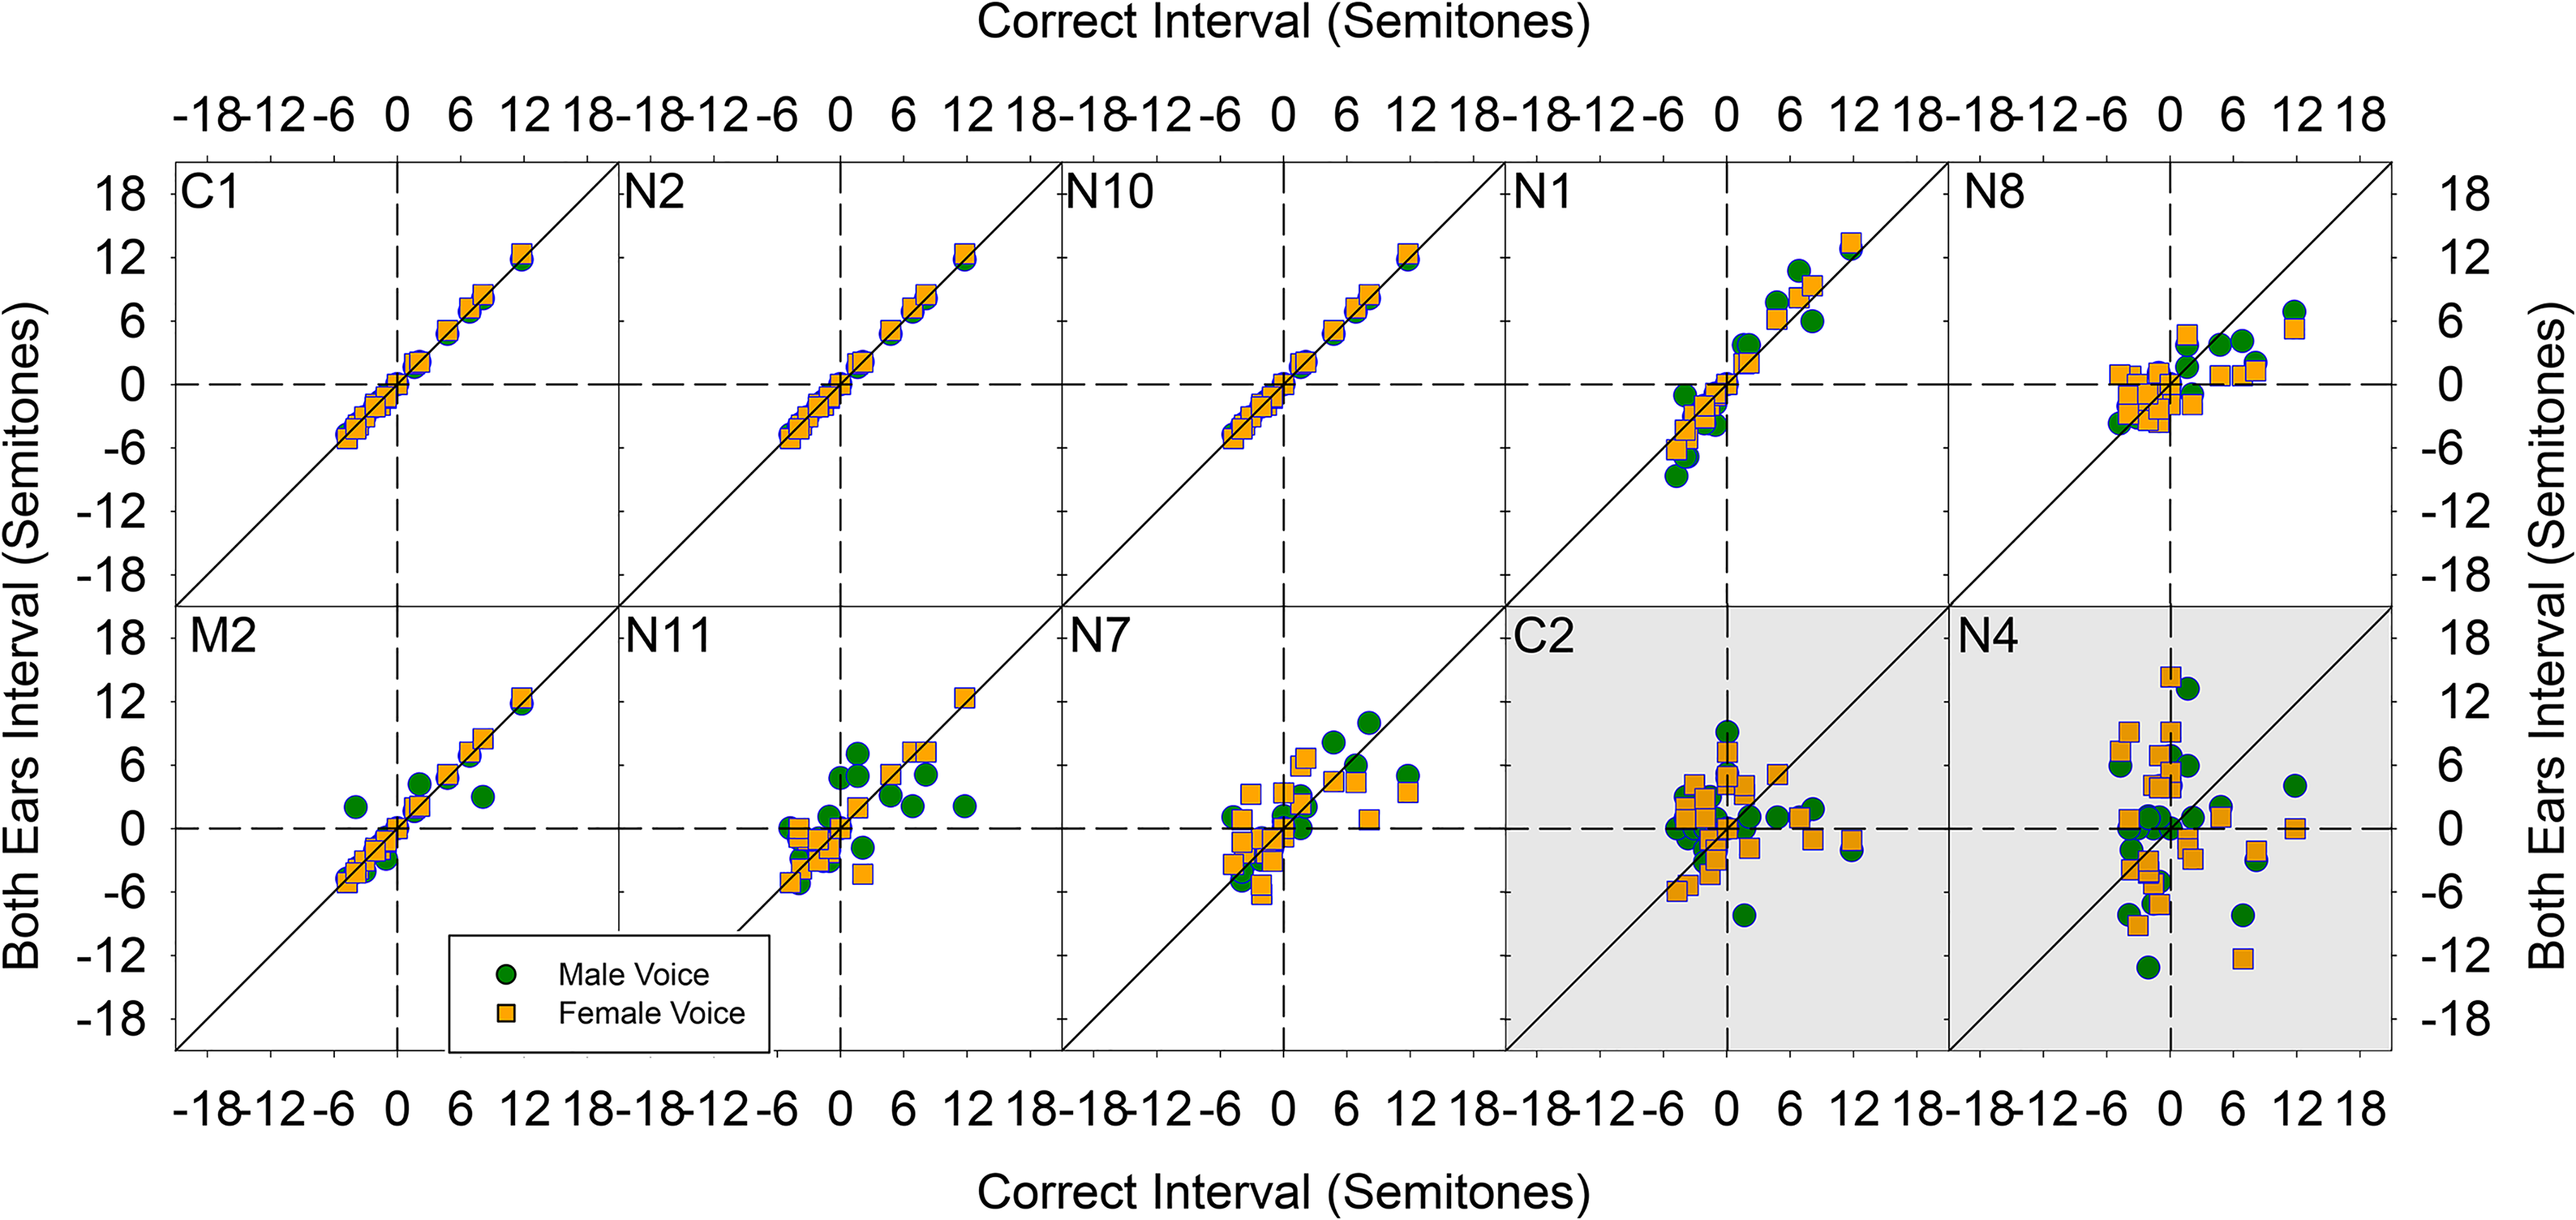
The size of each interval set by the subjects for each ear and for both genders was calculated in semitones. Scatterplots of the interval set with the NH ear are plotted as a function of the corresponding target interval in Figure 4 for each subject. NH performance across subjects was highly variable. Some subjects (C1, N2, N10) performed perfectly (r = 1 for the correlation between NH and target intervals) with both the male and female voices. Other subjects (e.g., N1, N11, N8) performed reasonably well in that their NH intervals were highly correlated with the target intervals. However, there was no significant correlation between NH and target intervals set by N4, providing no evidence that this subject was able to do the task with their NH ear.

The interval size in semitones between each interval in the melody Happy Birthday as set by each subject with their NH ear (y-axis) is plotted as a function of the correct target interval size of the corresponding interval (x-axis). Green circles indicate intervals with the male voice and orange squares indicate intervals with the female voice. Each panel represents an individual subject. Individual subject panels are organized in order of strength of correlation. Panels with white backgrounds represent significant correlations and panels with gray backgrounds represent no significant correlation detected. CI = cochlear implant; NH = normal hearing.
Scatter plots illustrating the relationship between CI interval sizes and target intervals are presented in Figure 5. The size of the correlation between CI and target intervals were generally smaller than the correlation between NH and target intervals (Figure 6) but remained significant for six subjects. In Figure 5, the best fitting line describing significant relationships between CI and target intervals often had a slope of approximately 1. A significant slope that approximates 1 indicates that the perceived size of an interval with a CI is approximately correct. Examples of these are C1 (male voice), N2 (female voice), N10 (both genders), and N1 (female voices). For other subject/gender combinations, strong correlations have slopes that are >1 (C1 female voice, N2 male voice, N1 male voice). Strong correlations with slopes >1 suggest that the listener hears intervals, but the interval perceived is smaller than the interval presented. That is, to perceive a desired interval, a physically larger interval is required.

The interval size in semitones between each interval in the melody Happy Birthday as set by each subject with their CI ear (y-axis) is plotted as a function of the correct target interval size of the corresponding interval (x-axis). Green circles indicate intervals with the male voice and orange squares indicate intervals with the female voice. Each panel represents an individual subject. Individual subject panels are presented in the same order as in Figure 4. Panels with white backgrounds represent significant correlations and panels with gray backgrounds represent no significant correlation detected. CI = cochlear implant; NH = normal hearing.
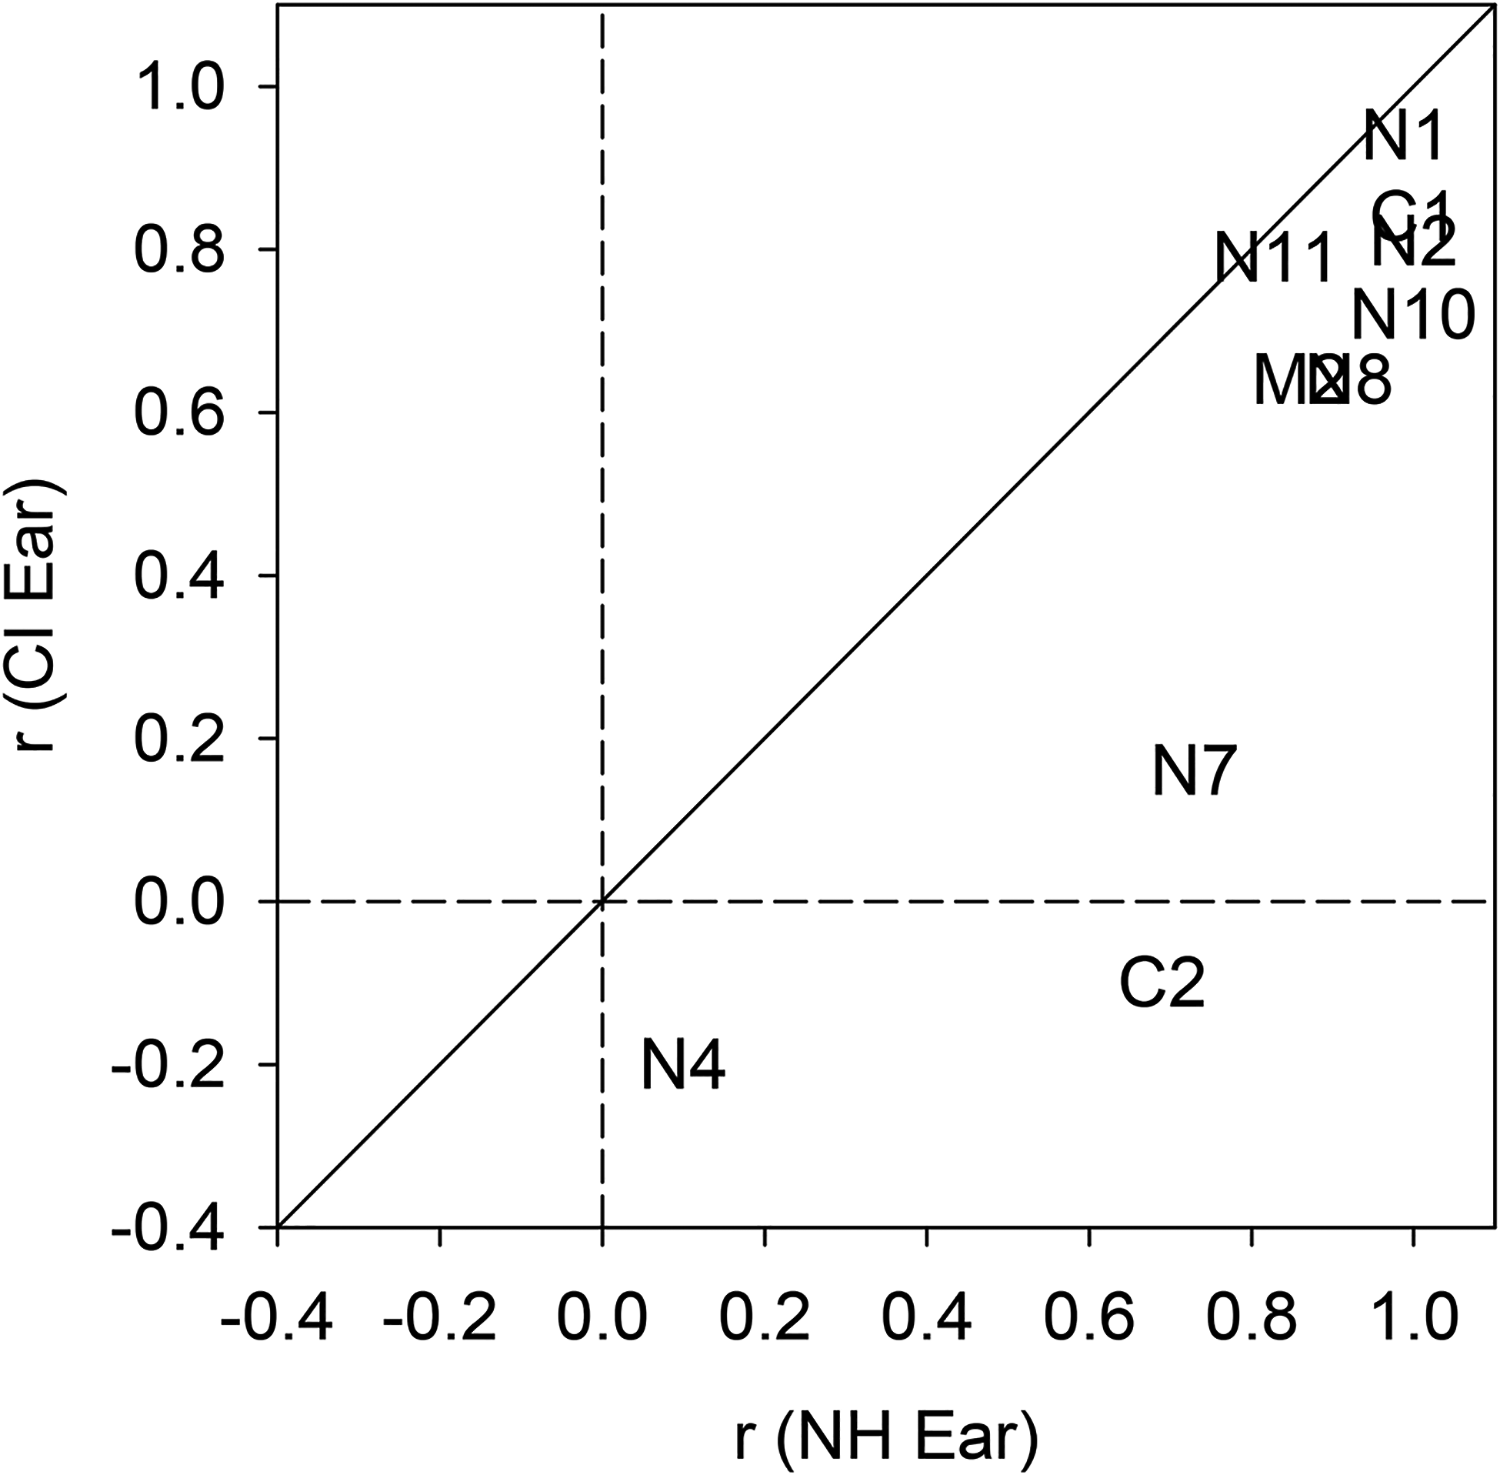
Scatter plot of r values for each subject. Correlations between NH and target intervals are presented along the x-axis and correlations between CI ear and target intervals are presented along the y-axis. CI = cochlear implant; NH = normal hearing.
Scatter plots illustrating the relationship between size of intervals generated by both ears together and target intervals are presented in Figure 7. The scatter plots for each subject for both ears are generally similar to the corresponding scatter plots for NH intervals in Figure 4. Except for C2 and N4, all correlations between Both ear and target intervals were significant (p < 0.05). The size of the correlations between both ears together and target intervals were generally similar to the correlation between NH and target intervals (Figure 8).
The interval size in semitones between each interval in the melody Happy Birthday as set by each subject with Both ears together (y-axis) is plotted as a function of the correct target interval size of the corresponding interval (x-axis). Green circles indicate intervals with the male voice and orange squares indicate intervals with the female voice. Each panel represents an individual subject. Individual subject panels are presented in the same order as in Figure 4. Panels with white backgrounds represent significant correlations and panels with gray backgrounds represent no significant correlation detected.

Scatter plot of r values for each subject. Correlations between NH and target intervals are presented along the x-axis and correlations between Both ear and target intervals are presented along the y-axis. NH = normal hearing.
To determine if there was a difference when using the recordings with the male speaker and the female speaker, a two-way (Speaker × Ear) bootstrap-T repeated measures ANOVA based on 20% trimmed means was conducted on the r values for the correlations between target and selected intervals. There was no significant main effect of Speaker (p > 0.05). However, there was a significant interaction between Speaker and Ear for the NH versus Both comparisons (p < 0.02), with better performance with both ears for the male voice when adding the CI ear (20% trimmed mean for NH ear: 0.76; 20% trimmed mean for Both: 0.89) and worse performance with both ears for the female voice when adding the CI ear (20% trimmed mean for NH ear: 0.96; 20% trimmed mean for Both: 0.80). There was also a significant interaction between Speaker and Ear for the CI versus NH comparison (p < 0.02), with a larger difference between NH and CI comparisons for the female voice (20% trimmed mean for CI ear: 0.49; 20% trimmed mean for the NH ear: 0.96) than for the male voice (20% trimmed mean for CI ear: 0.61; 20% trimmed mean for the NH ear: 0.76). There was a significant main effect of Ear (p < 0.0001). Bootstrap pairwise comparisons with 20% trimmed means indicated a significant difference between CI and NH conditions (97.5% confidence interval: 0.13 to 0.44; 20% trimmed mean for the difference score: 0.24, 20% trimmed mean for the CI condition: 0.56; 20% trimmed mean for the NH condition: 0.86; Q = 0.65), and between CI and Both conditions (97.5% confidence interval: 0.10 to 0.41; 20% trimmed mean for the difference score: 0.20, 20% trimmed mean for the Both condition: 0.85; Q = 0.63). There was no significant difference between NH and Both conditions (97.5% confidence interval: −0.13 to 0.06; 20% trimmed mean for the difference score: 0; Q = 0.54).
Interval Magnitude Error
The absolute value of the difference between each target interval and the magnitude of the selected interval for each subject and listening condition was calculated. Trimmed means of the interval magnitude differences were calculated for each subject and listening condition and plotted in Figure 9. For all subjects, the trimmed mean interval magnitude was greatest for the CI-only listening condition, whereas errors were similar for the NH and Both ear conditions. To determine if there was a difference between interval magnitudes when using the recordings with the male speaker and the female speaker, a two-way (Speaker × Ear) bootstrap-T repeated measures ANOVA based on 20% trimmed means was conducted. There was no significant main effect of Speaker or interactions between Speaker and Ear (all p values >0.05). There was a significant effect of Ear (p < 0.0001). Bootstrap pairwise comparisons with 20% trimmed means indicated a significant difference between CI and NH conditions (97.5% confidence interval: 0.90 to 1.89 st; 20% trimmed mean for the difference score: 1.25 st, 20% trimmed mean for the CI condition: 2.28 st; 20% trimmed mean for the NH condition: 0.98 st; Q = 0.71), and between CI and Both conditions (97.5% confidence interval: 0.70 to 2.03 st; 20% trimmed mean for the difference score: 1.11 st, 20% trimmed mean for the Both condition: 0.81 st; Q = 0.73). There was no significant difference between NH and Both conditions (95% confidence interval: −0.64 to 0.52 st; 20% trimmed mean for the difference score: −0.15 st; Q = 0.53).

The trimmed mean of the magnitude of the error of intervals in semitones are plotted for each subject as well as the trimmed mean magnitude error across subjects. Data is presented separately for CI, NH, and Both ear conditions. The order of subjects is the same as in Figure 4. CI = cochlear implant; NH = normal hearing.
Interval Consistency
In Figure 10, the size of the intervals generated by the subjects is presented for each of the two-semitone drop intervals in the melody for the male (left panel) and female (right panel) voices. Trimmed mean drops for all three listening conditions are approximately two semitones. To determine if there was a difference across different two-semitone drops using the recordings with the male and the female speakers, a two-way (Ear × Interval) bootstrap-T repeated measures ANOVA based on 20% trimmed means was conducted on the selected interval for target intervals of two semitones. There was no significant main effect of Ear or Interval, and no significant interaction (all p values >0.05), suggesting that the size of a perceived interval is not dependent on fundamental frequency, at least for this set of stimuli.

Interval sizes set by listeners for a two-semitone drop. In the correctly tuned melody, there is a two-semitone drop from two to zero, four to two, and seven to five semitones. Trimmed mean settings across subjects are presented for each of the two-semitone drops for the male and female voices with the CI, NH, and Both ear conditions. CI = cochlear implant; NH = normal hearing.
Interval Direction Error
The interval direction analysis evaluates if a listener is able to identify correctly if a pitch interval increases or decreases in pitch height. This analysis included all adjacent pairs of target notes that contained an increasing or decreasing pitch contour (i.e., those pairs of notes where the target F0 did not change from one note to the next were excluded). The total number of interval errors was calculated for each condition. An interval error was defined as where the pitch direction as selected by the listener does not match the correct pitch direction for a given interval. Results are presented in Figure 11. To determine if there was a difference when using the recordings with the male and the female speakers, a two-way (Speaker × Ear) bootstrap-T repeated measures ANOVA based on 20% trimmed means was conducted on the number of interval direction errors. There was no significant main effect of Speaker or interactions between Speaker and Ear (all p values >0.05). There was a significant effect of Ear (p < 0.05). Bootstrap pairwise comparisons with 20% trimmed means indicated a significant difference between CI and NH conditions (97.5% confidence interval: 0.67 to 3.58; 20% trimmed mean for the difference score: 1.83, 20% trimmed mean for the CI condition: 3.08; 20% trimmed mean for the NH condition: 1.33; Q = 0.55), and between CI and Both conditions (97.5% confidence interval: 0.67 to 2.92 st; 20% trimmed mean for the difference score: 1.5, 20% trimmed mean for the Both condition: 1.17; Q = 0.57). There was no significant difference between NH and Both conditions (97.5% confidence interval: −1.33 to 0.58; 20% trimmed mean for the difference score: −0.17 st; Q = 0.54).

Total number of interval direction errors is plotted for the CI, NH, and Both ears for each subject as well as the trimmed mean interval direction errors across subjects. CI = cochlear implant; NH = normal hearing.
Discussion
Interval Perception With a Cochlear Implant
Results from the current experiment suggest that interval perception is less accurate with a CI than with NH ear. Indeed, results are significantly poorer with a CI for contour correlation, interval correlation, interval magnitude error, and interval direction error metrics. This overarching finding is consistent with the many previous studies that have demonstrated distorted intervals or out-of-tune melodies with a CI (e.g., Jiam et al., 2017; Luo et al., 2014) and that CI users often have difficulty accurately singing familiar melodies (Aronoff et al., 2018, Xu et al., 2009). While interval correlation is poorer for the CI than NH ear, a significant correlation between CI and target intervals was found for six out of nine subjects for whom a significant correlation was observed between NH and target contours (i.e., the subjects who could do the task without the distortion of a CI). This suggests that intervals can indeed be represented through an implant but are not as well represented as with a normal hearing ear.
Perceived interval size varied across subjects. When significant correlations were detected between CI and target interval sizes, the best fitting lines usually had slopes approximating 1. A slope approximating 1 indicates an overall pattern of intervals presented approximately correctly. This is consistent with the results from the interval consistency analysis. Nevertheless, there is more variability in the CI interval sizes than there is for the same subject with the NH ear. One potential explanation is that pitch through a CI is poorer than with NH ear resulting in notes (and therefore intervals) that are less salient and therefore less stable. That is, the relationship between two notes in an interval may be encoded correctly, but not perceived accurately because of the poor pitch saliency of each note in the interval. Another potential explanation is that the interval distortions are variable across frequencies, even if there is no systematic frequency compression or expansion across intervals. However, there are a handful of participants’ data sets (C1-female voice, N2-male voice, N1-male voice) for which the slope of the best fitting line is >1, indicating that intervals are perceived as too small. That is, to hear a given interval, a larger interval must be presented to the CI.
The majority of data was inconsistent with the results from Spitzer et al. (2021) which found CI-perceived intervals consistently to be too small. There are many potential explanations for the discrepancy. One is that the intervals measured in Spitzer et al. (4, 8, and 12 semitones) were larger than the majority of intervals presented in this experiment. Perhaps the effect of frequency compression is larger with larger intervals. A second potential explanation is that the stimuli were different. Spitzer et al. used intervals consisting of pure tones whereas the current experiment used more complicated stimuli (sung vowels). The pitch cue provided by the pure tones in Spitzer et al. was primarily a place-pitch cue for most subjects. Six of the 10 subjects used the advanced combination encoder (ACE) sound coding strategy which provides no useful temporal cues in response to pure tones (Stupak et al., 2021; Swanson et al., 2009) and one used HiRes Optima-P which provides reliable temporal cues only for pure tones above 306 Hz (Appendix of Stupak et al., 2021). However, the two subjects using FS4 or FS4p strategies were provided reliable temporal and place cues in response to the pure tones (Appendix of Stupak et al., 2021). Sung vowels are more complicated stimuli which provide both place and temporal modulation cues through a processor. The outputs of the electrodes (electrodograms) are plotted in Figure 12, in which it can be observed that for all manufacturers, temporal coding is better preserved for the male voice with a lower fundamental frequency than with the female voice with a higher fundamental frequency. It is possible that the temporal components of the electric outputs of the sung stimuli provide for more accurate interval perception than a place-dominated cue.

Electrodograms illustrating the outputs of sound coding strategies from Cochlear (ACE; top row), Advanced Bionics (Optima; middle row), and MED-EL (FS4p; bottom row) using default stimulation parameters. The first and third columns represent the root notes for the male and female singers (∼94 and 191 Hz, respectively). The second and fourth columns represent the octaves above the root notes from the male and female singers. Note that F0 for the female singer root note was approximately the same as the F0 for the male singer octave. Within each plot, the outputs of each electrode (or virtual channel) are plotted for 100 ms extracted from the center of the sung vowel. Only the outputs from the apical half of each electrode array are presented for improved visibility. Electrodograms were generated with Nucleus Matlab Toolbox (Cochlear), Batch-C2-Simulator (Advanced Bionics), or simCoding (MED-EL).
If interval perception is dominated by temporal pitch, it would be expected that intervals would be more accurately represented for the male voice which had a lower F0 (73–238 Hz) than the female voice (162–544 Hz). It seems unlikely from the current data that there is a substantial difference between interval perceptions with the two voices. No effect of voice gender was detected for contour correlation, interval magnitude, interval consistency, or interval direction. However, in the interval correlation analysis, an interaction was detected between CI and NH ears and voice gender suggesting that there was a larger discrepancy between CI and NH interval correlations for the female voice (which is likely to provide poorer temporal cues) than the male voice (which is likely to provide better temporal cues). Other studies have also provided inconsistent conclusion as to the perception of intervals using temporal coding (e.g., Landsberger et al., 2016; Pijl & Schwarz, 1995a, 1995b; Schatzer et al., 2014; Todd et al., 2017).
Interval Perception With a Cochlear Implant and Normal Hearing Ear Together
Previous work (Landsberger et al., 2020) has suggested that single-sided deafened listeners prefer the sound quality of listening to music with a CI and their NH ear together over listening with the NH ear alone. However, the attribute of the CI that provides the listening preference remains unknown. The data collected for the present study do not support the possibility that the preference for listing with both a NH and CI ears together observed in Landsberger et al. (2020) is derived from an improved perception of musical intervals in that no significant difference was detected between NH and Both ear listening conditions in any of the analyses. The interval correlations for the NH and Both ear listening conditions were very similar for most subjects, although the correlation dropped considerably with the Both ear condition for one subject (C2). The Both and NH ear conditions provide similar interval perception which suggests that the relatively poor CI interval perception is not interfering with interval perception when combined with the NH ear. Perhaps listeners simply ignore input from the CI in the Both ear condition and perform the task purely based on input to their NH ear. If so, this finding would be inconsistent with the listening preference study of Landsberger et al. (2020) in which a perceptual integration of the two ears was observed. It is worth noting that for many subjects, performance was extremely high in both the NH and Both ear conditions suggesting that there may be a ceiling effect preventing the detection of any differences in interval perception with the NH and Both ear conditions.
While no main effect of NH versus Both ear conditions was detected, an interaction between voice gender and listening condition was detected for both contour correlation and interval correlation analyses. For each of these analyses, performance with the male voice was better than the female voice when listening with Both ears, whereas performance with the female voice was better than the male voice when listening with the NH ear alone. These analyses suggest that listening to the male voice with both ears provides a synergistic interval perception while listening to the female voice degrades interval perception. As the male voice provides better temporal information to a CI user, these results are consistent with the hypothesis that the both-ear benefit is dependent on consistent temporal cues across ears. This conclusion is potentially consistent with the findings of Landsberger et al. (2020) in that the stimuli were broadband complex musical pieces (Johnny Cash's “Ring of Fire” and George Gershwin's “Rhapsody in Blue”) which would have provided considerable low-frequency temporally encoded information. While multiple analyses have shown improved performance with the male voice using a CI, it is worth noting that all of the analyses were conducted on the same data set on the same individuals and therefore cannot be considered multiple independent validations of this finding.
Device-Specific Factors Which may Influence Interval Representation
A limitation of the current study is that it does not consider that different implant systems will represent intervals differently in the cochlea. The electrode design (length, contact spacing and location, distance from modiolar wall), frequency allocation (the frequencies assigned to each electrode contact), and signal processing strategy are all likely to have influence on interval representation. As the majority of the data (7 out of 10 subjects) is collected with users of Cochlear perimodiolar electrode arrays, the data is insufficient to detect any perceptual differences resulting from the different interval representations. The remaining three subjects do not suggest a trend for any difference between systems. Two of these subjects use Advanced Bionics HiFocus MS electrode arrays. One (SSD-C1) provides a strong correlation in the CI-only interval correlation analysis whereas for the other (SSD-C2) no significant CI-only interval correlation was detected (Figure 5). The remaining subject was a MED-EL user (SSD-M2) who had a moderate CI-only interval correlation (Figure 5). Nevertheless, we consider the potential impacts of device-specific factors on interval representation.
From a place-coding perspective, the distance along the basilar membrane where the fundamental frequency of each note in the interval is represented is determined by a combination of the angular location of each electrode contact and the corresponding frequencies provided by each electrode. The average distortions along the spiral ganglion from an electrode array from each of the three manufacturers are represented in Figure 6 of Spitzer et al. (2021). On average for the Cochlear Contour Advance and MED-EL Flex 28, the lowest 16 semitones represented by the frequency allocation are represented by only 8 semitones along the spiral ganglion, providing a highly compressed interval representation. Intervals at higher frequencies are represented approximately correctly along the spiral ganglion for these electrode arrays. However, it is worth noting that while each of these devices provide similar place compression for the first 16 semitones of representation, the default center frequency for the lowest channel in the MED-EL system (149 Hz) is considerably lower than the default center frequency for the Cochlear system (250 Hz). Spitzer et al. (2021) suggests that the place interval distortions are smaller for the Advanced Bionics HiFocus 1J, which is a lateral wall array. It remains unknown how different the representations would be for the HiFocus MS array implanted in the Advanced Bionics users in this study as the HiFocus MS array is not a lateral wall design.
An additional potential factor is modiolar distance from the electrode array. It has been suggested that contacts positioned closer to the modiolus provide a narrower spread-of-excitation (Hughes & Stille, 2010). If so, the more precise stimulation resulting from a narrower spread-of-excitation may provide improved pitch salience. Indeed Landsberger et al. (2012) and Padilla and Landsberger (2016) demonstrate that a reduction in spread-of-excitation makes the corresponding percept more “clean” or “pure.” Increased pitch saliency of the two notes in an interval may improve the perception of the interval. However, no data has been published relating pitch salience to interval perception with a CI.
Pitch, and therefore intervals, may also be represented by temporal information. All devices represent temporal information via amplitude modulations on each electrode (or pairs of electrodes for virtual channel strategies such as Fidelity 120 and Optima; Firszt et al., 2009). The modulations provided by each electrode correspond to the modulations in the temporal envelope of the frequency range represented by that electrode. In addition to envelope modulations, the fine structure strategies by MED-EL (FSP, FS4, FS4-p; Riss et al., 2014) also adjust the stimulation rate on up to four of the most-apical electrodes to encode temporal information. The timing of the pulses for these electrodes correspond to zero crossings of the fine structure of the acoustic signal after band-pass filtering for the corresponding electrode. Advanced Bionics HiRes strategies (HiRes, Fidelity 120, Optima) use half-wave rectification to gate the signal at the corresponding frequency for rates up to the Nyquist frequency. A detailed description of temporal coding with each of these strategies are presented in Stupak et al. (2021) and its corresponding supplemental appendix.
Importance of Within-Subject Control Measures
Considerable variability was observed across subjects using their NH ear alone. Interval correlations between chosen intervals with the NH ear and target intervals ranged from perfect (r = 1; C1, N2, N10) to small and nonsignificant (r = 0.1, N4). It is assumed that acoustic intervals are properly perceived by an audiologically normal ear. If so, then the variability in the task is likely dependent on the difficulty of the task, familiarity with the melody Happy Birthday, musical listening skill, and attention level. Therefore, if performance on the task is poor with the NH ear, poor interval perception observed with the CI ear alone cannot be attributed to the degraded signal of listening through a cochlear implant. For example, as N4 demonstrated no significant correlation between target and chosen intervals for both the NH ear alone and CI ear alone, it cannot be concluded that the CI is not providing intervals to the subject. However, without the within-subject NH control data one would be inclined to attribute N4's poor performance on the signal provided by the CI. It is worth noting that although the r value for every subject was lower for the CI-only ear than the NH-only ear, three subjects (N1, C1, and N2) had stronger correlations between their CI and target intervals than three other subjects (N4, C2, and N7) had between their NH and target intervals. It is therefore clear that it is extremely difficult to evaluate a CI user’s ability to perceive intervals or “in-tune” melodies without a NH metric. For example, Luo et al. (2014) found that the CI users rate melodies as more out-of-tune than NH listeners. While based on our and other published results we expect the finding to be correct, the results depend on a CI user's ability to remember correct tuning and correct interval perception which is uncontrolled and certainly going to be highly variable. However, as perception with a CI may be different for SSD patients than CI users without usable acoustic hearing, the generalizability of the data to the broader CI population is unknown.
The use of within-subject controls makes it possible to control for a variety of skills and experience. For example, one might expect that musical training would improve performance on the experimental task, but such experience would likely similarly affect performance with the acoustic and electric ears. This is also the case for across-subject differences in the memory of intervals or the effects of duration of deafness on that memory. While across-subject differences in individuals’ memory of specific intervals are likely, these would not affect within-subject comparisons. Consistent with this, those with the most musical experience were among the best performers both with the NH and with the CI ears (see Table 1 and Figures 4 and 5). Similarly, the presence of an acoustically-preserved ear would be expected to limit the degradation of memory of intervals, but even if such memories are also degraded in individuals with SSD, the within-subject comparisons would allow detection of this phenomenon.
Conclusions
As strong correlations between chosen intervals with a CI and target intervals are observed for some individuals, it can be concluded that CIs are capable of providing musical intervals. Consistent with previous interval measures in nonmusical contexts (e.g., Spitzer et al., 2021), some listeners demonstrated a perceptual compression of intervals with their CI. However, this compression was not consistently observed across listeners suggesting that a musical context may aid with interval pitch perception. Chosen intervals with the NH ear was highly variable across subjects ranging from perfect to small and nonsignificantly correlated with target intervals. Presumably, listeners who perform poorly with their NH ear hear the pitch correctly and the issues with performance on the task are related to nonauditory factors, such as attention, understanding of the task, and memory of the melody Happy Birthday. The NH data is important as a within-subject control as, if only CI data were collected, it would be assumed that poor performance with the CI was caused by limitations with the auditory input with a CI and impaired ear. This was not always the case. Additionally, listening with a CI and NH ear did not seem to affect interval perception relative to the NH ear alone.
Footnotes
Acknowledgments
We thank our participants for their time and effort. We are grateful to Dr. Debi Vickers and Dr. Andrew Oxenham for their patience and support during the preparation of this manuscript.
Declaration of Conflicting Interests
The author(s) declared no potential conflicts of interest with respect to the research, authorship, and/or publication of this article.
Funding
The author(s) disclosed receipt of the following financial support for the research, authorship, and/or publication of this article: This work was supported by a MedED-EL Hearing Solutions Grant (Landsberger) and the University of Illinois Campus Research Board (Aronoff).