
Abstract
Cochlear implantation in subjects with single-sided deafness (SSD) offers a unique opportunity to directly compare the percepts evoked by a cochlear implant (CI) with those evoked acoustically. Here, nine SSD-CI users performed a forced-choice task evaluating the similarity of speech processed by their CI with speech processed by several vocoders presented to their healthy ear. In each trial, subjects heard two intervals: their CI followed by a certain vocoder in Interval 1 and their CI followed by a different vocoder in Interval 2. The vocoders differed either (i) in carrier type—(sinusoidal [SINE], bandfiltered noise [NOISE], and pulse-spreading harmonic complex) or (ii) in frequency mismatch between the analysis and synthesis frequency ranges—(no mismatch, and two frequency-mismatched conditions of 2 and 4 equivalent rectangular bandwidths [ERBs]). Subjects had to state in which of the two intervals the CI and vocoder sounds were more similar. Despite a large intersubject variability, the PSHC vocoder was judged significantly more similar to the CI than SINE or NOISE vocoders. Furthermore, the No-mismatch and 2-ERB mismatch vocoders were judged significantly more similar to the CI than the 4-ERB mismatch vocoder. The mismatch data were also interpreted by comparing spiral ganglion characteristic frequencies with electrode contact positions determined from postoperative computed tomography scans. Only one subject demonstrated a pattern of preference consistent with adaptation to the CI sound processor frequency-to-electrode allocation table and two subjects showed possible partial adaptation. Those subjects with adaptation patterns presented overall small and consistent frequency mismatches across their electrode arrays.
Introduction
Cochlear implantation restores auditory sensations in deaf ears. Until recently, implantation was only indicated for bilateral severe to profound hearing loss (Gifford, 2013). In the last 10 years, interest has grown in the use of cochlear implants (CIs) in cases of single-sided deafness (SSD). Initially, the technique was mainly applied to mask chronic severe tinnitus (Van de Heyning et al., 2008). However, further work with implanted SSD subjects indicated that there may be auditory benefits for speech recognition in situations with spatially separated noise and for sound localization (Arndt et al., 2011; Firszt, Holden, Reeder, Waltzman, & Arndt, 2012; Mertens, Kleine Punte, De Bodt, Van de Heyning, 2015; Stelzig, Jacob, & Mueller, 2011; Távora-Vieira, Marino, Krishnaswamy, Kuthbutheen, & Rajan, 2013; Vermeire & Van de Heyning, 2009). Besides direct clinical benefits, the use of CI in SSD cases offers researchers and engineers a unique opportunity to better understand the shortcomings of current CI technology. It allows one to directly compare the percepts induced by electric and acoustic stimulation in the same subjects. Traditionally, CIs are simulated acoustically using channel vocoders, most often with a number of sinusoidal or noise-band carriers that emulate the electrical pulse trains delivered by the implanted electrodes (Başkent & Shannon, 2004; Dudley, 1939; Rosen, Faulkner, & Wilkinson, 1999). Recently, it has been reported that the sound quality of these vocoders differs from the sound of a CI, as evaluated in SSD-CI subjects (Dorman, Natale, Butts, Zeitler, & Carlson, 2017; Peters et al., 2018).
Developing realistic CI simulations is important for at least two reasons. First, it would allow researchers and engineers to pretest novel signal coding strategies in homogeneous normal-hearing subject groups (Dorman & Loizou, 1997) before evaluating them in real CI listeners who usually exhibit large intersubject variability (James et al., 2018; Lazard et al., 2012). Second, it could help us better understand the extent of the sound degradation experienced by CI users.
There is a large number of parameters that may affect the sound quality of real and simulated CIs. These include (a) the number of physical electrode contacts, simulated by the number of vocoder channels (Faulkner, Rosen, & Wilkinson, 2001; Loizou & Dorman, 1999); (b) the amount of frequency mismatch due to the limited insertion of the electrode array, simulated by the frequency mismatch between the analysis and synthesis frequency ranges (James et al., 2018; Landsberger, Svrakic, Roland, & Svirsky, 2015; Rosen et al., 1999; Souza & Rosen, 2009); (c) the variations in current spread, simulated by the width of the synthesis bands (Bingabr, Espinoza-Varas, & Loizou, 2008; Crew & Galvin, 2012; Mesnildrey & Macherey, 2015; Oxenham & Kreft, 2014); (d) the extent of neural degeneration, simulated by the presence of holes in the vocoder frequency spectrum (Shannon, Galvin, & Baskent, 2002); and (e) the electrical stimulus waveform, simulated by the acoustic carrier waveform (Grange, Culling, Harris, & Bergfeld, 2017; Mesnildrey, Hilkhuysen, & Macherey, 2016).
Here, we focused on two of these parameters and compared the similarity of the CI sound with several vocoders differing in the type of acoustic carrier and in the amount of frequency mismatch between the analysis and synthesis bands.
First, we used three different carriers including the usual sinusoidal and noise band carriers, as well as a recently introduced pulsatile carrier: the pulse spreading harmonic complex (PSHC; Hilkhuysen & Macherey, 2014). The aim of the PSHC carrier is to circumvent some of the limitations of sinusoidal and noise carriers for CI simulations, that is, that sinusoids cannot simulate the broad spread of excitation produced by a CI electrode and that noise contains intrinsic modulations that are absent in CIs. The main characteristics of the PSHC carrier are that (a) it is broadband and can therefore be shaped in the frequency domain to mimic different spreads of excitation as is also the case for random or pseudorandom noise carriers (e.g., Bingabr et al., 2008; Grange et al., 2017) and (b) that its pulse rate can be adjusted to minimize the amount of intrinsic modulations after auditory filtering. Hilkhuysen and Macherey (2014) showed that a PSHC with an “optimized” rate exhibits less intrinsic modulations than several other broadband signals, including pseudorandom noise. It was also hypothesized that a PSHC could induce a pattern of neural activity more similar to the electrical pulse trains delivered by a CI than sinusoidal or noise-band carriers (Mesnildrey et al., 2016). The first aim of this study was to test the hypothesis that a vocoder using PSHC carriers is qualitatively more similar to the implant sound than vocoders using sinusoidal or noise-band carriers.
Second, we varied the amount of frequency mismatch between the analysis and synthesis bands in order to emulate differences in electrode insertion depth (Li, Galvin, & Fu, 2009; Rosen et al., 1999). The place–frequency mismatch experienced by individual CI subjects can be estimated by analyzing computed tomography (CT) images of the electrode array in situ and comparing the electrode positions with the frequency-to-electrode allocation table used in the sound processor (Marx et al., 2014). Several studies reported that large across-ear mismatches in bilateral CI subjects were associated with poorer speech recognition scores, lower localization performance, and weaker spatial unmasking (Kan, Litovsky, & Goupell, 2015; Kan, Stoelb, Litovsky, & Goupell, 2013; Li & Fu, 2010; Long, Eddington, Colburn, & Rabinowitz, 2003; Van Besouw, Forrester, Crowe, & Rowan, 2013; Wess, Brungart, & Bernstein, 2017; Yoon, Li, & Fu, 2011; Yoon, Shin, & Fu, 2013). Ma, Morris, and Kitterick (2016) also reported that introducing a frequency mismatch in a simulated CI experiment yielded disrupted binaural integration. Nonetheless, there is evidence that CI users can adapt to a mismatched map with sufficient exposure (Fu & Shannon, 1999b). This adaptation to the frequency allocation table has been suggested in several CI studies on subjects with low-frequency residual acoustic hearing (Boëx et al., 2006; Fu & Galvin, 2003; Fu & Shannon, 1999a, 1999b; Li et al., 2009; McDermott, Sucher, & Simpson, 2009; Reiss, Gantz, & Turner, 2008; Reiss, Lowder, Karsten, Turner, & Gantz, 2011; Reiss, Perreau, & Turner, 2012; Reiss, Turner, Karsten, & Gantz, 2014; Rosen et al., 1999). With the expansion of CI use to SSD subjects, a more accurate assessment of this adaptation process is now possible through comparisons with the normal contralateral hearing of the subjects (Dorman et al., 2017; Tan, Martin, & Svirsky, 2017). As an illustration, Tan et al. (2017) concluded from their pitch matching experiment that adaptation may happen but in most cases only partially. The second aim of this study was to investigate whether a vocoder with a frequency mismatch similar to the CI frequency mismatch, due to limited electrode insertion, would sound more similar to the CI than a vocoder with no mismatch.
Methods
Subjects
Patient Demographics.
Note. ACE: Advanced Combination Encoder; CI = cochlear implant; PTA = Pure Tone Audiometry.
Age at cochlear implantation.
Their pure-tone thresholds at individual frequencies from 250 to 8000 Hz, visualized in Figure 1, were always better than 40 dB HL except for P1 who had a threshold of 60 dB HL at 8000 Hz.
Contralateral hearing thresholds (N = 9).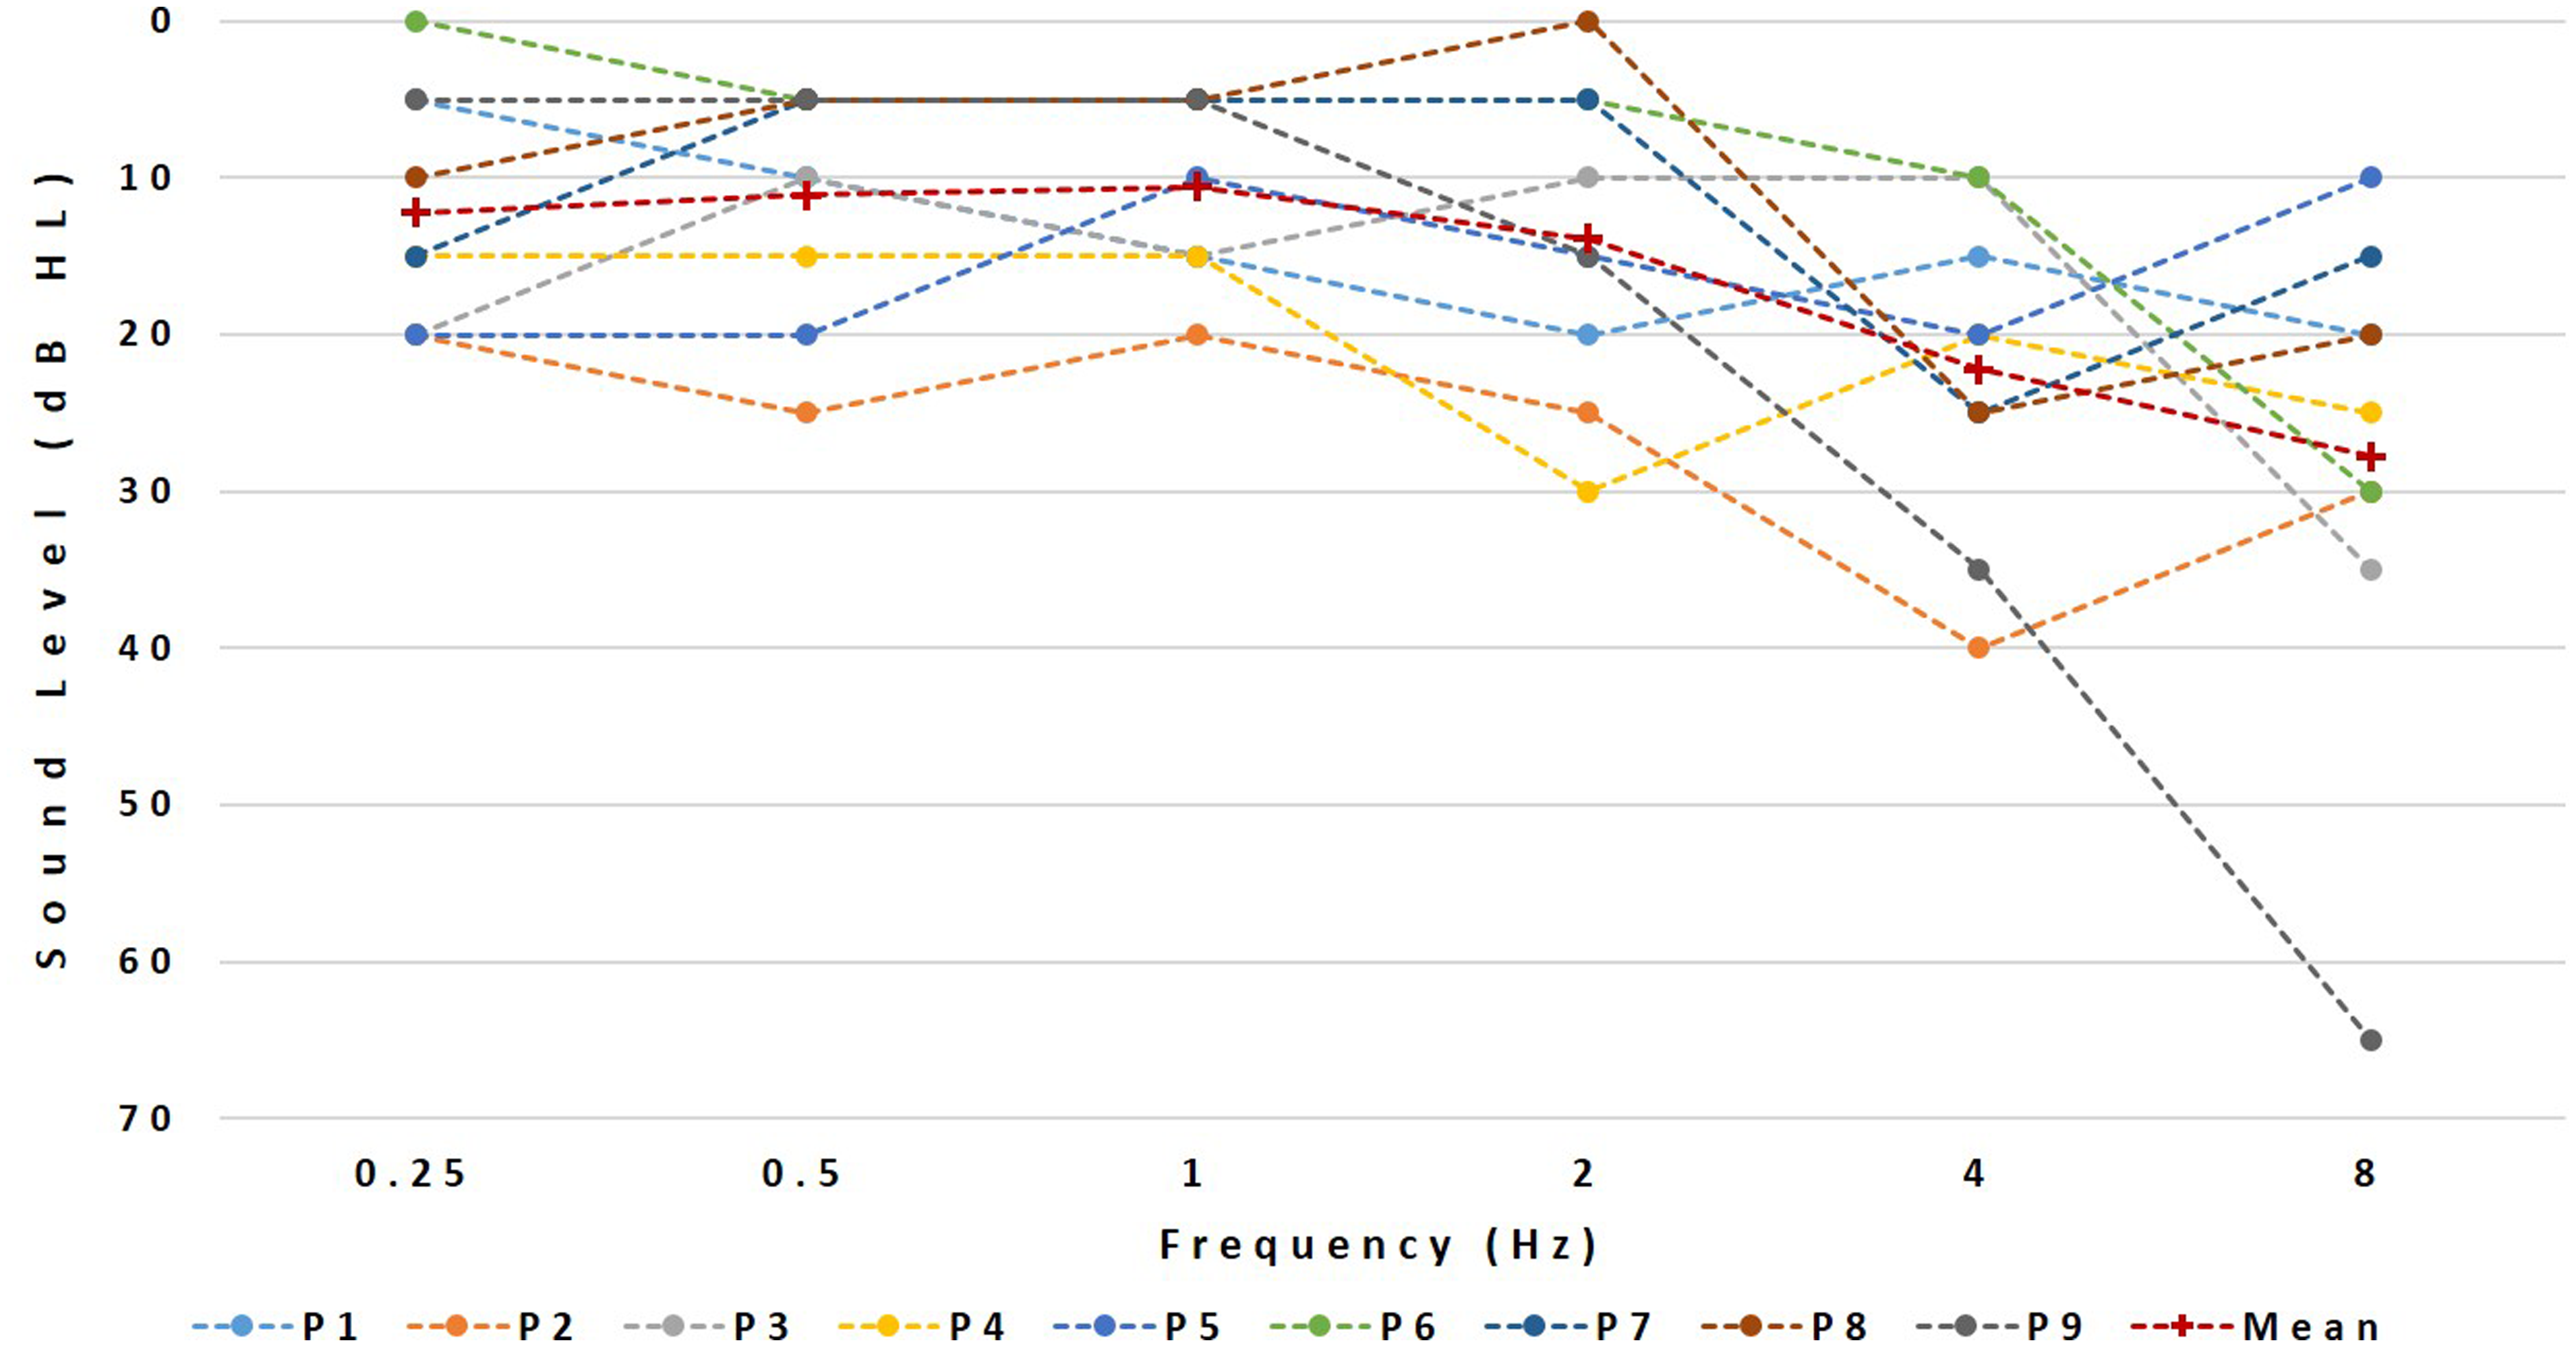
Experimental Set-Up
The CI sounds were presented via the auxiliary input of the subject’s speech processor using their standard program while all vocoded sounds were presented via a single Etymotic ER1 earphone. The audio files were played through a USB-connected sound card (Creative Sound Blaster X-FI HD, SBX PROSTUDIO, CREATIVE LABS Model No. SB124O) into a headphone amplifier (Samson S-amp, Samson Technologies). The latter had one output connected to the CI and another to the earphone. The experiment took place in a soundproof booth and lasted approximately 3 hr including regular breaks.
Software
The vocoded stimuli were generated using Matlab™ (The MathWorks, Inc., MA, USA). The different experimental tasks were then administered using the Apex2 experimental software platform (Laneau & Wouters, 2004).
Stimuli
The speech stimuli consisted of two 2.5-s French sentences: one, “Le berger rassemble son troupeau,” was extracted from the FIST corpus and spoken by a male speaker (Luts, Boon, Wable, & Wouters, 2008); the other “Ils ont marché sur l’herbe”, was recorded in an anechoic chamber as part of another project and was spoken by a female speaker.
Vocoder Processing
A six-channel vocoder was used to simulate the reduced spectral resolution associated with electrical stimulation, in line with expectations of the number of effective channels for an “average” CI user (Friesen, Shannon, Baskent, & Wang, 2001). The analysis stage consisted of a bank of six zero-phase bandpass filters (Butterworth, 36 dB/oct, as detailed in Mesnildrey & Macherey, 2015). The envelope of each band was extracted by half-wave rectification and low-pass filtering using second-order Butterworth filters. The cutoff frequency of the low-pass filter was different for the different bands, as explained later. Resynthesized signals were then produced by modulating a carrier signal with the corresponding envelope and further filtering each modulated carrier by their corresponding synthesis bandpass filter (zero-phase, sixth-order Butterworth as in the analysis stage). The synthesis filters had the same or different cutoff frequencies as the analysis filters, depending on the frequency mismatch condition. The three carrier waveforms were sinusoids (SINE), Gaussian noises (NOISE), and PSHCs. The PSHC carriers all had a fundamental frequency of 0.3 Hz. The PSHC pulse rate differed across bands and was a function of the center frequency of the corresponding synthesis bandpass filter following the equation in Figure 1 of Mesnildrey et al. (2016). This equation provides the pulse rate yielding a minimum of intrinsic modulations after auditory filtering, given the center frequency of the synthesis filter. Similar to Mesnildrey et al. (2016), the cutoff frequency of the envelope extraction stage was equal to half the PSHC pulse rate in cases where it was lower than 200 Hz but was otherwise limited to 200 Hz to mimic the poor salience of temporal pitch cues experienced by CI listeners at high rates (e.g., Kong & Carlyon, 2010; Townshend, Cotter, Van Compernolle, & White, 1987). The three mismatch conditions were as follows: (a) “0-equivalent rectangular bandwidth (ERB) mismatch”—same analysis and synthesis filters; (b) “2-ERB mismatch condition”—lowest cutoff of the synthesis bandpass filters mismatched upwards by half an octave resulting in a constant 1.8 ERB mismatch relative to the analysis bands, and (c) “4-ERB mismatch condition”—lowest cutoff of the synthesis bandpass filters mismatched up by one octave resulting in a constant 3.9 ERB-mismatch. The analysis range was always fixed between 250 and 4500 Hz. The synthesis ranges were [250–4500 Hz], [354–5525 Hz], and [500–6970 Hz] for the “0-ERB mismatch,” “2-ERB mismatch,” and “4-ERB mismatch” conditions, respectively. All sentences sent to the audio inputs of the CIs were first bandpass filtered between 250 and 4500 Hz (i.e., the frequency range of the analysis filterbank). An exception was made for the trials involving the 2-ERB and 4-ERB mismatch stimuli presented to subject P1. In this case, we restricted the frequency content of the vocoded stimuli to frequencies below 4500 Hz, because of the severe hearing loss at 8000 Hz. Consequently, we low-pass filtered the comparison CI stimuli so that the stimuli delivered to the two ears always had the same bandwidth expressed in ERBs.
In summary, nine different vocoded conditions were generated: carrier {SINE, NOISE, PSHC} × mismatch {0, 2, 4 ERB}.
Loudness Balancing
Prior to the main experiment, the sentences were loudness balanced across ears. The vocoded sounds were fixed at a comfortable level of 65 dB SPL, although this could slightly vary from subject to subject if this level was perceived as being too soft. The loudness of the implant sound was then adjusted via the S-amp potentiometer for each subject so that the acoustic and electric sounds were equally loud. This adjustment was repeated for the NOISE, SINE, and PSHC vocoders and for the two sentences, and the average matched level was selected for the main experiment.
Two-Alternative Forced-Choice Task
The main task consisted of eight testing blocks of 36 trials. In each trial, the subjects heard two intervals, separated by a 1-s gap. In the first interval, they heard a sentence processed via the CI followed 500 ms later by the same sentence processed by one of the nine vocoders. In the second interval, a different vocoder simulation followed the same CI-processed speech. When comparing differences in carrier, the amount of mismatch was fixed and, conversely, when comparing differences in mismatch, the carrier was fixed. In other words, the vocoder stimulus differed in the two intervals either by carrier (PSHC, SINE, or NOISE) or by the amount of frequency mismatch imposed between the analysis and synthesis bands (0-, 2-, or 4-ERB). There were 18 different trials per block, each repeated twice. Nine trials involved a change in carrier for a fixed mismatch (three different carriers compared between each other for three fixed mismatches) and nine trials involved a change in mismatch for a fixed carrier (three different mismatches compared between each other for three fixed carriers). The subjects were asked to indicate in which of the two intervals the two sounds were more similar. The same speech material was presented across trials within two consecutive testing blocks.
Similarity Ratings
To familiarize the subjects with the sound quality of the vocoders and to introduce a transition when the speech material changed, similarity ratings were collected at the beginning and throughout the whole session, that is, every time the speech material changed. Each subject performed four blocks of similarity ratings in total. These ratings also served to provide subjective feedback on the overall similarity between the various vocoders and the real CI sound. In each block of similarity ratings, the subjects had to rate on a 7-point Likert-type scale how similar the vocoder and the CI stimuli were: (1) being extremely close to (7) being completely different. The subjects were asked to focus on the sound quality. Each block contained 12 pairs of vocoder-CI sounds to judge in similarity. The first three were randomly chosen among the nine vocoders and were considered as training, hence not taken into account during the analysis. The ultimate nine estimations encompassed the nine different vocoders and were presented in random order. Every similarity-rating block used the same speech material as in the following two forced-choice testing blocks. Overall, each subject performed 288 forced-choice trials and provided 48 similarity ratings.
Note that the amount of testing time devoted to the forced-choice trials was much larger than that devoted to the similarity ratings. There are indeed at least two reasons why the forced-choice task is more appropriate than the similarity rating task to compare vocoders differing along specific dimensions. First, the sounds of a CI and of a vocoder inevitably differ across multiple dimensions. In a similarity rating task, subjects may weigh these dimensions differently across each other or even across trials. Consequently, the experimenter cannot control upon which dimension(s) the subjects base their judgments. In contrast, for a given trial of the forced-choice task, only one dimension is varied at a time and the subjects can only base their judgment on this specific dimension. Furthermore, similarity ratings may also be contaminated by nonsensory biases, which is not the case for the forced-choice task (Poulton, 1979).
Postoperative CT Scan Imaging
Postoperative imaging data consisted of high-resolution cone beam CT reconstructions as illustrated in Figure 2. For each subject, the positions of the implanted electrodes were determined as follows: The insertion depth angle of each contact was measured relative to the round window according to the tonotopic coordinate system introduced by Stakhovskaya, Sridhar, Bonham, and Leake (2007). The angle was then converted to a spiral ganglion characteristic frequency. The difference between the spiral ganglion characteristic frequency of the electrodes and the center frequency of the bandpass filters used in the sound processor was expressed in ERB. The ERB mismatches were computed for the apical, middle, and basal frequency regions based on the crossover frequencies of the vocoder bands 1–2, 3–4, and 5–6, respectively. A positive mismatch indicates a basalward mismatch: The position of the electrode contact is associated with a higher spiral ganglion characteristic frequency than the corresponding bandpass filter of the CI sound processor.
Illustration of the CT scan analysis.
The potential effect of frequency allocation tables and electrode positions on the mismatch preferences was further investigated by analyzing the CT scans. We arbitrarily defined the following levels of adaptation: Complete adaptation refers to subjects for whom the 0-ERB mismatch condition was preferred significantly over the 2- and 4-ERB conditions. Partial adaptation refers to subjects for whom vocoders with smaller mismatches than the actual physical mismatch (spiral ganglion characteristic frequency—frequency allocation table mismatch) were preferred.
Finally, we calculated the basalward mismatches between the frequency allocation table and the spiral ganglion characteristic frequency for three frequency regions of each subject: basal, medium, and apical. The mean mismatch across regions was calculated and its potential effect on the preference scores was investigated.
Results
Two-Alternative Forced Choice Task
Figure 3 illustrates the results of the two-alternative forced-choice task (2AFC) task obtained with all 9 SSD-CI users. The left and right Panels show the results for the carrier and mismatch comparisons, respectively.
Results of the forced-choice experiment. Error bars represent 95% confidence intervals. The y axis represents the Berkson-transformed scale (see text for details) and the corresponding percentage. The left and right panels show the results for the carrier and mismatch comparisons, respectively. The across-subject mean preferences are illustrated by the three error bars at the bottom of the panel representing the mean and 95% confidence intervals of the Berkson-transformed scores. For the carrier comparisons, the results of each subject are represented by three horizontal bars showing, from top to bottom, the percentage of trials with preference for: NOISE chosen over SINE (black), PSHC chosen over NOISE (red), and PSHC chosen over SINE (gray), respectively. The dotted lines illustrate 95% significance level as given by the binomial distribution. For the mismatch comparisons, the three error bars correspond, from top to bottom, to the percentage of trials for which subjects showed preference for 2-ERB over 4-ERB mismatch (blue), no mismatch (0-ERB) over 4-ERB mismatch (green), and no mismatch (0-ERB) over 4-ERB mismatch (brown), respectively.
For the carrier comparisons, the results of each subject are represented by three horizontal bars showing, from top to bottom, the percentage of trials with preference for: NOISE over SINE, PSHC over NOISE, and PSHC over SINE, respectively. The percentage scores were converted to Berkson by calculating P of the base-two logarithm of the odds, that is,
Similarity Ratings
While the forced-choice results provide some indications on the relative similarities of the different vocoders with the sound of a CI, they do not inform us on their overall level of similarity. Figure 4 shows the outcomes of the similarity ratings for all nine subjects and for all conditions. Focusing on the different carrier types, the mean ratings were 4.7, 5.1, and 5.8 for PSHC, NOISE, and SINE carriers, respectively.
Mean rating data of the similarity between the presented vocoder and the CI stimuli within and across subjects for the carrier type (a) and for the frequency mismatch (b) on a 7-point Likert-type scale (1: extremely close–7: completely different). Each symbol and associated color refers to one subject.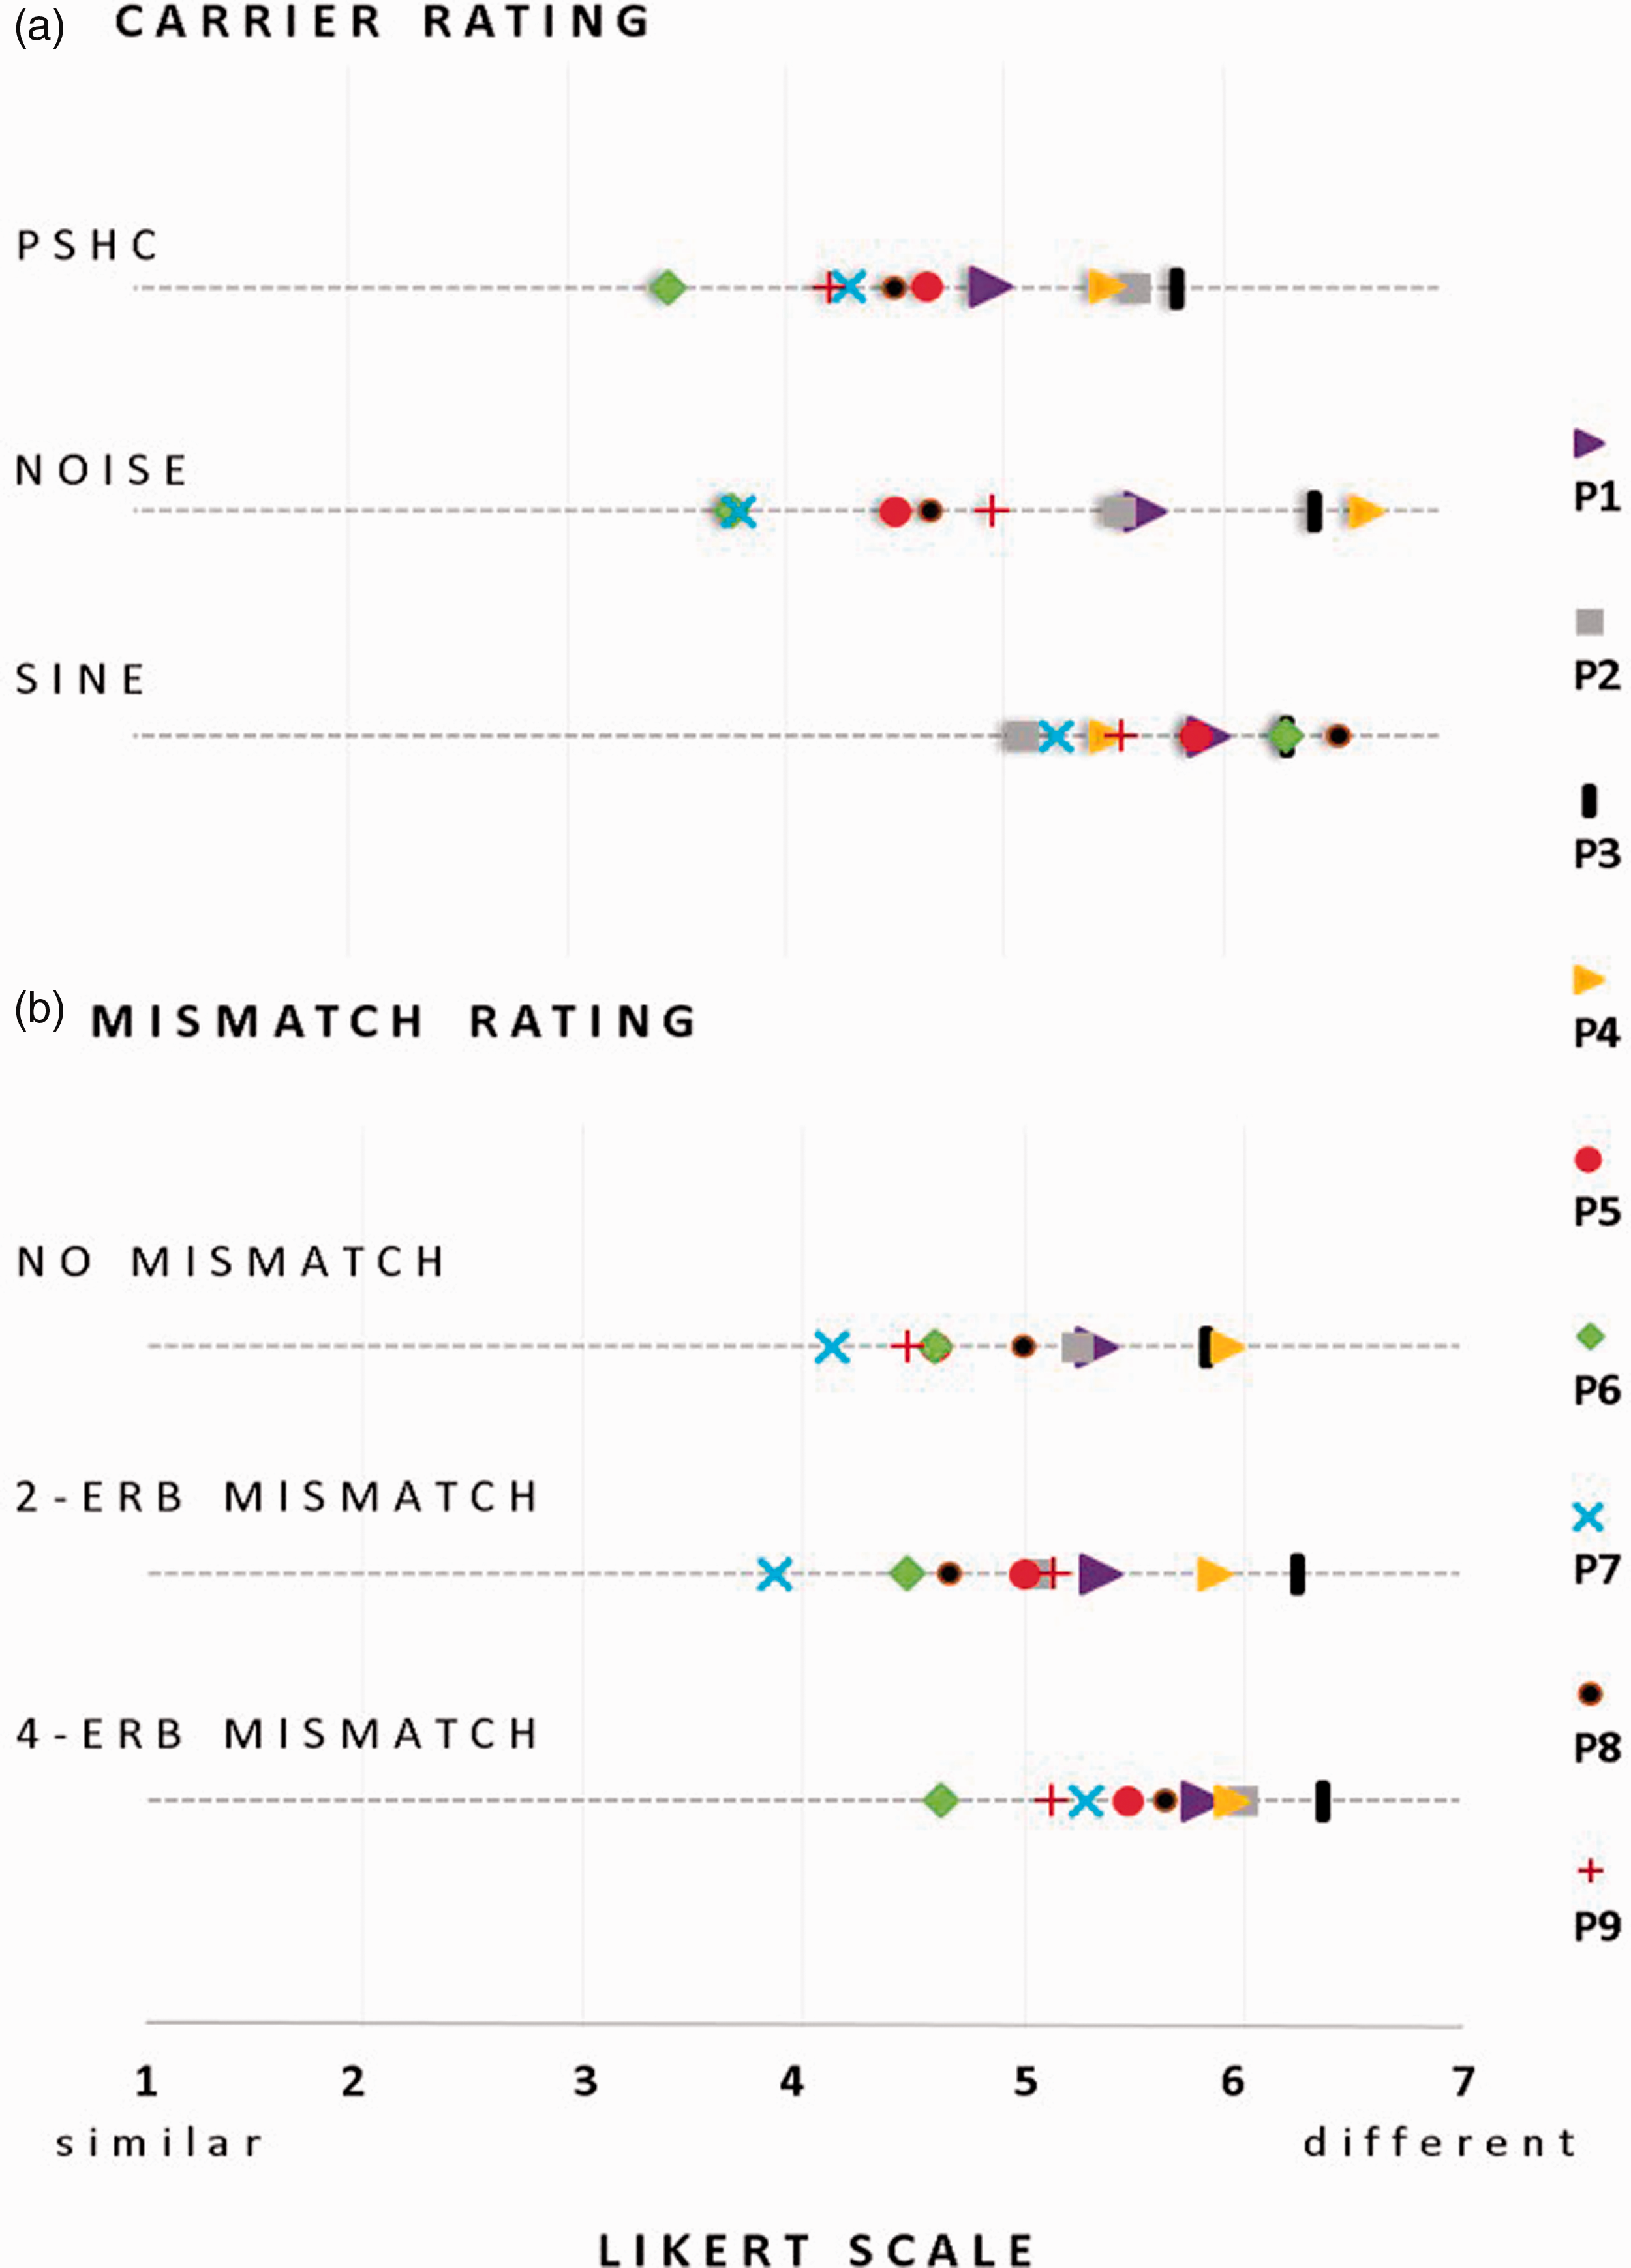
Friedman rank sum test indicates a significant difference in rating only between PSHC and SINE (χ2 = 4.5, p = .03). Comparing frequency mismatches, the mean ratings were 5.0 for the no-mismatch condition, 5.1 for the 2-ERB condition, and 5.6 for the 4-ERB condition. Friedman rank sum test revealed that there were significant differences in ratings between the no mismatch and the 4-ERB mismatch conditions (χ2 = 9, p = .002), and between the 2-ERB and 4-ERB mismatch (χ2 = 5.44, p = .019).
We further evaluated the consistency of the results obtained in the forced choice task and in the similarity ratings by performing several correlations. To normalize the similarity rating scores across subjects, a ranking step was first applied to the data. For each subject, the nine vocoder conditions presented in the similarity-rating task were ranked from the most to the least similar (1–9) so that the ranks’ sum equals 45 (i.e., ∑9
i
= 1 i). The mean rank for each carrier and for each subject was then calculated (i.e., each carrier being used in three out of the nine vocoder conditions). Following this, we calculated Spearman correlations between (a) the difference in rank between each pair of carriers obtained in the ranking task and (b) the preference level in the 2AFC task for the corresponding pair (e.g., difference in rank for the NOISE carrier over the SINE carrier correlated to the preference level for NOISE over SINE in the 2AFC task) as illustrated in Figure 5. Significant correlations were found for the PSHC-SINE comparison (ρ = 0.94; p < .001) as well as for the NOISE-SINE (ρ = 0.85; p = .006) and for the NOISE-PSHC (ρ = 0.71; p = .033) comparisons. This shows that for the carrier comparisons, the two procedures used here gave consistent results.
Illustration of the correlations between the preference level in the 2AFC task and the corresponding carriers’ mean ranking difference. Each symbol refers to one subject. Each color refers to a pair of carrier conditions.
The same correlation analysis was conducted for the mismatch conditions but did not show significant correlations, as illustrated in Figure 6. A possible explanation to this lack of correlation is that a change in carrier was more salient than a change in mismatch and that the subjects weighted the “mismatch” dimensions less than the “carrier” dimension in their similarity ratings.
Illustration of the correlations between the preference level in the 2AFC task and the corresponding mismatch conditions’ ranking difference. Each symbol refers to one subject. Each color refers to a pair of mismatch conditions.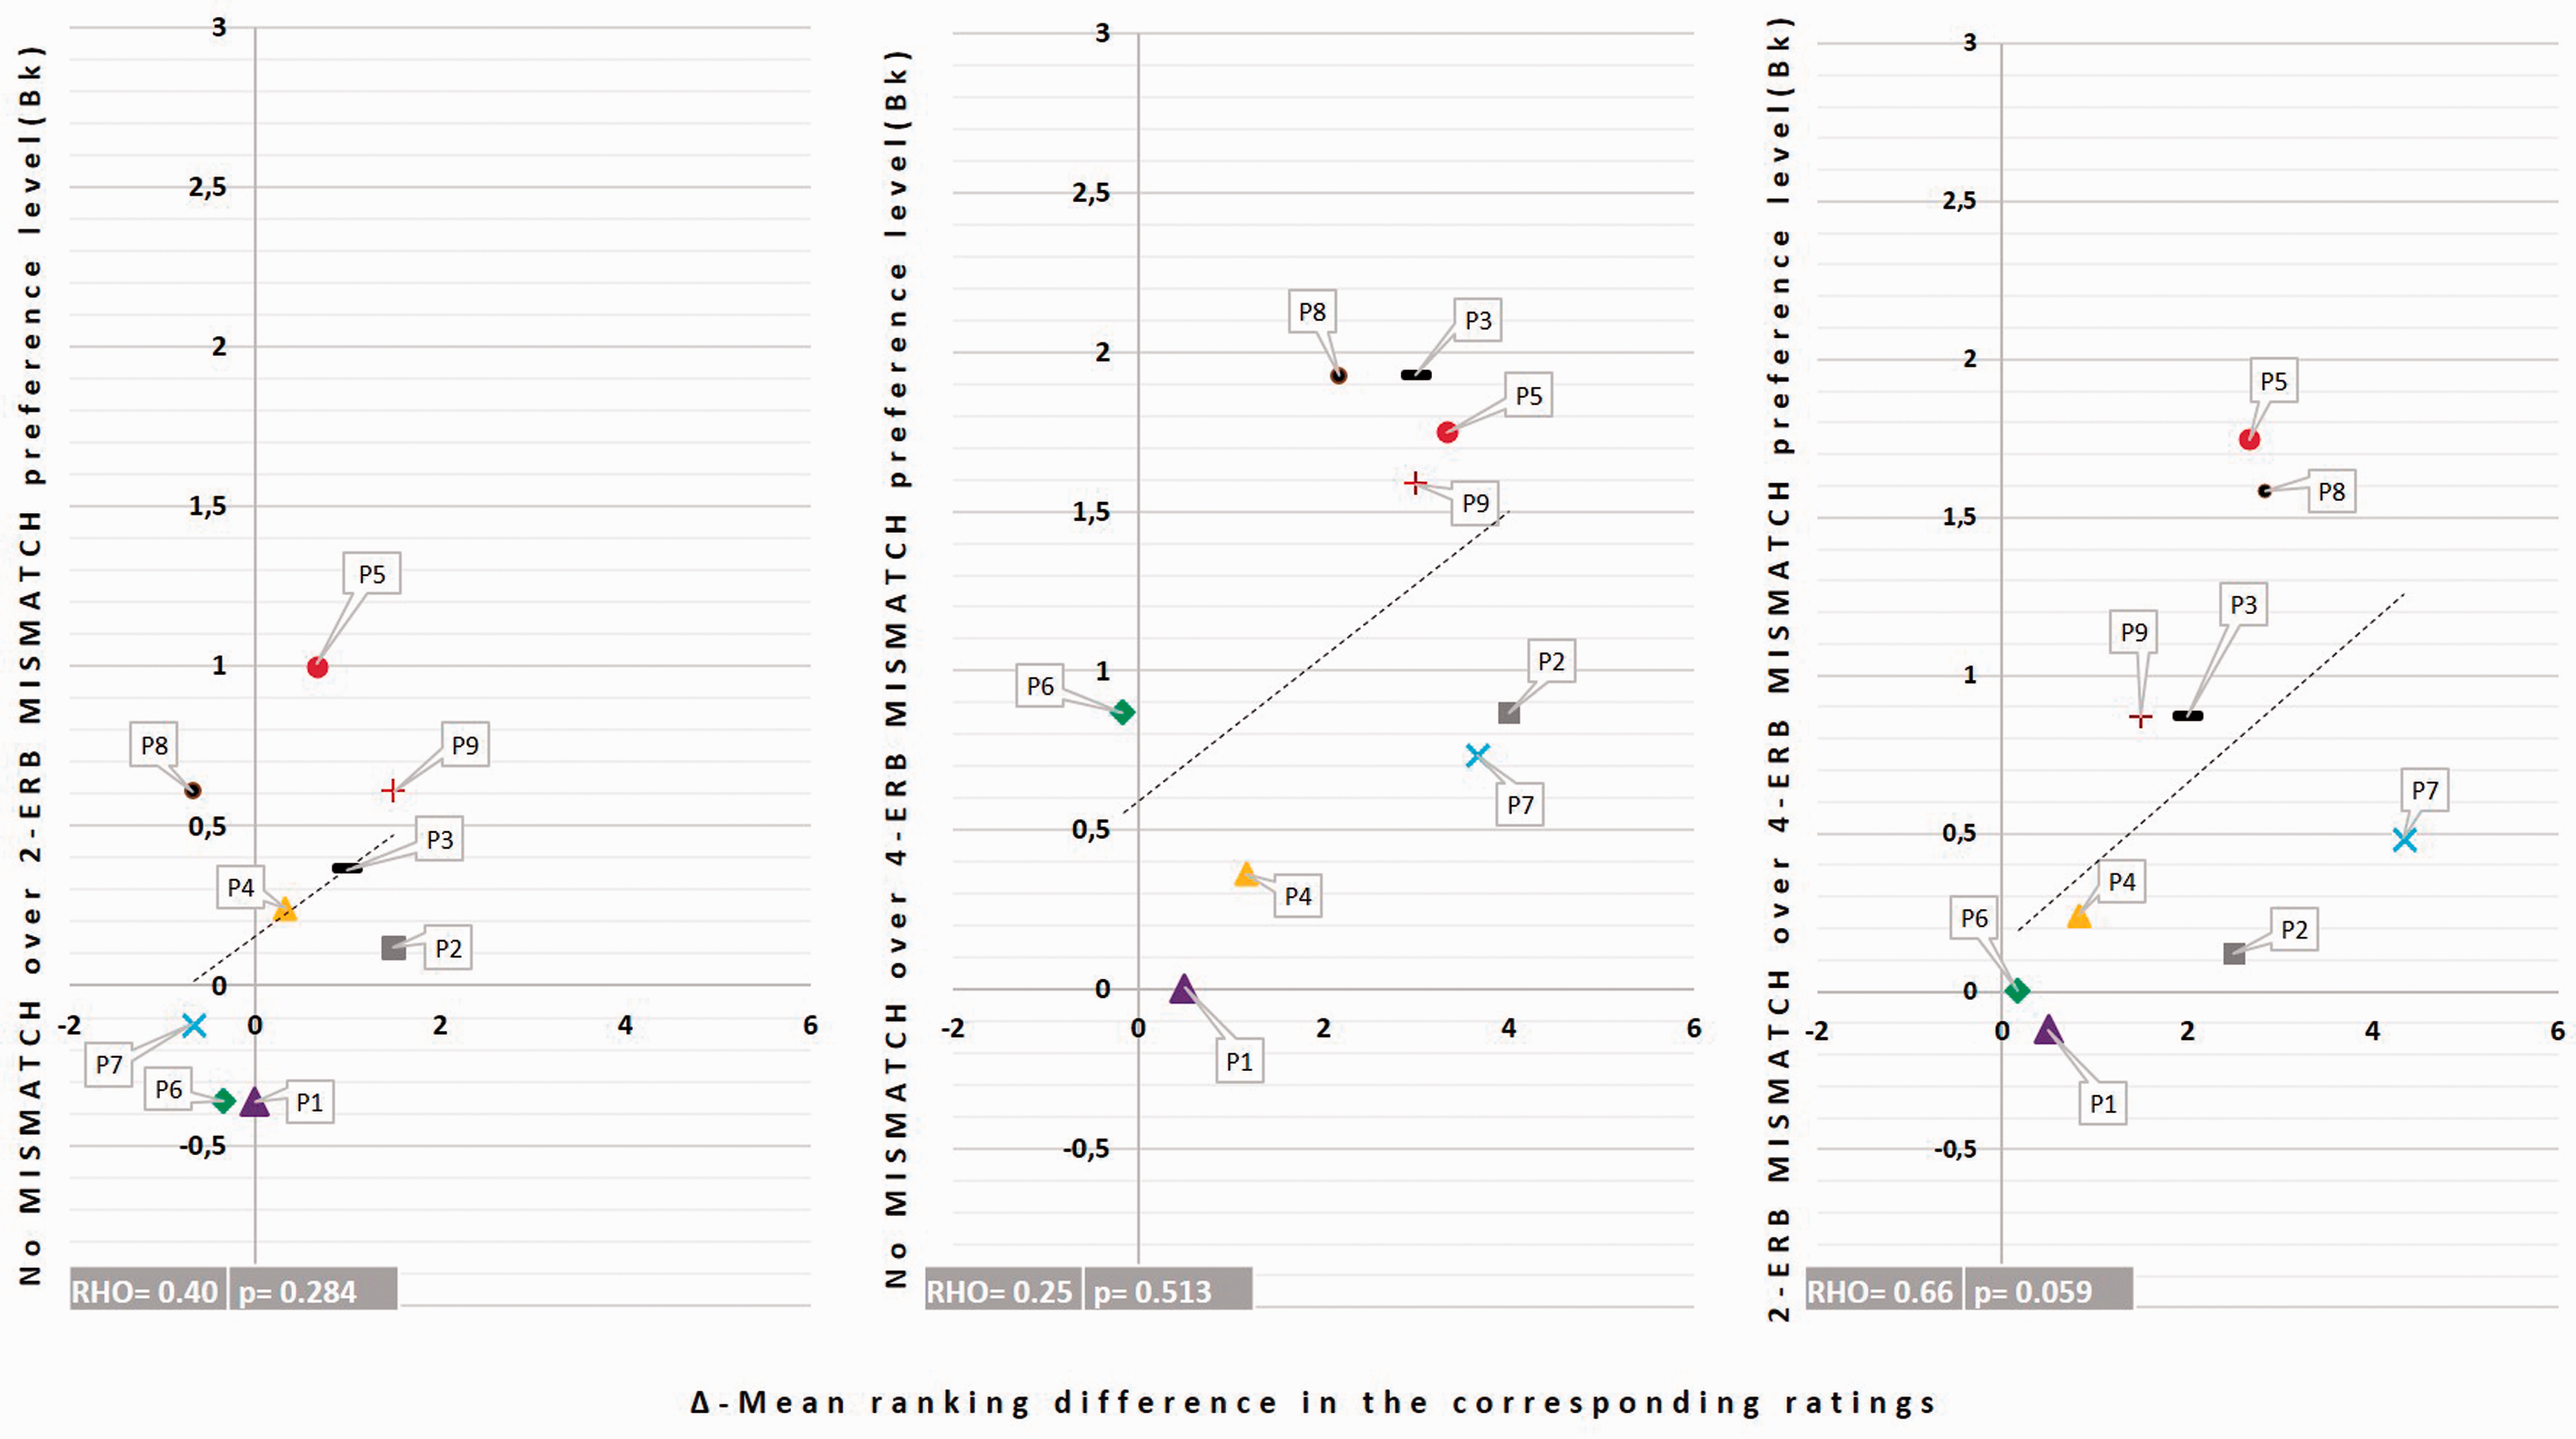
Adaptation to the Frequency Allocation Table
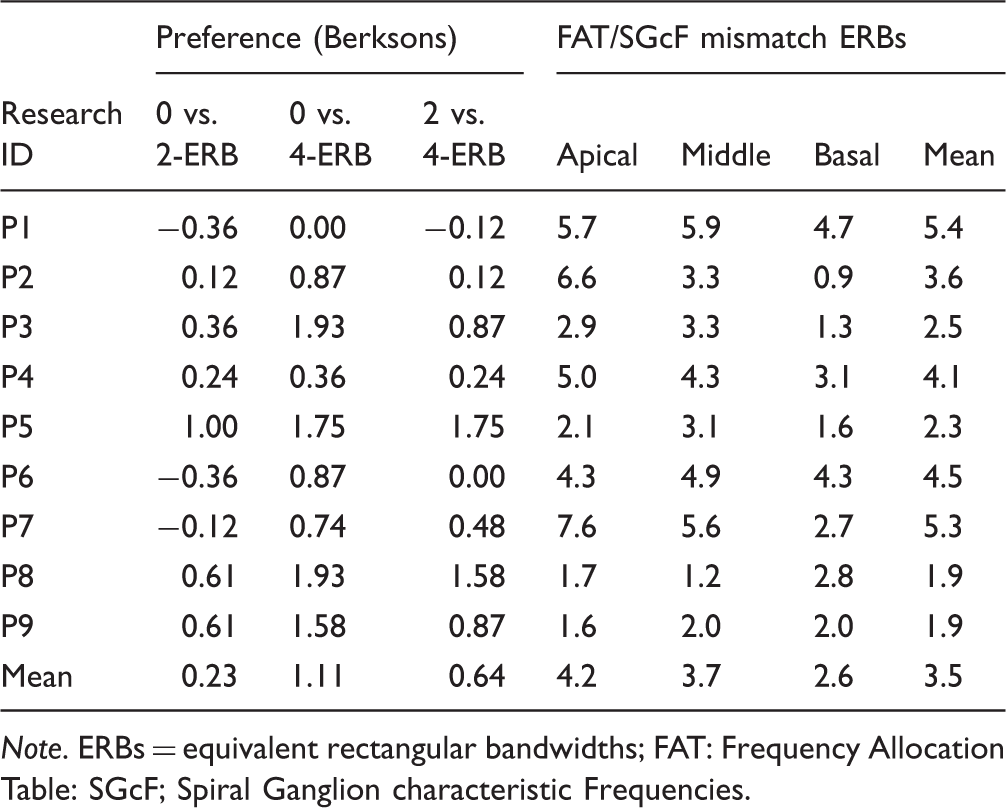
Data Summary of the Preference Level and the Frequency Allocation Table and the Spiral Ganglion Characteristic Frequency Mismatches (FAT/SGcF Mismatch).

Note. ERBs = equivalent rectangular bandwidths; FAT: Frequency Allocation Table: SGcF; Spiral Ganglion characteristic Frequencies.
The right columns in Table 2 give the basalward mismatches between the frequency allocation table and the spiral ganglion characteristic frequency for the three frequency regions and for each subject. P5, whose data exhibit a general pattern of full adaptation to the frequency allocation table, had a mean spiral ganglion characteristic frequency mismatch equal to 2.3 ERB which was consistent across the three frequency regions. Similarly, both P8 and P9, who showed patterns of partial adaptation, had a consistently small spiral ganglion characteristic frequency mismatch throughout the three frequency regions (mean = 1.9 ERB). In contrast, P3, who only showed a significant preference to the nomismatch over the 4-ERB mismatch condition in the forced-choice task, had a mean spiral ganglion characteristic frequency mismatch of 2.5 ERB and inconsistent spiral ganglion characteristic frequency mismatches across the three regions. Similarly, the subjects who did not show preference for any of the mismatch conditions had high mean spiral ganglion characteristic frequency mismatches (5.4 ERB, 4.1 ERB, and 4.5 ERB, respectively, for P1, P4, and P6) and inconsistent mismatches across the three regions (P2 and P7). For example, P7 had a mean spiral ganglion characteristic frequency mismatch of 5.3 ERB and a large variability across the three frequency regions (up to 7.6 ERB for the apical and 2.7 ERB for the basal regions).
In summary, only one of nine subjects demonstrated a pattern of preference indicating adaptation to the frequency allocation table. These data also suggest that differences in the amount of frequency mismatch across frequency regions for a given subject may be a confounding factor. In other terms, subjects with a mean mismatch consistent across frequency regions and smaller than 2.5 ERB were the only ones who showed significant preference for at least one mismatch condition.
Discussion
Carrier Comparison
The first aim of this study was to determine which carrier best mimics the sound of a CI. Forced-choice comparisons between SINE, NOISE, and PSHC revealed a general pattern of preference for PSHC, suggesting that, within the specific conditions tested here, the PSHC carrier type is closer in sound quality to electric hearing via a CI than conventional NOISE or SINE carriers. The correlations with the results of the similarity ranking task also suggest that the subjective similarity assessments of all three carriers were consistent with their objective preference levels measured in the 2AFC task.
Two studies recently conducted similar investigations in SSD subjects using different procedures (Dorman et al., 2017; Peters et al., 2018). Peters et al. (2018) presented speech and music stimuli in free field together with masking noise in the normal-hearing ear of their subjects so that they would first hear the stimuli only through their CI. In a second phase, they presented the same stimuli passed through different vocoders with the CI off and asked the subjects to select the vocoder that best matched the CI sounds heard in Phase 1. They reported that a NOISE carrier was often found more similar to the CI than a SINE carrier for five out of six different speech stimuli. Their individual data, however, revealed inconsistent results showing that six subjects chose the NOISE carrier as a closer match, whereas four subjects chose the SINE carrier. Although their procedure was substantially different than ours as it required short-term memory processing (i.e., remembering the sounds from the first phase), our results are broadly consistent in that we did not find a significant difference between NOISE and SINE either.
Despite an overall preference for PSHC, we note that the outcomes of the similarity ratings suggest that our simulations remain qualitatively different from the sound of a CI. Obtaining a better match would therefore require further research. Dorman et al. (2017) also reported poor similarity scores and large variability in CI simulations using SINE or NOISE carriers while varying the number of channels of their vocoders between 4 and 12 in a group of 8 SSD-CI subjects. For instance, median ratings for their six-channel vocoders were equal to 3.2 on a 0 to 10 scale (0 being the least similar and 10 the most similar) for their SINE vocoder and 1.7 for their NOISE vocoder. These authors also reported in a second experiment much higher rating scores (up to 10) in three SSD-CI patients when comparing the sound of CI to speech signals subjected to different types of spectral smearing. The SSD-CI subjects of Peters et al. (2018) also reported similarity scores for speech stimuli, with a mean of 6.3 on a 1 to 10 scale (with “1: not similar at all, 6: similarity was fairly good, 10: completely similar”). Although these ratings appear to be slightly better than ours, it is worth noting that the subjects in the aforementioned study were only asked to rate their best-matched stimuli.
Mismatch Comparison
The second aim of this study was to assess if our SSD-CI participants perceived speech through their CI as having a frequency mismatch. An analysis of the mismatch preferences revealed large intersubject variability, with only four subjects (P3, P5, P8, and P9) showing significant differences across mismatch conditions. For these cases, the low-mismatch condition(s) were preferred over the higher mismatch condition(s). In our subject group, only one subject (P5) appeared to have fully adapted to the CI sound processor frequency allocation. Two other subjects showed a pattern of partial adaptation. Lack of pitch adaptation and variability between subjects has been reported in several studies, using pitch matching tasks (Dorman et al., 2017; Reiss et al., 2011, 2014; Tan et al., 2017). Other studies also showed that some subjects may only partially accommodate to spectrally mismatched inputs (Fu & Shannon, 1999a; 1999b; Fu et al., 2005; Rosen et al., 1999) and that the pitch percept may be more influenced by the frequency allocation table than by the real spiral ganglion characteristic frequency allocation (Reiss et al., 2008). To our knowledge, none of these studies used full sentences as stimuli.
A striking observation in the mismatch preference choice was that the subjects who showed partial or full adaptation to the frequency allocation table had relatively small mean mismatches between the frequency allocation table and the spiral ganglion characteristic frequency. The analysis of the insertion angles of their CT scans indicates insertion angles up to 470° for P5 who adapted fully and 475° and 575° for P9 and P8, respectively, who both adapted partially to the frequency allocation table. The remaining five subjects all had insertion angles <400°. A first possible explanation may be the presence of a ceiling effect in cortical plasticity which would prevent adaptation to the new peripheral tonotopy imposed by the CI frequency allocation table. In other words, when the mismatch is too large, plastic central readjustments may not be effective enough to provide adaptation. Here, it might be that the mismatch between the frequency allocation table and the spiral ganglion characteristic frequency is too large (up to 7.6 ERB in apical region for P7) for plasticity to occur, and hence for adaptation to occur, as suggested by Reiss et al. (2014). A second possible explanation is that adaptation will take a longer time to occur in these subjects. Reiss et al. (2007) reported that for some subjects, pitch matching changes were observed up to 5 years after cochlear implantation. A third possibility is that the lack of preference also arises from a kind of adaptation—such that this dimension of the difference is ignored or “accommodated.” Finally, it is worth mentioning that P5 had a significant preference for the least mismatched conditions in all comparisons, implying full adaptation to the frequency allocation table. This subject has a unique profile: P5 is a highly educated subject working in a field related to acoustics. Her experience may have helped in this adaptation. This might also explain her results in carrier choice since P5 was the only subject with no significant carrier preference. P5 informed the experimenter at the end of the test that she was more focused on the frequency difference and did not really pay attention to the timbre of the sounds.
Study Limitations
Here, we discuss several limitations of our study, including the choice of vocoder parameters, the use of real speech as a stimulus, and the inherent difficulties in developing realistic acoustic simulations.
All our vocoders had six channels, whereas for the CIs, they were compared with Cochlear or Med-EL that contains between 12 and 22 electrodes. Instead of using a fixed number of channels as we did here, an alternative option would have been to measure the pitch produced by each electrode of each subject and use carriers centered on these pitch values, with as many carriers as the number of electrodes.
This approach is, however, complicated to implement because (a) it is time consuming to measure the pitches evoked by each electrode and also because the results are often contaminated by nonsensory biases (Carlyon et al., 2010) and (b) we currently do not have a good measure or model of the spatial spread of excitation produced by a given electrode to infer the bandwidth of each carrier of the vocoder. The approach used here, therefore, aims to be more general and assumes that the number of independent channels of information that CI subjects can perceive is close to six and that a vocoder with six channels should consequently simulate what a CI subject would receive if several neighboring electrodes were exciting the same population of nerve fibers. It is worth noting that Dorman et al. (2017) collected similarity ratings between the sound of a CI and different NOISE and SINE vocoders having 4, 6, 8, 10, and 12 channels and did not find a significant influence of the number of channels on their ratings, which ranged from about 1.9 to 3.2.
Other parameters of our vocoders differ from the processing performed by real CIs, such as the envelope extraction stage or the signal processing strategy. We have used envelope cutoff frequencies of 200 Hz or less to avoid conveying high-rate pitch cues which are known to be weak in CI listeners. Nevertheless, Souza and Rosen (2009) showed that different envelope cutoffs can lead to different effects of carrier type (SINE vs. NOISE), especially on speech intelligibility; so it is at present unclear what effect this parameter would have had in our study. Most of our subjects used the ACE processing strategy from Cochlear except P8 who wears a Med-EL device and uses FS4 signal processing strategy (cf. Table 1). These strategies differ from the processing performed by the vocoder and may therefore influence the percept. However, the number of subjects tested here is too small to investigate such device differences.
Another caveat of our study is that we have only used speech stimuli, which remained intelligible in all conditions. We used the same two sentences throughout the experiment so that the subjects could focus on the sound quality and not on the meaning. Nevertheless, speech stimuli are very specific, and a possible follow-up could be to conduct the same forced-choice task with stimuli that have the same kind of spectrotemporal variations as speech but remain unintelligible such as time-reversed or spectrally rotated speech.
Finally, it is still unclear whether obtaining a “perfect” acoustic simulation of the sound of a CI is at all possible. At the peripheral level, the patterns of neural degeneration may be very subject specific and nonuniform along the cochlea (Kim, Steele, & Puria, 2014; Long et al., 2014). Even if there was a method to precisely identify these neural degeneration patterns, they would likely be very difficult to reproduce acoustically. In addition, there are some known physiological differences between acoustic and electric neural stimulation that may be impossible to achieve, such as the higher firing synchrony observed electrically (Javel, 1990). There is also evidence that extensive central adaptations are triggered after cochlear implantation whether on auditory-sensitive areas or outside these areas (Rouger et al., 2011; Strelnikov et al., 2010). Efficient speech performance by enhancing phonological processing seems to be the primary “objective” of the deaf brain in response to the new CI input (Giraud, Price, Graham, & Frackowiak, 2001; Giraud & Truy, 2002). Adaptation to the perceived CI input involving these higher level processes may take some time to stabilize and it may be difficult to capture them within the course of an experiment.
Footnotes
Acknowledgments
The authors would like to thank the subjects for their involvement and their feedback and Gaston Hilkhuysen for feedback on the manuscript.
Authors’ Note
Portions of this work were previously presented at the Conference Implantable Auditory Prostheses, Lake Tahoe, CA: July 16-21 2017.
Declaration of Conflicting Interests
The authors declared the following potential conflicts of interest with respect to the research, authorship, and/or publication of this article: C. J. is an employee of Cochlear France. C. K. received partial doctoral funding from Cochlear France as part of the program “Conventions industrielles de formation par la recherché.” For the remaining authors no conflicts of interests were declared. The views expressed herein are not necessarily those of the Cochlear Company.
Funding
The authors disclosed receipt of the following financial support for the research, authorship, and/or publication of this article: This study is part of the PRME multi-center French study that received ethical approval by the South-West and Overseas territories’ Ethics Committee on May 2014 under the reference CPP14-03/2014-A00533-44 and that is financed by the French Ministry of Health (PRME2013 number 13 7053 10, bureau innovation et recherche Clinique, ![]() ). This study was supported by the recurrent funding from the CNRS and Agir pour l’Audition (#APA-RD2015-6B). None of the sponsors had a role in study design, data collection, analysis or the interpretation of data.
). This study was supported by the recurrent funding from the CNRS and Agir pour l’Audition (#APA-RD2015-6B). None of the sponsors had a role in study design, data collection, analysis or the interpretation of data.