
Abstract
In the intricate acoustic landscapes where speech intelligibility is challenged by noise and reverberation, multichannel speech enhancement emerges as a promising solution for individuals with hearing loss. Such algorithms are commonly evaluated at the utterance scale. However, this approach overlooks the granular acoustic nuances revealed by phoneme-specific analysis, potentially obscuring key insights into their performance. This paper presents an in-depth phoneme-scale evaluation of three state-of-the-art multichannel speech enhancement algorithms. These algorithms—filter-and-sum network, minimum variance distortionless response, and Tango—are here extensively evaluated across different noise conditions and spatial setups, employing realistic acoustic simulations with measured room impulse responses, and leveraging diversity offered by multiple microphones in a binaural hearing setup. The study emphasizes the fine-grained phoneme-scale analysis, revealing that while some phonemes like plosives are heavily impacted by environmental acoustics and challenging to deal with by the algorithms, others like nasals and sibilants see substantial improvements after enhancement. These investigations demonstrate important improvements in phoneme clarity in noisy conditions, with insights that could drive the development of more personalized and phoneme-aware hearing aid technologies. Additionally, while this study provides extensive data on the physical metrics of processed speech, these physical metrics do not necessarily imitate human perceptions of speech, and the impact of the findings presented would have to be investigated through listening tests.
Keywords
Introduction
Speech within a noisy environment is a complicated scenario that can substantially diminish the clarity of spoken words. Background noise can obscure important acoustic cues, challenging listeners in differentiating individual speech sounds and words. Speech enhancement is a solution to enhance speech intelligibility in noisy environments (Loizou, 2007). This technique estimates the speech signal from the noisy mixture, by relying on acoustic cues and temporal patterns inherent to the speech. Speech enhancement algorithms are broadly categorized into two types: single channel and multichannel, depending on the number of available microphones to record the sound.
In scenarios where audio is captured through a single microphone, speech enhancement algorithms concentrate on temporal, frequency, and spectro-temporal characteristics to filter out the noise (Loizou, 2007). Such single-channel speech enhancement is limited to the information captured by one reference point and often focuses on aspects like noise variance over time or spectral consistency.
Conversely, multichannel speech enhancement algorithms harness the power of spatial diversity by exploiting the various captures of speech across microphones (Benesty et al., 2008). This multifold capture allows for considering the spatial characteristics and the directionality of sound. By comparing the different signal channels obtained at the microphones, these algorithms offer a more robust reconstruction of the original speech, effectively mitigating the masking effects of background noise.
As a subset of multichannel speech enhancement algorithms, beamformers manipulate spatial sound attributes using microphone arrays (Benesty et al., 2008). Unlike broader multichannel algorithms that filter or cancel noise, beamformers enhance speech intelligibility by precisely manipulating the spatial attributes of the acoustic signal, such as sound's directionality. They amplify speech from a specific direction while reducing noise and reverberation from others. This targeted approach is particularly effective in noisy environments, where it isolates the speaker's voice from disruptive background sounds, enhancing speech clarity and intelligibility.
Current state-of-the-art multichannel speech enhancement systems are characterized by advanced beamforming algorithms and the integration of neural networks to improve the intelligibility of speech in noise. The minimum variance distortionless response (MVDR) beamformer optimizes noise reduction while preserving the desired speech directionality (Capon, 1969; Heymann et al., 2016). In hybrid algorithms, neural networks provide parameters for signal processing filters. These include the distributed multichannel Wiener filter (MWF) (Bertrand & Moonen, 2010; Furnon et al., 2021) and its adaptations like the generalized eigenvalue decomposition MWF (GEVD-MWF) (Serizel et al., 2014). Alternatively, some algorithms relying entirely on neural networks have been proposed, such as the filter-and-sum network (FaSNet) beamformer (Luo et al., 2019). This model uses neural networks to directly predict signals rather than the parameters of a spatial filter, which allows for enhanced flexibility in optimization. These developments reflect a shift towards sophisticated, binaural processing setups where hearing aids on both sides collaborate, leveraging spatial information to differentiate speech from noise effectively (Kollmeier & Koch, 1994; Van den Bogaert et al., 2009).
Usually, speech enhancement algorithms are evaluated at the utterance scale using objective signal-to-noise ratio (SNR)-like metrics, which offers a convenient way to quantify their performance at a coarse level and compare algorithms. However, this evaluation process does not capture the nuanced ways different phonemes interact with noise, nor the way algorithms process these phonemes, which potentially simplify their true effectiveness. Studies contrasting English phoneme recognition in noise for native and nonnative speakers reveal this complexity (Adachi et al., 2006). For instance, Miller and Nicely (1955) indicate that consonants vary in noise tolerance, suggesting that some phonemes are more susceptible to noise masking than others. This variance may significantly affect the perceived effectiveness of speech enhancement models. Furthermore, phoneme confusion observed in both human and automatic speech recognition systems suggests that consonants and vowels experience a different impact from information loss due to noise (Meyer et al., 2010; Zaar & Dau, 2017). Studies have shown that a degraded classification of voicing can lead to more confusion between voiced and unvoiced phonemes, such as /p/ and /b/. In contrast, phonemes differing in the place of articulation, like /p/ and /d/, remain distinguishable (Dubno & Levitt, 1981; Gelfand et al., 1985). Additionally, different amplification strategies affect phoneme perception in hearing-impaired listeners (Scheidiger Christoph, 2017).
Research on phoneme recognition, such as the study by Meyer et al. (2010), shows that intrinsic speech variations (e.g., speaking rate, effort, style, and dialect) significantly affect phoneme recognition in noisy environments. For instance, Li et al. (2010) showed that the robustness of stop consonants to noise relies on dominant acoustic features like bursts and F2 transitions. Woods et al. (2010) investigated consonant identification in consonant–vowel–consonant syllables presented in speech-spectrum noise, revealing that baseline SNRs required for consonant identification vary by more than 40 dB across different consonants. Furthermore, Phatak and Allen (2007) demonstrated that consonants can be grouped into three distinct sets based on their susceptibility to noise masking: low-scoring consonants such as /f/, /θ/, /v/, /ð/, /b/, and /m/; high-scoring consonants such as /t/, /s/, /z/, /b/, and /ʧ/; and an intermediate set including consonants such as /n/, /p/, /g/, /k/, and /d/. These groups highlight how different consonants exhibit a varying resilience to noise, with significant implications for the improvement and evaluation of speech enhancement algorithms.
In this paper, we propose evaluating three state-of-the-art speech enhancement algorithms at the phoneme scale for a nuanced analysis that aligns with the distinct acoustic properties of phonetic elements. Such detailed scrutiny can reveal the specific strengths and weaknesses of algorithms in preserving the fidelity of speech sounds. This approach also offers valuable insights for the design of future speech enhancement algorithms, ensuring they are tuned to enhance phonemic clarity by accounting for the unique acoustic characteristics of specific phonemes.
The rest of this paper is structured as follows. First, we provide an overview of multichannel speech enhancement by setting the problem and detailing the algorithms we use in our study. Then, the Methodology section delves into the process of data collection and generation, and notably highlights the phoneme classification. The next section describes our extensive experiments and discusses its results, with a particular emphasis on the phoneme-scale evaluation. Finally, the last section draws some concluding remarks.
Overview of Multichannel Speech Enhancement
Problem Statement and Notations
Consider an acoustic scenario with two punctuate sources and several distant microphones. One source is the target speech, while the other is some interfering noise. In the case of hearing aids, we have M microphones on each hearing aid and two hearing aids: one on the left (L) and one on the right (R). This scenario is illustrated in Figure 1.

Spatialized acoustic scenarios with two sources: a speech source and a noise source. The acoustic sources are point sources. The signal
We note
The noisy mixture signal at the hearing aids is the combination of the speech and noise images:

Speech enhancement encompasses noise reduction (Loizou, 2007), dereverberation (Naylor & Gaubitch, 2010), or both. Noise reduction aims to estimate the speech signal at a microphone
In hearing aid scenarios, there are two possible speech enhancement setups (Figure 2). In the bilateral setup, there is no communication between the hearing aids, and each side is processed independently. Therefore, the input of the left hearing aid filter is

Speech enhancement setups: bilateral (left) and binaural (right).
In the binaural speech enhancement setup (Kollmeier & Koch, 1994), the hearing aids communicate with each other, giving each filter access to more diverse information improving effectiveness in asymmetric scenarios (Van den Bogaert et al., 2009). This is also known as distributed microphone arrays (Bertrand & Moonen, 2010). Each hearing aid filter processes the entire set
Algorithms
Multichannel filters exploit the spatial information about the acoustic scene obtained through multiple microphones. Because of their ability to focus on one direction in space, these algorithms are commonly referred to as beamformers. Recently, the use of neural networks in multichannel speech enhancement algorithms has significantly improved their performance and applicability in realistic scenarios.
These algorithms can be divided into two categories. On the one hand, hybrid algorithms combine traditional signal processing spatial filters (obtained as a solution to an optimization problem—see below) with neural networks that estimate these filters’ parameters (Carbajal et al., 2020; Hendriks & Gerkmann, 2011; Heymann et al., 2016; Nugraha et al., 2016). On the other hand, end-to-end algorithms use neural networks to directly estimate signals or multichannel filters, optimizing parameters on training sets (Dowerah et al., 2023; Luo et al., 2019; Tolooshams et al., 2020).
In this paper, we study the behavior of three different algorithms. The motivation for choosing these is threefold. Firstly, their source code and trained parameters are available publicly. Secondly, these algorithms can be applied in a binaural enhancement setup. Finally, they cover a wide variety of methodologies among the neural-based multichannel speech enhancement algorithms. The first two algorithms integrate neural networks within signal processing-based filtering; thus, they belong to the category of hybrid algorithms. One algorithm is designed principally for compact microphone arrays and relies on a single-channel neural network, while the other is designed for distributed arrays and relies on a multichannel neural network. The last algorithm is fully based on neural networks; thus, it is representative of the category of end-to-end algorithms.
Minimum Variance Distortionless Beamformer
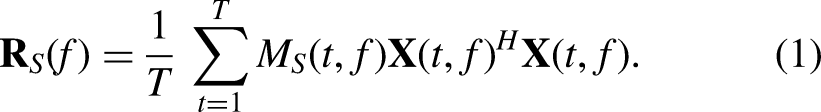
The MVDR beamformer is a particular spatial filtering technique, which in general can be expressed as applying a filter


Heymann et al. (2016) proposed to estimate these matrices using time–frequency masks computed with a recurrent neural network (Heymann et al., 2016). The noisy mixture is input to the neural networks, which returns a speech mask coefficient

Neural network-based mask estimation. The neural network is fed noisy signal at the input and provides a mask that indicates the amount of speech in each time–frequency bin.
Distributed MWF
The goal of the MWF is to estimate the speech component at an arbitrary reference microphone


Variants of the MWF include the speech distortion weighted MWF for balancing the noise reduction and speech distortion (Spriet et al., 2004), and the GEVD-MWF for a more robust filtering in noisy conditions (Serizel et al., 2014). This latter variant is used in this paper.
Bertrand and Moonen (2010) proposed an algorithm adapted to microphone arrays. Initially, this algorithm assumed perfect voice activity detection to estimate the correlation matrices. It was later adapted to use a two-step neural network-based mask estimation algorithm called Tango (Furnon et al., 2021).
In the first stage, a mask is obtained for one local channel, similarly to the MVDR. This mask helps in isolating the primary speech signal by attenuating the background noise. Specifically, the mask is estimated by focusing on the time–frequency representation of the signal, where the neural network identifies and suppresses the noise components while preserving the speech components. In the second stage, the neural network uses signals from both ears to jointly estimate the masks, incorporating binaural cues to refine and enhance the initial mask. This process involves the neural network analyzing the spatial and spectral characteristics of the signals from both ears. By leveraging the interaural time and level differences, the network can better differentiate between the target speech and background noise. The binaural integration allows the model to exploit the spatial separation between the speech and noise sources, leading to a more precise and robust mask estimation (Figure 4).

Distributed MWF in the binaural case.
FaSNet Beamformer
The last beamformer that we study in this paper is a beamformer that relies mainly on neural networks, the so-called FaSNet beamformer (Luo et al., 2019). More precisely, the beamformer itself is computed with neural networks and directly applied to the signals recorded by the microphones.
This algorithm also operates in two stages. In the first step, the algorithm computes a filtered speech signal at an arbitrary reference channel using the multichannel input mixture (here: four-channel). In the second step, this filtered reference signal is used to compute pairwise beamformers for all other channels. Unlike the previous hybrid algorithms, this one is directly trained in an end-to-end fashion by minimizing a loss between the clean and enhanced speech signals. In the paper, the FaSNet beamformer is trained to optimize a scale-invariant signal-to-distortion ratio (SI-SDR) (Le Roux et al., 2019).
Methodology
First, we present the pipeline used for simulating multichannel speech data in realistic noisy conditions. Then, we introduce the evaluation metrics. Finally, we describe the phoneme categories and the classification method that allows for a fine-grain assessment.
Data Generation
We simulate mixtures that replicate diverse acoustic scenarios with the target speech contaminated by interfering noise. To that end, we consider real-life speech excerpts and measured room impulse response (RIR), while the mixtures themselves are simulated. This approach allows for the creation of a large quantity of signals with various configurations, which would be complex and costly to obtain through real-world recordings.
Speech Data
The speech data used to simulate mixtures comprises 1,000 speech signals extracted from the test set of LibriSpeech (Panayotov et al., 2015). This dataset is a comprehensive corpus encompassing approximately 1000 h of English speech. The data is obtained from audiobooks within the LibriVox project, where audio recordings have been aligned with their corresponding texts and partitioned into short segments. The signals are sampled at 16 kHz.
Noise Types
We consider both synthetic and recorded noise types (see Figure 5). This approach allows us to observe and understand the different behavior of the speech enhancement algorithms described above.
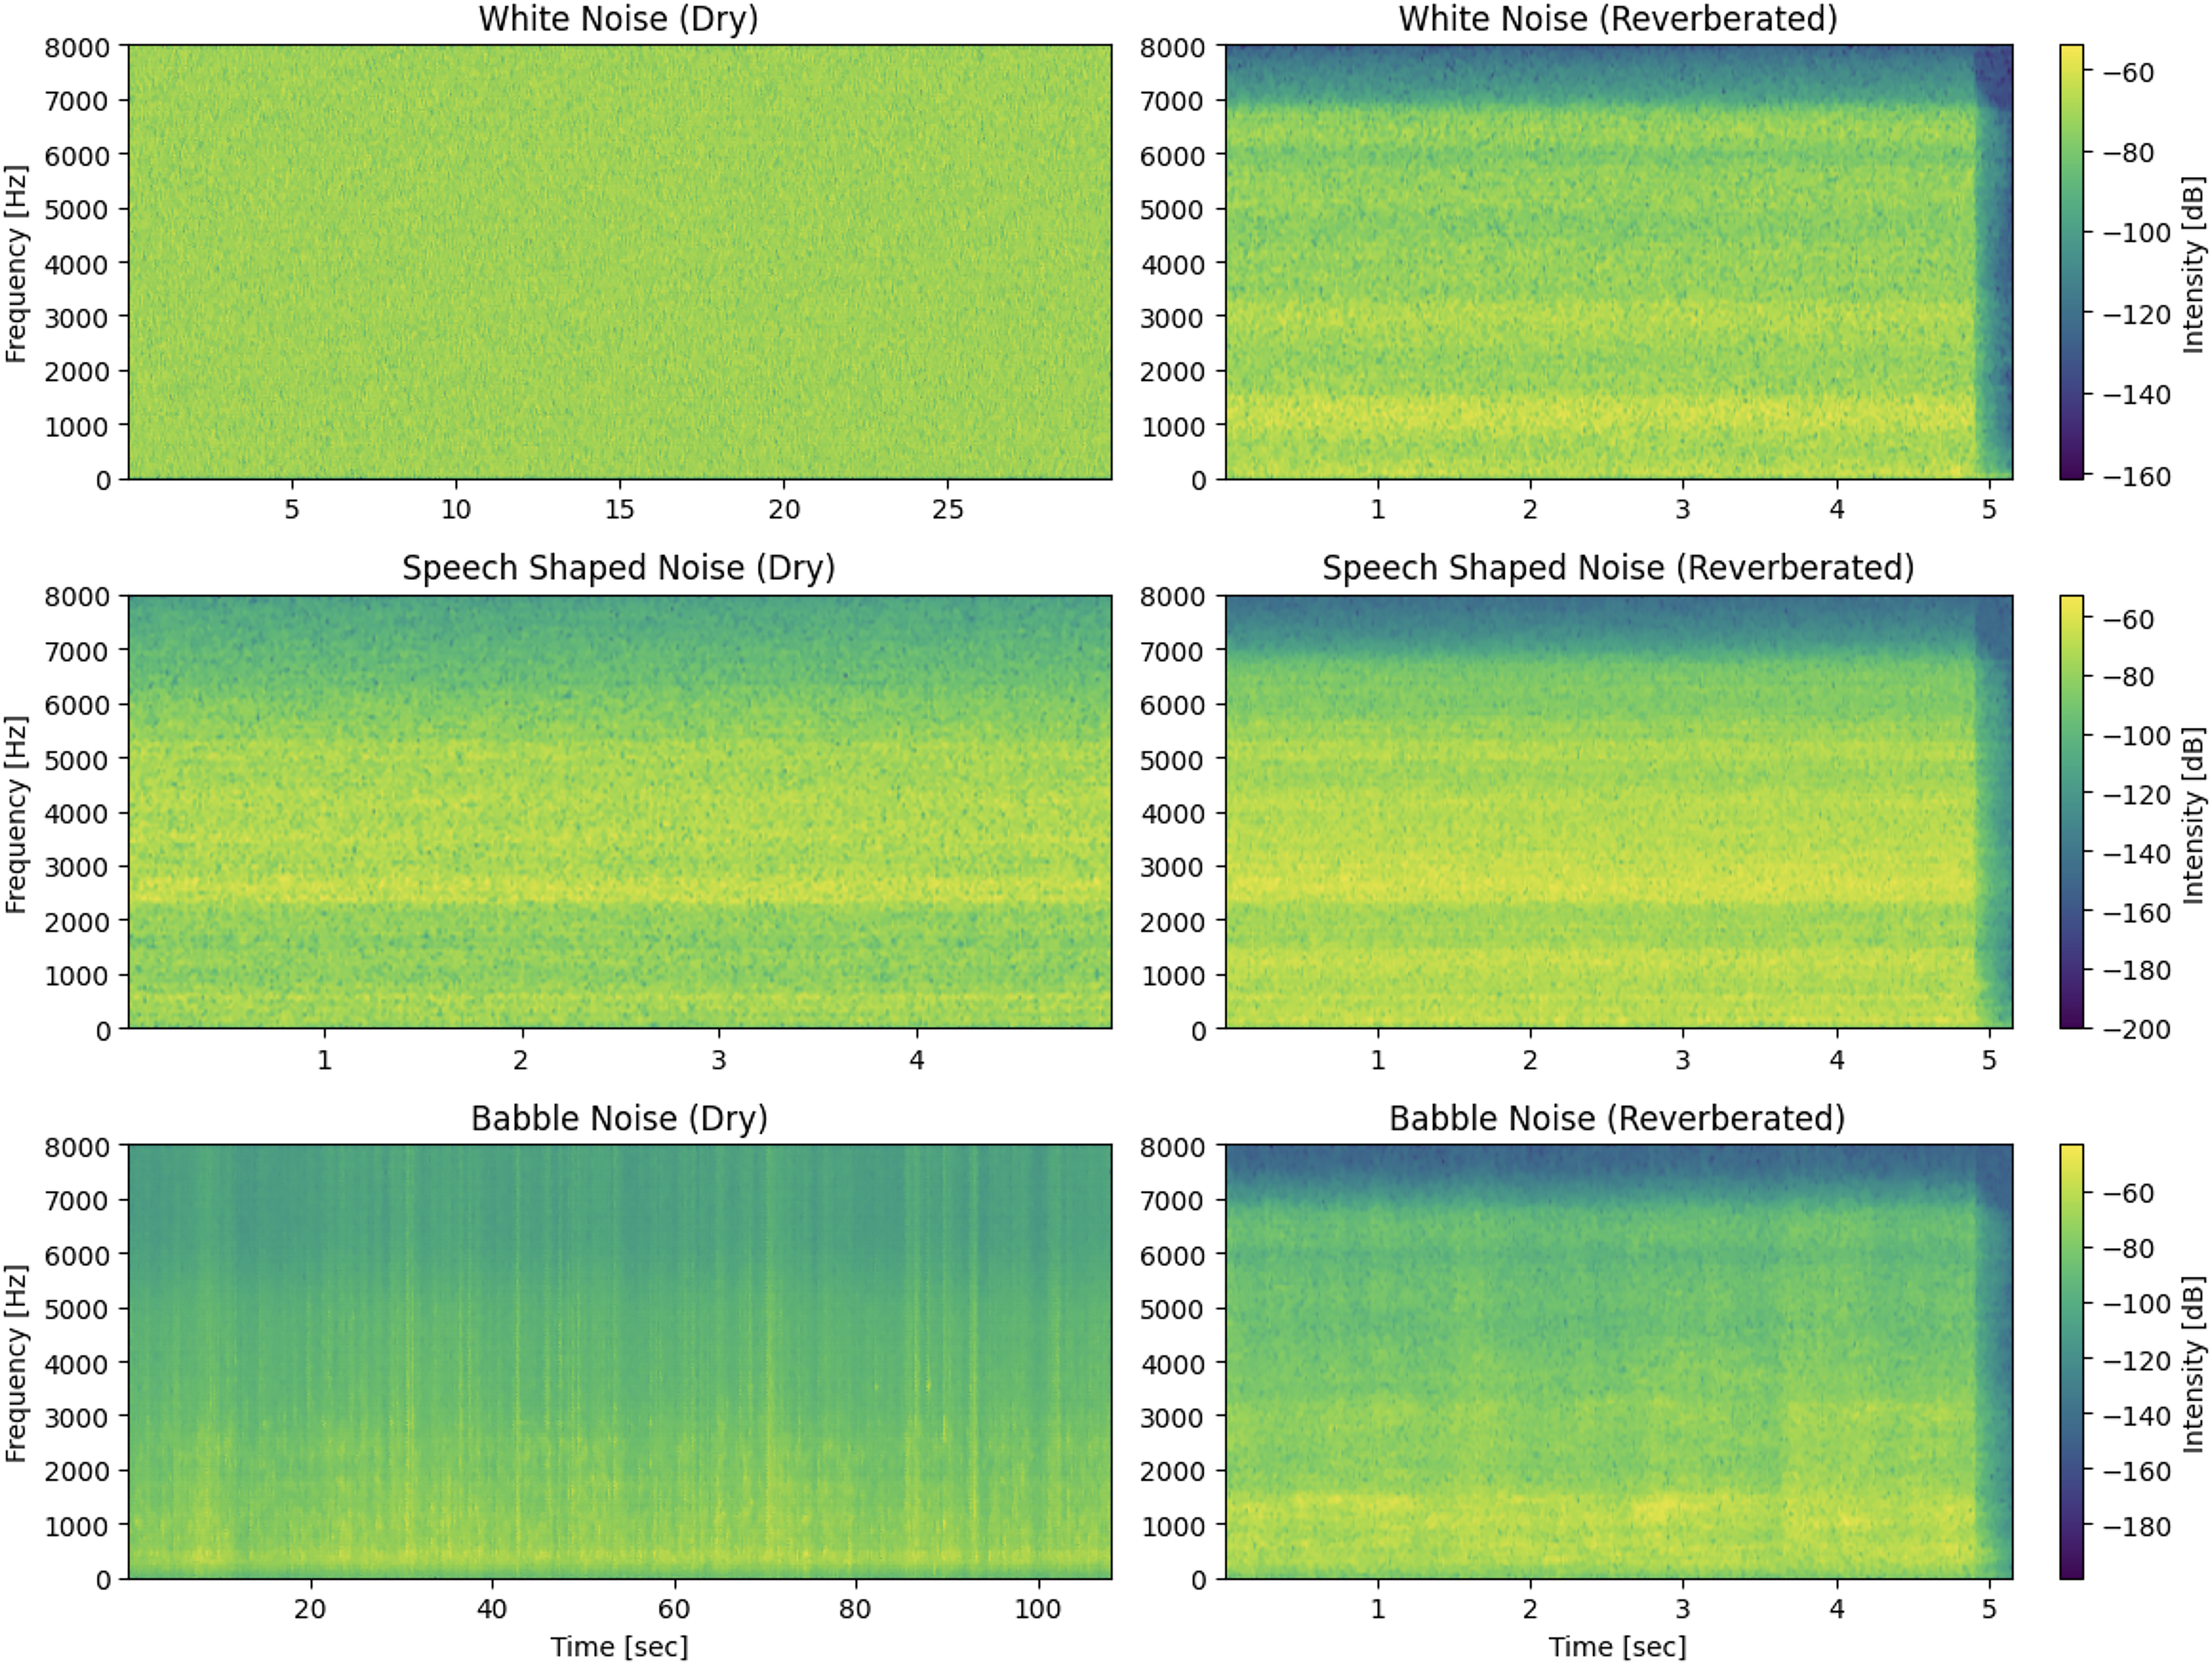
Spectrograms of white noise, speech-shaped noise, and babble noise.
First, we consider white noise, which is characterized by its uniform frequency distribution (Keith & Talis, 1972). Using white noise in our experiments provides a consistent baseline for evaluating speech enhancement algorithms. Indeed, testing our algorithms against white noise ensures that they can handle even simple noise types effectively, serving as a foundational benchmark. This approach aligns with many standard clinical tests that still employ white noise (Reynard et al., 2021).
We also consider speech-shaped noise, 2 a type of noise signal designed to mimic the average spectral characteristics of natural human speech. Unlike white noise, which has a uniform frequency distribution, speech-shaped noise is crafted to simulate the energy distribution across frequencies of speech sounds. To generate speech-shaped noise, we use five speech signals (from three females and two males) from LibriSpeech that are not part of our mixture subset. By transforming the signal (i.e., preserving its magnitude and randomizing its phase), we create a noise signal with the same spectral properties as the original speech.
Finally, we consider a babble noise signal taken from Freesound (Font et al., 2013). The selected clip was recorded in a restaurant during a lunch break. This audio signal consists of a soundscape where multiple people are conversing simultaneously. Unlike synthetic noise signals (e.g., white noise or speech-shaped noise), babble noise comprises overlapping speech from various speakers in the same acoustic scene, which introduces a higher amount of acoustic complexity. This complexity mirrors real-world scenarios to investigate how individuals with hearing loss navigate challenging auditory scenes.
RIRs
A RIR is a filter that describes the impact of sound propagation within a room from the position where the sound source is emitted to the microphone where it is recorded.
Even though RIRs can be simulated using an acoustic model, in this work, we use measured RIRs since they allow for more realism. More specifically, we use the RIRs collected from Delebecque and Serizel (2023), which correspond to a typical hearing aid use-case scenario. In a nutshell, these RIRs are measured by playing a sweep signal at the source location and recording the reverberated signal at the listener's position (Novak et al., 2015). We use the RIRs obtained for a source signal angled at 0° (in front, relative to the forward-facing listener), 45°, and 90°. The reverberated signals were recorded by Delebecque and Serizel (2023) using a Portable Hearing Laboratory (PHL) placed on a KEMAR head and torso model simulator. The PHL device comprises two behind-the-ear hearing aid shells, each of which being equipped with two omnidirectional microphones; thus, it yields a realistic four-channel signal as typically processed by hearing aid devices. The room is rectangular with dimensions of 6.62 m (length) × 2.57 m (width) × 2.60 m (height), and the reverberation time (RT60) is 0.20 s. The KEMAR head is positioned 2.27 m from the wall along the length axis and centrally in the room along the width. Both the loudspeakers and the KEMAR head's ears are placed 1.48 m above the floor. The loudspeakers are placed 1 m away from the KEMAR. We refer the interested reader to the original publication (Delebecque & Serizel, 2023) for more details on the data acquisition setup.
Mixtures
We use RIRs to simulate mixtures, creating scenarios where the speech is at a 0° angle and the noise is angled at either 45° or 90° to the right (see Figure 6 for noise angled at 45°). To build these noisy mixtures, we first need to adjust the relative speech and noise amounts. To that end, we apply an amplification factor to the noise source, and we control the amount of noise via the gain, defined as:


Spatial configuration of the speech and noise sources.
Evaluation Metrics
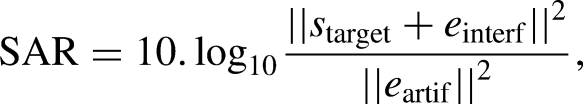
In our evaluation, we use objective metrics to compare the target speech with the speech estimated with the different speech enhancement algorithms at utterance and phoneme scales. Traditionally, speech enhancement algorithms are tested using metrics that measure the quantity of interference, artifacts, and distortions that remain in the estimated speech. To that end, we use the BSS eval metrics from Vincent et al. (2006), originally tailored for source separation applications, but widely used for speech enhancement. Note that other metrics are designed for evaluating speech signals in terms of intelligibility (Taal et al., 2010) or perceived quality (Rix, 2001). However, these operate on audio segments (about 300 ms to 1 s) that are significantly longer than the duration of individual phonemes. As such, they are not suitable for our experiments since assessing their relevance at the phoneme scale would require a dedicated study.
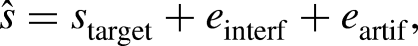
Let us consider the following decomposition of the error between the target speech signal


Note that to quantify the actual noise reduction achieved by the speech enhancement algorithm, it is necessary to compare a given output metric to a reference initial value. To that end, we calculate the metrics by replacing the estimated speech with the noisy mixture: since the resulting metrics are computed at the input of the algorithms (before any processing), we refer to them as
In particular,
Note that in theory, there are no artifacts in the input signals, so
When evaluating speech enhancement algorithms, these metrics are typically computed at the utterance scale and aggregated over several sentences to obtain a consolidated metric. This process overlooks the potential performance variability of algorithms depending on the phonetic content of the speech signals.
Phoneme Classes
In our study, we investigate the evaluation of speech enhancement algorithms at the phoneme scale. In this regard, we perform phoneme segmentation of clean speech signals. This process involves using a phoneme recognizer to estimate the boundaries of each phoneme within a speech signal.
We used the Montreal Forced Aligner (MFA) (McAuliffe et al., 2017) to align spoken audio recordings with their corresponding phonetic transcriptions. In our analysis, we utilized the “English MFA dictionary v2.2.1” version, which has been trained on a dataset comprising 95,278 words. This ensured the alignment model's proficiency in handling a diverse range of phonetic patterns and nuances present in the clean speech data.
As shown in Figure 7, the speech dataset comprises 55 phonemes, each with varying frequencies. Most frequent phonemes include /ə/ with 2,373 occurrences, /ɪ/ with 2,022, and /n/ with 1,972. The least frequent phonemes occur less than 10 times in the whole dataset. Hence, a study at the phoneme scale would hardly lead to any statistically significant outcome on these phonemes.

Phoneme distribution in our speech dataset.
To simplify the analysis, we group phonemes into categories. This classification relies on a slightly modified version of the MFA IPA chart, as we included an additional vowel class for the near-close near-front unrounded phoneme /ɪ/ and the near-close near-back rounded phoneme /ʊ/. This decision was driven by the important presence of the unrounded phoneme within the dataset, prompting us to investigate the near-close performance and behavior in the evaluations. Moreover, we include both /e/ and /ej/ in the close-mid category as the number of /o/ and /ow/ is very low.
As illustrated in Figure 8, the most prominent phoneme categories in our dataset are plosives, open-mid, and nasals, occurring 6,214, 4,287, and 2,489 times, respectively. The close-mid, affricate, and tap phoneme categories add to the phonetic diversity, albeit as the least frequent, enriching the overall representation of speech.

Distribution of phoneme per categories in our speech dataset.
Experimental Setup
As outlined in the section Overview of Multichannel Speech Enhancement, we selected three speech enhancement algorithms whose pretrained weights are available online. All the models are used in their default setup. For each ear, the front microphone of the speech enhancement algorithm is selected as the reference microphone. The MVDR and FaSNet models are implemented in the ESPnet toolbox (Li et al., 2021), and the corresponding weights can be readily downloaded from the toolbox. Both models have been trained on the CHiME-4 4 dataset, which includes 8,738 noisy utterances (1,600 recorded and 7,138 simulated) with speaker distribution of 4 speakers for recorded noisy speech mixtures and 83 speakers for simulated noisy speech mixtures (Vincent et al., 2017). The environments where noise signals were recorded include buses, cafes, pedestrian areas, and street junctions. Impulse responses are provided in the simulated training set to simulate reverberation effects.
The Tango model (Furnon et al., 2021) is trained on the same dataset as in the original paper, including several babble noise recordings as well as speech-shaped noise, and its code and pretrained weights are also available online. This training data includes noise sources amplified by a random gain between −6 and 0 dB (after convolution, most of the gains range from −10 to 10 dB). The simulated environments include a meeting room and a living room. In the meeting room setup, two sources (target and interference) are placed around a circular table (0.5–1 m radius), and four nodes 5 with microphones are positioned at 90° angles around the table, between 5 and 20 cm from the edge. In the living room scenario, the nodes are placed within 50 cm of the walls to mimic shelf placement, while the sources are randomly positioned at least 50 cm away from the nodes and walls.
In our study, 6 we compute the BSS eval metrics using the mir_eval library (Raffel et al., 2014).
Experimental Results
First, we detail the results at the utterance scale, as speech enhancement evaluations are typically conducted. Then, we delve into a finer-grain evaluation at the phoneme scale.
Evaluation at the Utterance Scale
Comparison between the Left and Right Microphones
Let us first recall that each algorithm produces an enhanced signal at a reference channel that can be on either the left or right device (we arbitrarily chose it to be the front microphone of the device). This first experiment compares the results obtained in these two cases. We operate in an asymmetrical scenario since the noise source is placed on the right side of the head in our setup (see Figure 6). This investigation aims to clarify how the noise's spatial orientation affects the binaural algorithms’ performance on each microphone.
Figure 9 displays the results of the algorithms’ effectiveness to enhance the speech at each ear (note that these results are averaged across noise types and positions, gain factors, and models). In line with our expectations, the influence of noise is more pronounced on the right ear. The right ear shows lower input SNR, which can be attributed to the proximity of the right reference microphone to the noise source. On the contrary, the head shadow effect impacts the sound propagation to the left ear and the input SNR is larger.

Comparison between the left and right microphones.
Even though assessments of the estimated speech (output) indicate a better absolute performance on the left microphone, it is noteworthy that the relative improvement is more important for the right microphone. Specifically, we observe that the SNR improvement is more substantial on the right side (10.60 dB) than on the left side (2.86 dB). This outlines that the right-side microphone benefits more from the binaural property of the speech enhancement algorithm, albeit with a relatively greater amount of distortion compared to the left ear. The
Comparison between Noise Types
In this experiment, we investigate the influence of the noise type on performance. We consider three noise types: white noise, speech-shaped noise, and babble noise. The results are averaged across gain factors and models and displayed in Figure 10.

Comparison between the white noise, speech-shaped noise, and babble noise.
First, we observe an overall consistent performance for the white noise and the speech-shaped noise. The babble noise is more challenging for models to deal with than the other noise types, as indicated by the corresponding low values of input SDR, SNR, and SAR. As the focus of the paper is not to analyze the performance of speech enhancement algorithms under challenging scenarios, but rather to understand their behavior at a fine-grained scale, we will focus on white noise and speech-shaped noise. As demonstrated by Stone et al. (2012), the presence of temporal modulations in noise undermines the intelligibility of speech. While white noise and speech-shaped noise exhibit less complex temporal modulations compared to babble noise, speech-shaped noise can serve as a proxy for babble noise due to its similar spectral characteristics.
Regarding
Impact of the Noise Location
This experiment analyzes the impact of the noise location on the performance of the speech enhancement algorithms. The noise source can be positioned at either 45° or 90° relative to the forward-facing listener (see Figure 6). The results are averaged across noise types, gain factors, and models, and presented in Figure 11.

Comparison between noise angles at 45° and at 90°.
First, we remark that the input SNR is slightly higher when the noise is oriented at 90° relative to the listener. This was expected since these results correspond to the left-side microphone, which is less contaminated with noise when the source is placed on the opposite side of the head rather than at 45°. Likewise, we also observe that speech enhancement algorithms exhibit a higher performance when the noise is placed at 90° compared to 45°, as indicated by the output SDR and SNR. Nevertheless, the differences between the two scenarios are not very important in terms of both input and output metrics. Therefore, selecting either one of the two scenarios would not impact the overall analysis greatly. In the rest of our study at the phoneme scale, we will focus on the 45° scenario that is potentially more challenging for the speech enhancement algorithms. In terms of
Impact of the Amount of Noise
Figure 12 presents the impact of varying the mixture noise gain factors on both the input and the output evaluation metrics.

Comparison between gain factors (−5, 0, and 5 dB).
First, comparing the gain factor (computed using the anechoic sources) and the input SNR (computed using the image sources) highlights the influence of room acoustics on the mixtures at the ears’ position. On average, this phenomenon results in a drop of approximately 2 dB in terms of amount of noise for the three scenarios. This is justified by the propagation in the room and the relative position of the sources with respect to the walls (Delebecque & Serizel, 2023). This underscores the importance of computing the SNR at the microphone as a reference value and not relying on the gain that is set on the dry sources.
Overall, we observe that the algorithms’ performance improves as the mixture gain increases. We can also note an important drop in all the metrics for the scenarios where the gain is −5 dB. This indicates that it will probably be useful to control the performance of the algorithms at different gain. Yet, for the simplicity of the analysis, in our phoneme-scale experiments, we will focus mainly on the scenario with a gain of 0 dB in the phoneme-scale evaluations. Indeed, this setting is sufficiently challenging for the task at hand and allows us to examine the relative performance of speech enhancement algorithms without inducing an excessive degradation of the signal. Still, we will examine the impact of the mixture gain on specific phonemes, where it might deserve some finer-grain analysis.
The output
Evaluation at the Phoneme Scale
We now delve into our evaluation at the phoneme scale, which we illustrate by the following introductive example. Figure 13 displays the spectrogram of a clean speech signal, as well as the spectrograms of this same signal contaminated with noise, and where some specific phonemes are highlighted.

Spectrogram of clean speech and mixtures with diverse types of noise on the utterance “He began a confused complaint against the wizard who had vanished behind the curtain on the left” segmented into phonemes. Note: The white noise has been filtered with an RIR, altering its characteristics, and the low-frequency region of the speech-shaped noise appears less intense due to intensity scaling.
The spectrograms display for instance the phonemes “g” and “s” across different noise conditions. In the clean speech, the phoneme “g” shows distinct horizontal striations representing its voiced nature with a rich harmonic structure. The phoneme “s” is characterized by a high-frequency, almost texture-like pattern, indicating its sibilant, unvoiced nature.
When white noise is added to the clean speech, we observe that the low-frequency harmonics of the phoneme “g” remains relatively intact. On the other hand, the sibilant “s” is strongly affected by this noise, since its energy is more concentrated in the higher frequencies where the white noise also contains energy.
With speech-shaped noise, the impact on the phoneme “g” is less uniform. Similar to white noise, speech-shaped noise fills in the temporal gaps of stopped consonants, making it difficult to discern the phoneme's harmonic patterns. The phoneme “s” remains relatively discernible, but its crisp edges are somewhat softened, and the definition between silence and sibilance is less clear.
The presence of babble noise introduces a more complex interference. The phoneme “g” is disrupted by the varying intensities and frequencies of overlapping speech, obfuscating its harmonic structure. Conversely, while still visible due to its high-frequency content, the phoneme “s” competes with similar sounds from the babble, which can make it challenging to isolate from the background chatter. Note that in addition to this so-called energetic masking, babble noise is known to introduce an informational masking (Brungart, 2001) due to its cognitive interference with the speech signal. While accounting for such a masking is necessary in listening tests, it is outside the scope of this paper.
This analysis underscores the critical importance of evaluating speech enhancement algorithms at the phoneme scale. The differences in how various phonemes are affected by several types of noise highlight the nuanced challenges faced by the speech enhancement systems. Voiced phonemes, with their rich harmonic structures, and unvoiced phonemes, with their high-frequency energy, require different enhancement strategies to overcome the masking effects of noise. Understanding these varied impacts is essential for improving speech enhancement algorithms that can effectively disentangle and clarify the essential elements of speech, ensuring that each phoneme, regardless of its unique acoustic properties, is accurately reproduced and easily discernible, even is adverse listening conditions.
An Overview of the Results at the Phoneme Scale
We first present an overview of the results at the phoneme scale. In all the following experiments (except for the last one), the mixtures are at 0 dB. The results are displayed in Figure 14. A notable observation is that plosives, fricatives, and taps are the most impacted by the noise. These are also the phoneme categories on which the speech enhancement algorithms perform the worst.
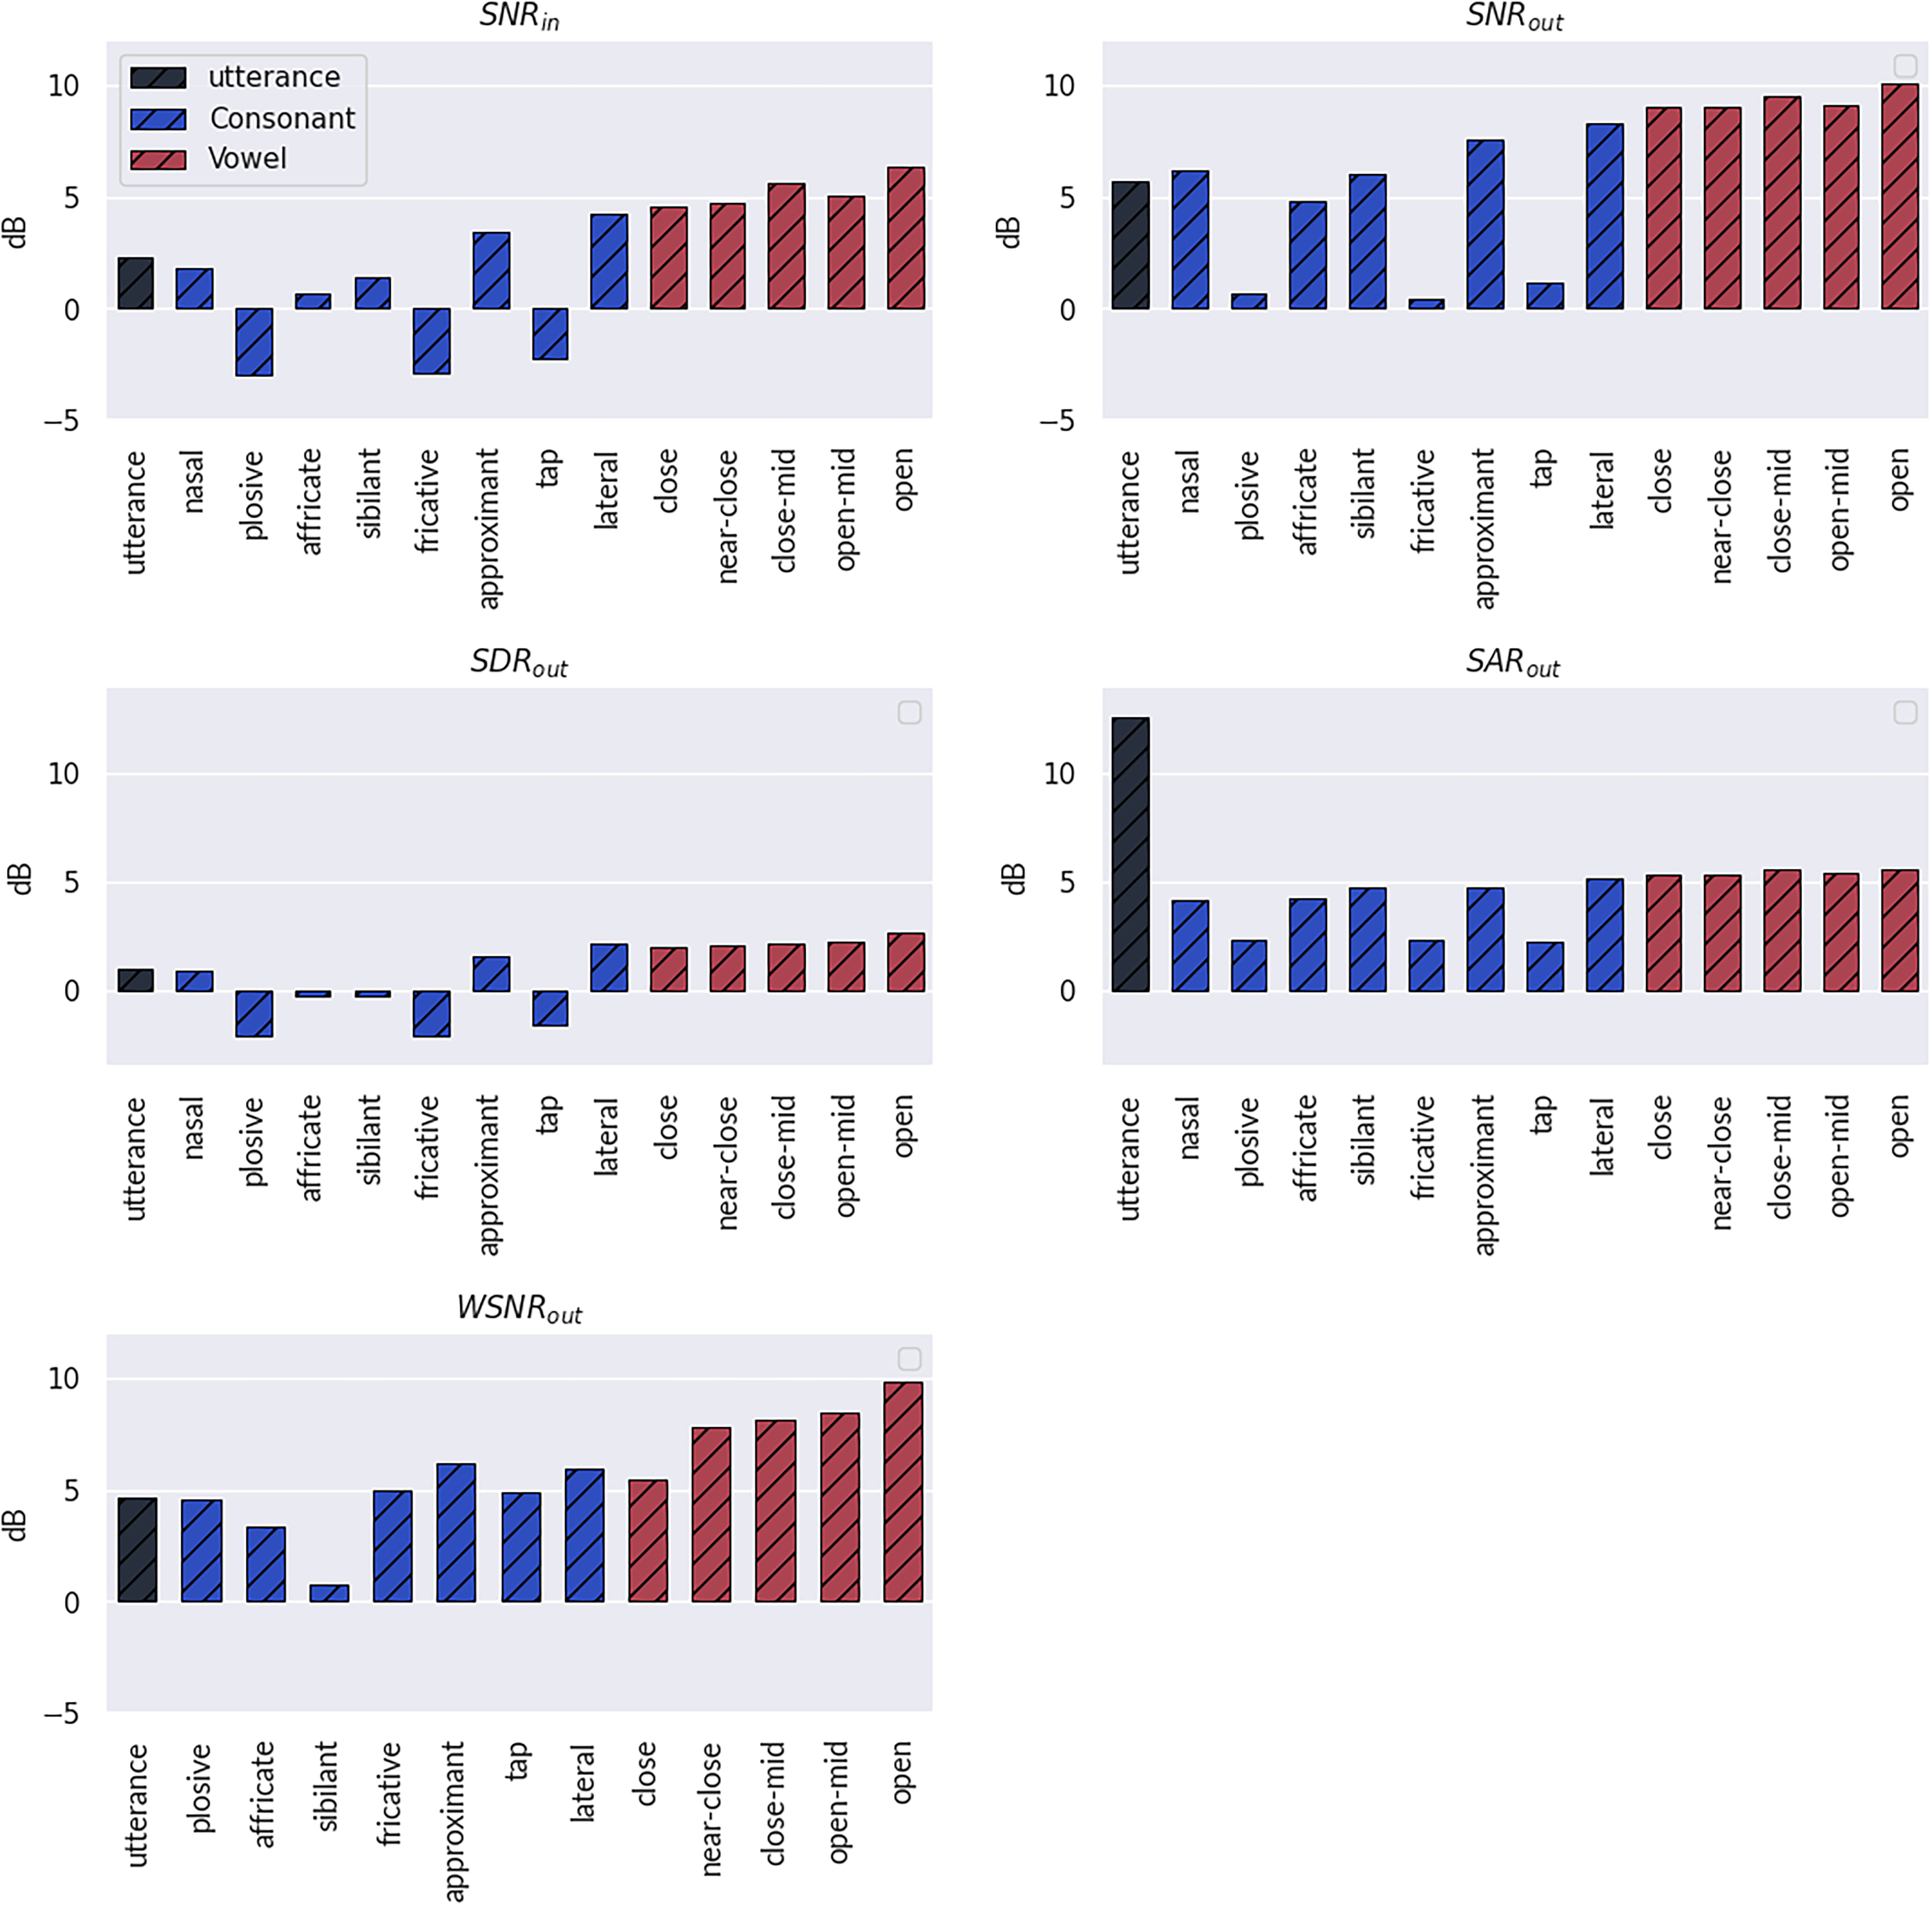
Evaluation results across phoneme categories (the results at the utterance scale are also reported). Results are averaged over algorithms, with a gain of 0 dB and the noise source oriented at 45° relative to the listener.
The experiment reveals that, on average, the speech enhancement models yield a substantial improvement in all the other phoneme categories. They particularly reduce the amount of noise while introducing only a controlled amount of distortion and artifacts. However, this positive trend in phoneme categorization contrasts with the findings at the utterance scale. Indeed, the evaluation of artifacts at the utterance scale tends to overestimate the performance across all phoneme categories. This suggests that while the models perform well at refining speech at the phoneme scale, their effectiveness may be overstated when considering the broader context of complete utterances.
Some phoneme categories show different performance in
Overall, we observe different trends per phoneme categories, which motivates us to analyze these results in more depth. We conduct such an analysis in the following experiments, for which we select specific categories of phonemes such that the comparison is made clearer.
Impact of the Noise Type on Plosive, Approximant, and Open Phonemes
In this experiment, we analyze the results (displayed in Figure 15) for opens, approximant, and plosive phonemes with respect to the noise type (white noise or speech-shaped noise). In examining the outcomes across various metrics, it is apparent that the general trend persists regardless of the noise type. Nonetheless, there is a slightly higher SNR improvement when speech-shaped noise is present as compared to white noise. This can be explained by the fact that speech-shaped noise is commonly used for training speech enhancement models. Additionally, the spectral density differences between the two noise types result in differential effects on phonemes, such as fricatives and vowels. It is interesting however to see that the performance in terms of SAR remains consistent across phoneme categories, regardless of the noise type. This indicates that the SNR improvement does not occur at the costs of a lower SAR, while such a trade-off is usually observed in speech enhancement algorithms.

Evaluation results per noise types on plosive, approximant, and open phonemes. Results are averaged over algorithms, with a gain of 0 dB and the noise source oriented at 45° relative to the listener.
Comparison of the Algorithms on Nasals, Affricates, and Sibilants
The input SNR indicates that the nasals are the least degraded by the noise (with the white noise having slightly less impact than the speech-shaped noise).
As for the residual interference and distortions in the estimated speech, the performance varies with the noise type. Tango outperforms other models in mitigating interference and distortions with the presence of white noise. In contrast, when using speech-shaped noise, MVDR appears to be the best at reducing interference and artifacts, whereas Tango is superior for reducing distortions. FaSNet appears to deteriorate the speech signal when white noise is involved, since the output SNR is larger than its input value. This could potentially be due to a mismatch between the training conditions of the model and the testing setup considered here. Indeed, end-to-end algorithms have been shown to exhibit less robustness to these conditions (types of noise, amounts of noise, acoustic environments, etc.) than hybrid algorithms (Ditter & Gerkmann, 2020). Nevertheless, FaSNet notably improves the SNR in the presence of speech-shaped noise, especially for nasal phonemes, indicating its effectiveness in enhancing certain aspects of speech.
Across different noise conditions, Tango exhibits robustness, consistently improving the SNR, more so for sibilants than for nasals and affricates. This suggests that Tango presents a balanced performance across various acoustic noise scenarios on the three phonemes categories. MVDR performs well on nasals regardless of the noise type, but its performance on affricates and sibilants is always lower than for nasals. Besides,

Performance of the algorithms on nasals and sibilants on mixtures, with a gain of 0 dB and the noise source oriented at 45° relative to the listener.
Comparison of the Algorithms on Vowels
In terms of
The analysis of the speech enhancement algorithms reveals that Tango is the most effective model for minimizing distortions, performing with both white noise and speech-shaped noise. This suggests Tango's processing techniques are well suited for maintaining the integrity of the speech signal even in the presence of various noise types. Tango also stands out for reducing the interference of vowels in white noise environments. This is particularly true for open phonemes, which are more vulnerable to interference due to their wider spectral spread. MVDR, on the other hand, outperforms other systems in reducing the interference on vowels in scenarios with speech-shaped noise. FaSNet is overall outperformed by MVDR and Tango, except under speech-shaped noise where it outperforms Tango. Tango's performance appears to depend on the initial amount of interference. The SNR improvement is almost constant for all categories and the output SNR then depends on the phoneme category. MVDR, in contrast, improves the SNR more uniformly, potentially offering a more predictable enhancement outcome, especially when the initial amounts of noise in vowels are varying.
MVDR also prevails at controlling the presence of artifacts in the estimated speech, which is crucial for the overall perceived quality and intelligibility of the enhanced speech, since a low amount of artifacts implies that the speech signal retains more of its natural characteristics postestimation. The output SAR obtained with MVDR is once again almost constant regardless of the phoneme category, which could lead to more predictable behavior. The output SAR obtained by Tango depends on the input SNR which makes it potentially less predictable than the MVDR. FaSNet is outperformed by the other systems by a large margin in terms of

Performance of the algorithms on close and open phonemes, with a gain of 0 dB and the noise source oriented at 45° relative to the listener.
Comparison of the Algorithms on Plosives, Fricatives, and Taps
As in prior experiments, the analysis is conducted in environments with two types of noise conditions: white noise and speech-shaped noise. The results are presented in Figure 18.

Performance of the algorithms on plosives, fricatives, and taps, with a gain of 0 dB and the noise source oriented at 45° relative to the listener.
The results reflect the distinct acoustic challenges that plosive, fricative, and tap consonants face in the room environment. These consonant types are intrinsically affected by interference due to their articulatory characteristics, with plosives being particularly vulnerable due to the transient nature of sound production, which can be easily masked by environmental noise.
Tango's performance with white noise stands out in its ability to reduce interference, especially in the case of plosives. Despite the challenging initial conditions, Tango manages to enhance plosives' clarity while keeping distortion reasonably low, highlighting its efficacy in dealing with the abrupt and high-intensity nature of plosive sounds. Under speech-shaped noise, Tango does not exhibit any remarkable improvement, yet it maintains its proficiency in interference reduction for plosives. The model's average performance in artifact reduction suggests that while Tango can mitigate some noise elements, there's a trade-off in terms of introducing new artifacts into the signal.
The MVDR exhibits more nuanced results, as we observe a persistence of high amounts of distortion and low interference improvements when dealing with white noise; however, it consistently reduces interference across all phoneme categories and maintains a high SAR under speech-shaped noise. While Tango performed the best on plosives, the MVDR provides the highest amount of noise reduction on tap phonemes.
Similarly, as on vowels, FaSNet fails to reduce interference and introduces an important amount of distortion in the presence of white noise. With speech-shaped noise, FaSNet exhibits improvement in the SNR. Like for the MVDR, these improvements are larger on tap phonemes than on plosives and fricatives. Finally, like vowels, the
Comparison of the Algorithms on Approximants and Laterals
In this experiment, we focus on the performance of the speech enhancement algorithms on approximant and lateral phonemes. The results provide insights into each algorithm's ability to preserve the integrity of these phoneme categories amidst the interference, distortion, and artifacts. The results are presented in Figure 19.

Performance of the algorithms on approximant and lateral phonemes, with a gain of 0 dB and the noise source oriented at 45° relative to the listener.
In the presence of white noise, Tango demonstrates proficiency in reducing interference while concurrently maintaining a low amount of distortion, outperforming the other models for both phoneme types. The trend is inverted in the presence of speech-shaped noise where MVDR exhibits the best SNR improvement for both approximants and laterals. Once again, FaSNet exhibits a deficient performance on white noise and performs on par with Tango in terms of SNR when speech-shaped noise is present. MVDR stands out for its superior control over distortion across both phoneme categories, suggesting its advanced capability to preserve speech quality. Tango and FaSNet, while demonstrating lower SARs, successfully maintain a reduced quantity of artifacts for both types of noise, confirming the algorithms' capabilities in artifact control. It is interesting to note that each model performs consistently across the phoneme class considered on each separate noise condition.
In summary, these experiments show that each algorithm exhibits a different behavior that depends not only on the noise type but also on the phoneme class.
Impact of the Amount of Noise on Algorithms' Performance
Finally, this experiment aims to understand how each model responds to different amounts of background noise across a range of speech sounds, from plosives to open vowels. Figure 20 presents a comparative analysis of the algorithms, evaluating their performance on mixtures with speech-shaped noise.

Performance of the algorithms on plosives, fricatives, closes, and opens with respect to the amount of input noise. The noise source is oriented at 45° relative to the listener.
The plosives, which are characterized by a complete obstruction of the vocal tract, are particularly susceptible to the acoustic interferences, as seen by the consistently lower input SNR compared to the gain of the mixtures. This suggests that the high modulation frequencies at the onset of plosives make them more prone to interference. All models grapple with reducing interference for plosives across scenarios. Even the best performing model (MVDR) only yields a slight SNR improvement. Tango exhibits the worst SNR improvement at −5 dB. This could indicate a limit to how much speech enhancement models can counteract the acoustic masking for these rapidly changing phonemes, especially in environments with strong background noise.
In contrast, approximants, close, and open vowels, which involve less abrupt articulatory gestures and more continuous airflow, seem to be easier to enhance even for a gain below 0 dB. This could possibly be due to their more sustained and resonant acoustic signatures that are less easily masked by noise. MVDR yields a noticeable improvement in reducing interference for these phonemes, particularly at 0 and 5 dB, highlighting its strength in enhancing such sounds. Even though this is not as drastic as for the plosive, all the models struggle to improve the SNR when the gain is −5 dB. MVDR once again is the algorithm that performs the best in this case and with speech-shaped noise. Tango and FaSNet on the other hand show no improvement for open vowels at −5 dB.
MVDR and Tango produce low artifacts in the estimated speech across gains from 5 to 0 dB for all phonemes. As in previous scenarios, FaSNet introduces the largest amount of artifacts regardless of the gain, as observed for plosives. For some phonemes, the gap between output SNR and
Several studies, such as those by Phatak and Allen (2007) and Phatak et al. (2008), focus on how different consonants and vowels are confused in noisy conditions. By examining the variability in error rates across different consonants and within individual tokens, Toscano (2014) highlights the importance of accounting for these differences when assessing speech recognition. Our analysis underscores the need for speech enhancement models to be tailored to the acoustic properties of phonemes, considering not only the amount of background noise but also the phonetic and articulatory characteristics that define each phoneme's vulnerability to acoustic interference.
Conclusions and Perspectives
In this paper, we conducted a comprehensive evaluation of three state-of-the-art multichannel speech enhancement algorithms (FaSNet, MVDR, and Tango), with a particular emphasis on the phoneme-scale analysis. This study revealed that speech enhancement algorithms perform differently depending on the phonemes, underlining the limitations of traditional utterance scale evaluations. Specifically, it was found that specific phonemes like plosives are heavily impacted by environmental acoustics, whereas nasals and sibilants show more resistance to noise, especially when it is speech shaped.
This phoneme-scale evaluation framework reveals the need for these algorithms to consider the differential impact of noise on various phonemes and adapt accordingly. This research direction can focus on integrating phoneme-specific characteristics into the training of these models, potentially enhancing their effectiveness in real-world noisy environments. Particularly, this could lead to enhanced speech intelligibility in real-world scenarios, offering interesting observations for developing more effective, personalized hearing aid technologies.
An in-depth analysis would also be interesting to establish the correlation between the speech quality and the perceived quality of phonemes. While our current study focuses on evaluating algorithms at the phoneme level, it is important to note that human auditory perception may operate at an even finer granularity. The auditory system might detect subtle subphonemic cues, which our phoneme-based approach does not fully capture. This framework is also applicable to other tasks involving speech enhancement, such as vocal assistants, where phoneme-scale evaluation and/or processing could be beneficial. Furthermore, acknowledging that physical measurements do not always align with human perceptions of speech, the results should be examined through listening tests.
Footnotes
Acknowledgments
This work was made with the support of the French National Research Agency, in the framework of the project REFINED “REal-time artiFicial INtelligence for hEaring aiDs” (ANR-21-CE19-0043). Experiments presented in this paper were partially carried out using the Grid5000 testbed, supported by a scientific interest group hosted by Inria and including CNRS, RENATER, and several universities as well as other organizations (see ![]() ).
).
Declaration of Conflicting Interests
The authors declared no potential conflicts of interest with respect to the research, authorship, and/or publication of this article.
Funding
The authors disclosed receipt of the following financial support for the research, authorship, and/or publication of this article: This work was supported by the Agence Nationale de la Recherche (grant number ANR-21-CE19-0043).
Data Availability Statement
Data sharing not applicable to this article as no datasets were generated or analyzed during the current study.