
Abstract
Older adults with normal hearing or with age-related hearing loss face challenges when listening to speech in noisy environments. To better serve individuals with communication difficulties, precision diagnostics are needed to characterize individuals’ auditory perceptual and cognitive abilities beyond pure tone thresholds. These abilities can be heterogenous across individuals within the same population. The goal of the present study is to consider the suprathreshold variability and develop characteristic profiles for older adults with normal hearing (ONH) and with hearing loss (OHL). Auditory perceptual and cognitive abilities were tested on ONH (n = 20) and OHL (n = 20) on an abbreviated test battery using portable automated rapid testing. Using cluster analyses, three main profiles were revealed for each group, showing differences in auditory perceptual and cognitive abilities despite similar audiometric thresholds. Analysis of variance showed that ONH profiles differed in spatial release from masking, speech-in-babble testing, cognition, tone-in-noise, and binaural temporal processing abilities. The OHL profiles differed in spatial release from masking, speech-in-babble testing, cognition, and tolerance to background noise performance. Correlation analyses showed significant relationships between auditory and cognitive abilities in both groups. This study showed that auditory perceptual and cognitive deficits can be present to varying degrees in the presence of audiometrically normal hearing and among listeners with similar degrees of hearing loss. The results of this study inform the need for taking individual differences into consideration and developing targeted intervention options beyond pure tone thresholds and speech testing.
Introduction
In quiet listening environments, people often communicate with ease, but with the introduction of multiple background talkers and a busy listening environment, older adults, especially those with age-related hearing loss, face a greater degree of difficulty communicating than younger adults. Several studies have shown that aging leads to a decline in auditory functions needed to perceive speech in noise, including temporal envelope processing (Füllgrabe et al., 2015), duration discrimination (Gordon-Salant, 2006; Gordon-Salant & Fitzgibbons, 1999), gap detection (Ozmeral et al., 2016; Snell & Frisina, 2000), and temporal fine structure resolution (Füllgrabe et al., 2015; Grose & Mamo, 2010, 2012; Hopkins & Moore, 2011; Schoof & Rosen, 2014). In the presence of hearing loss, some auditory perceptual abilities are further impacted, such as spectral envelope perception (Glasberg et al., 1984; Lentz & Leek, 2003), frequency selectivity (Glasberg & Moore, 1986), spatial hearing abilities (Gallun et al., 2013), temporal envelope perception (Fitzgibbons & Wightman, 1982), and temporal fine structure resolution (Buss et al., 2004; Reed et al., 2009). In addition to auditory perceptual deficits, it is common to see cognitive declines with age, and several studies have shown links between poor cognition and speech reception in older listeners with hearing loss (Füllgrabe et al., 2015; Füllgrabe & Rosen, 2016; working memory: Humes & Dubno, 2010; Meister et al., 2013; Rönnberg et al., 2013; Schoof & Rosen, 2014); however, these links are typically secondary to effects of hearing loss alone (Akeroyd, 2009). Similarly, aging is associated with increased listening effort when processing speech in noisy environments (Degeest et al., 2015; Zekveld et al., 2011).
Despite these general trends with aging and hearing loss, several studies report no age-related changes in one or more of these perceptual abilities (e.g., Lentz et al., 2022) perhaps due to considerable individual differences in the population under study. Large individual differences in older adults have been previously reported for suprathreshold perceptual tasks, including for temporal processing abilities, as measured by amplitude modulation detection thresholds (Bharadwaj et al., 2015), and frequency selectivity, as measured by notched noise masking and psychophysical tuning curve methods (Lutman et al., 1991; Tyler & Tye-Murray, 1986), though it is not fully determined that age alone is the main cause for the deficit in either domain. The goal of the current study was to take an initial step toward establishing characteristic profiles in older individuals with and without hearing loss and assess how different individual groups from the same population may differ in their auditory perceptual and cognitive deficits. The primary rationale for developing more comprehensive characteristic profiles is that even if two individuals show the same degree of hearing loss, deficits in auditory perceptual and cognitive abilities can be present at varying degrees and may affect rehabilitation outcomes. Indeed, modern premium hearing aid technology performs poorly in noise for some listeners with hearing loss (Abrams & Kihm, 2015), and without knowing the listeners’ suprathreshold perceptual or cognitive deficits, targeted treatments may not be as effective.
Because of the links mentioned above between cognition and hearing deficits, there has been a recent effort to better characterize individual patients in the clinic regarding not only their measurable hearing challenges but also their cognitive abilities so that we may target treatment strategies on an individual basis. The potential diagnostic value of measuring individual auditory perceptual and cognitive abilities is to link and provide tailored treatment options that may overcome poor uptake of hearing devices and other aural rehabilitation. Ultimately, the goal is to be more precise in our treatment strategies by considering standard measures of hearing in addition to measures that have greater depth than an audiogram, such as a listener's spectro-temporal processing abilities or working memory capacity (WMC). This approach should identify individual strengths and weaknesses of a patient, and then tailor treatment goals and methods to those abilities. The first step in this process is to determine the degree to which those differing abilities can be identified and possibly grouped along common profile dimensions, and then ultimately, to match those grouped patient abilities to the most effective treatment methods. To do so, an abbreviated yet robust test battery in the clinic should be used to assess auditory perceptual and cognitive abilities. We have adopted a battery of tests and administered them using a tool that lends itself well to future clinical use, the portable automated rapid testing (PART) platform (Gallun et al., 2018). PART is a tool consisting of user consumer electronics that includes standard test batteries of auditory perceptual and cognitive measures that are sensitive to deficits related to age and hearing loss (Larrea-Mancera et al., 2020). Srinivasan et al. (2020) have demonstrated that assessment of spatial release from masking (SRM), for example, via PART produces results that are similar to those obtained with traditional laboratory equipment. The validity of PART in measuring auditory perceptual (Larrea-Mancera et al., 2020) and cognitive (Larrea-Mancera et al., 2022) abilities has also been established. In parallel research, Sanchez-Lopez and colleagues (e.g., Sanchez-Lopez et al., 2020) have focused on identifying different auditory profiles from various psychoacoustic measures alone, mostly presented through a modular framework for psychoacoustic experiments (e.g., in MATLAB).
In this current study, the approach is complementary to other efforts to develop precision audiology but has the advantage of ease of implementation from using an abbreviated test battery, as opposed to longer test batteries (Humes et al., 2013; Watson et al., 1982). In a companion study (currently under review), each constituent auditory and cognitive ability was compared to younger individuals with normal hearing. Here, advanced analysis methods were used to determine whether two or more profiles could be identified from each of the groups of older adults—the group with normal hearing and the group with hearing loss. If two or more profiles existed, then analyses considered which of the constituent measures distinguished among the profiles. Specifically, we asked whether individual profiles could be identified among ONH and OHL adults based on select candidate measures of auditory perceptual and cognitive abilities.
Methodology
Participants
The data were collected from participants in a previous study (currently under review) that analyzed group effects of auditory perceptual and cognitive performance for younger and older adults with normal hearing, and older adults with hearing loss. In this study, we included 20 older adults with normal hearing (ONH; 5 males and 15 females; mean age = 65.55 years old; SD = 6.17; min = 56; max = 75) and 20 older adults with hearing loss (OHL; 7 males, 13 females; mean age = 68.7 years old; SD = 8.43; min = 52; max = 79), that were native English speakers. The ONH listeners had clinically normal audiometric hearing, defined as pure tone thresholds ≤25 dB HL from 250 to 6000 Hz and thresholds ≤40 dB HL at 8000 Hz. The OHL listeners had symmetrical (≤10 dB asymmetry at each frequency between 1000 and 6000 Hz), mild, gently sloping-to-moderately severe sensorineural hearing loss that was ≤70 dB HL at 6000 and 8000 Hz. Participants were administered the Montreal Cognitive Assessment (MoCA; Nasreddine et al., 2005) and achieved a score of >26. Exclusion criteria included middle ear dysfunction, a significant history of otologic or medical conditions (e.g., history of retrocochlear disease, ear surgery, head injury), or cognitive impairment as screened using the MoCA.
Written informed consent was obtained as approved by the Institutional Review Board at the University of South Florida and all listeners were compensated for their participation in the study.
Study Visits
Intake Visit
An initial intake visit included informed consent, otologic and medical history questionnaires, otoscopy, air conduction and bone conduction pure tone thresholds, immittance testing, loudness discomfort levels, the word identification in noise (WIN, Wilson et al., 2007), and the MoCA. As stated above, some of these measures were used to assess inclusion and exclusion criteria.
The duration of this visit varied between 1 and 1.5 hr. Immittance testing was performed to assess middle ear status and function using a GSI Tympstar Pro (Grason-Stadler, Inc.) and included tympanometry (Y, 226 Hz) and acoustic reflexes performed at 500, 1000, and 4000 Hz bilaterally. A GSI Audiostar Pro (Grason-Stadler, Inc.) was used to measure air conduction pure tone thresholds from 250 to 8000 Hz, bone conduction thresholds from 250 to 4000 Hz, loudness discomfort levels at 500, 1000, 2000 and 4000 Hz and WIN bilaterally.
Test Battery Visit
A separate study visit included the Acceptable Noise Level (ANL) and the PART battery. The ANL (Eddins et al., 2013; Nabelek et al., 2006) is slated to be added to the PART battery in the near future; however, the present study conducted the ANL using custom MATLAB (Mathworks, Inc.; Natick, MA) software on a PC. The duration of this visit was approximately 1–1.5 hr. The PART battery was self-administered using an iPad (Apple, Inc.) and calibrated Sennheiser HD 280 Pro-supra-aural headphones, and the participant was seated in a sound-attenuating booth during testing. Calibration was performed using an iBoundary microphone and a sound level meter running from the National Institute for Occupational Safety and Health tablet application, following the calibration routine of Gallun et al. (2018). The tasks (described in detail below) ran consecutively and in the same order, with written instructions before each task appearing on the iPad to introduce the test and what the participant should expect to see, hear, and do. For every element of the test battery, parameters were chosen based on normative studies (Gallun et al., 2018; Hoover et al., 2019; Jakien et al., 2017; Larrea-Mancera et al., 2020) with a few minor modifications noted below.
Except for the SRM and cognitive tasks, performance on the perceptual measures was assessed using a four-interval, two-alternative forced-choice method. The participant was informed that on each trial, four squares would appear and would light up concurrently with a sound presented. In the sequence, the first and fourth intervals were considered anchor or reminder intervals and always had the characteristics of the standard sound in the task. The target or “signal” sound to be identified was present in either the second or third interval at random. The basic task was to pick the interval with a sound that was different in some way from the other three intervals. Each interval was 400 ms in duration with a 400-ms interstimulus duration. A practice session with 10 fixed trials and associated subject responses, followed by a break of 10–20 s, preceded each task, except the SRM task and cognitive tasks, which are described in detail below. The independent variable in each task was varied adaptively using a 3-down, 1-up staircase procedure with task-specific starting values and step sizes, estimating the threshold at 79.4% correct (Levitt, 1971). Visual feedback was provided after the subject response in each trial. Feedback for correct responses consisted of a green box background and a “✓” sign label in the correct interval. Feedback for incorrect responses consisted of a red box background and a “X” sign label in the correct interval. Target levels for each task were 65 dB speech presentation level (SPL) for individuals with normal hearing, similar to prior studies using similar stimuli and tasks (e.g., Hoover et al., 2019; Jakien et al., 2017), except the temporal envelope perception task, which was 75 dB SPL (Eddins et al., 2020). Target levels were 75 dB SPL for individuals with hearing loss to ensure audibility.
For the ANL task (Eddins et al., 2013; Nabelek et al., 2006), prerecorded stimuli were played through an RZ6 Multiprocessor (TDT; Tucker-Davis Technologies) and delivered via RadioEar DD450 circumaural headphones. In this task, a monologue spoken by a male talker was presented at a fixed level of 65 dB SPL. Participants were asked to adjust the level of a background noise (background noise level, or BNL) composed of 12-talker babble. They made the adjustments in the BNL relative to the monologue in three steps. First, to a level that was “too loud to understand speech.” Then to a level that was “soft enough for the speech to be very clear.” Finally, they adjusted the BNL to the “maximum level that they would be willing to put up with for a long time while listening to the story.” The ANL threshold was obtained by subtracting the final measured BNL (step 3) from the speech presentation level (65 dB SPL), similar in concept to the signal-to-noise ratio.
Frequency Selectivity Index (FSI): This task included two conditions in which a 2000 Hz target tone is presented at a fixed level in the presence of a narrowband masking noise centered on 2000 Hz. The masking noise was varied in level to establish a masked threshold. In the “No-Notch” condition, the noise had a continuous spectrum over the range from 1600 to 2400 Hz for the ONH, yielding a bandwidth of 800 Hz, and 1200 to 2800 Hz for the OHL, yielding a bandwidth of 1600 Hz.1 In the “Notch” condition, the masker was comprised of a lower noise band from 800 to 1600 Hz and an upper noise band from 2400 to 3200 Hz, which produced a spectral notch 800 Hz wide centered on 2000 Hz. The difference between the two conditions represents an index of frequency selectivity (Glasberg et al., 1984; Patterson et al., 1982), or an estimate of the relative bandwidth of an auditory filter at the target frequency.
Tone-In-Noise (No-Notch): The No-Notch condition alone represents a tone-in-noise task. This measure has inherent value in terms of a value termed the critical ratio, the ratio of the power of the signal at threshold to the power of the masking noise, which indexes efficiency for listening in noise.
Temporal envelope perception: In the masked temporal gap detection (MTGD) task (Eddins et al., 2020), the target interval contained a silent temporal gap at the temporal center of the 400-ms noise stimulus and the standard intervals did not contain a gap. The duration of the temporal gap was varied adaptively to establish the shortest detectable gap duration. For the ONH, the gap was imposed on a broadband noise that was then filtered to a 1-octave passband from 1414 to 2828 Hz. The depth of the gap was 0.75 times the nominal amplitude. A wider 2-octave masker band, from 1000 to 3000 Hz, was presented at a 12 dB SNR (masker-to-masker ratio) to prevent spectral cues during the gap on- and offsets. The OHL group was tested with MTGD parameters including a carrier bandwidth of 0.5 octaves centered at 2000 Hz (1682 to 2378 Hz) and a noise masker with a bandwidth of 1.0 octave (1414 to 2828 Hz).2
Temporal fine structure (TFS): Diotic frequency modulation (FM) detection was tested using a carrier tone (500 Hz ± 40 Hz) that was modulated (2 Hz) simultaneously in both ears. The minimum modulation depth required to detect the modulation was used as an index of TFS coding (Hoover et al., 2019).
Temporal fine structure (Binaural): Dichotic FM parameters are similar to those of the Diotic FM task, with the exception of the carrier tone (500 Hz ± 40 Hz) being modulated (2 Hz) with an inverted modulator phase (out-of-phase) between the two ears. The minimum modulation depth required to detect the modulation was used as an index of binaural TFS coding (Hoover et al., 2019).
Spectro-temporal processing: Spectral modulation can be measured separately in terms of modulation density (cycles per octave; cpo), and temporal modulation can also be measured in terms of modulation rate (cycles per second; Hz). Spectro-temporal modulation (STM) envelope detection was measured with a 4 Hz temporal modulation (characteristic of syllabic rate; Chi et al., 1999) and two cpo spectral modulation (characteristic of vowel spectra; Chi et al., 1999) with a 1.5 octaves wide noise carrier centered at 2000 Hz. The starting phase of temporal modulation was fixed to produce spectral modulation that shifted downward in frequency over time (Bernstein et al., 2013; Chi et al., 1999), and the modulation depth (dB) was measured.
Spatial release from masking: The SRM task included target and masker sentences from the coordinate response measure (CRM) corpus (Bolia et al., 2000) with virtual spatialization via generic head-related transfer functions. The CRM corpus consists of sentences in the form of “Ready (CALL SIGN) go to (COLOR) (NUMBER) now,” with eight possible call signs: Arrow, Baron, Charlie, Eagle, Hopper, Laker, Ringo, or Tiger; four possible colors: red, green, white or blue; and numbers 1 through 8 except 7. All possible combinations were spoken by four male talkers. In (a) the co-located condition, the target was co-located (0° azimuth) with two masker sentences, whereas in (b) the separated condition, the maskers were spatially separated symmetrically at ±45° in azimuth from the target. A progressive step procedure was used, and it included 20 trials with maskers progressing in level from 55 to 73 dB SPL in 2 dB steps every two trials (Gallun et al., 2013). The level of the target was fixed at 65 dB SPL and the levels of the maskers were varied adaptively to obtain the target-to-masker ratio corresponding to 50% correct color and number identification. The difference in the target-to-masker ratio (dB) at the threshold between co-located and separated thresholds yielded an SRM measure and reflected the benefit derived from the spatial separation of the target and masker sentences. Participants were always asked to follow the instructions of the target voice with the call sign “Arrow” followed by a color and a number, while ignoring the other talkers with other call signs calling for other colors and numbers. The practice session for this task included 10 fixed trials with the absence of background babble, to assure understanding of instructions.
Fluid intelligence: The University of California Matrix Reasoning Task (UCMRT) is an abbreviated version of Raven's Progressive Matrices (Raven & Court, 1998) that measures fluid intelligence and reflects the ability to use WMC. The UCMRT (UCMRT; Pahor et al., 2019) is a timed task (10 min) that includes Raven-like matrix problems where the participant is asked to identify the missing item that completes a specific pattern shown in a 3 × 3 grid, chosen from eight possible answer choices. The correct answer choice should complete the 3 × 3 matrix with the correct item shape, orientation, and color. The task included 23 test problems, and the number of correct responses (Hits) was recorded. UCMRT includes six practice problems including an explanation for the correct choice, and 23 test problems. In both the practice and test, participants received feedback (correct/incorrect). The final score on this task represents the total number of Hit (correct) responses.
Working memory: Corsi block-tapping test (Corsi, 1972) includes an array of square blocks distributed asymmetrically on the screen. A specific number of square blocks light up in a random order, each for 1.5 s, and the participant is prompted to tap the blocks in either the same order (Forward condition) or reverse order (Backward condition) that they were presented, depending on the condition. After every correct response, the number of blocks to tap increased, and the final score represents the number of items or squares remembered (i.e., the longest sequence length with at least one correct score) on each condition.
Statistical Analysis
Because possible interindividual differences with age were the focus of this study, a cluster analysis was used to determine whether a group of 20 ONH and a group of 20 OHL listeners could be parsed into separate sub-groups based on their relative performances on the perceptual and cognitive tasks. Clustering could help identify differences between groups in the auditory perceptual and cognitive measures by identifying patterns in thresholds within each cluster; for example, one cluster of listeners could show poor spectro-temporal sensitivity, whereas another cluster could show the opposite. Each measure was normalized (z-scores) before submitting to the cluster analysis in RStudio. To limit the number of duplicate variables, we included Co-located SRM and SRM, No-Notch, and FSI in the cluster analysis (excluding Notch and Separated SRM). Many cluster indices exist that evaluate the data in closely similar methods but may suggest and identify different optimal number of clusters, called the “k-value.” Therefore, we evaluated the most used cluster indices (Liu et al., 2010) to identify the k-value proposed by the majority. Each cluster index is explained in detail in Charrad et al. (2014), where the author also explained the importance of having an algorithm that runs through multiple cluster validation indices and evaluates their common results. The function in R that includes these cluster indices is based on the Ward2 method (Ward, 1963) that is based on the sum-of-squares criterion and Euclidean distances. Finally, the formation of the clusters with the multiple data points is based on the K-means clustering method, which is an unsupervised machine learning algorithm that groups similar data points and looks for patterns in auditory perceptual and cognitive performance between and among individuals. This method groups similar data points among the clusters and identifies each participant's corresponding cluster; in other words, their characteristic profile. To evaluate the presence of perceptual and cognitive differences among and between ONH and OHL groups, we conducted separate cluster analyses for each group. A secondary cluster analysis was also conducted with both groups together, which will be discussed below.
Results
Descriptives of ONH and OHL
Mean audiometric thresholds are shown in Figure 1 for the ONH (gray dashed lines) and OHL (gray solid lines) groups. Air conduction pure tone thresholds are shown for the left ear (blue) on the left panel and for the right ear (red) on the right panel. The average threshold across participants at each frequency is shown in colored dashed lines for ONH and colored solid lines for OHL for each ear. The design of this study was based on these two categories of “normal hearing” and “hearing loss,” in accordance with cutoffs used in clinical practice.

Audiometric pure tone thresholds (dB HL) as a function of frequency (Hz) for ONH (dashed) and ONH (solid). Bold colored lines represent the average thresholds for ONH (light blue/red and dashed) and OHL (dark blue/red and solid) for the left (blue) and right (red) ears. The gray background in both graphs represents the range for audiometrically normal hearing sensitivity.
The four-frequency pure tone average (PTA4) was calculated from the average of ear-specific thresholds at 500, 1000, 2000, and 4000 Hz. For the ONH group, the PTA4 was 11.75 (SD = 4.26) dB HL for the left ear and 10.38 (SD = 4.04) for the right ear. For the OHL group, the PTA4 was 33.6 (SD = 6.9) dB HL for the right ear, and 32.4 (SD = 7.2) dB HL for the left ear.
The data for ONH and OHL is shown in Table 1, with measures separated by rows, and columns showing descriptive statistics for each auditory perceptual and cognitive measure. In the companion study (currently under review), each constituent auditory and cognitive ability was compared to younger individuals with normal hearing.
Summary of Mean Thresholds, Standard Deviation, and Values for ONH and OHL on the Clinical, Auditory Perceptual, and Cognitive Tasks.

Global Profiles From Older Listeners With Normal Hearing and Hearing Loss
A total of 26 of the most common and validated cluster indices were analyzed based on the clustering approach described in the Methods section to develop clusters or global profiles among the ONH and OHL individuals combined. A summary of the multiple cluster indices, or algorithms, assessed in the cluster analysis is shown in Table 2, along with the number of clusters each index proposed. When clustering both ONH and OHL together, among all cluster indices, two proposed k = 0, one proposed k = 1, six proposed k = 2, two proposed k = 3, two proposed k = 4, seven proposed k = 5, and six proposed k = 6, with k representing the number of clusters. Therefore, we followed the majority rule for deciding the optimal number of clusters (Chouikhi et al., 2015), which was k = 5.
Cluster Indices Used and the Number of Clusters (k) Proposed by Each index for the ONH and OHL Groups Separately and Combined.

The goal of clustering was to investigate patterns in the results of the test battery so that differences and similarities in perceptual and cognitive abilities could be identified. K-means clustering was applied, which grouped similar data points and looked for those patterns, given k = 5. Since there were 12 test measures included in the cluster analysis, the number of possible dimensions was 12, which poses a visualization challenge. To meet that challenge, the number of dimensions used for visualization was reduced to two dimensions via principal components analysis (PCA). This is a similar approach to other studies that performed cluster analysis also using R functions and used PCA for dimension reduction for visualization purposes (e.g., Aletta et al., 2020; Jo & Jeon, 2021). This allowed the visualization of the 12 measures for the five clusters in two dimensions, along with the contribution of each measure to the PCA visualization and the separation of the profiles provided in Figure 2.

Cluster plot with all individuals from both ONH and OHL groups in a two-dimensional view. Individuals located in the gray rectangle covering the right side of the cluster plot are ONH listeners, with the exception of those in three gray circles within that rectangle, which are OHL listeners.
In the upper right panel of Figure 2, five clusters were identified from the merged ONH and OHL data. The five main clusters, coded by color, are shown as profiles and the corresponding number of subjects in each cluster is provided here: Profile 1 (red cluster; n = 3), Profile 2 (yellow cluster; n = 16), and Profile 3 (green cluster; n = 7), Profile 4 (blue cluster; n = 6), and Profile 5 (purple cluster; n = 8). The horizontal and vertical axes represent the resulting two dimensions obtained from the PCA. Because measures were reduced to two factors, the contribution of each measure to the clustering is shown in the bar graphs below the x-axis for PC factor 1 and to the left of the y-axis for PC factor 2. The contributions are represented by percentages, and they are arranged in order from the measure with the highest contribution (CorsiBw in PC1 and ANL in PC2) to that with the lowest contribution (CoSRM in PC1 and CorsiFw in PC2).
A one-way ANOVA was performed on the absolute (nonnormalized) thresholds for each profile and revealed significant differences between the profiles in ANL (F(4,35) = 8.25, p < 0.001), FSI (F(4,35) = 5.04, p = 0.003), STM (F(4,35) = 3.30, p = 0.02), diotic FM (F(4,35) = 2.97, p = 0.033), SRM (F(4,35) = 13.29, p < 0.001), MTGD (F(4,35) = 10.97, p < 0.001), CorsiFw (F(4,35) = 8.52, p < 0.001), CorsiBw (F(4,35) = 5.73, p = 0.001), and in the partial measures No-Notch (F(4,35) = 4.45, p = 0.005), Notch(F(4,35) = 4.39, p = 0.006), CoSRM(F(4,35) = 6.26, p < 0.001), SepSRM(F(4,35) = 10.62, p < 0.001). Additionally, PTA4 differences between the five profiles were nonsignificant (F(4,35) = 1.99, p = 0.118).
Tukey's post hoc analyses were performed for multiple corrections and to further identify which measures yielded significant differences after the profiles were identified. PTA4 showed nonsignificant differences between any of the profiles (p > 0.05). However, although clustered into different profiles, ONH individuals were mostly clustered toward the right, and OHL toward the left of the two-dimensional graph.
Since there are five profiles, we will initially focus on the measures that contributed the most to the identification of profiles. ANL contributes the most to PC2, and post hoc analyses showed that Profile 4 (located on the bottom right of the graph) had significantly poorer ANL scores compared to the profiles located toward the top of the graph, such as Profile 2 (p < 0.001), Profile 3 (p < 0.001), and Profile 5 (p = 0.002). Profile 4 had the highest, and therefore poorest, ANL scores, showing a significant difference with all other profiles, except a nonsignificant difference with Profile 1 which had the second highest ANL scores.
CorsiBw and STM contributed to separating Profile 1 (bottom left) and Profile 4 (bottom right) by looking at PC1, with Profile 4 showing significantly better STM (p = 0.019) thresholds and Corsi Bw (p = 0.008) scores. Profile 1 is shown to be the profile with more auditory perceptual (STM, MTGD, ANL) and cognitive (CorsiBw) deficits compared to the others. Profile 1 also shares low STM and cognitive scores with Profile 5 on the same PC1 plane which has the poorest SRM abilities compared to all other profiles (p < 0.001), but is differentiated from Profile 4 by having significantly better ANL scores.
Moving closer to the middle of the graph, other measures become more prominent to the separation of the profiles, such as diotic FM, separating Profile 3 and Profile 5, with Profile 3 having better temporal processing (p = 0.017). FSI was another measure that isolated Profile 2, which had significantly better frequency selectivity than Profile 4 (p = 0.036) and Profile 5 (p = 0.004).
In summary, the profiles, and more specifically the individuals in these profiles, that are toward the right of the two-dimensional graph show better STM, CorsiBw, and SRM abilities, but poorer ANL scores when looking toward the bottom. Profiles and individuals toward the top of the graph show better ANL and MTGD scores from the auditory perceptual abilities and better UCMRT scores from the cognitive abilities. For those interested in assessing PCA before the cluster analyses, we also performed a PCA on the full dataset, interpreted the results, and provided a rationale for the analysis steps used in this study, which can be found in the Supplemental Materials.3
Profiles and Individual Patterns of ONH Listeners
A similar process as the one described above was used to identify the optimal number of clusters for ONH only. As described in the Methods and previous section, K-means clustering was also applied, and the same steps were followed to obtain distinct profiles within the ONH alone. Another PCA was also conducted after the cluster analysis to visualize the profiles in two dimensions. As shown in Table 2, we followed the majority rule for deciding the optimal number of clusters (Chouikhi et al., 2015), which was k = 6. The resulting characteristic profiles and the contributions of every measure are provided in Figure 3. Upon visualizing the profiles, three “main” clusters were identified from the ONH data, along with other individuals not in clusters. The three main clusters, coded by color, are shown as profiles, and the corresponding number of subjects in each cluster is provided here: Profile NH-A (red cluster; n = 5), Profile NH-B (green cluster; n = 4), and Profile NH-C (dark blue cluster; n = 7). The contributions are arranged in order from the measure with the highest contribution (CorsiBw in PC1 and SRM in PC2) to that with the lowest contribution (STM in PC1 and CoSRM in PC2).
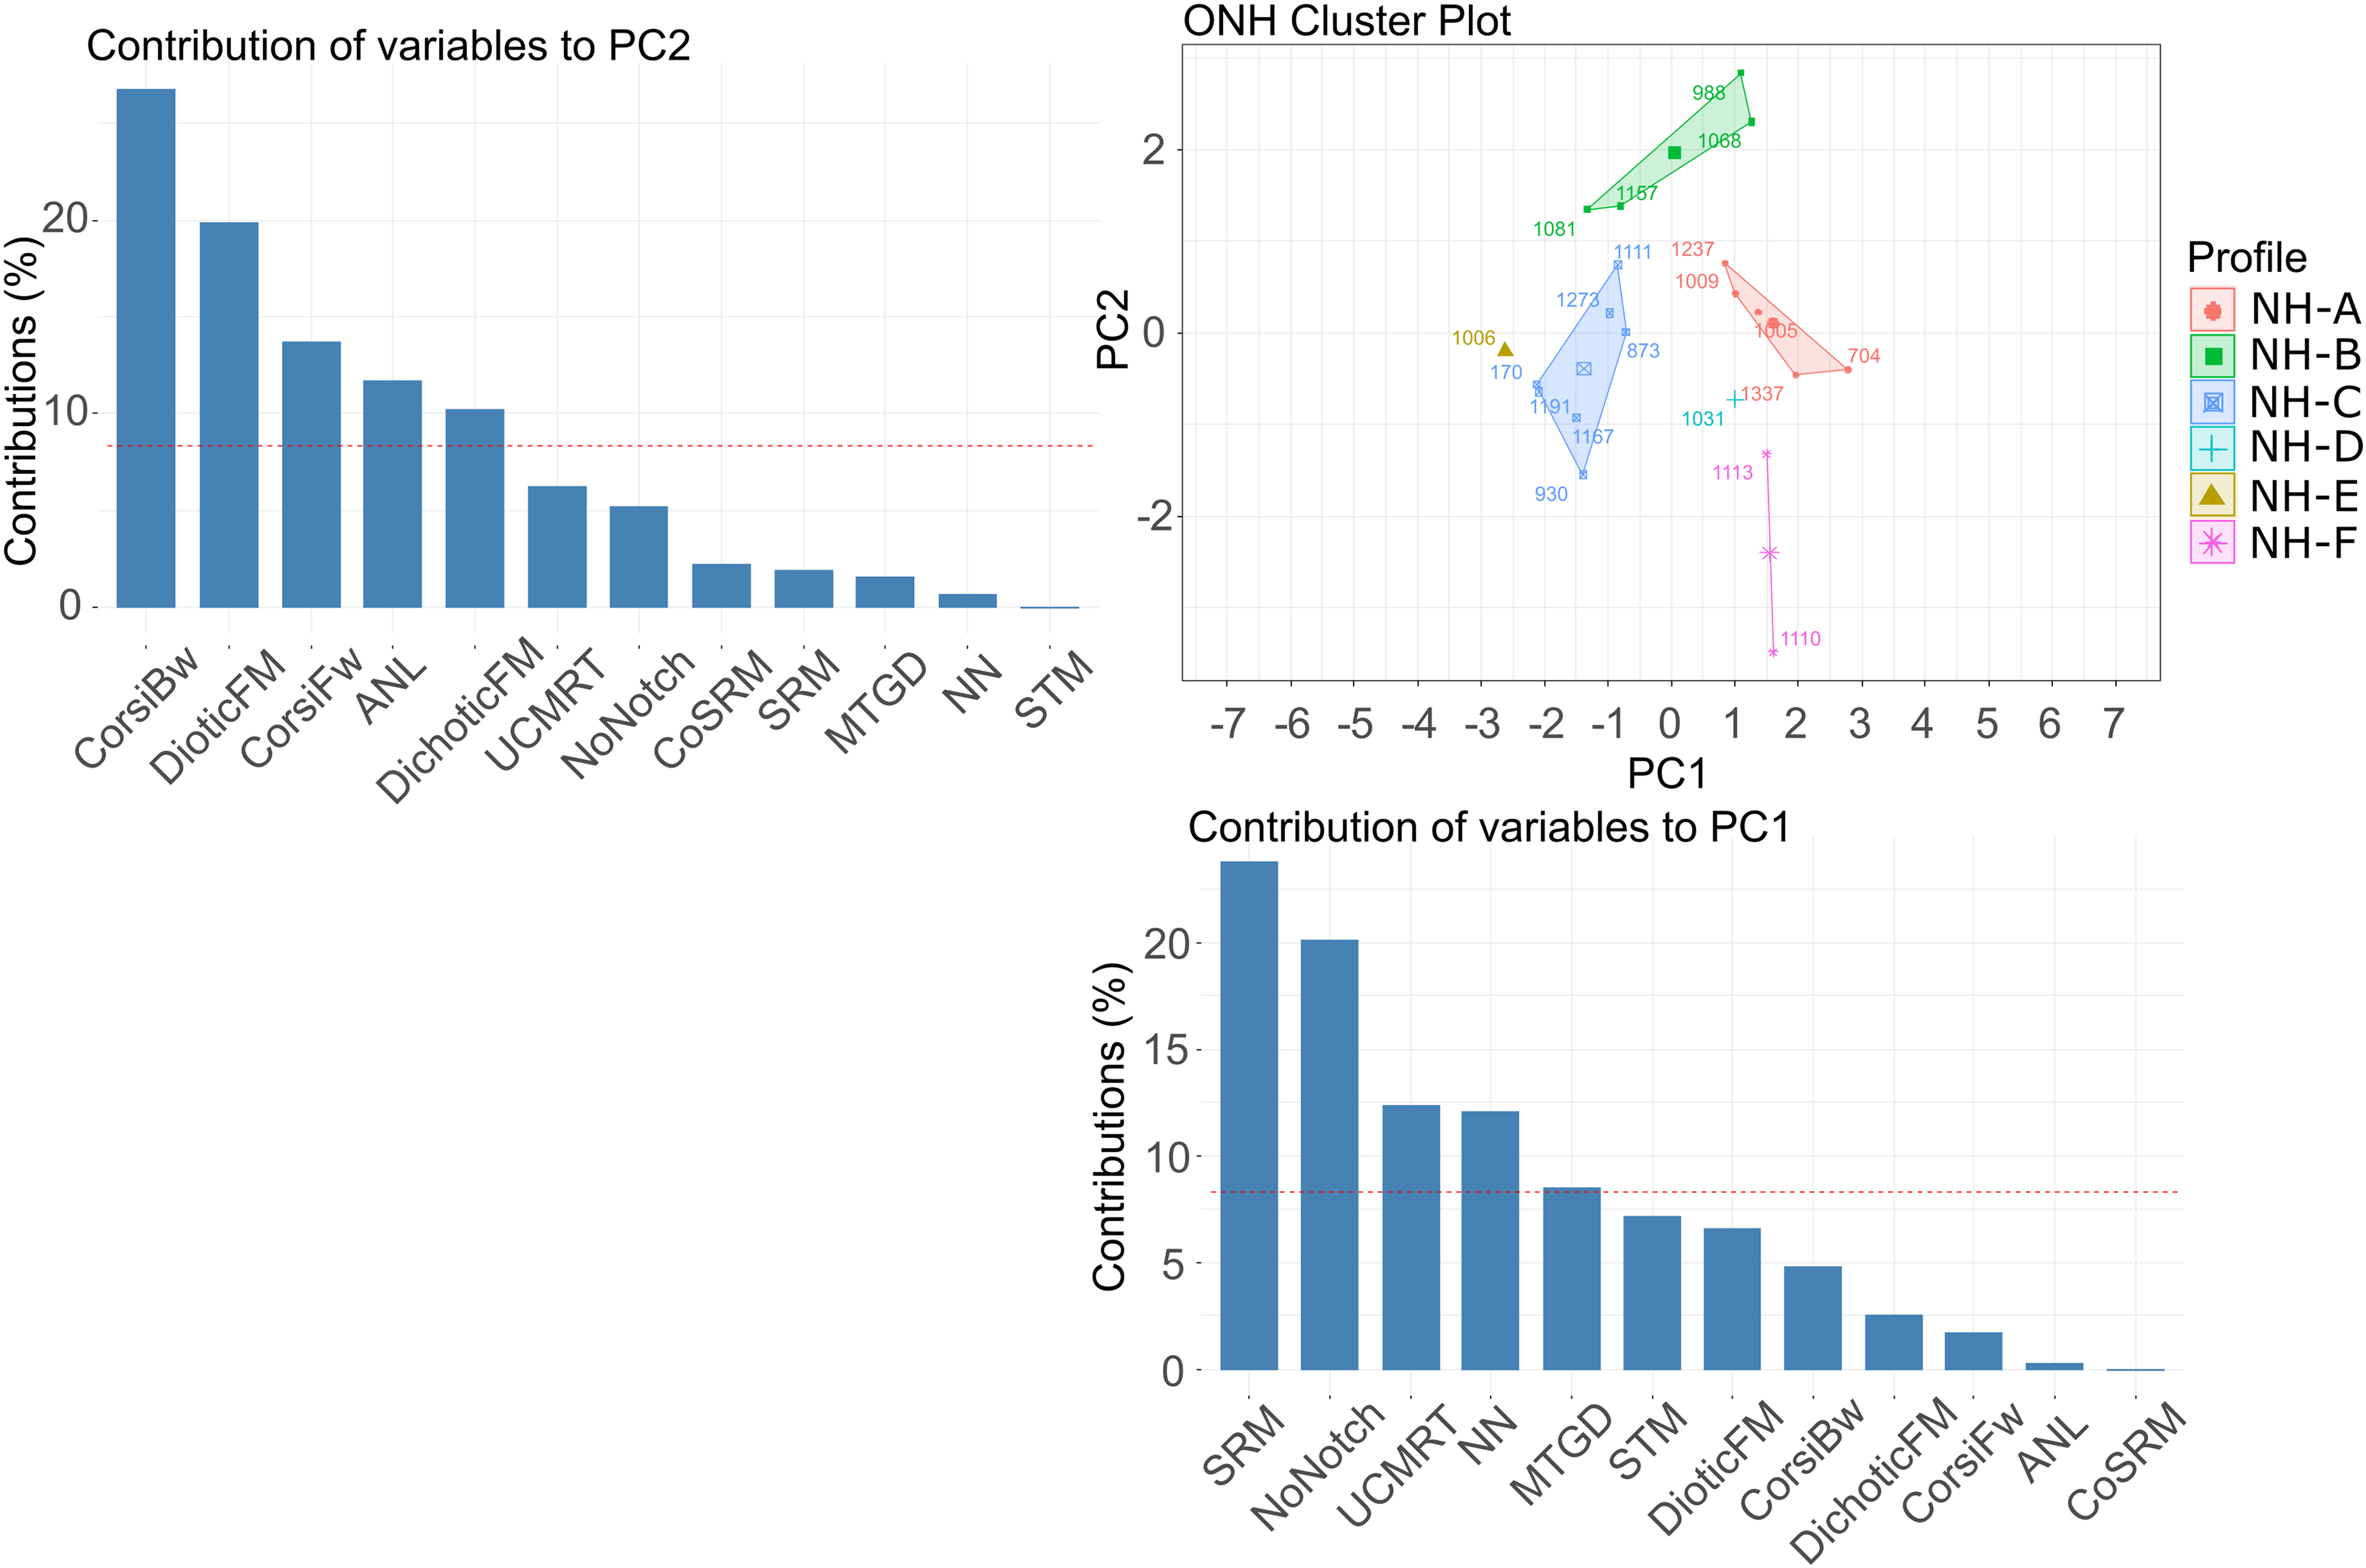
Cluster plot showing the three identified profiles for the ONH group with the participant numbers corresponding to each profile. The left upper and the right lower panels show the contribution percentage of each measure to each of the two dimensions (from the PCA) used to create the cluster plot.
As an attempt to identify characteristic profiles among the ONH group that are considered to have normal hearing based on standard clinical criteria, a one-way ANOVA was performed on the audiometric, perceptual and cognitive thresholds for each profile and revealed significant differences between the profiles in No-Notch (F(2,13) = 6.091, p = 0.014), dichotic FM (F(2,13) = 5.372, p = 0.02), sepSRM (F(2,13) = 12.845, p < 0.001), SRM (F(2,13) = 10.643, p = 0.002), and CorsiBw (F(2,13) = 14.548, p < 0.001). Differences in PTA4 between the three profile groups were nonsignificant (F(2,13) = 0.434, p = 0.657). Tukey's post hoc analyses were performed to further identify which measures yielded significant differences. The normalized mean thresholds in each auditory perceptual and cognitive measure for each profile are plotted in Figure 4, with bars and asterisks showing the significant differences between profiles across measures.

Summary plot of the mean normalized thresholds (z-scores) for each auditory perceptual and cognitive measure in each identified profile from individuals with normal hearing (ONH group). Lines and asterisks show the profiles that were significantly different in a given measure, as shown by the one-way ANOVA and Tukey's post hoc analyses.
From left to right in Figure 4, the post hoc comparisons indicate the following: For the perceptual measures, Profile NH-B showed the poorest performance on dichotic FM and CorsiBw than the other two profiles. However, Profile NH-B had higher SRM than Profile NH-C. Comparing Profile NH-A and Profile NH-C, Profile NH-A had better performance in No-Notch thresholds and SRM ability. For cognitive measures, all three profiles had different working memory abilities, the best being Profile NH-A, followed by Profile NH-C, then Profile NH-B, indicating the importance of cognition in distinguishing among the three profiles. The presence of significant differences between the profiles are indicated in the figure with asterisks, and again in bold in Table 3. The table summarizes the mean and standard deviation for every measure that had a significant difference between the profiles, in addition to Tukey's post hoc significance values.
Mean, Standard Deviations, and Significance Values for Post Hoc Analyses on the Auditory and Cognitive Measures Between Profiles NH-A, NH-B, and NH-C Among the ONH Group.
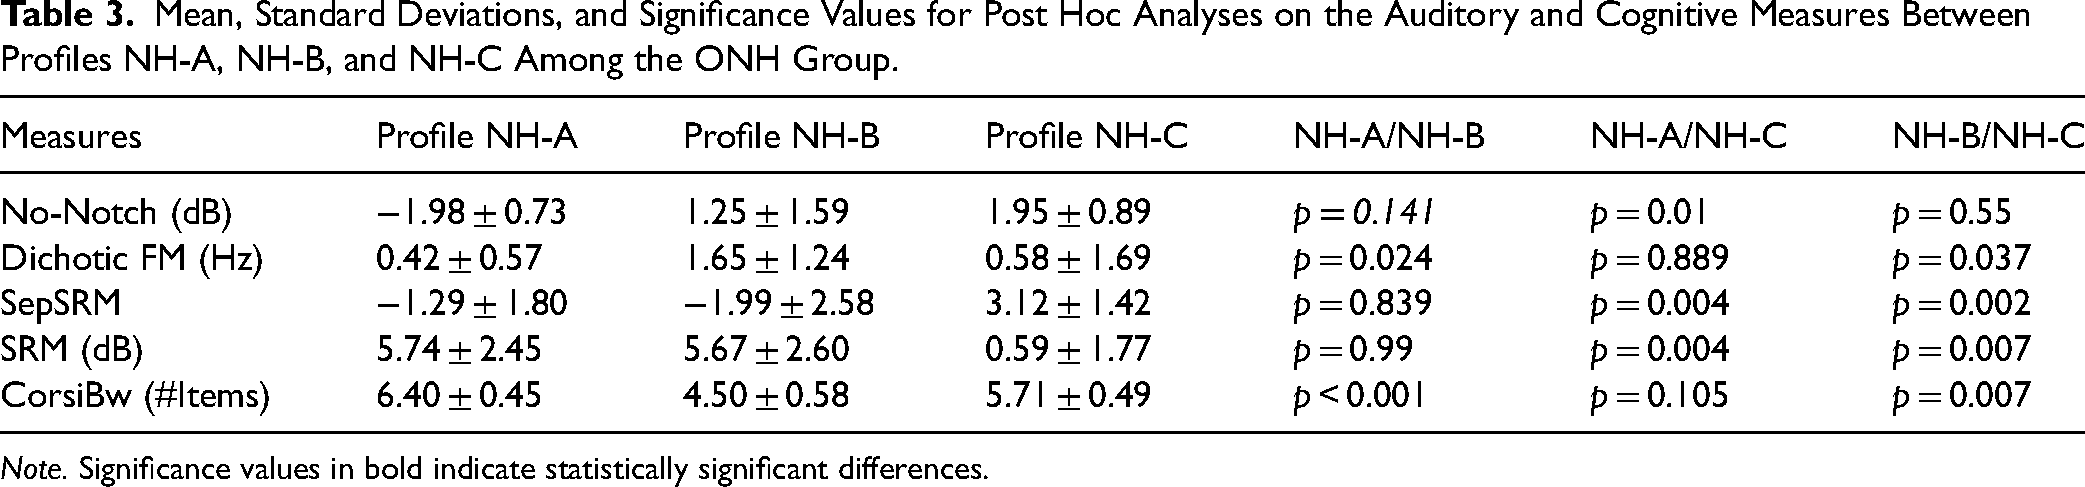
Note. Significance values in bold indicate statistically significant differences.
Profiles and Individual Patterns of OHL Listeners
The cluster analysis process used to identify the optimal number of clusters for OHL alone followed the same steps and logic to identify distinct profiles within the OHL group. Another PCA was also conducted to visualize the profiles in two dimensions. From Table 2, the chosen “k-value” by different indices ranged from 0 (no clusters identified) to 6 (six clusters identified). As shown in the table, six cluster indices proposed that the optimal number of clusters in the data is k = 3, as well as six other cluster indices that proposed k = 5. However, plotting the results with k = 3 showed three well-defined clusters shown in Figure 5, as opposed to k = 5 that included two clusters with 1 or 2 subjects in each, and especially given the number of participants in the data (n = 20), we plotted and analyzed the data with k = 3.
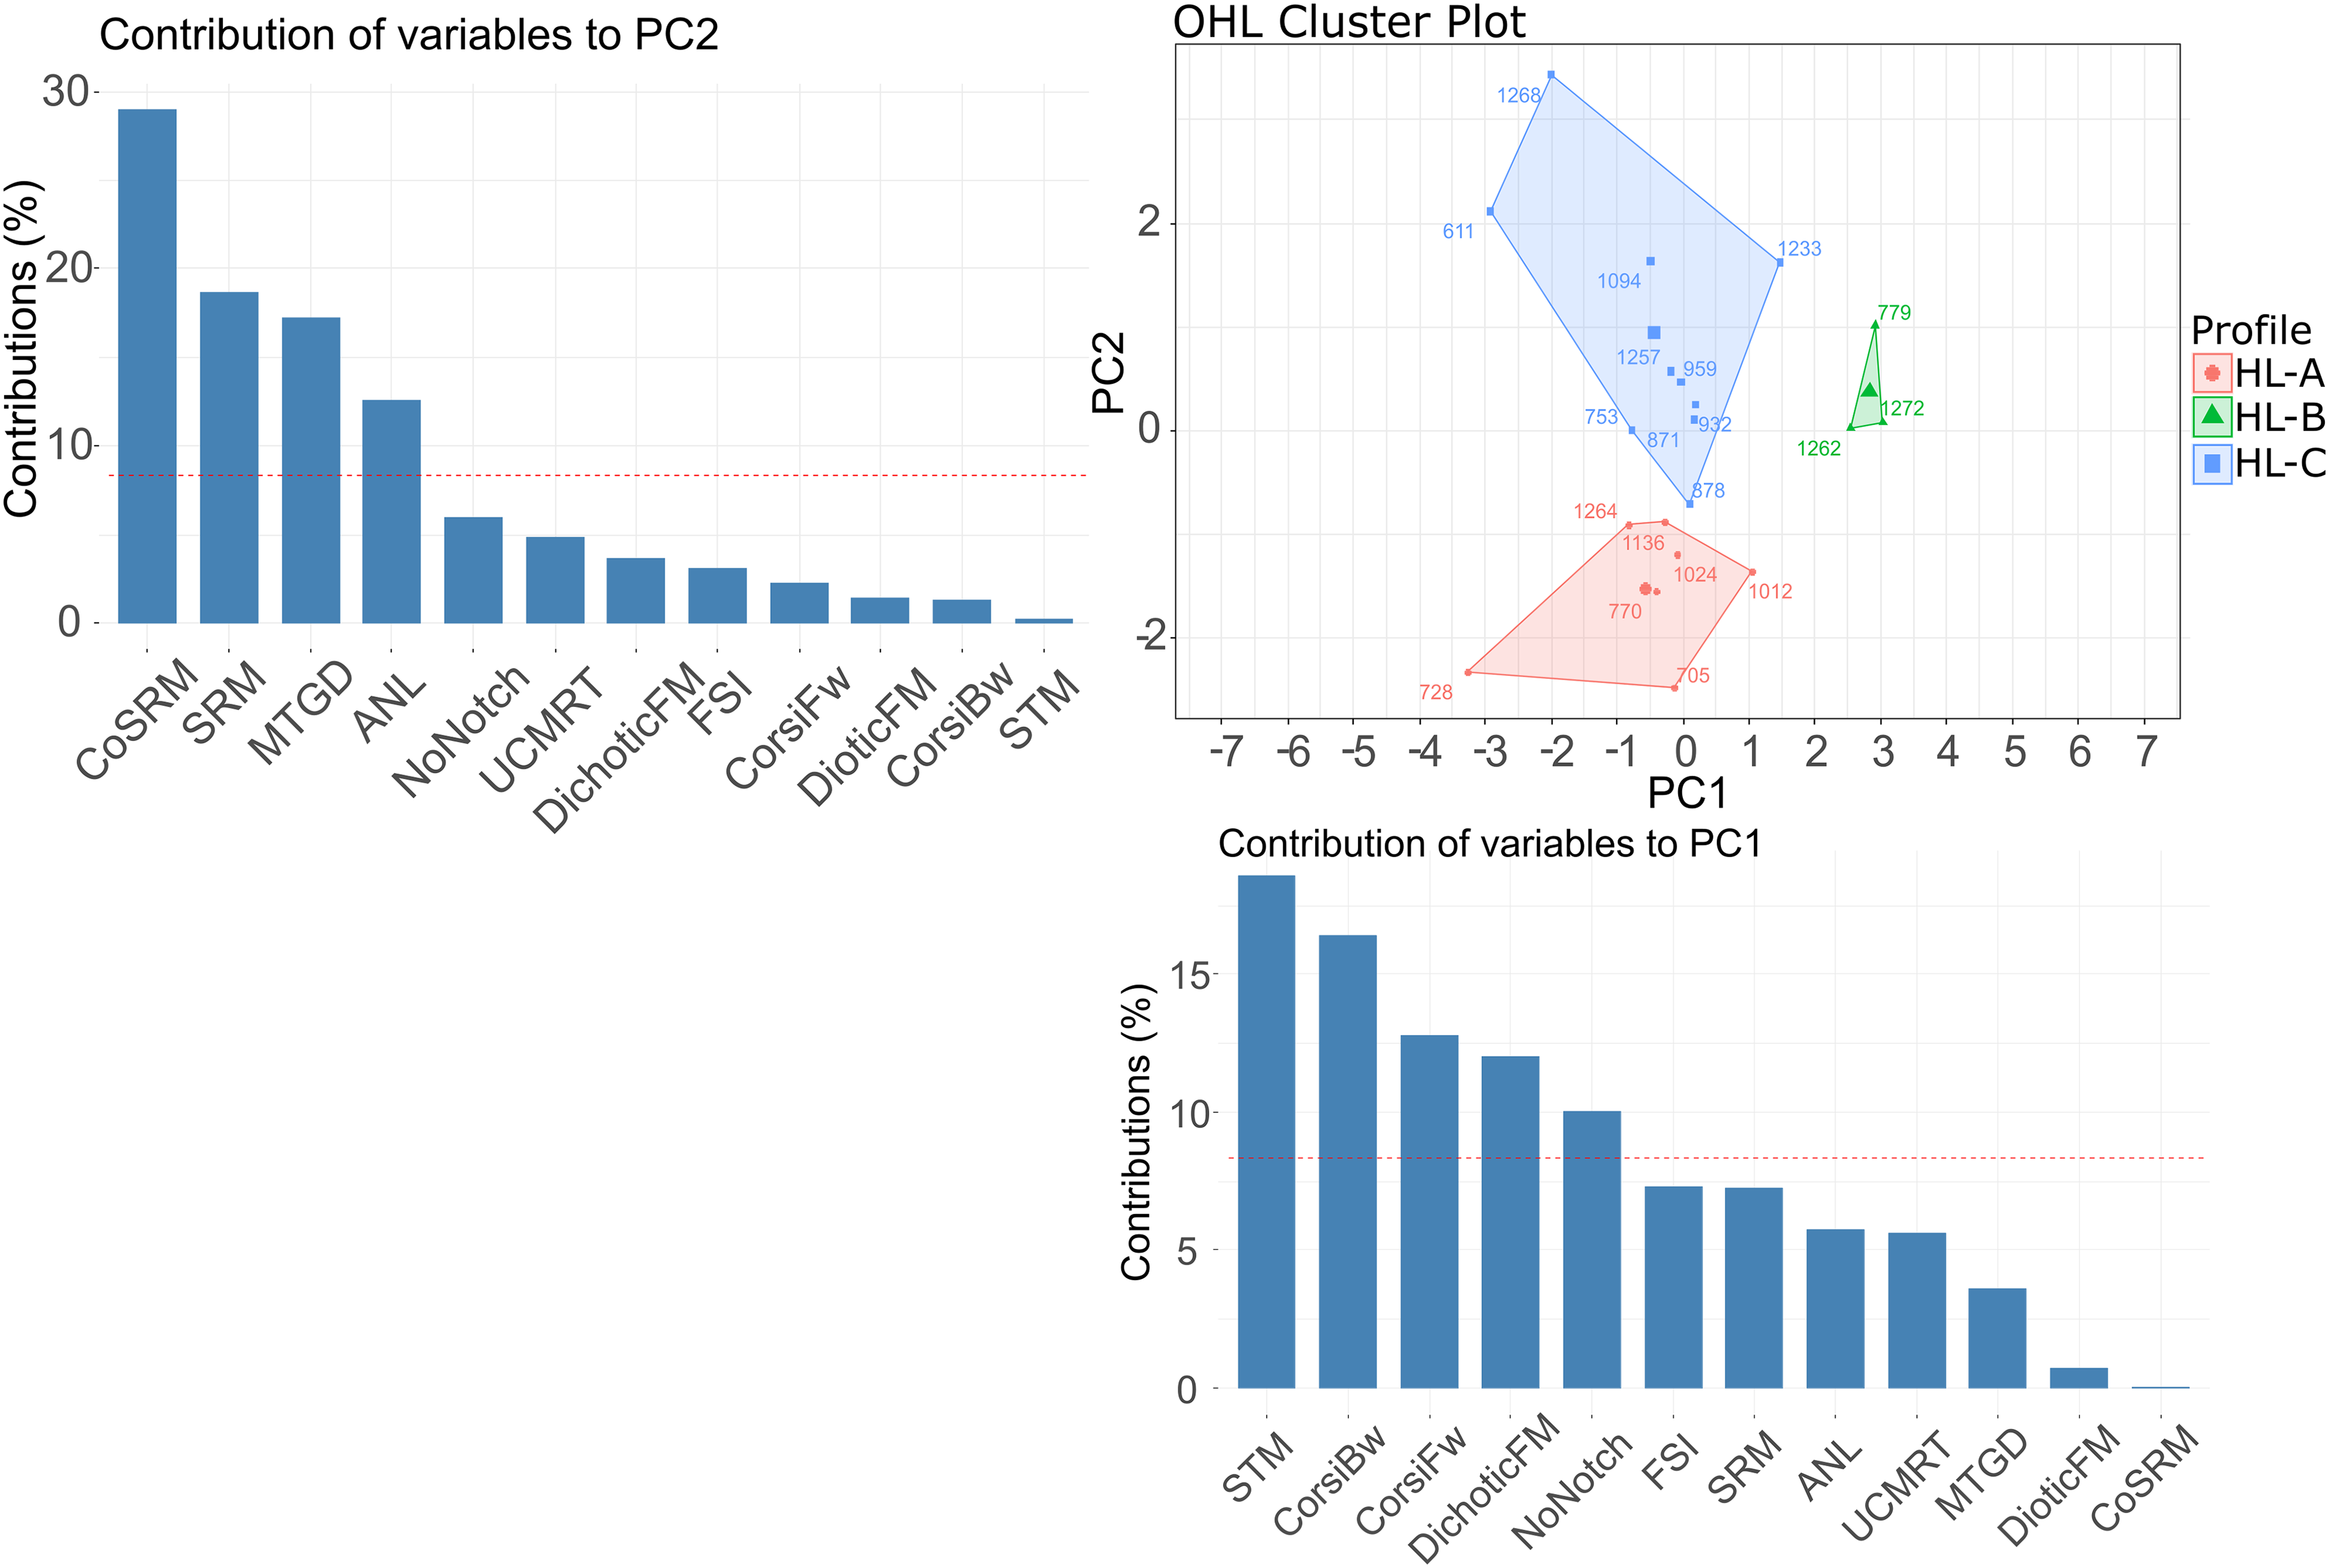
Cluster plot showing the three identified profiles for the OHL group displayed on a two-dimensional scale. The left upper and the right lower panels show the contribution percentage of each measure to each of the two dimensions (from the PCA) used to create the cluster plot.
Based on the analyses above, three profiles were revealed among the OHL group: profile HL-A (red cluster; n = 7), Profile HL-B (green cluster; n = 3), and Profile HL-C (blue cluster; n = 10), as shown in Figure 5. As shown in the bar graphs, the measures that contributed the most to the PCA visualization of OHL profiles were CoSRM and STM, followed by SRM and CorsiBw.
To further investigate the differences between the three profiles, performance on each auditory perceptual and cognitive measure was analyzed and compared among profiles. A one-way ANOVA showed significant differences on the following measures: ANL (F(2,17) = 4.43, p = 0.028), CoSRM (F(2,17) = 13.99, p < 0.001), SepSRM (F(2,17) = 5.61, p = 0.013), SRM (F(2,17) = 6.06, p = 0.01), UCMRT (F(2,17) = 8.86, p = 0.002), CorsiFw (F(2,17) = 11.16, p < 0.001), and CorsiBw (F(2,17) = 10.84, p < 0.001). To assess how the measures differed significantly among the three profiles, Tukey's post hoc analyses were performed, and the significant values are shown in Table 4.
Mean, Standard Deviations, and Significance Values for Post Hoc Analyses on the Auditory and Cognitive Measures for Each Identified Profile Within the OHL Group.
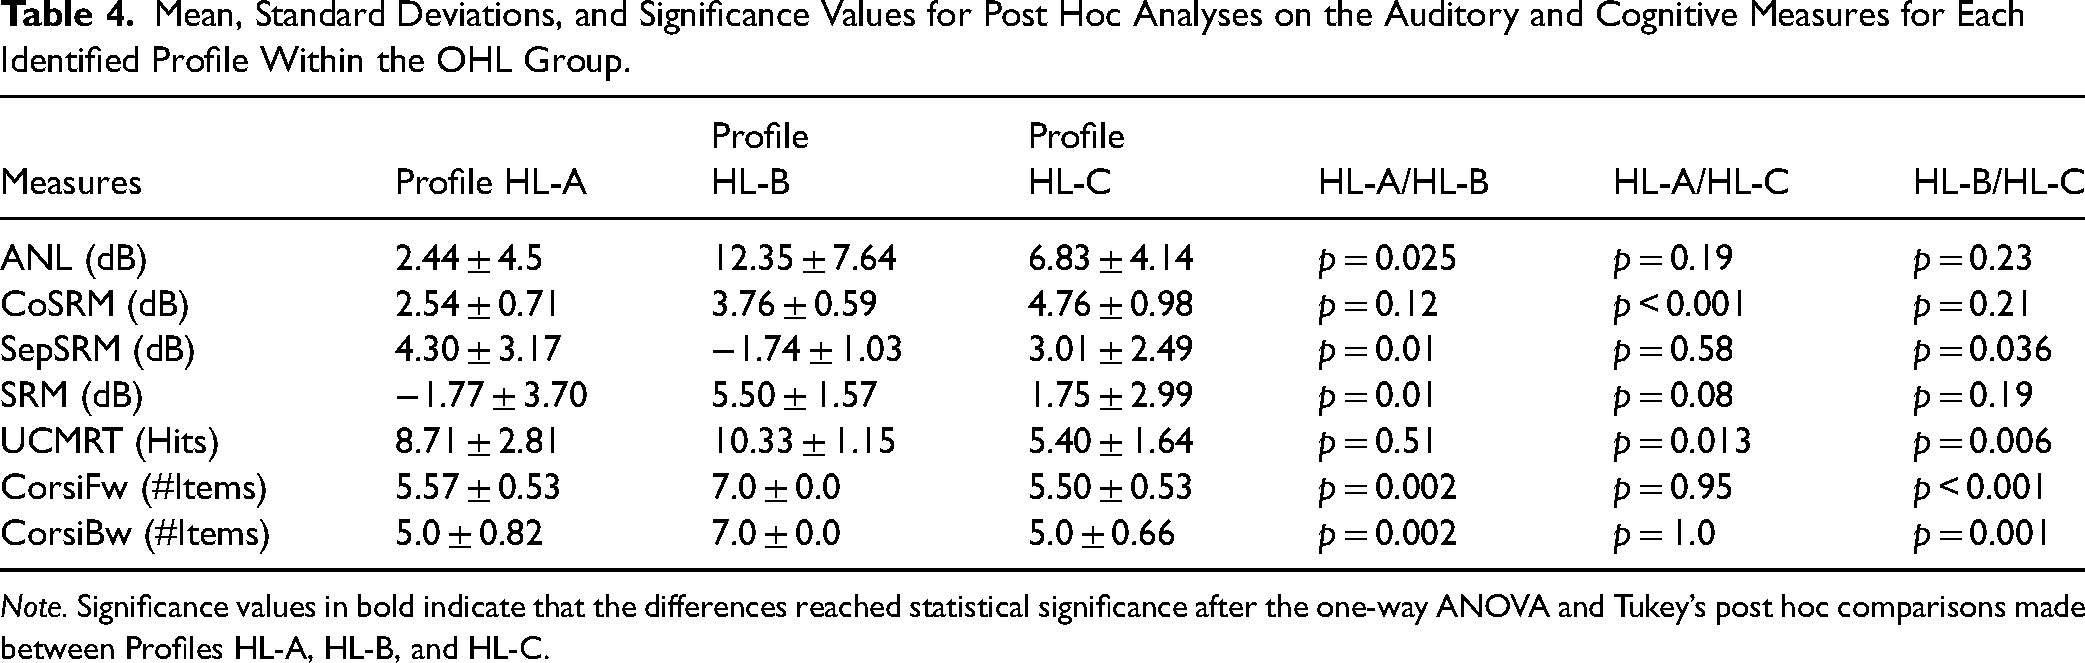
Note. Significance values in bold indicate that the differences reached statistical significance after the one-way ANOVA and Tukey’s post hoc comparisons made between Profiles HL-A, HL-B, and HL-C.
In Table 4, significant differences in performance are shown between Profiles HL-A, HL-B, and HL-C, as indicated with light green shading. From left to right in Figure 6, the post hoc comparisons indicated the following: persons in Profile HL-A and Profile HL-B differed significantly in performance on ANL, SRM, CorsiFw, and CorsiBw, with Profile HL-B having a consistently better performance on those measures except on the ANL task. Persons in Profile HL-B had better SRM and cognitive abilities overall, including better scores on the UCMRT, CorsiFw, and CorsiBw relative to the other two profiles. Persons in Profiles HL-A and HL-C differed on UCMRT and co-located SRM, with Profile HL-A performing better on both, indicating higher fluid intelligence and lower (better) target-to-masker ratio when the target speaker and maskers are co-located. Though the differences among clusters are multidimensional, an overall summary is that Profile HL-C (blue cluster) was identified as the profile with the poorest performance; Profile HL-B (green cluster) was identified as the profile with the best performance overall except at ANL showing a worse ability in tolerating background noise when listening to speech, and Profile HL-A (red cluster) was identified as a profile with relatively good performance. Other additional comparative analyses showed nonsignificant differences (F (2,17) = 0.19, p = 0.822) in PTA4 scores between OHL profiles, further indicating that similarities in hearing loss degrees could have different implications on perceptual and cognitive abilities.

Summary plot of the mean normalized thresholds (z-scores) for each auditory perceptual and cognitive measure in each identified profile from individuals with hearing loss (OHL group). Lines and asterisks show the profiles that were significantly different in a given measure, as shown by the one-way ANOVA and Tukey's post hoc analyses.
Correlation Analysis
To investigate the relationship between perceptual and cognitive measures from both the ONH and OHL data, a partial correlation analysis was performed while controlling for PTA4. For the interested reader, a bivariate correlation analysis without controlling for PTA4 is shown in the Supplemental Materials. Table 5 shows a summary of the partial correlation analysis with the correlation coefficients and the significance values. There were significant correlations (R = −0.39, p = 0.017) between STM and ANL (measure of tolerance to background noise), STM and No-Notch (measure of sound detection in background noise; R = 0.47, p = 0.003), STM and diotic FM (R = 0.34, p = 0.039) and dichotic FM (R = 0.36, p = 0.028). The Corsi Backward was correlated with both No-Notch (R = −0.32, p = 0.049) and Notch (R = −0.33, p = 0.043) tasks, which each taken alone, are measures of tone detection in noise. The cognitive task UCMRT was also correlated with gap detection thresholds (R = −0.37, p = 0.024). Additionally, WIN was significantly correlated with diotic FM (R = 0.33, p = 0.044), indicating an association between measures of temporal processing through FM detection and speech perception in background noise. The Supplemental Materials also include figures showing these regression lines, and an additional partial correlation analysis including PTA4 as a variable and “Group” as a factor.
Correlation Matrix of Perceptual and Cognitive Measures of ONH and OHL Data With PTA4 as a Factor.

Note. Coefficients in bold indicate that the criteria for significance have been met. Bold with an underline represents p < 0.01 (2-tailed); bold without an underline represents p < 0.05; CFw: Corsi Forward; CBw: Corsi Backward.
Discussion
The present study evaluated common suprathreshold perceptual and cognitive abilities in a sample of older individuals (n = 40) with and without hearing loss. We hypothesize that among the many possible individual differences in those abilities, there exists a reduced set of profiles that can characterize these individuals in addition to their hearing status. Our methods used clustering analyses and suggested at least three profiles that were diverse within each separate group. Each of these profiles showed some distinction in their performances on the abbreviated psychophysical test battery, and future work may expand these results to identify the appropriate treatment strategies for the specific profiles.
Investigations into individual auditory and cognitive deficits and how they may covary have been an active area of research over the last 40 years (Akeroyd, 2009; Broadway & Engle, 2011; Lentz et al., 2022; Watson et al., 1982). Plomp and Mimpen (1979) proposed two major components of hearing loss: type A (attenuation factor) which is mainly the reduction in audibility and type D (distortion factor) which describes the negative consequences of poor speech-to-noise ratio. These components are not considered mutually exclusive, and most individuals experience a combination of both. Whereas type A is most often associated with poorer audiometric thresholds, most other suprathreshold deficits are lumped into type D and can often be overlooked in clinical interventions. One way to better understand these “distortion factors” and subsequently treat them is to evaluate the relationship of auditory perceptual (psychophysical) measures with speech recognition abilities (for a review, see Houtgast & Festen, 2008). Classifying individuals based on their varying perceptual abilities in addition to pure tone thresholds has been approached in different ways. For example, taking Plomp's perspective, Sanchez Lopez et al. (2018, 2020) used modern advanced machine learning techniques to identify distinct profiles based on these distortions. Other approaches have involved identifying individual differences in speech perception abilities and then, using large sets of psychoacoustic tasks and cognitive measures, determining which measures in the set account for the most variance in the speech perception measures (e.g., Humes et al., 2013, 2022; Lentz et al., 2022). In many cases, cognitive performance has been shown to play a key role in speech-in-noise performance (e.g., Humes, 2007; Humes et al., 2022). A third approach is to assess the relationships between specific abilities, such as temporal resolution and working memory, and speech-in-noise performance (e.g., Hwang et al., 2017) for the goal of identifying if one measure may or may not predict another.
There have been different measures and test batteries used to quantify individual differences in auditory perceptual abilities. For example, Watson and colleagues developed the Test of Basic Auditory Capabilities (TBAC; Watson et al., 1982), which is a test battery consisting of tasks that tap into a wide range of auditory processing abilities, and which has been used for the goal of identifying individual differences in multiple listening groups (e.g., Humes, 1996, 2007; Humes & Christopherson, 1991; Surprenant & Watson, 2001; Watson & Kidd, 2002). The results of these studies have shown that although psychoacoustic measures may partly explain the variance in speech perception abilities, individual differences in listeners with hearing loss are attributed to a collection of modalities representing the linguistic, cognitive, and various perceptual abilities of listeners. The current study is similar in concept but specifically aimed to create characteristic profiles for older adults with and without hearing loss.
Individual Differences in Auditory Perceptual and Cognitive Abilities in the Presence of Audiometrically Normal Hearing
This study is the first to cluster older listeners without the interference of hearing loss and with the use of auditory perceptual and cognitive measures, while considering each measure as a component by itself, rather than performing PCA for data reduction purposes. Here, PCA was only conducted after cluster analyses and solely for visualization purposes. When evaluating the three ONH profiles with post hoc analyses, Profile NH-A showed the best ability in hearing in background noise (i.e., lower No-Notch thresholds), in SRM, and in working memory abilities. Profile NH-B only showed performance differences with Profile NH-A in dichotic FM and CorsiBw. In fact, dichotic FM helped distinguish between Profile NH-A and Profile NH-B. Profile NH-C performed the worst on SRM compared to the other profiles but had good working memory abilities compared to Profile NH-B. Measures of working memory and informational masking (CorsiBw and SRM) were shown as the two highest contributors to the separation of the profiles, followed by measures of hearing in background noise and temporal fine structure (No-Notch and diotic FM). SRM specifically contributed to differentiating Profile NH-C from Profile NH-A and Profile NH-B, despite similar audiometric hearing thresholds across all profiles. Moreover, Humes et al. (2022) evaluated younger and older adults with normal hearing and showed that cognitive testing from their battery was an important factor when evaluating individual differences and should be considered in auditory tasks. In the present study, cognitive performance, especially working memory, resulted in a more distinct and detailed classification of listeners into characteristic profiles. Other studies also showed the importance of including cognitive testing in a test battery when investigating individual differences (Engle et al., 1999; Füllgrabe et al., 2015; Humes et al., 2013; Lentz et al., 2022; Rönnberg et al., 2013). Profiles in ONH show performance differences in perceptual and cognitive abilities, and if tested clinically, individuals in all three profiles would be considered the same and identified as having normal hearing. Nevertheless, more thorough and efficient testing, as with our test battery, is able to differentiate listeners that may require different rehabilitation strategies for better speech understanding.
Different Perceptual and Cognitive Abilities Among Individuals With Similar Degrees of Hearing Loss
Motivated by the influential work of Plomp and Mimpen (1979) and the many other studies that have attempted to characterize mechanisms contributing to distortions, the present study also aimed to expand on our ability to measure factors contributing to the “type D” component of hearing loss so that future work might demonstrate meaningful integration into the clinic beyond the audiogram. Unlike the recent work of Sanchez Lopez et al. (2018, 2020), which used principal component analysis to reduce measures and identify the main contributing factors to characteristic profiles, the current study treated each behavioral measure in its test battery as an individual factor. Three profiles were revealed within the OHL individuals. Profile HL-B was identified as the “best” profile, showing high scores in the cognitive tests and higher thresholds in SRM, which were the two strongest contributors separating Profile HL-B from Profiles HL-A and HL-C. Profile A was characterized by poorer thresholds than Profile HL-C on CoSRM and UCMRT, indicating suprathreshold deficits that primarily occupied domains related to understanding speech in spatially co-located speakers, and the cognitive domain relating to visuo-spatial tasks. The overarching role that cognition played when separating Profile HL-B from the others was good evidence that profiling batteries should include measures of cognition to go along with the auditory perceptual measures. Perhaps unsurprisingly, cognition has previously been linked to speech perception, particularly in the ability to use space to segregate speech streams (Füllgrabe et al., 2015; Stone & Moore, 2014). Because Profile HL-B had better cognitive scores, we may infer that these individuals were better able to compensate for deteriorated auditory signals or compromised speech due to higher WMC (Rönnberg et al., 2010), which led to perhaps performing better at perceptual tasks, except at ANL, showing a poorer ability to tolerate speech in background noise. Some measures contributed more to the clustering analyses; for example, CoSRM, STM, SRM, and CorsiBw contributed to a larger degree than any of the other measures for OHL individuals. As previously mentioned, SRM and CorsiBw were also the highest contributors to clustering the ONH individuals. Perhaps, the contributions of these mentioned measures were not too surprising. Spectro-temporal processing is critical for speech processing and has previously been associated with deficits due to hearing loss (Bernstein et al., 2013; Summers & Leek, 1994). The challenges of using spatial separation (i.e., SRM) to understand speech have also been associated with hearing loss (Summers & Leek, 1994) and are often associated with large variability, and association with aging without hearing loss (Gallun et al., 2013). Likewise, cognition, which is often correlated with SRM for individuals with hearing loss (Neher et al., 2009), contributes to poor speech perception (Gallun et al., 2013), has been linked as an at-risk factor for listeners with hearing loss (Lunner, 2003), and may vary in older listeners. This was shown in the present study when the cluster analysis was conducted with both ONH and OHL groups, as SRM and CorsiBw were some of the highest contributors under the same PC1 (when specifically choosing two components for visualization purposes). However, when clustering ONH and OHL separately, SRM and CorsiBw were major contributors in different PCs.
Importance of Measuring Various Auditory Perceptual and Cognitive Measures
It is important to note that because of the large variability in perceptual and cognitive measures in OHL listeners, there are likely wide heterogeneities in the suprathreshold deficits that listeners with hearing loss have. This can lead to some individuals having perhaps poor TFS coding, but intact spatial hearing, for example, whereas others might have the opposite set of challenges or varying degrees of such challenges. Moreover, our correlation analysis showed a significant relationship between diotic FM, a measure of temporal fine structure, and WIN, a measure of speech perception in noise. This is consistent with other studies that found a strong relationship between temporal processing and speech intelligibility in noise (Füllgrabe et al., 2015; Johannesen et al., 2016), though it has been suggested that FM tasks may not be solely assessing temporal fine structure abilities alone (Whiteford et al., 2020). Previous work has also shown that processing TFS cues is associated with HA benefit (Perez et al., 2014) and that individuals with good temporal processing abilities and unaided speech performance show better-aided intelligibility (Lopez-Poveda et al., 2017). In this study, binaural TFS was one of the contributors in separating the ONH group and within the ONH-OHL groups. Srinivasan et al. (2022) demonstrated that a “temporal model” can account for some of the variance in SRM thresholds across OHL listeners, but a “spectral model” could account for additional variance in SRM, indicating that multiple factors are responsible for challenges OHL listeners have. STM measure was found strongly correlated with No-Notch which perceptually is a measure of perception in background noise, and in fact, Bernstein et al. (2013) showed that STM is a strong predictor of speech intelligibility in noise. In this study, STM was one of the highest contributors in the cluster analysis. Consequently, this shows the importance of testing multiple measures to determine any commonalities across individuals that may be suitable targets for treatment, and to do so, we argue that a condensed and validated battery of measures could ultimately be used in the clinic for a full picture of listeners’ range of listening abilities.
Profiles With Both ONH and OHL Individuals
When cluster analyses were performed with both groups of individuals with normal hearing and hearing loss, results showed five distinct clusters, as shown in Figure 2. Each cluster includes both ONH and OHL individuals, which in this case, were clustered based on perceptual and cognitive measures only, and without pure tone thresholds. Furthermore, investigating profiles with both ONH and OHL groups showed that each of the resulting profiles included individuals from both groups. This shows the importance of investigating individual differences in perceptual and cognitive abilities which may show various effects of aging with and without hearing loss.
However, individuals in the profiles on the right side of the plot in Figure 2 have better SRM and better working memory abilities, whereas those toward the left side of the plot have lower SRM and working memory abilities. Although we can visualize that most of the ONH individuals clustered toward one side of the plot (right side), they still formed different clusters, and there were some individuals who were closer in performance to OHL individuals compared to others. Perhaps these individuals experience more communication difficulties compared to their ONH peers, with whom they share similar audiometric pure tone thresholds. Interestingly, Profile 4 in the initial cluster analysis (n = 40) includes an equal number of ONH and OHL individuals in the same cluster. However, when clustering ONH and OHL separately, they formed different profiles when the comparison was made to their same-group peers. Additionally, the OHL individuals (shown in circles in the gray rectangle) who clustered closer to the ONH adults were the same individuals in Profile HL-B in the OHL cluster analysis. These individuals showed the best working memory and SRM abilities compared to the other OHL profiles. This indicates the ability of the profiles in characterizing the extent of severity in perceptual and cognitive abilities and matching individuals to their corresponding profiles based on perceptual and cognitive abilities, which can provide more information about communication abilities than pure tone thresholds and speech testing. Consequently, this shows the importance of testing multiple measures to determine any commonalities across individuals that may be suitable targets for treatment, and to do so, we argue that a condensed and validated battery of measures could ultimately be used in the clinic for a full picture of listeners’ range of listening abilities.
Clinical Implications
There exist at least three distinct profiles within the ONH group and OHL group that can be characterized by varying deficits in perceptual and cognitive factors, which indicates that a single standard clinical intervention may not be suitable as the best care for individuals who experience communication difficulties. Precision audiology should take into account these idiosyncrasies across individuals in addition to their audiogram, and the present study has demonstrated an efficient method for identifying patients that may differ in the approaches needed. By accurately identifying one's auditory profile, we may help set realistic expectations for patients’ aided benefit and individualize rehabilitation strategies (e.g., HAs, auditory trainings, etc.) to enhance speech understanding. The first step would be to assign an individual patient to one of the predetermined profiles using a classification model trained on the current data or larger cohort. After a listener is classified by a particular profile, individualized treatment strategies should be suggested to the clinician. Developing those treatment strategies is the next step in this line of research and could be carried out by targeting a profile's central deficits. For example, if a profile is characterized by relatively good spatial processing, treatment strategies should attempt to preserve spatial cues necessary for segregating speech from noise. On the other hand, if spatial processing is not a highlight of a particular profile, then maximizing the signal-to-noise ratio at the expense of usable spatial cues could be an option. Finally, collecting listener cognitive and perceptual abilities from an abbreviated test battery on a commercial platform makes this approach clinically relevant and feasible; however, it remains to be seen whether individual treatment strategies will ultimately lead to greater rehabilitation outcomes.
Limitations
When clustering each group separately, profiles were derived from only 20 participants in each group, though the relationships and correlations among the auditory perceptual and cognitive measures were grounded in decades of hearing and cognitive research, and the expected wide variability only reinforced the argument that profiling patient deficits beyond the audiogram adds value to our ultimate goals of treating individuals holistically. As this study did not evaluate possible differences in effort, motivation, and tiredness between individuals, future studies may include questionnaires on these potential factors. Nevertheless, we acknowledge that the individuals that formed profiles consisting of one or two individuals, which have been excluded in the present analyses, may be part of distinct and larger profiles not identified in this study given the sample size. Therefore, future work may need to expand our subject pool (or the domains to be sampled) to confirm the extent to which profiles capture the existing variability across a population with and without hearing loss or to validate the existing profiles. Additionally, the K-means clustering method used in this study is a sensitive technique in choosing the number of optimal clusters and in choosing the centroid of a cluster due to its localized optimization method (Ikotun et al., 2023). We aimed to overcome the former by using external clustering validation measures, such as the various cluster indices, and choosing the optimal number of clusters based on the majority vote. As for the latter, the K-means method is sensitive to the selection of the midpoint, and thus the starting point, of a cluster. Therefore, future studies should use various methods of cluster techniques to validate the results of the cluster analysis, while also including a larger sample size.
Conclusion
The present study identified commonalities in the types of deficits that older listeners with and without hearing loss have, such that three characteristic profiles were revealed in each group separately. When clustered together, five profiles emerged (Profiles 1–5), with ONH individuals showing better perceptual and cognitive abilities, on a group-level, than OHL listeners. Aging alone may affect different perceptual and cognitive abilities even in the absence of audiometric hearing loss, and it has uniquely demonstrated select classes of individuals that share deficient processing within some but not all perceptual and cognitive domains. This study focused on whether individual profiles among ONH and OHL individuals could be identified from auditory perceptual and cognitive measures, and how these measures distinguish between the profiles. Older individuals with normal hearing were clustered into three characteristic profiles. The measures that contributed significantly to this classification were SRM, CorsiBw, diotic FM, and No-Notch. One profile (Profile NH-A) showed an overall better performance compared to the other two profiles, although having similar “normal” pure tone thresholds. Within the OHL group, variations in auditory and cognitive abilities, specifically SRM, STM, and CorsiBw, played an important role in identifying three distinct profiles. Profile HL-B was deemed the group with the best thresholds, whereas Profiles HL-A and HL-C performed differently in speech with co-located maskers and fluid intelligence abilities. Profile HL-B was further dissociated from the other two profiles by excelling on measures of working memory. The present research encourages future studies assessing different rehabilitation strategies to take interindividual differences and different profiles into account, especially in populations that would be treated clinically as the same. With the caveat of a limitation relating to sample size, the result of this study motivates the expansion of identifying profiles and applying this knowledge to a larger number of individuals with hearing loss for the long-term goal of guiding individualized rehabilitation strategies and improving precision audiology.
Supplemental Material
sj-pdf-1-tia-10.1177_23312165241263485 - Supplemental material for A Step Toward Precision Audiology: Individual Differences and Characteristic Profiles From Auditory Perceptual and Cognitive Abilities
Supplemental material, sj-pdf-1-tia-10.1177_23312165241263485 for A Step Toward Precision Audiology: Individual Differences and Characteristic Profiles From Auditory Perceptual and Cognitive Abilities by Dana Cherri, David A. Eddins and Erol J. Ozmeral in Trends in Hearing
Supplemental Material
sj-pdf-2-tia-10.1177_23312165241263485 - Supplemental material for A Step Toward Precision Audiology: Individual Differences and Characteristic Profiles From Auditory Perceptual and Cognitive Abilities
Supplemental material, sj-pdf-2-tia-10.1177_23312165241263485 for A Step Toward Precision Audiology: Individual Differences and Characteristic Profiles From Auditory Perceptual and Cognitive Abilities by Dana Cherri, David A. Eddins and Erol J. Ozmeral in Trends in Hearing
Supplemental Material
sj-pdf-3-tia-10.1177_23312165241263485 - Supplemental material for A Step Toward Precision Audiology: Individual Differences and Characteristic Profiles From Auditory Perceptual and Cognitive Abilities
Supplemental material, sj-pdf-3-tia-10.1177_23312165241263485 for A Step Toward Precision Audiology: Individual Differences and Characteristic Profiles From Auditory Perceptual and Cognitive Abilities by Dana Cherri, David A. Eddins and Erol J. Ozmeral in Trends in Hearing
Supplemental Material
sj-pdf-4-tia-10.1177_23312165241263485 - Supplemental material for A Step Toward Precision Audiology: Individual Differences and Characteristic Profiles From Auditory Perceptual and Cognitive Abilities
Supplemental material, sj-pdf-4-tia-10.1177_23312165241263485 for A Step Toward Precision Audiology: Individual Differences and Characteristic Profiles From Auditory Perceptual and Cognitive Abilities by Dana Cherri, David A. Eddins and Erol J. Ozmeral in Trends in Hearing
Supplemental Material
sj-pdf-5-tia-10.1177_23312165241263485 - Supplemental material for A Step Toward Precision Audiology: Individual Differences and Characteristic Profiles From Auditory Perceptual and Cognitive Abilities
Supplemental material, sj-pdf-5-tia-10.1177_23312165241263485 for A Step Toward Precision Audiology: Individual Differences and Characteristic Profiles From Auditory Perceptual and Cognitive Abilities by Dana Cherri, David A. Eddins and Erol J. Ozmeral in Trends in Hearing
Footnotes
Acknowledgments
This work was supported in part by NIH R01DC015051 (FJG, ARS, DAE) and NIH R21DC017832 (EJO). The authors wish to thank Dr. Carrie Secor and Dr. Robert Budinsky for their assistance with participant intake and assessment, and Dr. Erick Gallun and Dr. Aaron Seitz for their continuous support.
Declaration of Conflicting Interests
The authors declared no potential conflicts of interest with respect to the research, authorship, and/or publication of this article.
Data Availability Statement
Data sets from this study are available in Supplemental Materials.
Funding
The authors disclosed receipt of the following financial support for the research, authorship, and/or publication of this article: This work was supported by the National Institutes of Health, (grant number R01DC015051, R21DC017832).
Supplemental material
Supplemental material for this article is available online.
Notes
References
Supplementary Material
Please find the following supplemental material available below.
For Open Access articles published under a Creative Commons License, all supplemental material carries the same license as the article it is associated with.
For non-Open Access articles published, all supplemental material carries a non-exclusive license, and permission requests for re-use of supplemental material or any part of supplemental material shall be sent directly to the copyright owner as specified in the copyright notice associated with the article.