
Abstract
Hearing aids (HA) are the most common type of rehabilitation treatment for age-related hearing loss. However, HA users often obtain limited benefit from their devices, particularly in noisy environments, and thus many HA candidates do not use them at all. A possible reason for this could be that current HA fittings are audiogram-based, that is, they neglect supra-threshold factors. In an earlier study, an auditory-profiling method was proposed as a basis for more personalized HA fittings. This method classifies HA users into four profiles that differ in terms of hearing sensitivity and supra-threshold hearing abilities. Previously, HA users belonging to these profiles showed significant differences in terms of speech recognition in noise but not subjective assessments of speech-in-noise (SIN) outcome. Moreover, large individual differences within some profiles were observed. The current study therefore explored if cognitive factors can help explain these differences and improve aided outcome prediction. Thirty-nine older HA users completed sets of auditory and SIN tests as well as two tablet-based cognitive measures (the Corsi block-tapping and trail-making tests). Principal component analyses were applied to extract the dominant sources of variance both within individual tests producing many variables and within the three types of tests. Multiple linear regression analyses performed on the extracted components showed that auditory factors were related to aided speech recognition in noise but not to subjective SIN outcome. Cognitive factors were unrelated to aided SIN outcome. Overall, these findings provide limited support for adding those two cognitive tests to the profiling of HA users.
Introduction
Hearing loss is a widespread global health issue that affects many people over 60 years of age (Lin et al., 2011; Wilson et al., 2017). Even though many of these individuals use hearing aids (HAs), understanding speech in noise often remains a challenge for them, as reflected in the large inter-individual differences in aided speech-in-noise (SIN) outcome that are typically observed (e.g. Eddins et al., 2013; Hornsby et al., 2006; Lopez-Poveda et al., 2017; Nuesse et al., 2018). In fact, lack of benefit in noisy environments is one of the main reasons for HA non-use (McCormack & Fortnum, 2013). For the improvement of HA rehabilitation, a better understanding of the factors underlying this variability is important. The purpose of the current study was to investigate if variability in aided SIN outcome can be explained based on individual differences in auditory and cognitive abilities.
In current clinical practice, HAs are commonly fitted using manufacturer-recommended procedures (Anderson et al., 2018; Wolff, 2019), with the different manufacturers developing their own fitting rationales (Keidser et al., 2003; Sanders et al., 2015). In general, current fitting rationales are audiogram-based. In other words, individual differences in supra-threshold hearing abilities are typically neglected (Kiessling, 2001). A large number of studies have suggested that supra-threshold hearing abilities such as binaural and temporal processing play an important role for SIN perception (e.g. Houtgast & Festen, 2008; Johannesen et al., 2016; Lorenzi et al., 2006) and that they are negatively affected by higher age and hearing loss (Moore, 2021; Plomp, 1978; Santurette & Dau, 2012). Moreover, supra-threshold hearing abilities have been related to preference for different HA settings (Moore & Sęk, 2016) as well as to aided SIN performance (Lopez-Poveda et al., 2017; Neher et al., 2017; Souza et al., 2019).
Apart from auditory factors, the influence of cognition on aided SIN outcome has received much attention during the last couple of decades (e.g. Humes, 2007; Humes et al., 1994; Lopez-Poveda et al., 2017; Nuesse et al., 2018; Pichora-Fuller & Singh, 2006; Rönnberg et al., 2016). In general, both auditory and cognitive abilities play a role when extracting and processing a target speech signal in complex listening scenarios (e.g. Anderson et al., 2013; Mattys et al., 2012). Nevertheless, it is unclear how cognitive abilities influence the variance in aided SIN outcome for older people with hearing loss. While cognitive abilities are known to decline with older age (e.g. working memory capacity; Grégoire & Van Der Linden, 1997; Kessels et al., 2008), individual differences are common and have been related to aided SIN outcome (Akeroyd, 2008; Dryden et al., 2017; Humes, 2002; Lunner & Sundewall-Thorén, 2007; Pichora-Fuller & Singh, 2006). More specifically, working memory capacity has been shown to be a predictor of SIN perception (Akeroyd, 2008; Rönnberg et al., 2010), aided speech recognition in noise (Koelewijn et al., 2012; Lunner, 2003), and self-reported aided benefit (Lopez-Poveda et al., 2017) for listeners with hearing loss. However, the findings are not always consistent (Nuesse et al., 2018; Rönnberg et al., 2016). Moreover, cognitive performance in domains like processing speed and attention has been suggested to be associated with individual differences in SIN perception (Dryden et al., 2017; Ellis et al., 2016; Heald & Nusbaum, 2014; Schneider et al., 2010). However, such associations have been mainly found in normal-hearing listeners (Füllgrabe et al., 2015) and less so for HA users (Dryden et al., 2017; Nuesse et al., 2018).
There were several studies assessed a variety of auditory and cognitive abilities of older HA users and investigated which performances to be the effective predictors for speech intelligibility (Lopez-Poveda et al., 2017; Nuesse et al., 2018; Rönnberg et al., 2016). For instance, Nuesse et al. (2018) assessed the aided intelligibility in 21 older HA users and compared the effects of hearing sensitivity and cognitive performance in tests of working memory, attention, executive functioning, and lexical and semantic abilities. The results showed that average pure-tone hearing threshold was the only significant predictor of aided SIN performance, dispite the fact that different noise conditions were used in the SIN test. Lopez-Poveda et al. (2017) investigated 19 predictors, including predictors related to supra-threshold abilities and working memory, and found temporal processing ability to be the most significant predictor of aided intelligibility. Rönnberg et al. (2016) applied a larger variety of cognitive measures in their study design as well as a larger sample size. The results showed that cognitive factors had a stronger influence on aided intelligibility when the speech stimuli were context-free sentences, while auditory factors were significantly associated with aided intelligibility in general. Overall, auditory factors showed a stronger influence than cognitive factors on aided speech recognition in noise.
Only around 20% of all HA candidates in developed countries use HAs (Davis et al., 2016), which is mainly due to HA not providing sufficient benefit, especially in noisy situations (McCormack & Fortnum, 2013). A possible reason for the limited HA benefit could be that current fitting rationales do not account for supra-threshold deficits. To improve current (audiogram-based) hearing rehabilitation, the Better hEAring Rehabilitation (BEAR) project in Denmark developed a method for classifying hearing-impaired listeners into four distinct auditory profiles referred to as profiles A, B, C and D (Sanchez-Lopez et al., 2020). The classification is based on the results of a test battery that contains measures of audibility, loudness perception, binaural processing, unaided speech recognition in noise, and spectro-temporal resolution (Sanchez-Lopez et al., 2021). Profile-A listeners typically show mild hearing deficits and overall good performance on the various auditory tests. In contrast, profile-C listeners show profound hearing deficits and overall poor performance. Profile-B listeners show sloping audiograms, poor unaided SIN performance, and poor spectro-temporal resolution. Profile-D listeners show relatively good performance on tasks involving binaural processing and SIN perception, but abnormal loudness perception.
In two earlier studies, it was shown that listeners belonging to the different auditory profiles differ clearly in terms of their aided SIN performance, as assessed with either a simulated HA and a generic gain prescription (Wu et al., 2020) or clinically available HAs fitted according to manufacturer-recommended procedures (Wu et al., 2021). However, the same was not true when SIN outcome was assessed using a just-follow-conversation task requiring the participants to adjust the target speech to a level that was neither easy nor difficult to follow (Wu et al., 2021). In addition, within some profiles there were noteworthy inter-individual differences in SIN outcome. This would seem to suggest that auditory factors alone are unable to account for differences in aided SIN outcome.
The current study therefore revisited the idea of profiling HA candidates by considering the inclusion of cognitive measures and by approaching it from the perspective of aided SIN outcome. The research questions were as follows: (1) Can cognitive factors improve the prediction of aided SIN performance? (2) Can cognitive factors explain some of the variance in subjective aided SIN assessments? The auditory factors considered here were those included in the BEAR clinical test battery (Sanchez-Lopez et al., 2019). The cognitive factors considered here were working memory and processing speed. Based on the findings of Lopez-Poveda et al. (2017) and Rönnberg et al. (2016), it was hypothesized that auditory factors would be more effective predictors of aided outcome than cognitive ones.
Methods & Materials
Participants
Thirty-nine HA users (14 female) aged 60–81 years (mean = 71.0 years) participated in the current study. The inclusion criteria were as follows: (1) habitual HA users (>1 year of HA experience); (2) symmetrical sensorineural hearing loss with ≤10 dB air-bone gap and interaural asymmetry in audiometric thresholds from 0.5–4 kHz; (3) audiometric configuration in-between the N1 and N4 standard audiograms of Bisgaard et al. (2010); (4) self-reported normal or corrected-to-normal vision; (5) no history of any neurological or language disorders; and (6) native Danish speakers. At the start of their enrolment, all participants signed an information consent form. All types of auditory profiles were represented in the sample: A (N = 9), B (N = 15), C (N = 9), D (N = 3), and U (unclassifiable listeners; N = 3).
General Procedure
All participants completed three sets of tests, i.e., auditory, cognitive, and aided SIN outcome tests. The auditory tests were the tests from the BEAR clinical test battery (Sanchez-Lopez et al., 2019). Twenty-one of the 39 participants had previously completed the full BEAR test battery described in Sanchez-Lopez et al. (2021). The remaining 18 participants completed the ‘clinical’ version of this test battery (Sanchez-Lopez et al., 2019). The full BEAR test battery takes nearly four hours to complete. To allow the auditory profiling method to be used clinically, the clinical version was developed based on supervised learning techniques (Sanchez-Lopez et al., 2019). The clinical version (i.e., BEAR clinical test battery) contains a subset of measures from the full battery and thus requires around 60–90 min to complete.
Participants were asked to come for either one or two visits, depending on whether they had participated in the study of Wu et al. (2021). Twenty-eight of the 39 participants had taken part in that study, where they had completed not only the BEAR clinical test battery, but also measurements of aided SIN outcome in three different noise conditions. In the current study, these 28 participants were invited for one visit for the cognitive tests. For the 11 participants who were not part of the study of Wu et al. (2021), they were invited for two visits at which they completed the BEAR clinical test battery (first visit), the cognitive tests (second visit), and the aided outcome measurements (second visit). There was a long break between the cognitive tests and the aided outcome measurements, while the HA fittings were carried out.
Test Setup
All auditory measurements and aided outcome measurements were performed in a large soundproof booth. The cognitive tests were carried out either in a soundproof booth or a quiet office room. The auditory stimuli were presented via an RME Fireface UC soundcard. An Affinity 2.0 system (Interacoustics, Middelfart, Denmark) was used for performing pure-tone audiometry. For the auditory measurements, the stimuli were presented via headphones (Sennheiser HDA200). For the aided outcome measurements, the stimuli were presented via five loudspeakers (Genelec 8020D) placed on a circle with a radius of approx. 1.3 m. The participants sat in the middle of this circle facing the frontal loudspeaker (0° azimuth), which played back the target speech signals. The remaining four loudspeakers, which were placed at azimuth angles of ± 45° and ± 135°, played back the noise signals. A tablet was used for administering the different tests.
BEAR Clinical Test Battery
The six tests included in the BEAR clinical test battery are pure-tone audiometry, the (unaided) Danish Hearing in Noise Test (HINT), categorical loudness scaling, interaural phase difference (IPD) detection, binaural pitch detection, and spectro-temporal modulation sensitivity. Since the HINT was also used for some of the aided outcome measurements, we excluded the HINT results from the BEAR clinical test battery from the statistical analyses to avoid inflating the influence of auditory factors on aided outcome prediction.
Pure-Tone Audiometry
For the pure-tone audiometry, both air and bone conduction thresholds were measured. Figure 1 shows the air-conduction thresholds of all participants. To reduce the number of variables in the subsequent data analyses, the pure-tone average hearing loss across 500, 1000, 2000, and 4000 Hz as well as left and right ears (PTA4) was calculated. Only the air-conduction thresholds were used in this calculation.

Individual (thin grey lines) and average (thick black lines) air-conduction thresholds of the 39 participants.
Loudness Perception
Adaptive categorical loudness scaling (ACALOS; Brand & Hohmann, 2002) was used to assess loudness perception. The participants judged the loudness of monaurally presented 1/3-octave band noise stimuli centered at 0.25, 0.5, 1, 2, 4, or 6 kHz using a 13-step category scale ranging from “not heard” to “extremely loud”. A loudness function was then fitted to the collected judgments (Oetting et al., 2014). In that manner, five outcomes per test frequency were obtained: the hearing threshold level (HTL), the most comfortable level (MCL), the uncomfortable level (UCL), the low-level slope (Slope low ), and the high-level slope (Slope high ). The HTL, MCL and UCL data were estimated based on the values of a given loudness function corresponding to 0, 25, and 50 categorical units (CU). Since HTL data were also available from the pure-tone audiometry, the ACALOS-derived HTL data were excluded from the statistical analyses. Furthermore, since the maximal stimulus presentation level was 90 dB HL, there were many participants for whom less than four responses above 35 CU (“loud”) were collected. In these cases, following the recommendation of Oetting et al. (2014), a fixed value of 1.53 CU/dB was chosen for Slope high . As a consequence, Slope high was not very informative and thus excluded from the analyses in the current study. Since all participants had symmetrical hearing losses, the MCL, UCL, and Slope low estimates were averaged across left and right ears for the statistical analyses.
Binaural Pitch Processing
Binaural pitch processing was assessed using a clinical implementation of the procedure of Santurette and Dau (2012). The participants were instructed to detect 10 diotic and 10 dichotic pitch contours that were embedded in background noise. While the diotic pitch contours can be detected monoaurally, the dichotic ones are only perceivable with intact binaural processing abilities. This is because the tones that form the dichotic pitch contours are generated by adding phase-difference patterns to the noise presented to the two ears, thereby creating a pitch percept (Cramer & Huggins, 1958). As the test begins, there is a 3-min sequence of noise bilaterally presented to the listener, with diotic and dichotic pitch contours embedded in the noise. The dichotic pitch contour is created by imposing an interaural phase difference that increases linearly in the boundary region. The pitch contour is a sequence of three musical notes (C5 – E5 – G5), which are three noise bursts of 300 ms each with boundary frequencies of 523.25, 659.26, and 783.99 Hz, respectively. The three musical notes correspond to frequencies within the range of the strongest salience of Huggins’ pitch (Santurette & Dau, 2012). The interaural phase difference is zero except in the boundary region (16% of the boundary frequency) where it increases linearly from 0 to 2
The task for the participants was to press the “Yes” button on the tablet, whenever they could hear the melody. There was a training session with diotic pitch contours prior to the test. The outcomes from this test were the percent-correct scores for the diotic and dichotic stimuli averaged across two repetitions. For the statistical analyses, only the dichotic scores (BP) were used since it is the dichotic condition that assesses the ability to take advantage of binaural differences.
IPD Detection
IPD detection was assessed using the test paradigm of Füllgrabe and Moore (2017). This paradigm returns the highest frequency at which an IPD change of 180° in pure-tone stimuli can be detected. IPD detection abilities are associated with temporal fine structure (TFS) sensitivity. There are two sequences of tones in the bilaterally presented stimuli, either an ABAB or AAAA sequence. A refers to a diotic presentation while B stands for an IPD of 180° between the tones presented to each ear. The task for the participants is to judge which of the two presented sequences follows the ABAB pattern. The stimulus frequency was adaptively adjusted, following a 2-down 1-up rule, for estimation of the 71%-correct point on the psychometric function. The starting frequency was 200 Hz. The step size was initially 2/3 of an octave and decreased after each reversal until it reached the final step size of 1/6 of an octave. The outcome of this test – the IPD frequency threshold (IPDfmax) – was the mean of the results of two separate runs.
Spectro-Temporal Modulation Sensitivity
Spectro-temporal modulation sensitivity was assessed using the test paradigm described in (Sanchez-Lopez et al., 2021), with the threshold estimation procedure being slightly different (see below). On a given trial, the participants had to judge if a sequence of noise stimuli was spectro-temporally modulated. The stimuli were presented in sequences of four noises that followed an ABAB pattern. The A segments were unmodulated, while the B segments were spectro-temporally modulated. Catch trials consisting of ABAB sequences with modulations well below the detection threshold of NH participants were also included. The stimuli were one octave wide and centered at 4000 Hz. The presentation level was 75 dB SPL.
The outcome of this test approximates the 80%-point on the psychometric function. The 21 participants who were tested with the full BEAR test battery were tested using a single-interval adjusted matrix procedure (Kaernbach, 1990). The other 18 participants who completed the clinical version were tested using a Bayesian procedure according to Remus and Collins (2008), where catch trials were presented at random intervals. The total number of trials was 60, with 20% of catch trials. Since the thresholds for the participants’ left and right ears were generally very similar, the mean threshold across ears (STM) was calculated for the statistical analyses.
Cognitive Tests
The choice of the cognitive tests was based on two main considerations. Firstly, the cognitive task should test the abilities that have been associated with aided SIN outcomes in the literature. The second consideration was that the test procedure should be independent of auditory abilities, therefore tests without acoustic stimuli were preferable.
The cognitive tests were all presented via a tablet, as for most of the auditory tests as well as the just-follow-conversation task in the aided SIN test. The focus of the current study was to explain inter-individual differences in aided outcome based on different auditory and cognitive measures, and thus whether the cognitive results were comparable to those from different test versions was not the key concern. Importantly, all participants had some prior experience with using touch screens. That is, they were all long-time habitual smartphone users, and they had all completed the auditory measures from the BEAR test battery using a tablet prior to being tested using the cognitive measures. Besides, there was a training session prior to the test to ensure the participants understand the task as well as the test procedure.
Trail-Making Test
The trail-making test (TMT) is a neuropsychological test of processing speed, executive function, and cognitive flexibility (e.g. Ashendorf et al., 2008; Buchanan et al., 1994; Salthouse, 2011; Tombaugh, 2004). The test is available in both paper and computer-based versions, with the results from the different versions showing convergent validity (Karimpoor et al., 2017). There are two parts included: TMT-A and TMT-B. The performance in TMT-A relates to visual search and processing speed, while the performance in TMT-B relates to cognitive flexibility and executive function (Arbuthnott & Frank, 2000; Crowe, 1998; Kortte et al., 2002).
The version used in the current study was an app called INPL Trail Making Test (MotusDesignGroup, 2016). As part of TMT-A, the participant had to tap onto circles labeled 1–25 in ascending order. For TMT-B, circles labeled with letters (A-L) or numbers (1–13) were presented. The task was to tap onto the circles using a touch screen pen in ascending order, alternating between corresponding numbers and letters (i.e., 1-A-2-B, etc.). The participants were instructed to complete both tasks as quickly as possible. Before the actual test, a training run was carried out for each task. The outcome from this test was the time taken to complete the two tasks.
Corsi Block-Tapping Task
The Corsi block-tapping task is a neuropsychological test of working memory capacity, which is used in many fields of research with both healthy individuals and patients (Fischer, 2001; Hopkins et al., 1995; Kessels et al., 2008; Kessels et al., 2000; Mammarella & Cornoldi, 2005). The outcome of the forward test condition is correlated with that of the digit span test (Saggino et al., 2004). Tablet versions of the Corsi block-tapping task have been implemented. The results obtained with two touch-screen versions have been found to be consistent with the paper-and-pencil version, with increased accuracy in timing estimates (Brunetti et al., 2014; Siddi et al., 2020).
The version used in the current study was run through PsyToolkit (Stoet, 2010, 2017). The participants were presented with nine purple blocks against a black background on a tablet. On a given trial, a sequence of blocks flashed sequentially on the screen. The flashing time was set to 500 ms and the flashing block changed from purple to yellow during that interval. After each sequence, a green “OK” button appeared at the bottom of the screen to indicate that the participant could start tapping the flashed sequence. When the participant had entered a response and pressed “OK”, either a happy or a sad face appeared, indicating if the response was correct or wrong. The test started with a sequence of two blocks followed by another sequence of two blocks. If there was at least one correct response, the length of the sequence was increased by one and the test continued. If both trials with the same length of sequence were incorrect, the test ended automatically. Both forward and backward conditions were tested. In the backward test, the participants were asked to tap the flashed blocks in reverse serial order. The first outcome of this test was the span length, that is, the length of the last sequence repeated with one or no error before the task was terminated. The second outcome was the test score, that is, the product of the span length of the longest sequence repeated correctly and the number of correct trials. Before the actual test, at least two training trails were run to unsure the participant understanding the test.
Aided Speech-in-Noise Outcomes
Two measures of aided SIN outcome were used: the HINT (Nielsen & Dau, 2011) and the Just Follow Conversation (JFC) measure (Larsby & Arlinger, 1994). The two measures were identical to the ones used by Wu et al. (2021).
Speech-in-Noise Tasks
For the HINT task, the target stimuli and adaptive procedure from the Danish HINT (Nielsen & Dau, 2011) were used. The starting level of the target speech was 72 dB SPL. The participants were asked to repeat the sentences they heard, and a Danish experimenter scored their responses. Sentence scoring was applied. If the response to the first sentence was not correct, the same sentence was repeated with a 4-dB level increase until the participant provided a correct response. Afterwards, a one-up one-down procedure was applied. The step size was 4 dB from the second to the sixth sentence and 2 dB for the seventh to the twentieth sentence. The outcome of the HINT task was the speech recognition threshold (SRT) corresponding to 50%-correct performance, which was calculated by averaging the SNRs for the 5th to the (hypothetical) 21st sentence.
The JFC task was implemented according to the procedure of Larsby and Arlinger (1994). The participants were asked to listen to a target dialogue and adjust its level with the help of buttons on the tablet until they considered it to be neither difficult nor easy to follow. The target stimuli were two male dialogues recorded by Sørensen et al. (2018). There were five runs with random starting levels, which were in the range of −4 to + 6 dB SNR. The outcome of this test was the mean of the five self-adjusted speech-to-noise ratios.
Noise Conditions
A total of three noise conditions were included: two without intelligible speech and one with intelligible speech. The unintelligible noises included stationary speech-shaped noise (SSN) and speech-shaped babble noise (BBN), which were spectrally matched to the HINT and JFC target materials (within 1 dB across frequency). These noise signals were calibrated to 70 dB(A) SPL at the center of the loudspeaker setup. The intelligible noise condition consisted of BBN together with four mixed-gender dialogues (set to −2.5 dB SNR each relative to the BBN signal) from the dataset of Sørensen et al. (2018). More details about the noise conditions can be found in Wu et al. (2021).
HA Fittings
Each participant was fitted with a pair of behind-the-ear HAs (Oticon Opn S1) using the manufacturer's proprietary fitting rule to resemble current clinical practice in Denmark (Wolff, 2019). Non-custom domes were chosen based on the participants’ ear-canal sizes and the recommendations made by the fitting software. A ‘pinna-omni’ microphone setting was used for all participants. Since the gains provided in this manner did not cause any discomfort for any participant, no fine-tuning was carried out.
For those 28 participants tested by Wu et al. (2021), their aided outcome data obtained with the same HA (Oticon Opn S1) were reused in the current study. Since the current study followed up on the study of Wu et al. (2021), the same fitting procedure was applied here. The individual gains from the proprietary fittings were documented through real ear measurements (REM) in Wu et al. (2021). Note that the REM was only used for documentation but not for fitting purpose. As shown in Figure III of Wu (2021), the HA tested in the current study (HA1) provided gains comparable to those of an NAL-NL2 target prescription except at 4000 Hz.
Statistical Analyses
The statistical analyses consisted of two main steps, as illustrated in Figure 2: (1) feature dimensionality reduction and (2) multiple linear regression. The purpose of the first step was to reduce the number of variables and to derive two principal components capturing the dominant sources of variance among either the auditory or cognitive factors. The purpose of the second step was to assess the contribution of cognitive factors to aided SIN outcome in the presence of auditory factors as captured using the BEAR clinical test battery.
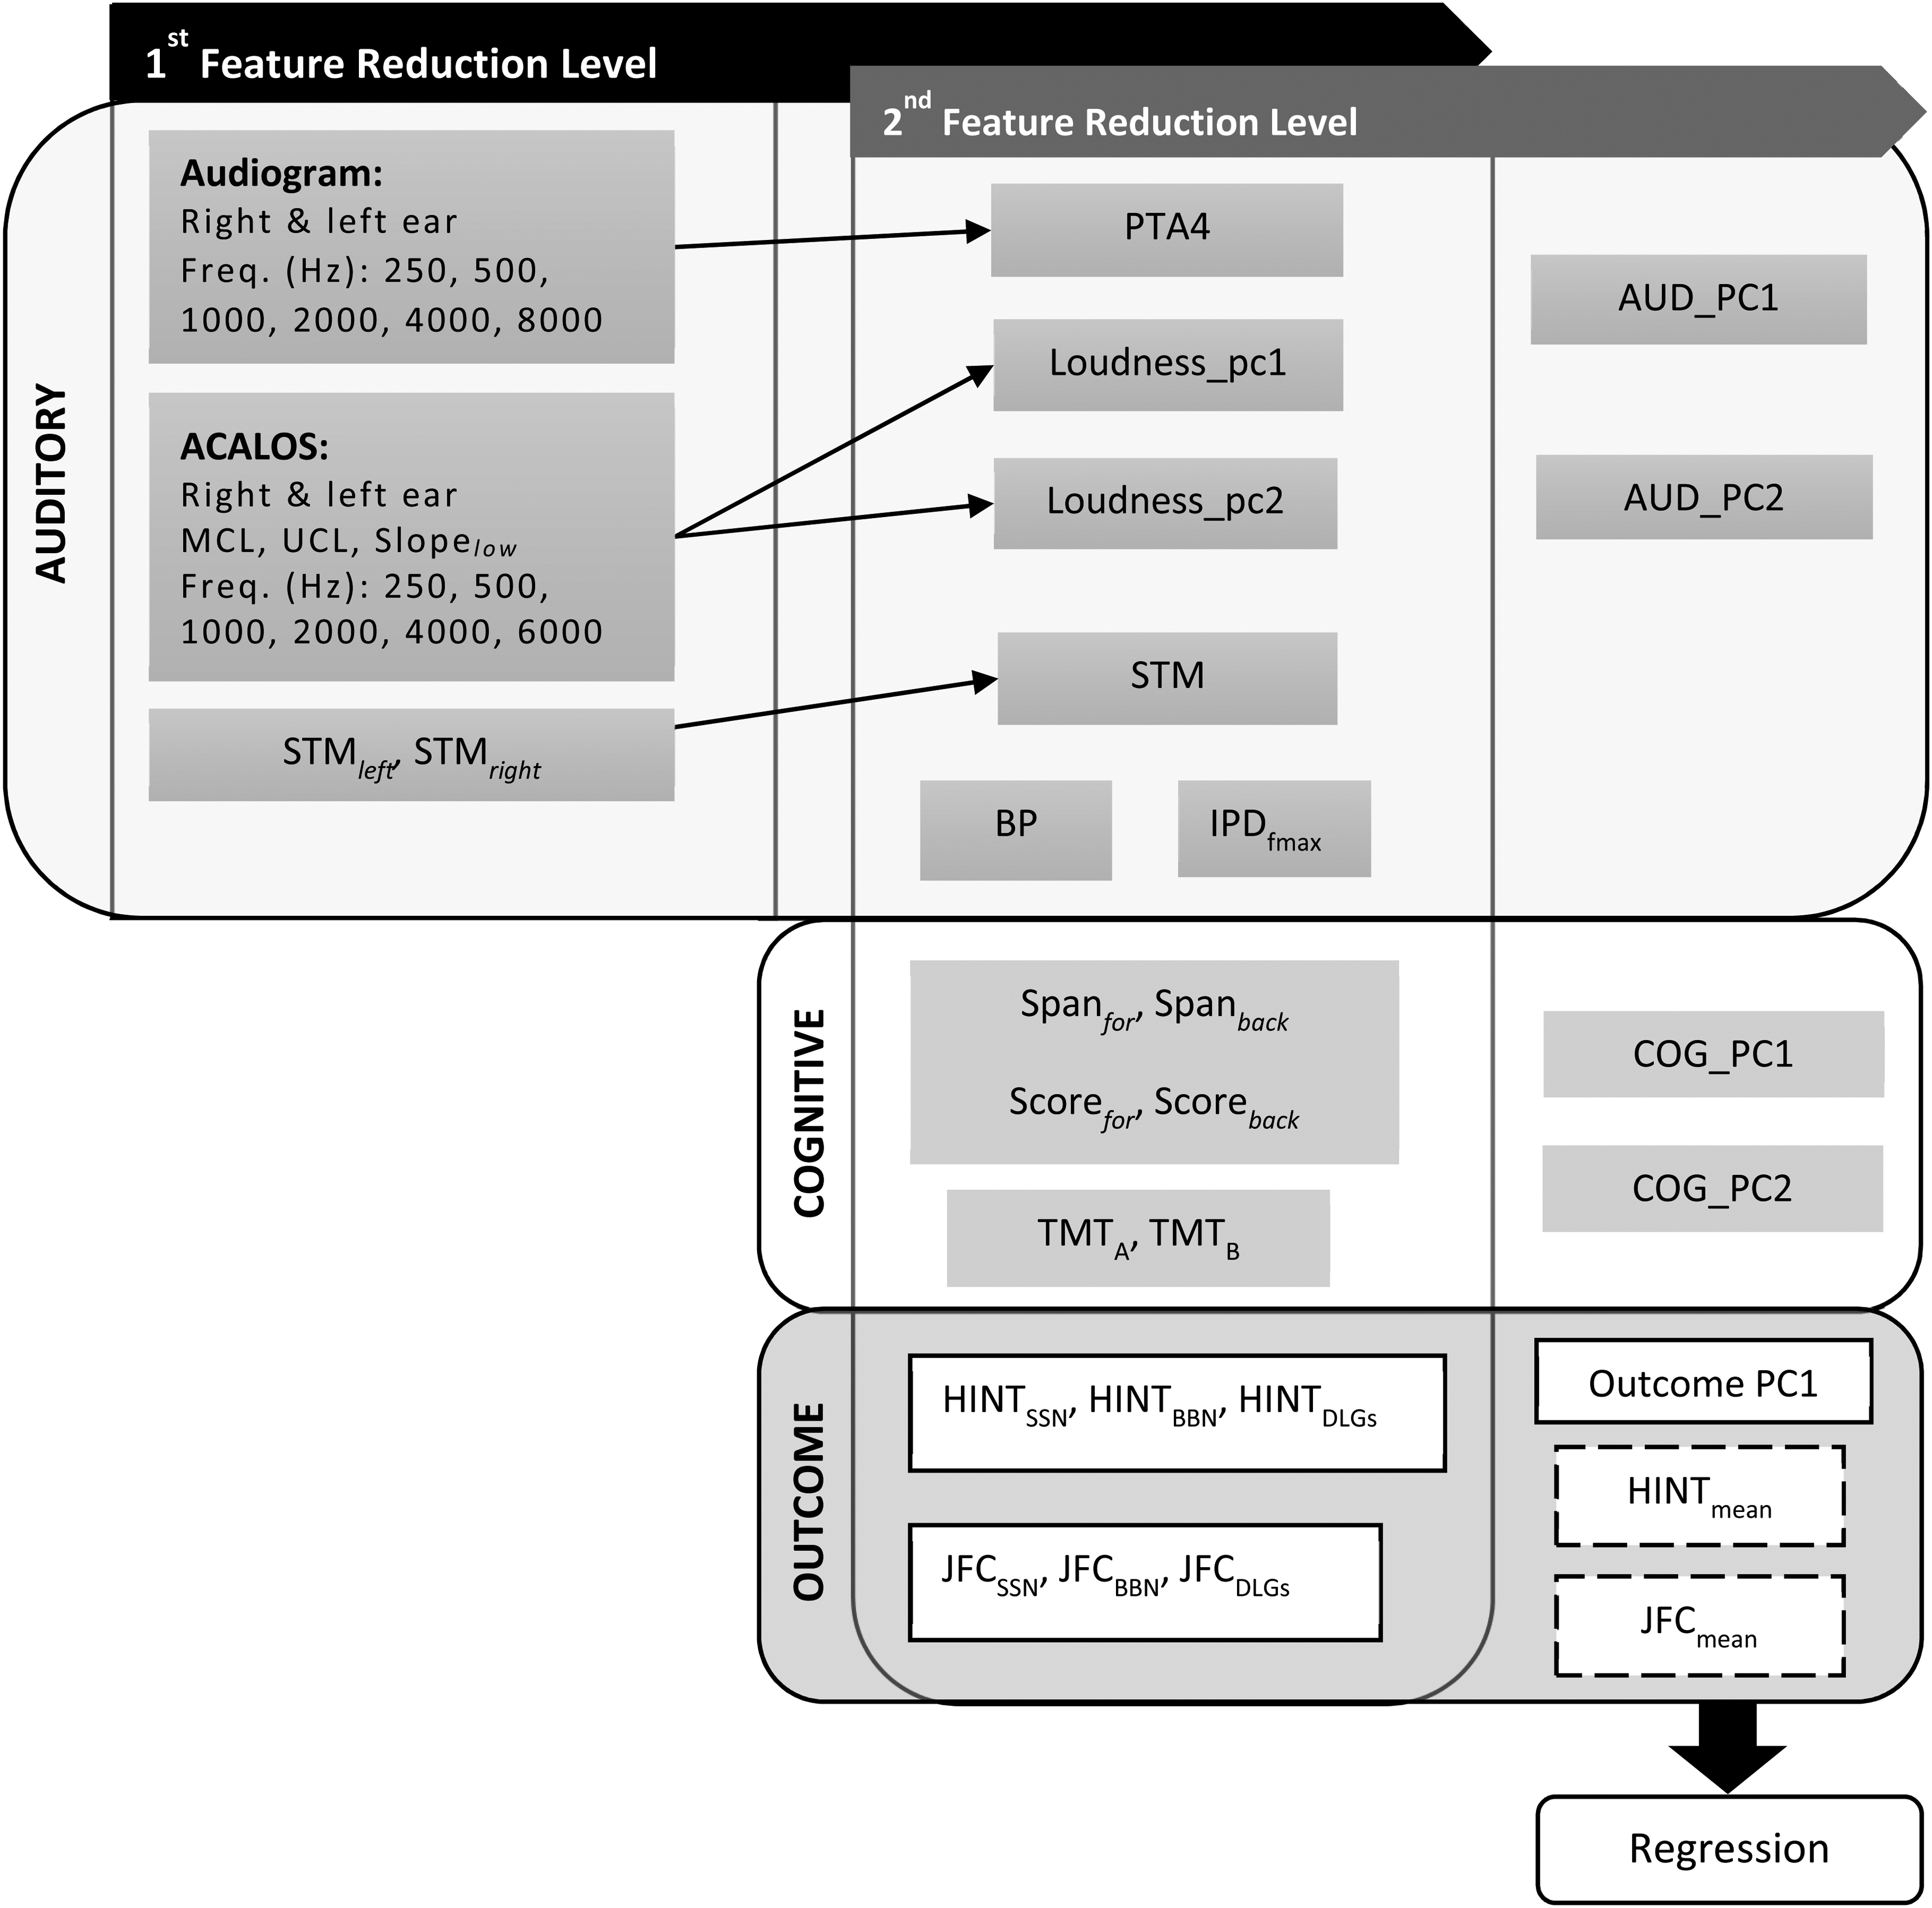
Overview of the analysis pipeline.
Feature Dimensionality Reduction
There were two levels of feature dimensionality reduction. The first level was carried out within individual auditory tests. The goal here was to represent the variance from each test using maximally two variables. Principal component analyses (PCAs) were run on the variables from the ACALOS measurements using the stats package in R. All the variables were scaled to have unit variance before performing any PCA. PTA4 was used to represent the audiogram data. To facilitate the visual inspection of the results, the scale of some variables (i.e., PTA4, STM, TMT.A, TMT.B, and all outcome variables) was reversed, so that for all variables a higher value corresponded to better outcome.
The second level of dimensionality reduction focused on reducing the number of variables within categories of tests, that is, within the auditory and cognitive tests as well as the aided outcomes. A PCA was run on all the auditory variables available after the first level of dimensionality reduction as well as on all the cognitive variables to generate two principal components per category (AUD_PC1, AUD_PC2, COG_PC1, COG_PC2). For the aided outcomes, the collected data were transformed into three datasets. The first one was an overall principal component of aided outcome (‘Outcome_PC1’), which was derived by means of a PCA performed on all the aided outcome data. The second and third datasets were derived by splitting the aided outcome data according to the two different tasks (HINT, JFC). Afterwards, the overall mean across all SRTs (HINT) or self-adjusted SNRs (JFC) was calculated for each dataset (HINTmean, JFCmean).
Multiple Linear Regression
Following the feature reduction, multiple linear regression analyses were performed to assess the effects of auditory and cognitive abilities on aided outcome. The analyses were implemented in R using the lm() function from the lme4 package (Bates et al., 2015). The dependent variables were the three derived outcome variables (Outcome_PC1, HINTmean, JFCmean). The HINTmean and JFCmean scores were standardized (mean = 0, standard deviation = 1) before entering them into the regression models. The independent variables were the four auditory and cognitive principal components (AUD_PC1, AUD_PC2, COG_PC1, COG_PC2). No interaction terms were included. To ensure robust statistical models, the number of predictors was limited to four, thereby following literature recommendations regarding the minimum ratio between number of observations and number of predictors (Hair et al., 2019; Harrell, 2015). We did not include age, which is often considered in multiple regression models in similar studies (Lopez-Poveda et al., 2017; Rönnberg et al., 2016), as a predictive variable as the auditory and cognitive predictors were prioritized.
Normality tests were conducted on the residuals of each model. According to Shapiro-Wilk's test, the errors were all normally distributed (all p > 0.05).
Results
Descriptive Analysis
Table 1 shows the first and third quartile, the mean, and the standard deviation for each of the collected variables. The results from the auditory tests are generally similar to those reported by Sanchez-Lopez et al. (2020) obtained for 75 hearing-impaired listeners. The results from the trail-making test are better compared to those from other studies that tested participants in the same age range (Ashendorf et al., 2008; Fernandez & Marcopulos, 2008), which could be due to a different choice of test setup. In those other studies, the participants were required to draw lines between the different symbols, whereas in the current study the participants tapped onto the symbols using a tablet. The results from the Corsi block-tapping task are similar to those from a previous study also performed with older participants and a computer-based setup (Brunetti et al., 2014).
Summary of the Results from all Measures.

Q1= first quartile; Q2 = third quartile; SD = standard deviation; L = left ear; R = right ear.
Principal Component Analyses
Feature Dimensionality Reduction of ACALOS Data
The first principal component derived from the ACALOS data (‘Loudness PC1’) explained 44.8% of the total variance, while the second principal component (‘Loudness PC2’) explained 17.3%. Figure 3 shows that the UCL and MCL data loaded negatively onto Loudness PC1, while Slope low loaded positively onto Loudness PC2.

Results from the PCA performed on the ACALOS data. The x- and y-axis show the component scores of Loudness PC1 and Loudness PC2. Individual participants are indicated using blue digits. The axes at the top and on the right indicate the magnitude and direction of the loadings for the different variables (MCL, UCL, Slope low at six test frequencies) on PC1 (top) and PC2 (right). The grey dashed lines indicate the largest absolute loadings on PC1 and PC2.
Feature Dimensionality Reduction of Auditory, Cognitive, and Aided Outcome Variables
The first principal component derived from the auditory variables (AUD_PC1) accounted for 46.5% of the total variance in these variables. Figure 4 shows that BP, PTA4 (reversed scale), and STM (reversed scale) loaded positively onto AUD_PC1, while Loudness PC2 loaded negatively onto this component. The observed associations indicate that an increase in AUD_PC1 reflects better auditory abilities, in the sense that a higher AUD_PC1 value corresponds to better sensitivity (better PTA4 and STM) as well as better BP detection. Moreover, the negative association between AUD_PC1 and Loudness PC2 is also interpretable, in the sense that increases in Slope low are reflective of greater hearing loss (Brand & Hohmann, 2002).

Results from the PCA performed on the auditory variables. The x- and y-axis show the component scores of AUD_PC1 and AUD_PC2. Individual participants are indicated using blue digits. The axes at the top and on the right indicate the magnitude and direction of the loadings for the auditory variables (PTA4, STM, IPDfmax, BP, Loudness PC1, Loudness PC2) on PC1 (top) and PC2 (right). The grey dashed lines indicate the largest absolute loadings on PC1 and PC2. Note that the scale of STM and PTA4 has been reversed.
The second principal component derived from the auditory variables (AUD_PC2) explained 20.8% of the total variance. Figure 4 shows that IPDfmax and Loudness PC1 loaded negatively onto that component. A decrease in AUD_PC2 is indicative of better auditory abilities, in the sense that a higher IPDfmax value corresponds to better binaural processing abilities, while a larger Loudness PC1 value corresponds to low UCL value. According to the literature, a lower UCL is reflective of a milder hearing loss (Punch et al., 2004), i.e., better hearing abilities.
The first principal component derived from the cognitive variables (‘COG_PC1’) accounted for 52.1% of the total variance in these variables. Figure 5 shows that the variables from the working memory task (SPANfor, Scorefor, SPANback, Scoreback) loaded negatively onto this component. The associations appear meaningful, in the sense that higher SPANfor, Scorefor, SPANback and Scoreback values correspond to better working memory capacity. The second cognitive component (‘COG_PC2’) explained 20.3% of the total variance, with the variables from the trail-making test (TMT.A, TMT.B; both reversed in scale) loading positively onto it. An increase in COG_PC2 is thus reflective of higher processing speed.
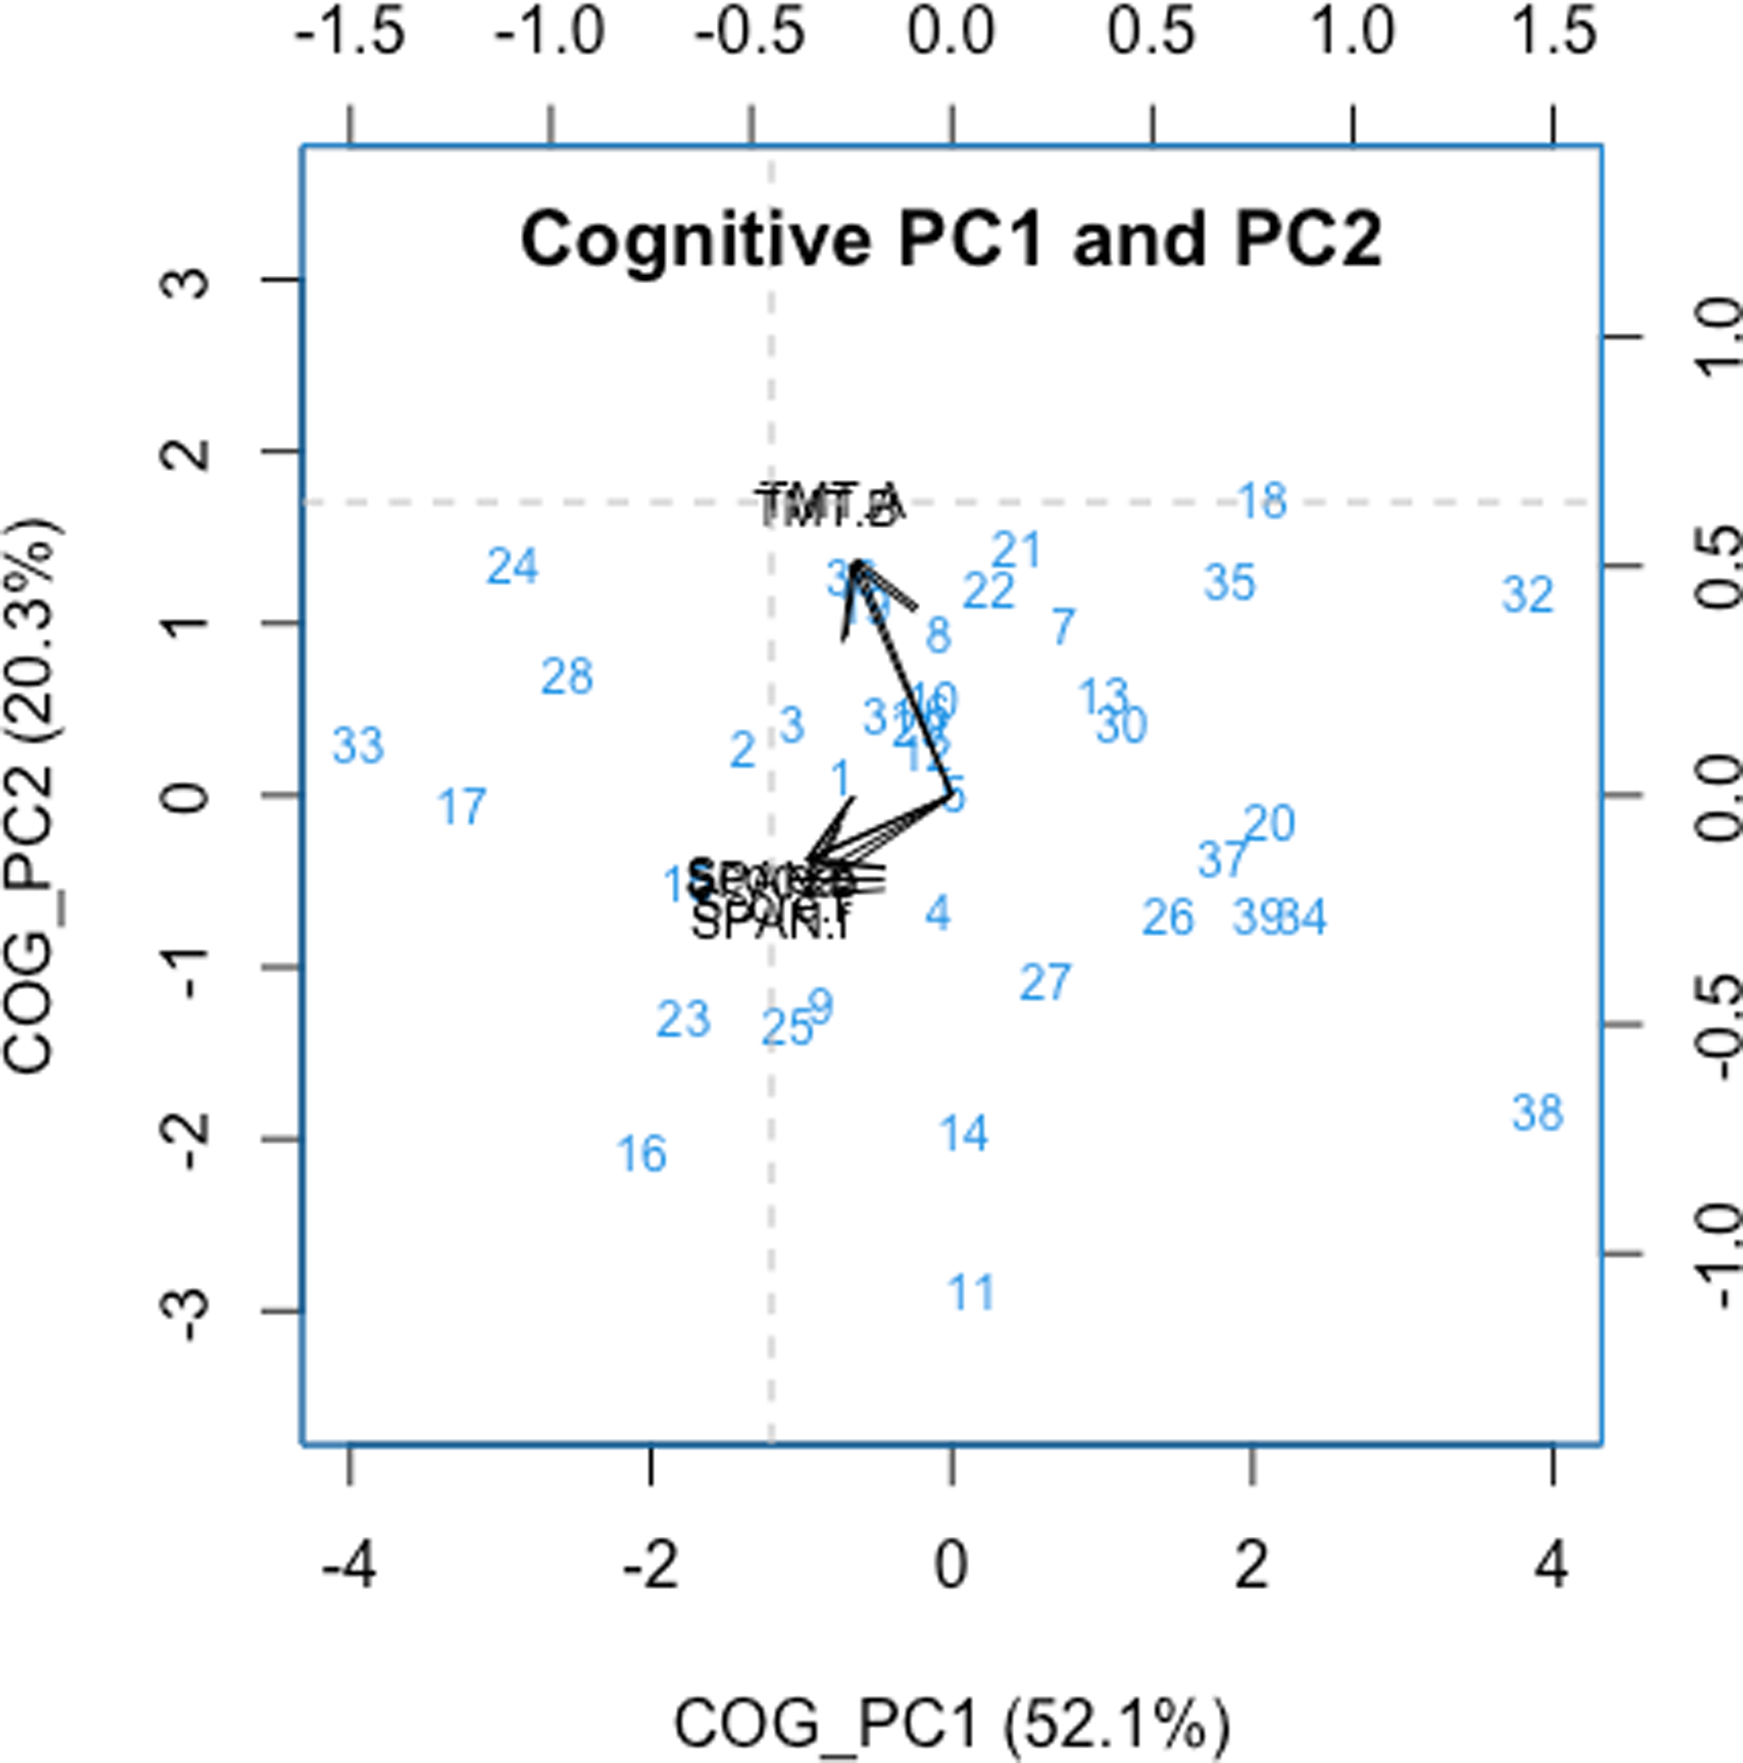
Results from the PCA performed on the cognitive variables. The x- and y-axis show the component scores of COG_PC1 and COG_PC2. Individual participants are indicated using blue digits. The axes at the top and on the right indicate the magnitude and direction of the loadings for the cognitive variables (SPANfor, SPANback, SCOREfor, SCOREback, TMT.A, TMT.B) on PC1 (top) and PC2 (right). The grey dashed lines indicate the largest absolute loadings on PC1 and PC2. Note that the scale of TMT.A and TMT.B has been reversed.
The first principal component derived from the aided outcome variables (‘Outcome_PC1’) explained 57.1% of the total variance in these variables. Figure 6 shows that all six aided outcomes loaded negatively onto Outcome_PC1. The associations indicate that higher Outcome_PC1 values are indicative of poorer aided SIN outcome. Due to the strong associations with all outcome variables, Outcome_PC1 was chosen to represent overall aided outcome in the regression analyses.

Results from the PCA performed on the outcome variables. The x- and y-axis show the component scores for Outcome_PC1 and Outcome_PC2. Individual participants are indicated using blue digits. The axes at the top and on the right indicate the magnitude and direction of the loadings for the aided outcome variables (HINTSSN, HINTBBN, HINTDLGs, JFCSSN, JFCBBN, JFCDLGs; all reversed in scale) on PC1 (top) and PC2 (right). The grey dashed lines indicate the largest absolute loadings on PC1 and PC2.
Multiple Linear Regression Analyses
Table 2 summarizes the three regression models that were built. The model based on HINTmean accounted for 30% of the variance in these data, with AUD_PC1 being the only significant predictor. When examining this relationship together with the corresponding PCA results more closely, it is apparent that better HINT performance (i.e., a lower SRT) is proportional to a lower PTA4, better STM, a shallower Slope low , and better performance on the BP task. By comparison, the model based on JFCmean was not significant. Lastly, the model based on Outcome_PC1 was similar to the one based on HINTmean. That is, AUD_PC1 was the only significant predictor, yet overall the model was not significant (pmodel = 0.08).
Results of the Multiple Linear Regression Analyses Performed on the Three Outcome Variables (HINTmean, JFCmean, Outcome_PC1).

b = estimate of regression coefficients; SE = standard error; t = t-statistic; p = p-value; MSE = mean square error; pmodel = p-value of the F-statistic for the comparison between the full model and the model without predictor. *: p < .05, **: p < .01, ***: p < .001.
Discussion
Predictors of Aided HINT Outcome
As speech recognition in noise has been the focus of many HA studies, aided HINT outcome was considered in the current study. The corresponding regression model showed that AUD_PC1 was the only significant predictor of HINT performance. This finding confirms that aided speech recognition is associated with auditory factors, specifically hearing sensitivity (PTA4), loudness perception (Slope low ), spectro-temporal resolution (STM), and binaural pitch detection (BP). Broadly speaking, the finding of a clear influence of auditory factors on HINT outcome is consistent with the results of previous studies (Humes et al., 1994; Lopez-Poveda et al., 2017; Nuesse et al., 2018). For instance, Nuesse et al. (2018) found PTA4 to be the only significant predictor, despite the fact that these authors included several cognitive variables (i.e., working memory, executive function, lexical and semantic abilities) and that they assessed aided SIN performance in five realistic noise scenarios. Similarly, Lopez-Poveda et al. (2017) found factors related to frequency modulation detection and speech intelligibility in quiet to be strong predictors of aided speech recognition in noise.
Regarding the question of whether cognitive factors can predict aided speech recognition in noise, research findings are inconsistent. In a meta-analysis of how various cognitive abilities relate to SIN perception, the link between working memory capacity and aided SIN performance was clearest, especially when working memory was measured with a reading span test (Akeroyd, 2008). In the current study, the Corsi block-tapping task was used to assess working memory. It is possible that this choice of test (or tablet-based implementation) resulted in there being no link between COG_PC1 and aided HINT outcome. However, other HA studies that applied more widely used working memory tests like the reading span test did not necessarily find significant relations between this type of cognitive skill and aided SIN perception either (Lopez-Poveda et al., 2017; Nuesse et al., 2018).
Previous research has suggested that cognitive factors are more likely to predict aided SIN performance when the speech stimuli contain limited contextual information. Rönnberg et al. (2016) conducted a study with more than 200 older HA users and found that both cognitive and auditory factors were significant predictors of aided SIN performance. Specifically, the relation with a principal cognitive factor, which these authors extracted through a series of factor analyses, was stronger with context-free sentences than with context-bound, naturalistic sentences such as those used in the HINT. Compared with the current study, Rönnberg et al. (2016) used a greater variety of cognitive tests and a much larger sample size, which could be why their principal cognitive factor was related to aided SIN outcome. Nevertheless, the predictive power of their regression models for different aided SIN outcomes was no higher than 40%. In other words, a considerable proportion of the variance was left unexplained, even though a large battery of auditory and cognitive tests and a very large sample size were used in that study.
In the current study, the participants were fitted with HAs according to manufacturer-recommended procedures. Previous research has shown that when speech audibility is maximized in HA fittings, cognitive factors like working memory account for more of the variance in aided SIN outcome (Humes, 2007; Humes et al., 2006). Proprietary fitting rationales commonly prescribe less high-frequency gain compared with generic rationales (Keidser et al., 2003; Sanders et al., 2015), mostly because of comfort issues. Since in the current study a proprietary fitting procedure was used, this might explain why cognitive factors did not play a role in predicting aided SIN outcome.
Predictors of Aided JFC Outcome
In the current study, neither auditory nor cognitive factors were found to be significant predictors of aided JFC outcome. In a previous study, no significant effect of the four auditory profiles from the BEAR project on aided JFC outcome was found either (Wu et al., 2021). Broadly speaking, this is consistent with the lack of relations between auditory factors and self-adjusted SNRs observed here. One of the motivations for the current study was to investigate whether some of the variance in JFC outcome could be explained by cognitive factors instead. However, this was clearly not the case, with the corresponding regression model being a poor fit to the data (R2 = 0.06; p = 0.71).
A possible explanation for the lack of auditory and cognitive influences on aided JFC outcome could be individual differences in the criterion used for adjusting the level of the target speech to make it “neither easy nor difficult to follow”. The principles behind the JFC task are similar to those behind the acceptable noise level (ANL) test, which is more widely used in HA research. In the ANL test, the target speech level is typically first set to the individual MCL. The participant then adjusts the noise level until the resultant SNR is deemed acceptable for prolonged listening (Eddins et al., 2013; Nabelek et al., 2004). In general, auditory factors such as hearing sensitivity have been found to be unrelated to ANL outcome (Freyaldenhoven et al., 2007; Mueller et al., 2006; Neher & Wagener, 2016; Plyler et al., 2007). One reason for this could be that participants differ in whether they apply an intelligibility-based criterion, a loudness-based criterion, or another type of criterion when carrying out the ANL test (Eddins et al., 2013; Recker & Edwards, 2013). Under the assumption that a similar explanation holds for the JFC task, this could explain why none of the predictors considered here was found to be effective.
Revisiting Auditory Profiling from the Perspective of Aided SIN Outcome
The current study revisited the idea of profiling HA candidates from the perspective of aided SIN outcome by including cognitive factors in the assessment. To recapitulate, the regression analyses showed AUD_PC1 to be the only significant predictor of both aided HINT outcome and overall aided outcome (Outcome_PC1). Given this finding, the current study suggests that auditory factors dominate aided SIN outcome, at least when HAs are fitted according to manufacturer-recommended procedures. Overall, this suggests that the auditory profiles could be a good basis for more personalized HA fitting strategies, as they are able to capture some individual differences in aided SIN outcome.
In earlier work by the authors, large inter-individual differences were observed among profile-C listeners, that is, HA users with profound hearing deficits (Wu et al., 2021, 2020). In the current study, it was hypothesized that cognitive factors would be able to account for at least some of these differences. Nevertheless, this was not the case. In principle, it is possible that cognitive and auditory factors could interact with respect to aided SIN outcome. In other words, the variance observed within the profile-C group might be due to individual cognitive differences. Due to the relatively small sample size used here, a formal investigation of this possibility was not possible and would therefore have to be addressed in future research. On the other hand, different versions of the cognitive measures could affect performance and thus might in principle influence the overall statistical result of the regression model. For example, the trail-making test has pen-and-paper and tablet versions. The tablet versions can also differ in how the participants link the circles (Karimpoor et al., 2017; MotusDesignGroup, 2016). However, most of the differences between the TMT versions are likely to relate to motor skills, which has not been associated with aided SIN outcome in the literature.
The predictive power of the multiple regression models built here was generally rather low (R2 ≤ 30%), which means that a considerable proportion of the variance was left unaccounted for. With a larger sample size, the robustness of these models could be improved, which could, in principle, also allow for other associations to emerge. In the literature, studies based on larger sample sizes that have used multiple linear regression analyses to link auditory and cognitive predictors to aided SIN outcome have typically produced relatively low R2 values (Lopez-Poveda et al., 2017; Rönnberg et al., 2016). One reason for this could be that some important individual factors have been neglected so far. Alternatively, it is possible that the underlying relationships are nonlinear in nature. Originally, the current study was meant to use non-linear supervised learning models to investigate the relations between the factors considered here. More specifically, it was planned to use decision-tree models, as for example done when developing the BEAR clinical test battery (Sanchez-Lopez et al., 2019). However, a larger sample size was impossible to achieve given the pandemic situation, which is why these plans were abandoned. Future studies should ideally address the value of non-linear models for exploring how auditory and cognitive predictors relate to aided SIN outcome.
Finally, recent ideas related to the effects of hearing rehabilitation on cognitive decline could provide another perspective on the relation between auditory abilities, cognitive abilities, and aided outcome. Age-related hearing loss has repeatedly been linked with cognitive decline, and there are studies suggesting that hearing rehabilitation may be able to delay or perhaps even prevent cognitive deterioration (Cuoco et al., 2021; Lin et al., 2013; Maharani et al., 2018; Panza et al., 2015). The possible association between HA treatment and cognitive abilities could imply that poorer cognitive abilities originate from auditory deficits or ineffective rehabilitation. Whether cognitive decline and aided SIN outcome indeed affect each other on a long-time scale will require further research.
Conclusion
The current study revisited the concept of auditory profiling by investigating if cognitive factors can explain some of the variance in SIN outcome as assessed with HAs fitted according to manufacturer-specific procedures. The results showed that aided HINT performance was related to auditory factors (i.e., hearing sensitivity, loudness perception, spectro-temporal resolution, and binaural hearing). In contrast, cognitive abilities as assessed using tablet-based implementations of the trail-making test and the Corsi block-tapping task were unable to predict aided SIN outcome. Broadly speaking, these findings are consistent with previous results suggesting that cognitive factors are predictive of aided SIN outcome in certain situations only (e.g., when the target speech contains little contextual information, and the HA provides considerable high-frequency gain to ensure speech audibility). Overall, these findings therefore suggest a need for further research before cognitive measures can be included in the profiling of HA candidates.
Footnotes
Acknowledgements
This work was supported by Innovation Fund Denmark Grand Solutions 5164-00011B (‘BEAR project’) as well as GN Hearing, Oticon and WS Audiology. The funding and collaboration of all partners is sincerely acknowledged. The authors thank Raul Sanchez-Lopez (Interacoustics Research Unit, Denmark) for support with the BEAR clinical test battery.
Declaration of Conflicting Interests
The author(s) declared no potential conflicts of interest with respect to the research, authorship, and/or publication of this article.
Funding
The author(s) disclosed receipt of the following financial support for the research, authorship, and/or publication of this article: This work was supported by the Innovationsfonden, (grant number 5164-00011B ).