
Abstract
Listeners with normal audiometric thresholds show substantial variability in their ability to understand speech in noise (SiN). These individual differences have been reported to be associated with a range of auditory and cognitive abilities. The present study addresses the association between SiN processing and the individual susceptibility of short-term memory to auditory distraction (i.e., the irrelevant sound effect [ISE]). In a sample of 67 young adult participants with normal audiometric thresholds, we measured speech recognition performance in a spatial listening task with two interfering talkers (speech-in-speech identification), audiometric thresholds, binaural sensitivity to the temporal fine structure (interaural phase differences [IPD]), serial memory with and without interfering talkers, and self-reported noise sensitivity. Speech-in-speech processing was not significantly associated with the ISE. The most important predictors of high speech-in-speech recognition performance were a large short-term memory span, low IPD thresholds, bilaterally symmetrical audiometric thresholds, and low individual noise sensitivity. Surprisingly, the susceptibility of short-term memory to irrelevant sound accounted for a substantially smaller amount of variance in speech-in-speech processing than the nondisrupted short-term memory capacity. The data confirm the role of binaural sensitivity to the temporal fine structure, although its association to SiN recognition was weaker than in some previous studies. The inverse association between self-reported noise sensitivity and SiN processing deserves further investigation.
Keywords
Introduction
Understanding speech under noisy conditions, particularly when partially masked by other speech utterances, is a demanding task sometimes referred to as “cocktail party listening” (Bronkhorst, 2000; Cherry, 1953; Oberfeld & Klöckner-Nowotny, 2016), by its most glamorous and at the same time most challenging application. It relies on or profits from a host of perceptual and cognitive capabilities, among them good audiometric sensitivity, binaural separation of signal and noise and a resulting binaural release from spectral and temporal masking, “glimpsing”/“listening in the gaps,” auditory grouping (or “scene analysis”) functions, and selective attention (e.g., to the target talker), that is, the ability to suppress irrelevant acoustic information such as background noise or interference from other talkers (for reviews see Bronkhorst, 2015; Mattys et al., 2012).
Given its multifaceted nature, it will not be a surprise that the everyday task of understanding speech in the presence of background noise is subject to considerable interindividual variability. For instance, Ruggles and Shinn-Cunningham (2011) found audiometrically normal listeners to vary between 40% and 85% correct identification when trying to understand single digits pronounced by a target talker flanked by two competing talkers 15° to the left and right, even under anechoic conditions. In a recent study from our laboratory (Oberfeld & Klöckner-Nowotny, 2016), young adult listeners with normal audiometric thresholds identified individual words embedded in five-word sentences with accuracies varying between 45% and 95% in a similarly rendered “cocktail-party” simulation with two spatially separated competing talkers.
Given these large individual differences, it is important to investigate how one can predict speech-in-noise (SiN) recognition performance from a number of perceptual or cognitive measures, typically by employing some form of multiple regression analysis. Given that audiometric thresholds obviously do not fully account for the variance in SiN identification, numerous studies investigated the relation of speech understanding in acoustically adverse conditions to suprathreshold hearing abilities and cognitive factors. Concerning the former, a popular hypothesis is that a so-called “hidden hearing loss” might affect hearing abilities without being signaled by elevated absolute thresholds (e.g., Kujawa & Liberman, 2009; Plack et al., 2014). Studies in this area focused particularly on temporal processing abilities that are important for making use of speech information provided by the acoustic temporal fine structure (TFS; e.g., Rosen, 1992; Shamma & Lorenzi, 2013). Several experiments found that the binaural sensitivity for the binaural TFS (i.e., the sensitivity for interaural phase differences [IPD]) or the monaural TFS sensitivity (e.g., the discrimination between harmonic and inharmonic tone complexes; Moore & Sek, 2009) is related to SiN identification (e.g., Oberfeld & Klöckner-Nowotny, 2016; Rönnberg et al., 2016; Ruggles et al., 2011). Another suprathreshold auditory capability reported to be correlated with SiN identification is the processing of spectrotemporal modulations (e.g., Bernstein et al., 2013, 2016; Davies-Venn et al., 2015).
Concerning potential cognitive factors, studies investigated the relation between SiN identification and processing speed as well as several aspects of attention (e.g., Akeroyd, 2008; Dai & Shinn-Cunningham, 2016; Heinrich et al., 2015; Neher et al., 2011; Neher et al., 2012; Schoof & Rosen, 2014). While in most of these studies “attention” or “cognition” was used in a relatively unspecific way in the regression analyses, averaging across, for example, several different aspects of attention such as sustained, divided, and selective attention, a recent study from our laboratory (Oberfeld & Klöckner-Nowotny, 2016) focused on the ability to focus selective attention on a target stimulus in the presence of distractors. For a group of young adult listeners with normal-hearing and above-average cognitive abilities, both auditory selective attention—measured by an auditory intensity discrimination task under backward masking (Oberfeld et al., 2014)—and visual selective attention—measured by a visual flanker task (Eriksen & Eriksen, 1974)—were associated with speech-in-speech recognition performance. Together, the two measures of selective attentional capabilities explained the same amount of variance as binaural TFS sensitivity. The general dominance weight (GDW), which indexes a variable's contribution to the prediction of the dependent variable, by itself and in combination with the other predictors (i.e., squared semipartial correlations averaged across all possible subset models; Azen & Budescu, 2003), was .152 and .052 for the measures of auditory and visual selective attention, respectively, and .204 for the binaural TFS sensitivity (sample size N = 45).
Understanding speech also requires memory: because speech is distributed across time, we need to remember the first words of a sentence in order to be able to relate them to subsequent words and to parse the meaning of the whole sentence (Just & Carpenter, 1992; Mattys et al., 2009). For this reason, working memory (WM) capacity has been another focus of studies trying to identify cognitive factors of SiN identification (e.g., Akeroyd, 2008; Rönnberg et al., 2019). However, somewhat surprisingly, a recent review of studies conducted in normal hearing listeners concluded that the relation between WM capacity and SiN identification is relatively weak (Füllgrabe & Rosen, 2016), while stronger correlations were reported for older, hearing-impaired listeners (e.g., Akeroyd, 2008; Rudner et al., 2011).
Here, we investigate whether a specific noise-related aspect of WM performance shows a stronger relation to SiN identification in normal-hearing listener than WM capacity per se. The irrelevant speech effect or irrelevant sound effect (ISE; e.g., Colle, 1980; Colle & Welsh, 1976; D. M. Jones & Macken, 1993; Salamé & Baddeley, 1982) is the phenomenon that task-irrelevant speech or other temporally varying sounds severely impairs the short-term memorization of lists of items in correct order (Beaman & Jones, 1997); for reviews, see Ellermeier and Zimmer (2014) and Hughes (2014). The ISE, defined as the impairment in serial-recall performance relative to a condition without background noise, occurs regardless of whether the to-be-remembered items are presented visually or auditorily (Campbell et al., 2002; Kattner & Ellermeier, 2020; Kattner & Meinhardt, 2020; Kattner et al., 2019; Schlittmeier et al., 2008). Thus, the interference appears to occur in memory. It is typically assumed that irrelevant sound either interferes with a specific process that is demanded by the focal task (e.g., serial rehearsal of verbal items; Hughes & Marsh, 2017; D. M. Jones & Tremblay, 2000) or diverts attention from the focal task due to the sound's inherent meaning or nonmatch with a predictive neural model (i.e., attentional capture; Hughes & Marsh, 2017). In the WM concept by Oberauer and colleagues (e.g., Oberauer et al., 2007), the main role of WM is to build, maintain and update spatial, temporal, or spatiotemporal bindings between representations. For instance, to build a memory representation of a list of items, the items need to be bound to their temporal or ordinal position in the list. In fact, in the serial-recall task with digit lists often used to study the ISE, the complete set of items (i.e., the digits 0–9) presented on each trial is known beforehand; it is their trial-specific presentation order that needs to be memorized. Compatible with the changing-state account for the ISE (D. Jones, Madden & Miles, 1992), the automatic creation of bindings (i.e., cues to serial order) for the irrelevant background sound might interfere with the temporal bindings of the to-be-remembered item lists. Because bindings also play an important role in language comprehension (Oberauer, 2017), individual differences in the binding aspect of WM capacity might be particularly strongly associated with individual differences in language abilities, including speech recognition in acoustically adverse conditions. Thus, our rationale is that the specific noise-related disruption of short-term memory represented by the ISE might show a stronger relation to SiN identification than WM capacity per se, because the latter includes the binding aspect but also different aspects (Wilhelm et al., 2013). A person who experiences a particularly strong negative effect of acoustic noise on memory might have particularly severe difficulties in understanding speech in an acoustically adverse situation, for example when trying to follow a conversation in a crowded restaurant where many competing talkers are present. To what degree individuals are aware of these difficulties, is an interesting side issue, and the reason why we decided to include a measure of self-reported “noise sensitivity” in the present study. After all, noise sensitivity questionnaires (e.g., Schütte et al., 2007; Weinstein, 1978; Zimmer & Ellermeier, 1998) always include items quantifying the subjective difficulties in understanding speech in noise (SiN) or in competing speech. In any case, since the ISE shows considerable individual differences (Ellermeier & Zimmer, 1997), just as SiN identification does, studying their interrelation at an individual level appears promising.
Surprisingly, we were unable to find studies investigating the relation between the ISE and cocktail-party listening. Two recent studies investigated the relation between SiN processing and serial-recall performance in conditions with task-irrelevant background noise. The latter measure can be viewed as a combined measure of short-term memory performance per se and the noise-induced impairment of serial-recall performance (i.e., the ISE). In a group of 51 normal-hearing and hearing-impaired listeners, aged 21–77 years, Gallun and Jakien (2019) found a significant negative pairwise correlation between the number of items correctly reproduced from sequentially presented lists of visual letters in the presence of irrelevant auditory stimuli (digit lists) and speech reception thresholds in the presence of speech maskers. Thus, participants showing better serial-recall performance also showed better SiN identification performance. In a group of 30 young normal hearing listeners (Wasiuk et al., 2022), serial-recall performance in a similar condition was not a significant predictor of speech-reception thresholds in the presence of two-talker-speech maskers or speech-shaped-noise maskers. In the present study, we specifically and separately analyze how speech-in-speech processing is associated with (1) general short-term memory performance (measured by serial-recall performance in the absence of background noise) and (2) the ISE (measured as the background noise-induced impairment in serial-recall performance relative to a condition without background noise).
There are several interesting similarities and differences between the irrelevant speech paradigm and the SiN recognition paradigm: In both tasks, subjects (1) have to report a limited set of words/items they have just seen or heard in the correct order while (2) being presented with irrelevant auditory distractors (typically speech or tone sequences for the ISE paradigm and either speech or noise for the SiN paradigm), and (3) an impairment in serial recall of auditorily presented items lists (ISE) and in speech identification (SiN) occurs even when the target items are presented well above the masked threshold, so that effects of energetic masking (for a definition see Durlach et al., 2003) can be assumed to be relatively small. However, (4) in a SiN task, participants respond immediately after the stimulus, while in the irrelevant-speech paradigm they can typically only respond after a retention interval of several seconds, putting greater demands on short-term memory.
Assuming that there are some mechanisms common to both tasks (SiN, ISE), such as (1) filtering out distractors and (2) maintaining serial information in memory, it seems interesting to relate them with respect to the individual performance differences observed in each one. That way, the contribution of the cognitive mechanisms underlying resilience to irrelevant sound to superior performance in a speech-in-speech recognition task may be quantified. In the present study, that is done while implementing the SiN and ISE paradigms as similarly as is possible, given their intrinsic dissimilarities, i.e., implementing both as recall of the utterances of a frontal target talker in the presence of two interfering talkers slightly off to the left and right. On a methodological note, because in our understanding of the relevant literature there is not a single, “gold standard” approach for analyzing and comparing the associations between several empirical (and thus likely correlated) predictors and a criterion variable (performance in a speech-in-speech recognition task), we use two different, complementary types of regression analyses approaching the bias-variance trade-off (for an excellent introduction see Chapter 2.2 in James et al., 2023) from slightly different angles (see also Oberfeld & Klöckner-Nowotny, 2016).
To summarize, the present study was designed to:
Investigate both speech-in-competing-speech sentence identification (SiN) and disruption of serial recall by irrelevant speech (ISE) in a sample of young listeners with normal audiometric thresholds, Measure the degree of disruption of serial short-term memory by irrelevant speech in the ISE paradigm both when the to-be-remembered items are presented visually and auditorily to make sure the effect occurs after encoding in verbal short-term memory and not at a peripheral auditory level (e.g., masking effects), Measure the extent of individual differences in SiN identification and irrelevant-speech disruption (ISE) and measure the across-task correlation, and Predict speech-in-speech recognition scores from the ISE as well as from a number of previously studied perceptual (e.g., audiometric thresholds, binaural sensitivity for the TFS), cognitive (short-term memory capacity), and attitudinal (self-reported noise sensitivity) measures.
Methods
Participants
Sixty-seven volunteers (57 female and 10 male) with normal hearing participated in the experiment, representing a relatively large sample size compared to some previous studies in this field. The sample size of N = 67 had been selected to have a power of 1–β = .80 to identify a relatively small negative correlation (r = −.30, corresponding to 9% explained variance) between the individual speech-in-speech recognition performance and the individual ISE with a one-sided test, at an α-level of .05. Of note, we collected a relatively large number of trials per participant in the different tasks (SiN matrix test, serial recall task, measurement of binaural TFS sensitivity, etc.) to ensure acceptable reliability of the measures derived from these tasks, with the number of trials selected based on previous own results obtained with these tasks and data from the literature. High reliability (i.e., low measurement error) of course reduces the sample size required to detect a given correlation in the population. We report the observed reliability of the measures across blocks, where applicable.
Participants were aged between 17 and 37 years (M = 22.85 years, SD = 4.37 years), and 65 of them were psychology students. All participants were native speakers of German or spoke German on the level of a native speaker. They reported normal hearing and no history of hearing problems, as well as normal or corrected-to-normal vision. All participants had audiometric hearing thresholds better than 20 dB HL bilaterally between 125 Hz and 4 kHz. The maximal threshold asymmetry between left and right ear in the same frequency range was 15 dB.
All subjects participated voluntary and provided written consent after they had been informed about the procedure, topic, requirements and potential risks of the study. One participant was underage (17 years); written consent was obtained from a parent. The study complied with the principles expressed in the Declaration of Helsinki, and the protocol was approved by the ethics committee of the Department of Psychology, Technische Universität Darmstadt (EK 19/2017). The psychology students received partial course credit for their participation. All participants also had a chance of winning one of three 10 Euro Amazon vouchers.
Apparatus
The experiment was conducted in a double-walled soundproof chamber (Industrial Acoustic Company). The sounds were presented via Sennheiser HDA 300 headphones, calibrated according to IEC 60318-1:1998 (1998), connected to an RME HDSP 9632 audio interface. Visual stimuli, instructions and feedback were presented on a computer monitor (Dell 1702FP). Participants responded by using a numeric keypad or a computer mouse, depending on the task.
Tasks and Measures
Audiometric Thresholds
Audiometric thresholds in the frequency range between 100 Hz and 16 kHz were measured bilaterally via Békésy-tracking (Békésy, 1947) with pulsed 270-ms pure tones including 10-ms cos2 on- and off-ramps. The frequency increased exponentially from tone to tone, at a rate of 1.4 octaves/minute. To estimate the thresholds as a function of frequency, in the first step, for each combination of listener and ear, the mid-points between each pair of adjacent reversals in an adaptive track were computed. Then, a shape-preserving piecewise cubic interpolation function was fitted to the mid-points, using the Matlab-function interp1. The fitted functions were used in the data analysis to compute thresholds at octave frequencies. The sound pressure levels were converted to hearing levels based on reference-equivalent sound pressure levels for the Sennheiser HDA 300 headphones published by the manufacturer.
Cocktail-Party Listening Task: Speech Identification in the Presence of Competing Talkers
We simulated a cocktail-party listening task with two interfering talkers (i.e., speech-in-speech recognition), using the same setup as in Oberfeld and Klöckner-Nowotny (2016). Listeners performed a sentence identification task with a German matrix test (Oldenburger Satztest OLSA; HörTech gGmbH, Oldenburg). Its speech material consists of 100 sentences with the syntactic structure name-verb-numeral-adjective-object (e.g., “Peter kauft vier leine Messer”—“Peter buys four small knives”), constructed by randomly selecting one of ten alternatives for each word position (Wagener et al., 1999a). This results in syntactically correct but semantically unpredictable sentences. The sentences are produced by an adult male talker and are optimized for similar intelligibility (Wagener et al., 1999b). The task was to identify the sentence produced by the target talker. The matrix of 5 (Word Position) × 10 (Alternatives) Words constituting the sentence test was displayed on a computer monitor. On each trial, subjects were asked to select the five words the target talker (azimuthal angle of 0°) had just produced, using a computer mouse. The selected words were displayed in a row below the matrix of test words. Initially, the selected words were displayed in black color. After confirming their selection by clicking on an “Accept” button, the participants received immediate feedback concerning the correctness of their selection of words. Correctly identified words were colored in green, and incorrect words were colored in red. This visual feedback was presented for 500 ms. The next trial then started automatically after a pause of 500 ms. On each trial, the proportion of correctly identified words for the target talker was computed (speech-in-speech recognition score [SRS]), which could range between 0.0 (0 words identified correctly) and 1.0 (all of the five words identified correctly). Note that in relation to the terms typically used in memory research, this task can be described as being in between a recognition task (because the complete set of the 50 possible words is displayed during the response phase) and a recall task (because participants are required to select five words from the set of 50 words). Also, note that the presentation order of the words in each spoken sentence was determined by the fixed syntactic structure name-verb-numeral-adjective-object.
The target talker and the two interfering talkers were presented binaurally via headphones, using head-related impulse responses (HRIRs) to simulate different spatial positions of the sound sources. The target talker was presented from the front (0° azimuthal angle). The interfering talkers were presented 25° to the left and 25° to the right of the target talker. HRIRs from an anechoic room were used (Kayser et al., 2009). In the experiment, the target talker was presented at an average sound pressure level of 58 dB SPL (measured according to IEC 60318, slow time constant, across several OLSA sentences), while each interfering talker was presented at an average sound pressure level of 60 dB SPL. Thus, assuming that the acoustic signals from the three talkers were uncorrelated, the long-term signal-to-noise ratio (SNR; target talker intensity relative to the combined competing talkers intensity) was −5 dB.
On each trial, the sentences produced by the target talker and the two interfering talkers were selected at random from the set of 100 test sentences, with the restriction that none of the three talkers produced an identical word. Note that the same male voice was used for the target talker and the two interfering talkers. All of the three talkers started simultaneously. Due to the relatively high SNR combined with high acoustic-perceptual similarity (same voice used for target and competing talkers), we would assume that informational masking (e.g., Durlach et al., 2003; Pollack, 1975; Watson et al., 1976) dominated, although energetic masking likely played an additional role. Distinguishing between these two types of masking is beyond the scope of our study.
The participant first received one block with 25 trials without interfering talkers, to become familiar with the task and with the position of the target talker. Subsequently, three blocks with two interfering talkers were presented, containing 50 trials each.
Serial Recall Task: Irrelevant Speech Effect and Short-Term Memory Performance
The Irrelevant Speech Effect was measured in two different serial-recall memory tasks, one with visually and one with auditorily presented items. On each trial, a list of eight digits was presented sequentially. The digits were drawn randomly without replacement from 0 to 9, excluding 7, and they were presented in random order. Digit 7 was not used because in German it is the only digit with two syllables and might thus be remembered more easily in the auditory version of the task. Participants had to recall the digits in order (serial recall). After the last presented digit, a retention interval (4.8 s) followed, during which the participants were instructed to perform subvocal rehearsal. Next, the participant had to reproduce the presented sequence of eight digits in the correct order by clicking on a matrix on the computer display, which contained the digits 0–9 (without 7). The selected digit order was displayed above the matrix. After selecting eight digits, visual feedback was provided (e.g., “7 of 8 digits correct”), and the next trial started.
For the visual serial recall task, the digit lists were presented on the center of the screen, in black on a gray background and with a viewing angle of approximately 1.5° horizontally and 3° vertically. Each digit was presented for 900 ms, and digits were presented sequentially and without pauses. For the auditory serial recall task, recordings of spoken German digits were used (Obleser et al., 2012). The digit durations ranged from 525 to 651 ms and were presented with an inter-onset-interval of 900 ms just as the visual digit lists. Again, HRIRs from an anechoic room (Kayser et al., 2009) were used for presenting the target talker with an azimuthal angle of 0°. The digits were spoken by a female talker and had an A-weighted energy-equivalent continuous sound pressure of LAeq = 62 dB.
On half of the trials, the serial recall task was performed in quiet. On the other half of the trials, two interfering talkers were presented via headphones, who started simultaneously with the first presented digit and ended with the end of the rehearsal interval (total duration of interfering speech 12 s). The interfering speech was created using the OLSA speech material. For the left interfering talker, seven randomly selected OLSA sentences were concatenated. The duration of the resulting interfering sound was restricted to 12 s by applying 200 ms on- and offset ramps. The same HRIR as for the SiN task was applied, so that the interfering talker was presented at an azimuthal angle of 25° to the left. Using the same method, the sound for the right interfering talker was generated. The two interfering talkers never spoke the same sentence at the same time, but the same sentence could appear several times in one interfering sound. Before the experiment started, we created a set of 50 of such interfering sounds. On each trial with interfering speech, one of the 50 interfering sounds was selected randomly. The LAeq of each of the two interfering talkers was 55 dB. Thus, the SNR was +4 dB. We selected such a high SNR to minimize energetic masking of the target talker by the interfering talkers.
For both item types (visual and auditory), two blocks with 50 trials each were presented. Each block contained 25 trials in quiet and 25 trials with interfering talkers, presented in random order. Thus, 50 trials were presented in quiet, and 50 trials with interfering talkers, for each item type. According to Ellermeier and Zimmer (1997), an internal consistency of Cronbach’s α = .75 can be expected with 50 trials per condition, which is sufficiently high for assessing the Individual Irrelevant Speech Effects. Before the first block of each serial recall task, the participants received three randomly selected practice trials which were excluded from the data analysis.
Binaural Sensitivity for the Acoustic Temporal Fine Structure
To assess the individual binaural sensitivity for the acoustic TFS, we measured the just-detectable interaural phase difference (IPD) relative to an IPD of 0°, using the TFS-LF test (Hopkins & Moore, 2010). Two observation intervals containing four pure tones each (500 Hz, 50 dB SPL) were presented consecutively on each trial. In one of the intervals, all tones had an IPD of 0°. In the other interval, the IPD of the second and fourth tone was greater than 0°, producing a change in lateralization for a person sensitive to IPDs. The interval containing the phase shift was chosen randomly. All tones had a duration of 400 ms, including 50 ms on- and offset ramps. The interstimulus intervals between the tones were 20 ms, and the silent interval between the first and the second interval was 200 ms. Participants had to identify the interval containing a shift in lateralization. Visual trial-by-trial feedback was provided.
The phase shift started with an IPD of 180° and was adjusted by a three-down, one-up adaptive procedure (Levitt, 1971). After three consecutive correct responses, the phase shift was reduced by dividing it by a = 1.252. After each incorrect response, the phase shift was increased by multiplying it by a. After the third reversal, the step size was reduced to a = 1.25. An experimental block ended after nine reversals or 70 trials, whatever occurred first. The geometric mean of the IPD at the last six reversals was taken as the IPD threshold (IPDth). After six practice trials, three adaptive tracks were run, in separate blocks. Adaptive tracks in which the standard deviation (SD) of the log10-transformed IPDs at the counting reversals was higher than 0.27 or where less than four reversals had been collected were excluded from the analysis, which affected only five of the 201 tracks.
Individual Noise Sensitivity Questionnaire
For measuring individual noise sensitivity, a German standardized noise sensitivity questionnaire (Lärmempfindlichkeitsfragebogen [LEF]) was used (Zimmer & Ellermeier, 1998). The questionnaire contains 52 items assessing the tolerance and sensitivity to noise in everyday situations and is characterized by high reliability (Cronbach's α = .92; retest reliability rtt = .91) and validity (Zimmer & Ellermeier, 1999).
Sessions
The experiment contained two experimental sessions with the duration varying between 1.5 and 2.0 h each. There was a mandatory break of at least two hours between the two sessions.
Each participant received the tasks in the same order, in order to avoid an increase in variance due to different task orders. Because our aim was to study individual differences in SiN processing and their relation to individual differences on other psychoacoustical and cognitive tasks, having participants complete the tasks (or conditions nested within tasks) in different orders could have increased the interindividual variance due to potential order-effects. This experiment-induced variance would make it more difficult to detect between-subjects associations between the measures of interest.
In the first session, we measured (1) audiometric thresholds, (2) the binaural sensitivity for the TFS, and (3) the irrelevant speech effect with visually presented item lists. In the second session, we (1) measured speech-identification in noise, (2) presented the noise sensitivity questionnaire, and (3) measured the irrelevant speech effect for auditory item lists.
Results
We first report an overview of the performance on the different tasks, followed by regression analyses investigating the association between the cognitive and psychoacoustic predictors and the target measure (speech recognition score in the cocktail-party listening task).
Audiometric Thresholds
Individual thresholds were computed separately for each ear as the average sound pressure level in a third-octave band around octave frequencies between 125 Hz and 4 kHz. Figure 1 shows the mean thresholds as a function of frequency.

Distribution of individual better-ear pure tone average thresholds between 250 Hz and 4 kHz (PTABE, left panel), and the average bilateral asymmetry of the thresholds at the same octave frequencies (HLdiff, right panel).

Mean audiometric thresholds at octave frequencies between 125 and 4000 Hz. Squares: left ear. Triangles: right ear. Error bars show plus and minus one standard error of the mean (SEM) of the 67 individual values.
The individual better-ear pure tone average threshold (PTABE) at octave frequencies between 250 Hz and 4 kHz was used in the regression analyses. Also, the average individual average bilateral asymmetry of the thresholds across the same octave frequencies (HLdiff) was analyzed, because asymmetric thresholds can affect binaural unmasking on the basis of interaural time difference (ITD) cues (Bronkhorst & Plomp, 1989). The distribution of PTABE and HLdiff across the 67 listeners is displayed in Figure 2.
Speech-in-Noise Recognition Score
For each listener and each block of 50 trials collected in the simulated cocktail-party listening task (sentence identification task with two interfering talkers), the proportion of correctly identified words for the target talker was computed (speech-in-noise recognition score [SRS]). To identify differences in the mean SRS between the three blocks, the data were analyzed with a repeated-measures analysis of variance (rmANOVA) with the within-subjects factor block, using the multivariate approach. The same type of rmANOVAs is used in all following analyses. Because nonnormally distributed measures can cause problems in repeated-measures ANOVAs (e.g., Oberfeld & Franke, 2013), the proportion-correct values were arcsin-square-root transformed (Bartlett, 1936) to obtain a closer approximation to the normal distribution. An rmANOVA showed a significant effect of block, F(2, 65) = 33.88, p < .001. The mean proportion of correct responses was considerably lower in the first block than in the two following blocks, compatible with data by Wagener et al. (1999c) who reported a sizeable practice effect in steady background noise, and with data from a similar setting reported by Oberfeld and Klöckner-Nowotny (2016). A paired-samples t-test conducted on the data from Blocks 2 and 3 still showed a significant but relatively weak effect of block on the SRS, t(66) = 3.13, p = .003, Cohen’s (1988) dz = 0.38. The data from the first block of the cocktail-party listening task were excluded from further analyses, and the mean SRS across Blocks 2 and 3 was used as the target measure in the regression analyses. Figure 3 shows the distribution of the mean SRS in our sample of 67 participants. As expected, our young, normal-hearing participants showed considerable variation in their performance in the cocktail party listening task. The mean SRS ranged from 44% to 96%. The degree of agreement between the two analyzed measurements of the SRS (Blocks 2 and 3) represents the test–retest reliability and was assessed by a consistency definition of the intraclass correlation coefficient for average measures in a two-way mixed model (ICC(C,2) in the nomenclature of McGraw & Wong, 1996). The two blocks were taken as two “raters”/ “measurements” and the 67 participants were taken as “targets”/“objects of measurement” (McGraw & Wong, 1996; Shrout & Fleiss, 1979). The selected variant of the ICC includes the variance between the two measurements (i.e., blocks), the ICC applies to the average of the two measurements, and the effect of participant was treated as random while the effect of blocks was treated as fixed. The reliability of the SRS was high, ICC(C, 2) = .947.
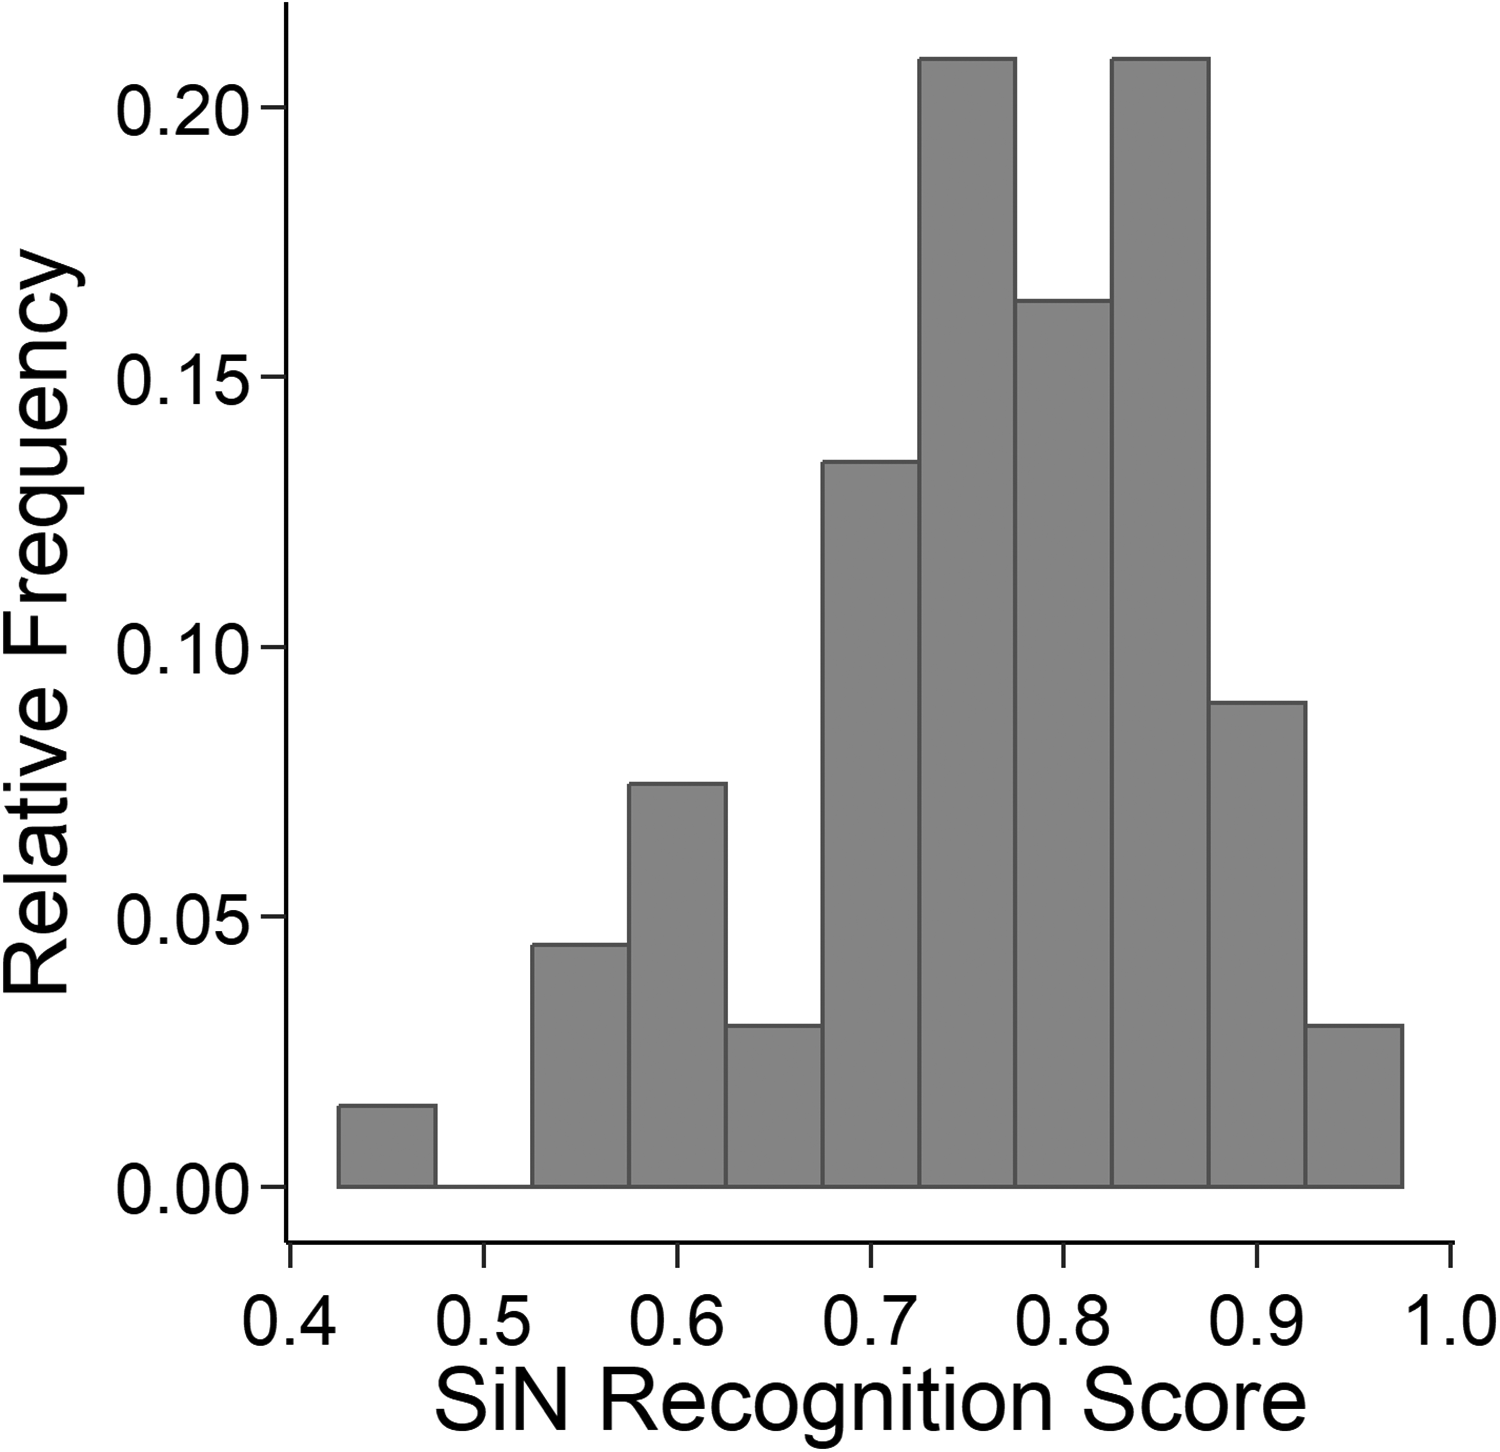
Distribution of individual speech-in-speech recognition scores (SRS; average proportion of correctly identified words in the OLSA matrix test) in the simulated cocktail-party listening task with two competing talkers.
Serial Recall Task: Irrelevant Speech Effect and Short-Term Memory Performance
The data from the serial recall task were analyzed in terms of the average proportion of correctly recalled digits per trial. The correct digit had to be reported in its presentation position for it to be counted correct. Figure 4 shows the mean proportion correct as a function of item type (auditory, visual), acoustic context (in quiet, two irrelevant talkers), and Block (1, 2).

Mean proportion correct in the serial recall task, as a function of item type (auditory or visual), Block (1 or 2), and sound condition (open squares: in quiet. Triangles: in the presence of two competing talkers). Error bars show ± 1 SEM.
An rmANOVA on arcsin-square-root transformed proportion-correct values with the within-subjects factors item type, acoustic context, and block showed a significant and strong effect of acoustic context, F(1, 66) = 355.7, p < .001, dz = 2.30. Memory performance was lower when the irrelevant talkers were presented, relative to the in-quiet condition (see Figure 4). Thus, we observed a significant irrelevant speech effect (ISE). The effect of item type was not significant, F(1, 66) = 1.40, p = .242, but there was a significant while relatively weak interaction of item type and acoustic context, F(1, 66) = 30.0, p < .001, dz = 0.67. That is, the ISE was stronger for visually than for auditorily presented item lists. This effect was more pronounced in the first compared to the second block: in the presence of the interfering talkers (triangles in Figure 4) the difference in memory performance between the two item types was more pronounced in the first than in the second block—Item Type × Block Interaction: F(1, 66) = 10.57, p = .002; Item Type × Acoustic Context × Block Interaction: F(1, 66) = 4.47, p = .038).
For each combination of participant and item type, the ISE was computed as the difference in proportion correct between the in-quiet condition and the condition with interfering talkers. Thus, higher positive values indicate a stronger ISE. Figure 5 shows the distribution of the ISE scores for the auditory (ISEaud) and the visual item lists (ISEvis), indicating the expected sizeable amount of individual variation. Note that averaged across the two blocks presenting each of the two list types (auditory and visual), the ISE was positive (although sometimes close to 0) for all combinations of participant and list type. Thus, all participants showed a detrimental effect of background noise on serial-recall performance in both list types, although for some combinations of participant and list type this effect was small. Within individual blocks, occasional slightly negative ISE values occurred. Across the two blocks, the reliability of the ISE was moderate for auditory item lists, ICC(C, 2) = .652, and low for visual item lists, ICC(C, 2) = .403. While it is no surprise that the reliability of a difference measure is comparably small (Ellermeier & Zimmer, 1997), we have no convincing explanation for the lower reliability of the ISE measured for visual compared to auditory item lists.

Distribution of the irrelevant sound effect for auditory (ISEAud, upper panel) and visual (ISEVis, lower panel) item lists, expressed as the reduction in the proportion of correct responses in the serial recall task under irrelevant speech, relative to the in-quiet condition.
For the in-quiet condition, an rmANOVA on arcsin-square-root transformed proportions of correctly recalled items with the within-subjects factors item type and block showed no significant effect of item type, F(1, 66) = 1.16, p = .286, and no significant Item Type × Block interaction, F(1, 66) = 1. 30, p = .258. For this reason, we averaged the proportion of correctly recalled digits in the in-quiet condition across auditorily and visually presented lists and across blocks, and used it as an index of short-term memory performance (simple span) in the regression analyses (PCSTM). Figure 6 shows the distribution of PCSTM. Across the four measurements (two blocks each with auditory and visually presented items, respectively), the reliability of the proportion of correctly recalled digits in quiet was high, ICC(C, 4) = .922.

Distribution of short-term memory performance (PCSTM; average proportion of correctly recalled digits in the condition without interfering speech), averaged across auditorily and visually presented item lists.
Binaural Sensitivity for the Temporal Fine Structure
For each participant, the arithmetic mean of the IPDth obtained in the three blocks presenting the TFS-LF test (Hopkins & Moore, 2010) was used as a predictor in the regression analyses (IPDth). Lower values of IPDth represent higher binaural sensitivity for the TFS. Figure 7 shows the distribution of IPDth, indicating the expected large amount of interindividual differences. The reliability of the IPDth across the three adaptive threshold measurements obtained per listener was moderately high, ICC(C, 3) = .817.
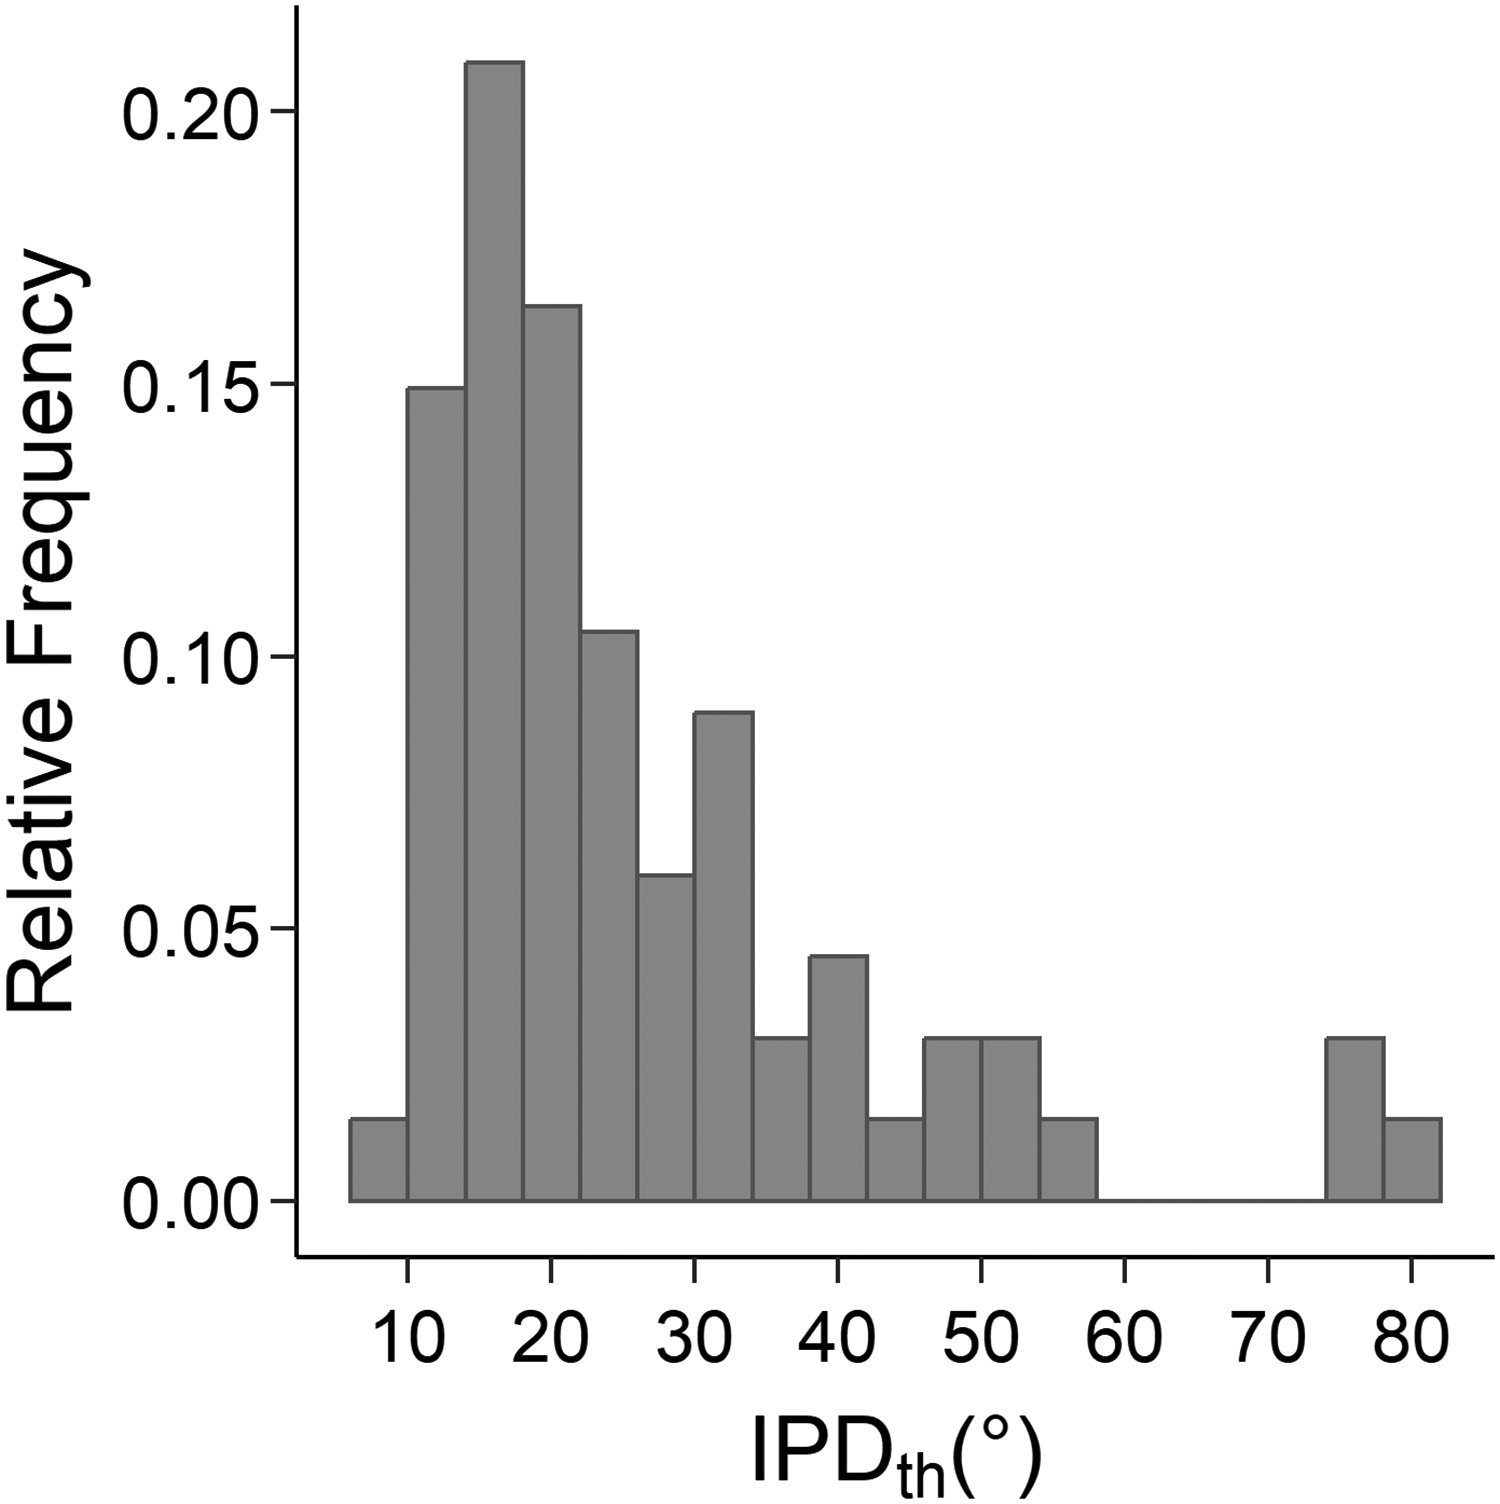
Distribution of the thresholds for detecting interaural phase delays (IPDth).
Individual Noise Sensitivity Questionnaire
Individual noise sensitivity was assessed in terms of the total score on the noise sensitivity questionnaire (LEF) by Zimmer and Ellermeier (1998). For one of the 67 participants, the rating of item 16 was missing on the questionnaire. We replaced this single value by the mean score of this item across the 66 remaining participants. Note that because the total score is the sum of the 52 item scores, this single score has only a very small impact on the participant’s total score. The consistency of the scale was high, Cronbach’s α = .926. Figure 8 shows the distribution of the test scores (NSS). Individual noise sensitivity scores (NSSs) ranged from 38 to 115, with a potential scale range between 0 and 156, thus showing considerable individual differences, as expected. In fact, mean noise sensitivity (M = 74.81) and its interindividual variability (SD = 19.63) fell very close to the statistics collected on the original test evaluation sample (Zimmer & Ellermeier, 1998: M = 79.4, SD = 19.4).

Distribution of the noise sensitivity score (NSS; total item score on the questionnaire by Zimmer and Ellermeier, 1998).
Regression Analysis
To analyze the association between the target measure (speech recognition score in the cocktail-party listening task) and psychoacoustic, cognitive, demographic, and attitudinal predictors, we used multiple linear regression (ordinary least-squares [OLS]). The psychoacoustic predictors were the pure tone average threshold on the better ear (PTABE), the asymmetry in hearing level between left and right ear (HLdiff), and the detection threshold for interaural phase differences (IPDth) measuring the (in-)sensitivity for the binaural TFS. The cognitive predictors were the short-term memory performance in quiet (PCSTM), and the irrelevant speech effects for auditory and for visual items (ISEaud, ISEvis). As an attitudinal, individual trait predictor, we included each participant's overall NSS. Also, as in previous studies, the age of the participant was included as a predictor in order to control for unspecific factors related to aging (e.g., Neher et al., 2012; Oberfeld & Klöckner-Nowotny, 2016). All variables were z-standardized. The eight predictors were entered simultaneously. We performed regression diagnostics by analyzing the DFFITS index proposed by Belsley, Kuh and Welsch (1980), which measures the influence of an observation on the fitted model in terms of the change in fit when the observation is deleted. Observations with an “outlying” DFFITS value more than two interquartile ranges below the first or above the third quantile were defined as influential outliers (Belsley et al., 1980). This resulted in the exclusion of six of the 67 subjects from the regression analysis. The maximum condition index (Belsley et al., 1980) was 2.33. Belsley et al. (1980) suggested that only condition indices of at least 30 indicate potential problems with multicollinearity. A Q-Q plot of the residuals showed no strong deviations from normality, and plots of the residuals as a function of the predictors showed no severe deviations from linearity. Thus, linear multiple regression was an appropriate method to assess the influence of the eight predictors on the speech recognition score, and to gauge their relative importance.
The regression model showed an acceptable fit, R2 = .55, p < .001, N = 61. As can be seen in Table 1, the performance in the cocktail-party listening task (SRS) was neither significantly associated with the irrelevant sound effect for auditory (ISEaud) nor for visual items (ISEvis). Thus, in contrast to our hypothesis, participants who showed less noise-induced memory impairment were not substantially less affected by the interfering talkers in the cocktail-party listening task. However, the performance in the in-quiet condition of the serial recall task (PCSTM), which can be viewed as an index of short-term memory capacity (“simple span”), was significantly positively related to the SRS. This is compatible with previous studies reporting a correlation between short-term or WM performance and SiN recognition, although a recent review suggested that the correlation is relatively weak in normal hearing listeners (Füllgrabe & Rosen, 2016). The regression coefficients were also significantly different from zero for the psychoacoustic predictors related to binaural hearing. Participants with a high IPDth (indicating low sensitivity for the binaural TFS) performed significantly worse in the cocktail-party listening task, compatible with previous studies (e.g., Füllgrabe et al., 2015; Neher et al., 2011; Neher et al., 2012; Oberfeld & Klöckner-Nowotny, 2016; Ruggles et al., 2012). Also, a large asymmetry in the detection thresholds between the left and right ear (HLdiff) was associated with a significantly lower SRS. Finally, the regression coefficient for age was significantly different from zero, indicating slightly better performance for older participants or, on a more general level, some age-related effects not explained by the remaining predictors. The regression coefficients for the pure-tone average hearing threshold on the better ear (PTABE) and the NSS did not differ significantly from 0.
Results of the Multiple Regression Analysis.
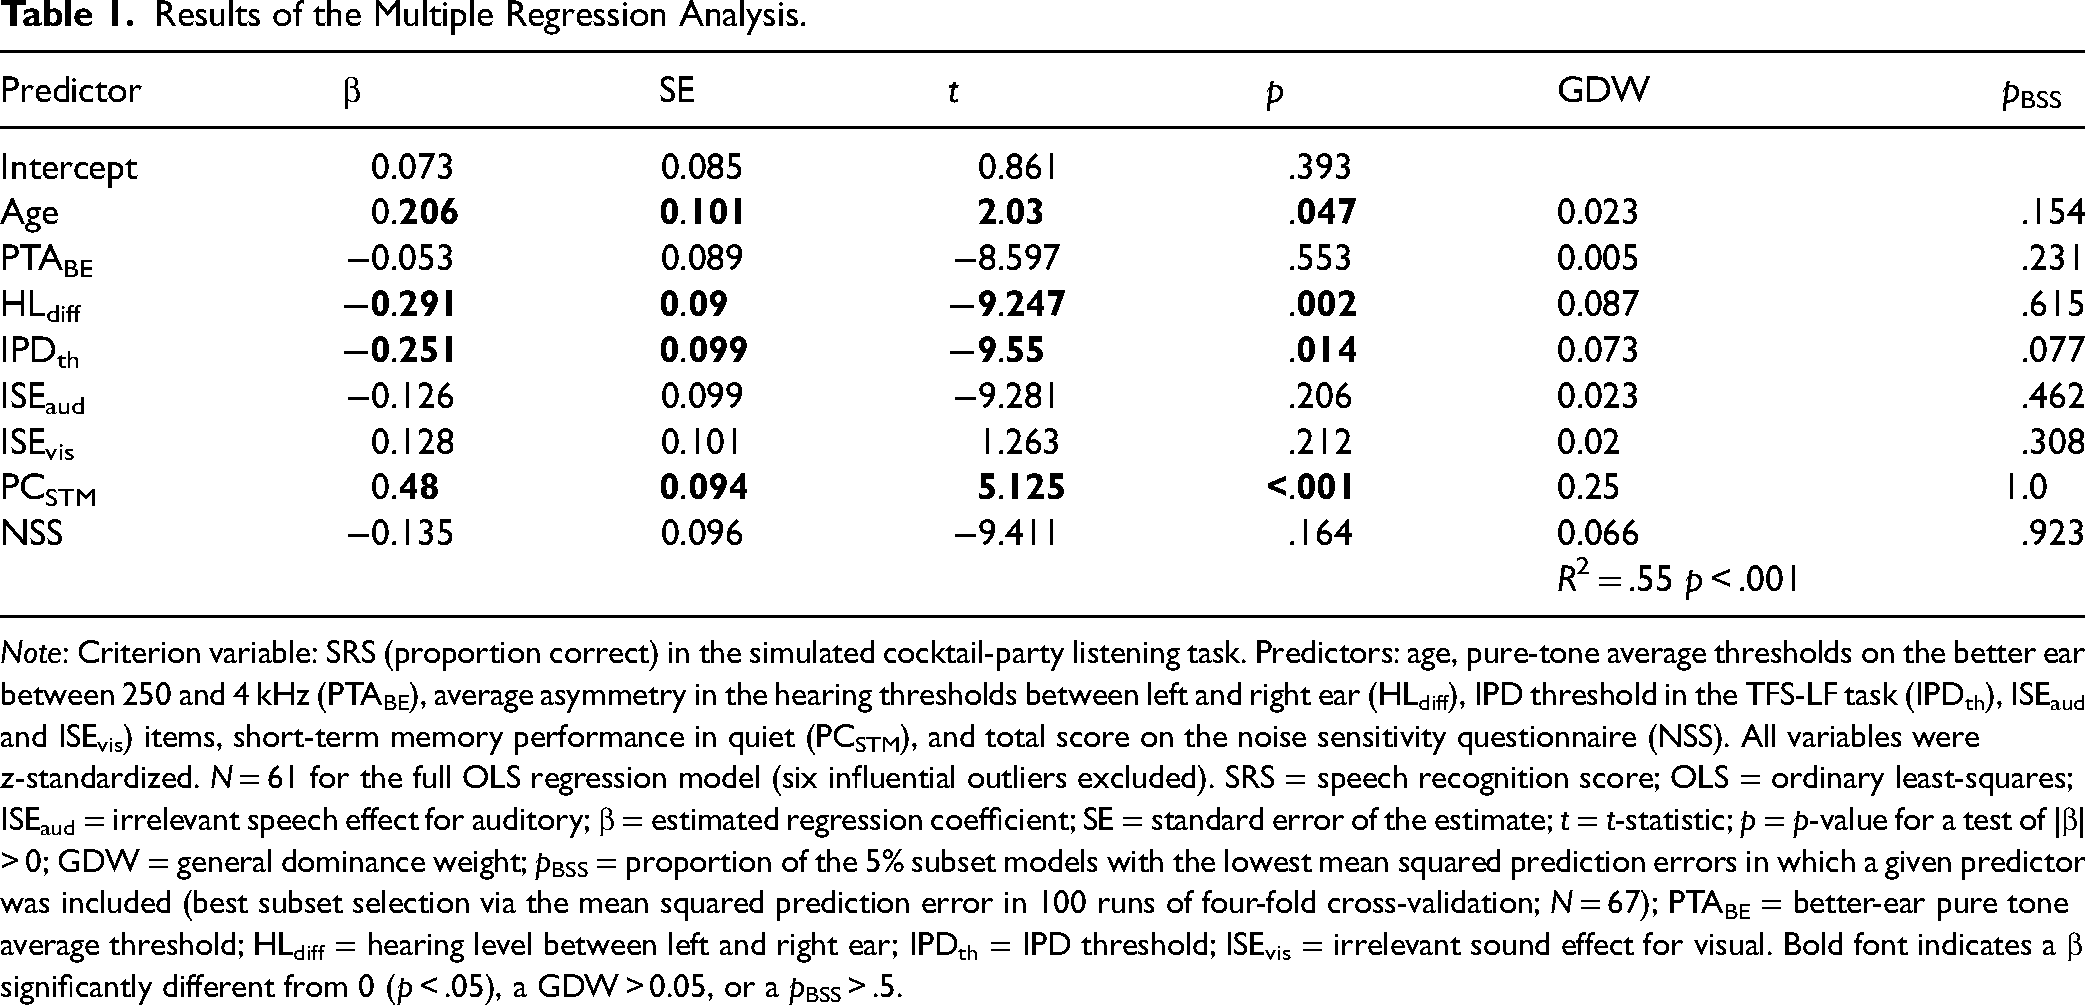
Note: Criterion variable: SRS (proportion correct) in the simulated cocktail-party listening task. Predictors: age, pure-tone average thresholds on the better ear between 250 and 4 kHz (PTABE), average asymmetry in the hearing thresholds between left and right ear (HLdiff), IPD threshold in the TFS-LF task (IPDth), ISEaud and ISEvis) items, short-term memory performance in quiet (PCSTM), and total score on the noise sensitivity questionnaire (NSS). All variables were z-standardized. N = 61 for the full OLS regression model (six influential outliers excluded). SRS = speech recognition score; OLS = ordinary least-squares; ISEaud = irrelevant speech effect for auditory; β = estimated regression coefficient; SE = standard error of the estimate; t = t-statistic; p = p-value for a test of |β| > 0; GDW = general dominance weight; pBSS = proportion of the 5% subset models with the lowest mean squared prediction errors in which a given predictor was included (best subset selection via the mean squared prediction error in 100 runs of four-fold cross-validation; N = 67); PTABE = better-ear pure tone average threshold; HLdiff = hearing level between left and right ear; IPDth = IPD threshold; ISEvis = irrelevant sound effect for visual. Bold font indicates a β significantly different from 0 (p < .05), a GDW > 0.05, or a pBSS > .5.
Because the eight predictors were partly correlated (see Table 3), and thus the relative importance of the predictors cannot be gauged by simply considering the squared standardized regression coefficients (cf. Tonidandel & LeBreton, 2011), we used the “dominance analysis” approach proposed by Budescu (1993). Dominance analysis provides a quantitative measure of relative importance by examining the change in the explained variance (ΔR2) resulting from adding a given predictor to all possible regression models containing subsets of the predictors. A predictor's GDW (Azen & Budescu, 2003) is defined as its mean squared semipartial correlation across all possible subset models. This measure indexes a variable’s contribution to the prediction of the dependent variable, by itself and in combination with the other predictors. The sum of the GDWs is the total proportion of variance explained by the regression model, R2. GDWs have several desirable properties for quantifying variance importance in an OLS regression model (e.g., LeBreton, Ployhart & Ladd, 2004; Tonidandel & LeBreton, 2011). As shown in Table 1, the GDW was highest for the short-term memory performance in quiet, followed by the two psychoacoustic predictors related to spatial hearing (binaural TFS [in-]sensitivity and HL asymmetry). The GDW for age was small, although the regression coefficient for that predictor was significantly different from 0, while the GDW for the nonsignificant predictor NSS was almost as high as for the TFS sensitivity. The GDWs for the two ISE measures were small.
As a second approach to gauging variable importance, we used best subset selection based on repeated cross-validation (e.g., James et al., 2013). With p = 8 predictors (see Table 1), 2 p = 256 different subsets containing all possible combinations of the eight predictors can be constructed, including the empty subset, which corresponds to a regression model containing only an intercept. Using a brute-force approach and fourfold cross-validation, the data were randomly partitioned into k = 4 groups (or folds) of approximately equal size. The first fold was treated as a “test set,” and a least-squares multiple regression model was fit on the remaining three folds (“training set”). The mean squared prediction error (MSPE) produced by the fitted model was computed on the observations in the test set (i.e., mean squared error on the test set). For each of the 256 subset models (each containing between zero and eight predictors, plus an intercept), this procedure was repeated four times, each time selecting a different fold as the test set. To further increase the robustness of the results, we used a resampling approach and, for each of the 256 subset models, repeated the fourfold cross-validation 100 times, each time randomly partitioning the data into four subsets for cross-validation. We included all of the 67 participants in the analysis because the repeated cross-validation procedure reduces the influence of “outlying” data points. For each of the 256 subset models, the mean MSPE across the 100 cross-validation runs and the four folds contained in each cross-validation run was computed. The subset model with the smallest mean MSPE shows the best predictive accuracy. With respect to the bias-variance trade-off in statistical learning (e.g., Chapter 2.2.2 in James et al., 2013), the minimization of the MSPE represents selecting a model that has low variance as well as low bias, so that the model can be expected generalize well to new datasets. In contrast, the multiple regression model containing all predictors shown in Table 1 minimizes the bias by providing the best linear prediction for the dataset at hand, but this can result in higher variance and thus only limited predictive accuracy for new datasets. Put differently, the two approaches are complementary, and the best subset selection procedure focuses on prediction (Yarkoni & Westfall, 2017). However, note that both the fit of the full model (Table 1) and the fits of the subset models in the best subset selection procedure are based on the same statistical approach (least-squares regression).
Figure 9 shows the distribution of the mean MSPE across the 256 subset models, for each model averaged across the 100 runs of fourfold cross-validation.

Best subset selection. Histogram of the mean squared prediction error (MSPE) across the 256 subset models, averaged for each subset model across the 100 runs of four-fold cross validation. Upper panel: models not containing the predictor PCSTM. Lower panel: models containing PCSTM. Blue and orange histograms represent models not containing or containing the predictor NSS, respectively. The vertical blue line marks the fifth percentile. Models with an MSPE below this value are displayed in Table 2.
Bivariate Pearson Partial Correlation Coefficients, Controlling for Age.
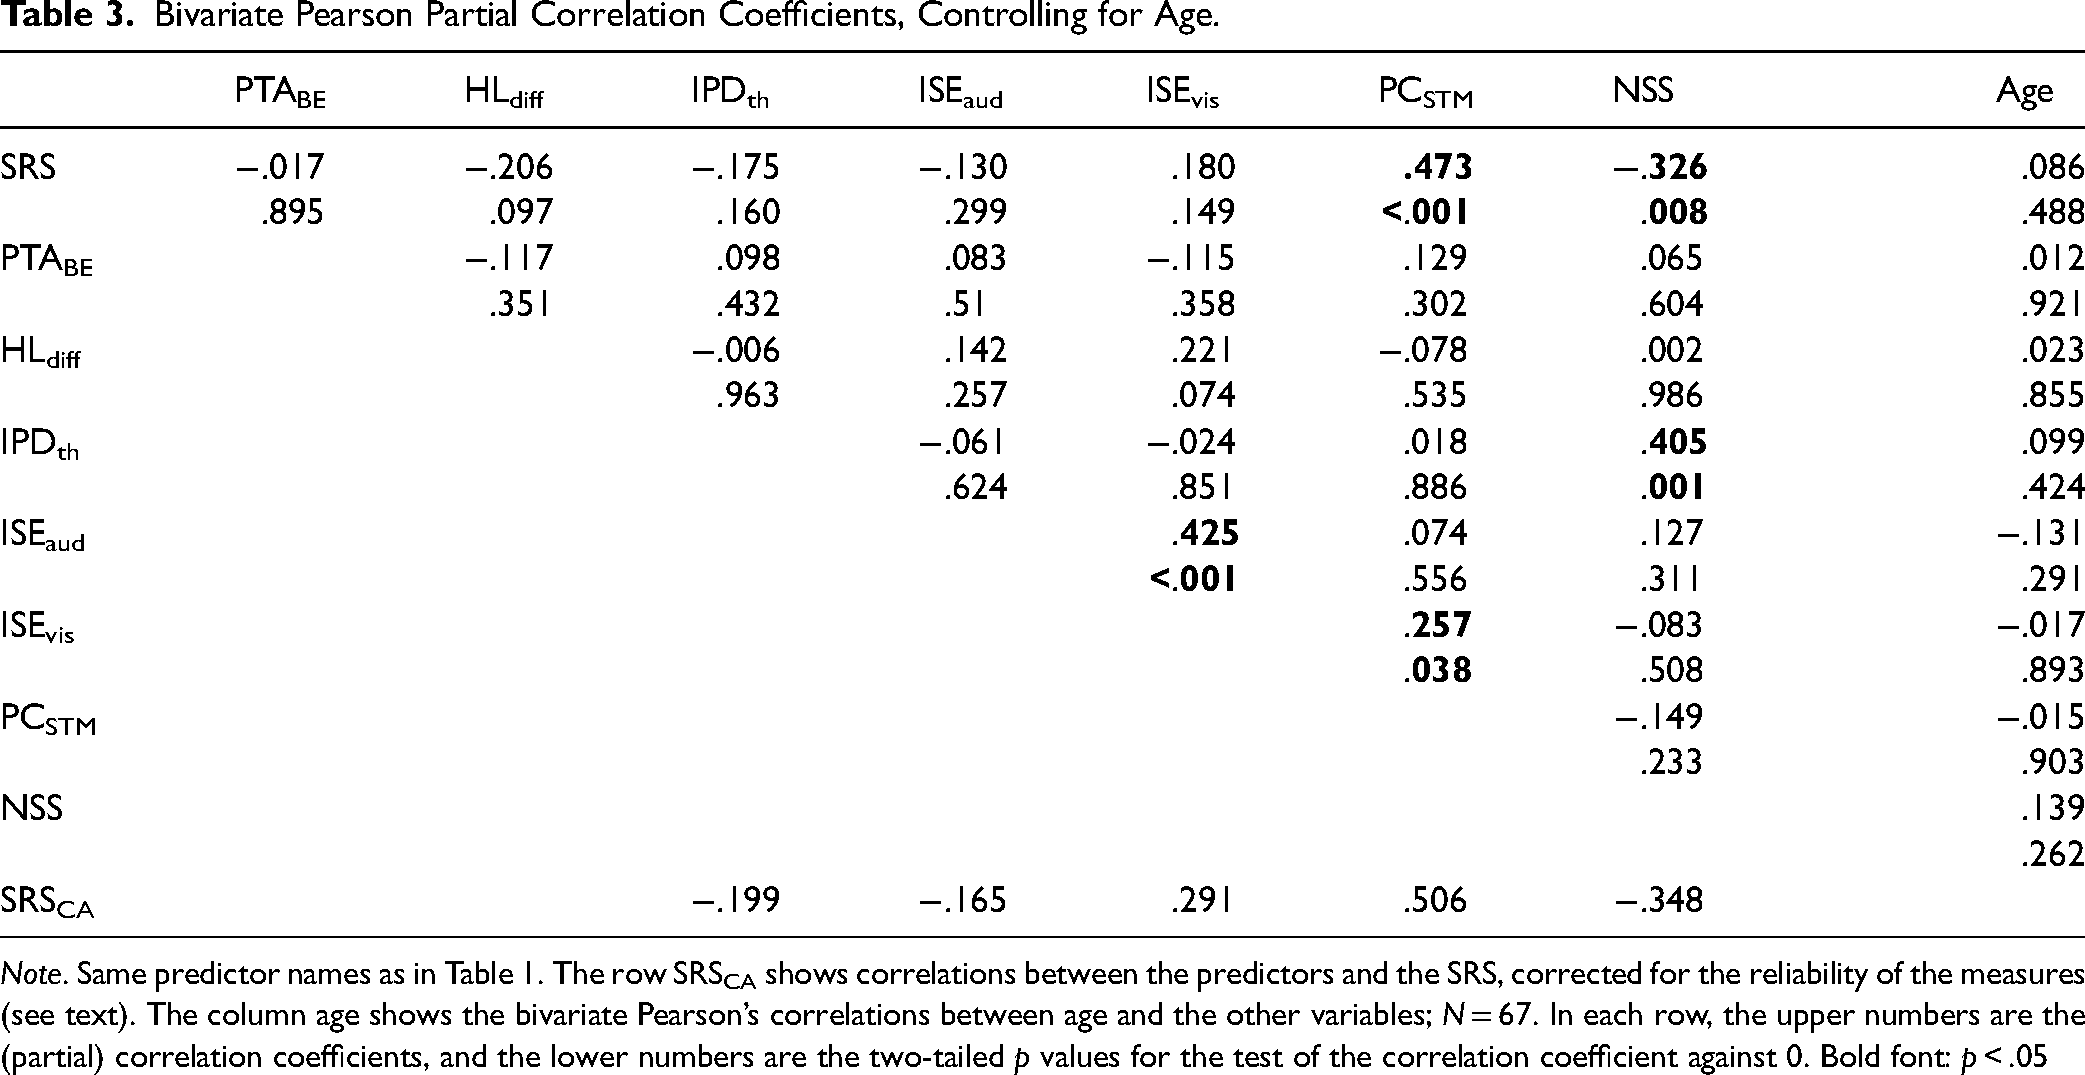
Note. Same predictor names as in Table 1. The row SRSCA shows correlations between the predictors and the SRS, corrected for the reliability of the measures (see text). The column age shows the bivariate Pearson’s correlations between age and the other variables; N = 67. In each row, the upper numbers are the (partial) correlation coefficients, and the lower numbers are the two-tailed p values for the test of the correlation coefficient against 0. Bold font: p < .05
The 5% best subset models according to the MSPE criterion (i.e., with a mean MSPE below the vertical blue line in Figure 9) are shown in Table 2. The column pBSS in Table 1 shows in which proportion of these 5% best models each of the eight predictors was contained. Figure 10 shows a comparison of the GDWs computed for the full regression model and pBSS.
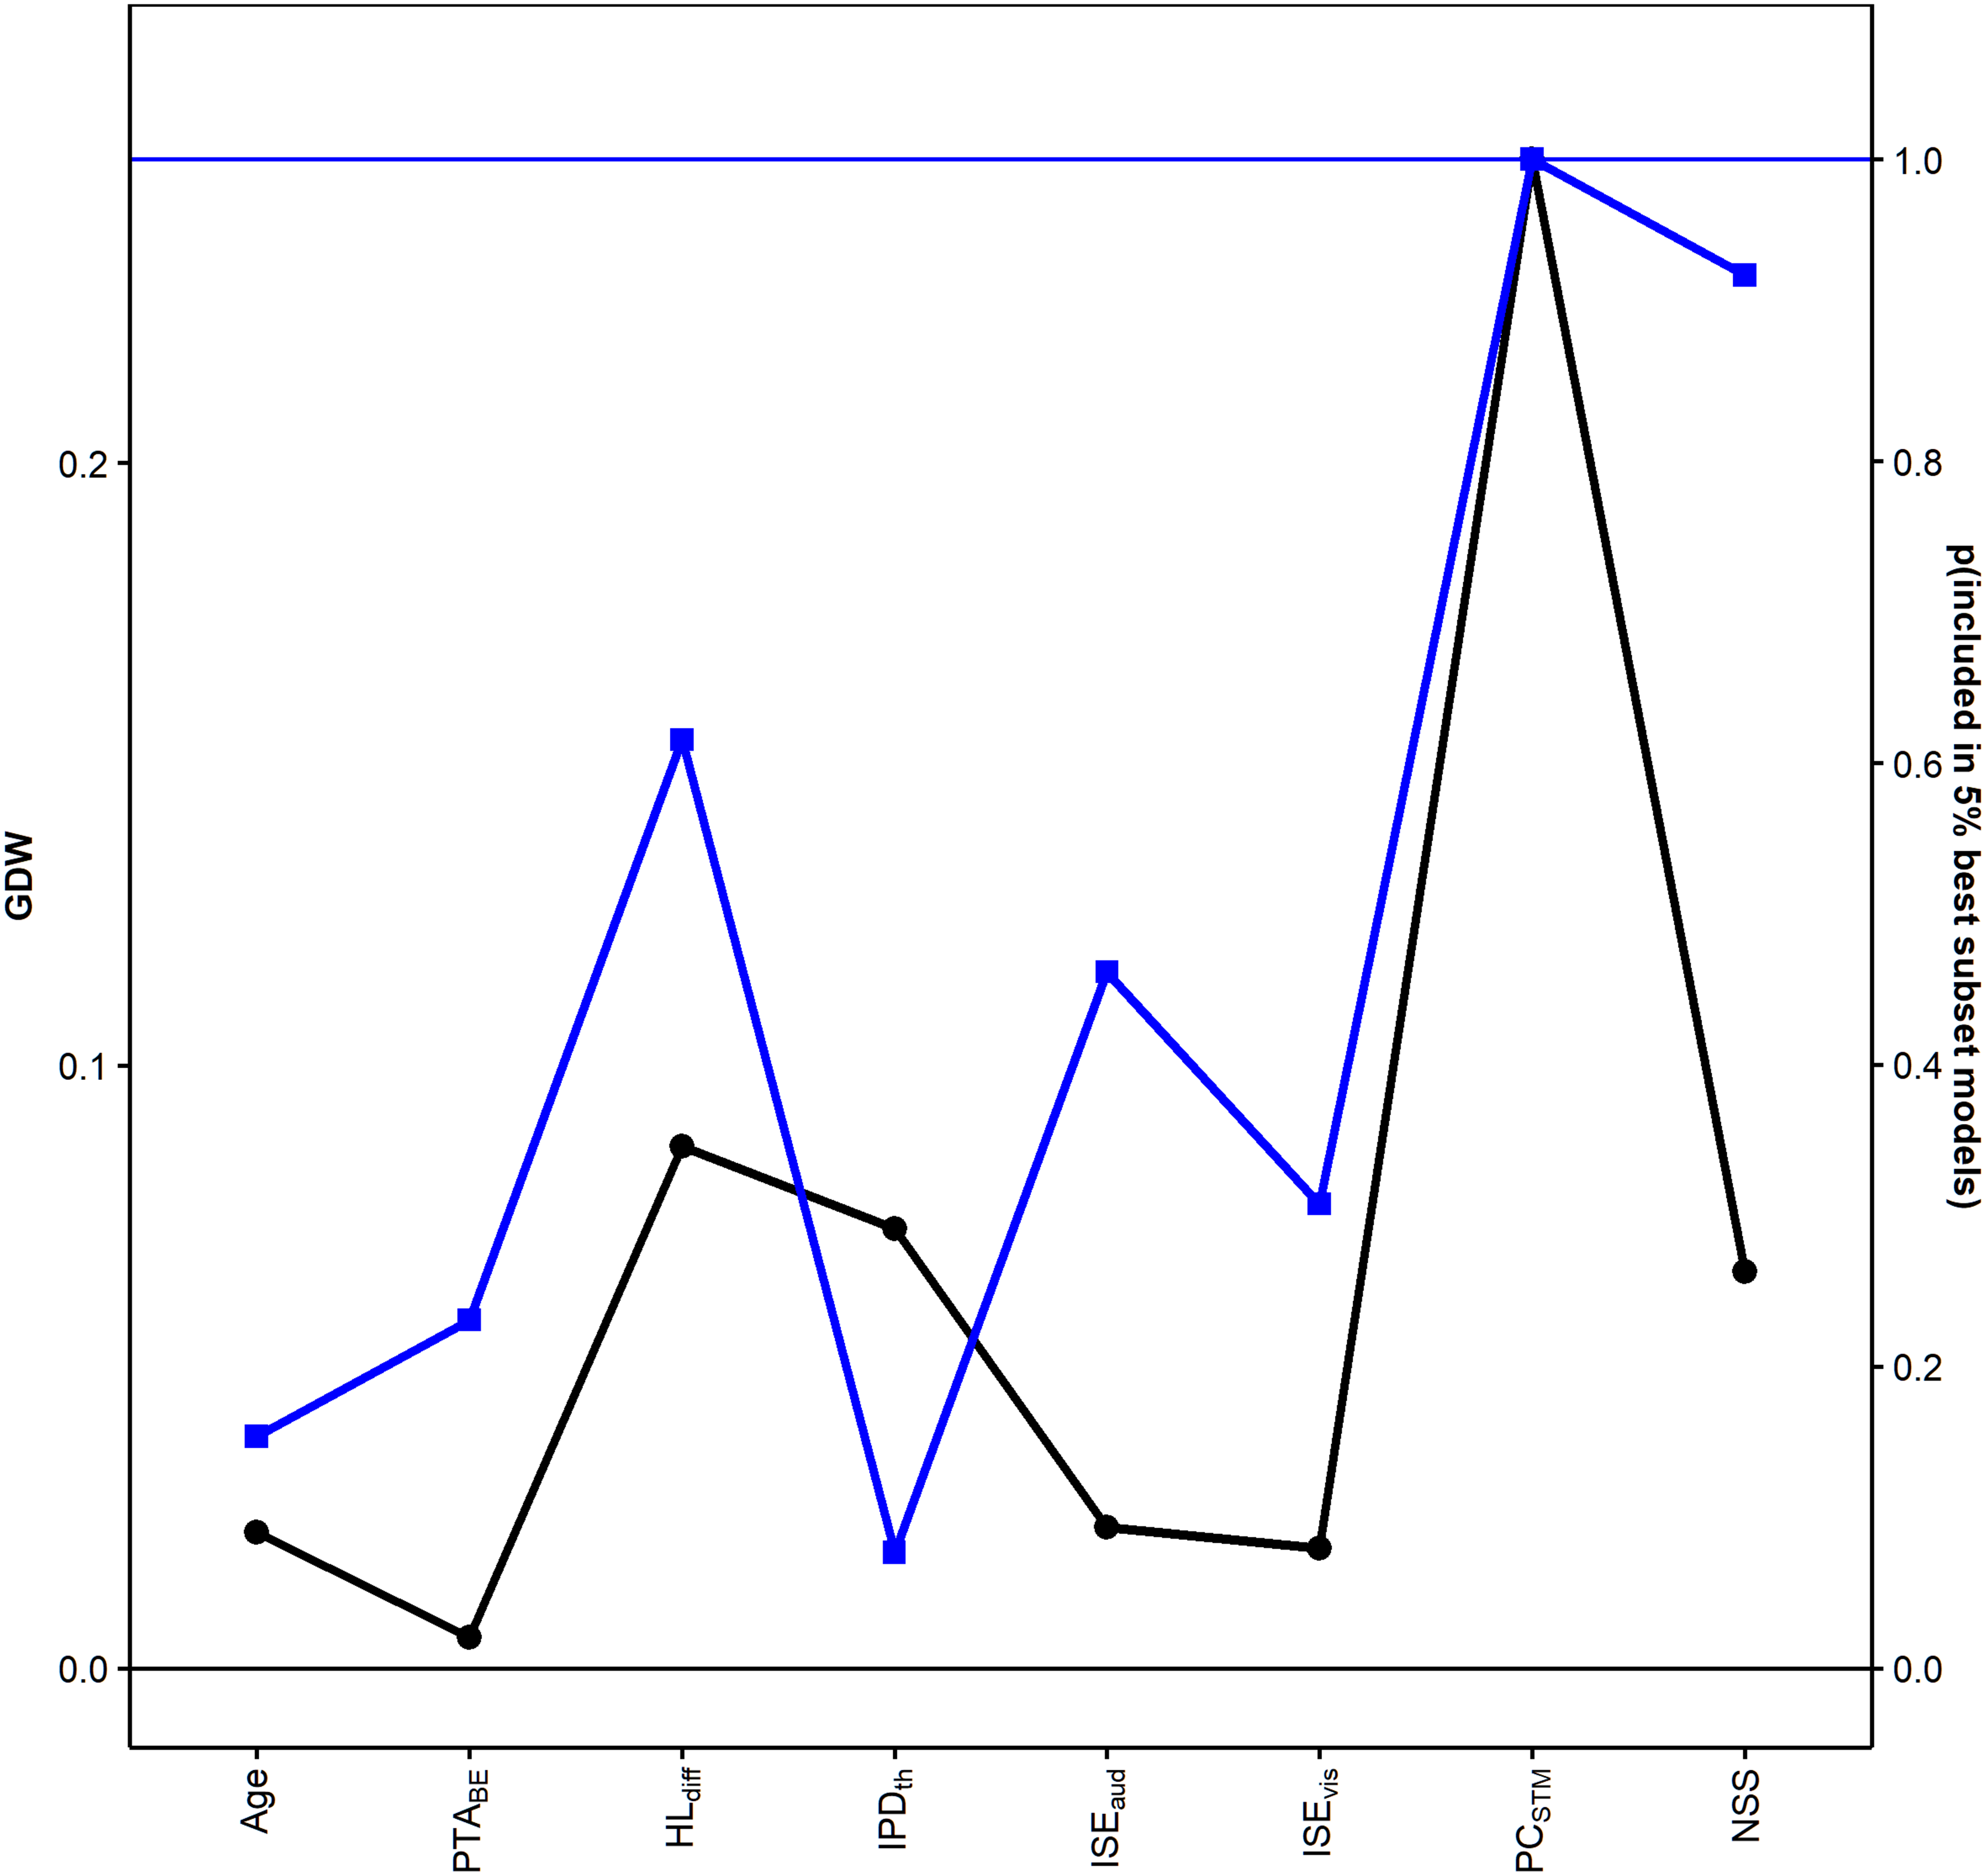
Compatible with the dominance analysis results for the full regression model presented in Table 1, two of the predictors most frequently included in the 5% best subset models were the short-term memory performance measure PCSTM (always included in the 5% best models) and HLdiff (included in 61.5% of the models), for which the GDWs were highest in the full regression model (see Table 1 and Figure 10). Figure 9 demonstrates that subset models not including PCSTM showed a higher MSPE (i.e., inferior prediction performance) than subset models including that predictor. A corresponding but smaller difference between the MSPEs for subset models including or not including the NSS is also visible in Figure 9. Not compatible with the OLS regression results, the NSS was included in 92.3% of the best subset models. For the latter predictor, the regression coefficient in the full regression model had not been statistically significant. The ISE for auditorily and visually presented item lists was included in 46.2% and 30.8% of the best subset models, respectively. Compared to the GDWs for the full regression model, these values of pBSS confirm that the importance of the ISE measures for predicting the speech recognition score was smaller than the importance of PCSTM, although the difference in pBSS between PCSTM and the ISE measures was smaller than the corresponding differences in the GDWs (Figure 10). The remaining predictors, notably including IPDth and age, were included in less than 30% of the best subset models.
Best Subset Selection.

Note. The 5% best models (out of 256 possible subset models) according to the MSPE criterion, ordered by their mean MSPE across 100 runs of four-fold cross validation. Same predictor names as in Table 1. MSPE = mean squared prediction error.
Because all variables were empirically measured values, they were all subject to measurement error, and relatively high measurement errors (i.e., low reliability) will attenuate the measured correlation compared to the true correlation among variables measured perfectly reliably and free from random errors (Fuller, 1987). As discussed earlier, the reliability of the measured variables varied from relatively low to high, in terms of the ICCs. To estimate the potential effect of the variation in reliability on the bivariate partial correlations, we used the “correction for attenuation” method. In this approach, the correlation corrected for random measurement error is computed as,
Discussion
In a group of 67 young adult listeners with normal audiometric thresholds, we investigated the relation between speech identification in a spatial listening task with two interfering talkers (“speech-in-speech identification”/“cocktail-party listening”) and several psychoacoustic and cognitive measures. We were particularly interested in the question of whether the individual size of the ISE, which measures the negative impact of irrelevant acoustic stimuli on the performance on a serial recall task, is associated with performance on the simulated cocktail-party listening task.
As expected, the data showed pronounced individual differences in most of the studied measures. Although we tested a relatively homogenous group of young listeners with normal hearing, the individual speech recognition scores in the cocktail-party listening task ranged from 44% to 96%, which is similar to the degree of individual variation reported in a previous study from our lab (Oberfeld & Klöckner-Nowotny, 2016) using the same stimuli. Thus, the data confirm that persons with normal audiometric thresholds can still experience problems in understanding speech in acoustically adverse conditions (e.g., Ruggles & Shinn-Cunningham, 2011; Schoof & Rosen, 2014; Summers et al., 2013), in varying degrees. The individual ISEs—short-term memory performance decrements due to irrelevant background speech—for auditory and visual item lists ranged from 1% and 37% and 1% and 36%, respectively. This range is similar to previously reported values (Ellermeier & Zimmer, 1997). The individual overall scores on the noise sensitivity questionnaire varied between 38 and 115 on a scale potentially assuming values between 0 and 156, again similar to previous data reported for this questionnaire (Zimmer & Ellermeier, 1998, 1999).
Contrary to our expectations, the results did not show evidence for a strong association between the irrelevant speech effect and speech-in-speech identification. In an OLS multiple regression model with the speech recognition score in the spatial listening task as the criterion and the full set of eight predictors (Table 1), the regression coefficients for the ISE were neither significant for auditorily nor for visually presented items lists. When using best subset selection based on cross validation, the ISE for auditorily and visually presented items lists was included in 46% and 31%, respectively, of the best 5% subset models. Thus, the ISE measures were only relatively weakly associated with speech-in-speech identification, particularly compared to short-term memory performance in the absence of background noise (PCSTM), which we discuss below.
A potential methodological factor contributing to the weak observed association between ISE and speech-in-speech recognition was that the reliability of the ISE was smaller compared to the other measures collected in this study, particularly in the serial recall task presenting visual item lists. A high amount unsystematic variance / random measurement error in a predictor attenuates the correlation with the criterion in regression analyses. However, when we corrected bivariate correlations between the predictor variables and the SRS for attenuation by low reliability (Fuller, 1987), the correlation coefficients between the ISE measures and the SRS were increased but remained smaller than for PCSTM and the NSS (Table 3).
On a more conceptual level, the serial-recall task used to study the ISE and the sentence-identification task used to study speech recognition differ in terms of the bindings required for them according to the Oberauer et al. working-memory conceptualization (e.g., Oberauer et al., 2007). As discussed above, in the serial digit recall task, the memory set contained only nine items (i.e., digits 0–9 without the 7), and binding the items presented on a given trial to their temporal position in the list was required to successfully reproduce the serial order. When the background sound was activated, distinguishing the to-be-recalled digit list from the OLSA sentences spoken by the two distracting talkers should not have been difficult at all when the digit list was presented visually, and not too difficult when it was presented auditorily, because a) each OLSA sentence contains only a single numeral and b) the digit lists and the OLSA sentences were spoken by different talkers (OLSA: male talker; digit lists: female talker). In the speech identification task, the memory set was larger (50 words), but all possible words were known to the participants because they were displayed on screen during the response phase of each trial. Binding the words spoken by the target talker on a given trial to their temporal position within the list of five words included in each sentence was not necessary because the fixed syntactic structure name-verb-numeral-adjective-object determined the correct order of the words. However, it was crucial to bind the 3 · 5 words heard on a given trial to either the target talker or the competing (irrelevant) talkers. Because the same male voice pronounced the target sentence and the distracting sentences, this binding needed to be established based on spatial position, representing an analog to spatial binding and updating in visual memory tasks (Oberauer, 2017). The different binding requirements in the ISE and the speech-in-speech identification task are a potential conceptual explanation for the weak association between performance on the two tasks. However, another result from our study speaks against this view. Rather than the effect of irrelevant speech on short-term memory, the performance in the serial-recall task without background noise (PCSTM) was the most important predictor for speech-in-speech identification according to its GDW (Azen & Budescu, 2003) in the full regression model. It was also included in all of the 5% best subset models, and showed the highest bivariate correlation with the SRS. In terms of the required bindings, memorizing an auditorily or visually presented digit list in quiet also requires binding the items to their temporal list position, just as in the condition with background noise. Thus, the difference in the bindings required for the serial-recall tasks and the sentence-identification task did not depend on the presence or absence of the background sound in the serial recall task. It seems difficult to explain why the different binding requirements should have reduced the correlation between the SRS and the ISE, but not between the SRS and PCSTM. Still, selecting tasks for measuring the ISE and speech identification in a cocktail-party listening task that are more similar in terms of their binding requirements in WM would be an interesting perspective for future research.
In the present study, the individual performance in a simple memory task in the absence of background noise rather than the individual vulnerability to memory disruptions caused by irrelevant sound was strongly associated with speech identification in the presence of interfering talkers. Of note, a meta-analysis on the association between WM capacity and SiN identification in young listeners with normal hearing (Füllgrabe & Rosen, 2016) reported that across 24 studies, the correlation between the two measures was positive but weak (average r = .12, corresponding to less than 2% explained variance). While the same review already showed a relatively large variability of the correlation between WM capacity and SiN identification between the analyzed studies, it is interesting to consider potential reasons for the observed discrepancies between our data and the reported average association between WM capacity and SiN identification. First, as discussed above, the relative reliability of the measures obtained in a given study can have an effect on correlation and regression results. In our study, we measured serial-recall performance in quiet in four blocks containing 25 items each. The reliability of the proportion of correctly recalled items across the four blocks (conducted on separate days) was moderately high, ICC(C, 4) = .922. In comparison, the reliability of the proportion of correctly recalled words in a reading span task across two presentations of several different list lengths was somewhat lower, ICC(C, 2) = 0.759, in the study by Oberfeld and Klöckner-Nowotny (2016), where the memory performance was not significantly associated with speech-in-speech identification in the multiple regression analysis. Unfortunately, not many previous studies reported the reliability of their measures, so that it is difficult to judge to which extent the reliability of the memory measures varied across studies. An additional methodological aspect is that the review by Füllgrabe and Rosen (2016) analyzed bivariate correlations between WM capacity and the processing of SiN as well as partial correlations controlling for age and hearing thresholds. Because the different psychoacoustic and cognitive measures are likely correlated (see Table 3), in our a view a multiple regression approach is more informative concerning the question of which measures are important for predicting SiN identification (see also Oberfeld & Klöckner-Nowotny, 2016). Due to moderation and suppression effects, a measure showing a significant bivariate correlation with SiN identification might show a nonsignificant regression coefficient in a multiple regression model containing a larger number of correlated predictors. For example, in the data collected by Oberfeld and Klöckner-Nowotny (2016), performance on a reading span task showed a significant bivariate correlation with speech-in-speech identification, while in a multiple regression analysis including additional psychoacoustic and cognitive predictors, WM performance turned out to explain only a relatively small proportion of the variance in speech-in-speech identification. Second, we used a simple serial-recall task (“simple span”), while most previous studies on the relation between WM and speech perception in noise focused on “complex span” tasks such as reading span (e.g., reading span; Daneman & Carpenter, 1980) or operation span (Turner & Engle, 1989). In addition to storage and maintenance of information, these tasks typically require manipulation of the information stored in WM via mechanisms of executive control. It has been shown that performance in complex span tasks is associated with a range of speech-related cognitive abilities including language comprehension (e.g., Daneman & Merikle, 1996), vocabulary learning, reasoning (e.g., Süß et al., 2002), and dichotic listening (Conway et al., 2001). Previous studies found that individual differences in complex span measures predict the size of auditory deviation effects, but not the magnitude of ISEs, that is, distraction produced by “changing-state” speech (e.g., Hughes et al., 2013; Sörqvist, 2010; Sörqvist et al., 2013). If SiN recognition performance depended heavily on the engagement of executive control, then speech perception in noise should be more strongly related to certain complex span measures of WM capacity than to serial recall performance in quiet (i.e., simple span). However, it has been reported previously that SiN identification performance was correlated more strongly with performance in a simple digit span task than with performance in a reading span task (Füllgrabe et al., 2015). One potential explanation for this finding is that the serial-recall task used here focuses almost exclusively on the binding aspect (i.e., memory for serial order) of WM, while the complex span tasks typically used in the previous literature on the relation between WM and SiN processing also tap into different aspects of WM capacity (Wilhelm et al., 2013). On a more general level, it would be interesting to further investigate which functional aspects of memory (e.g., information encoding, storage, processing, supervision, coordination of elements into structures) (Oberauer et al., 2003) are most strongly associated with speech perception in noise.
The irrelevant speech effect on serial recall was larger when the to-be-remembered digits were presented visually, as compared to auditory presentations. While previous studies reported equivalent effect sizes for auditory distraction in visual and auditory recall tasks (e.g., Campbell et al., 2002), it is important to note that in our experiment the serial recall task with visual items was always presented in the first session, while the variant with auditory items was presented in the second session, in order to reduce variance due to differences in task order. Thus, the difference between the ISE in the two conditions could be due to a practice effect. In addition, there is some evidence of a stronger decline of irrelevant speech effects with task repetition in case of auditory item presentation compared to visual item presentation (i.e., retest effects; see Kattner et al., 2019), which might indicate modality-dependent differences in the degree of habituation to irrelevant speech. In the present study, participants may have improved their ability to segregate relevant from irrelevant speech items (i.e., target digits vs. irrelevant sentences) across the first block presenting the serial recall tasks with auditory digits, which might explain the smaller irrelevant speech effects as compared to the visual task.
While the overall magnitude of irrelevant speech effects for visual item lists was larger than for auditory lists, the reliability of auditory distraction was higher in case of the auditory serial recall task, as compared to the visual task. In contrast, previous studies reported moderate test–retest reliability for irrelevant speech effects when the to-be-remembered items were presented visually. One possible reason for the higher reliability with auditory than with visual list items could again be that the auditory task was included at the end of the second session, whereas the visual task was presented in the first session. Hence, participants had to get used to the “irrelevant speech situation” in the visual recall task of the first experimental session, which may have increased the variance in performance. In contrast, participants had already gained significant experience with the serial recall task before beginning the auditory recall task in the second experimental session, probably resulting in reduced performance variance and thus higher reliability.
The binaural sensitivity for the TFS, measured by the TFS-LF test (Hopkins & Moore, 2010), was significantly associated with the speech recognition score in the full multiple regression model (Table 1). The negative association between the threshold for detecting interaural phase delays (IPDh) and the SRS confirms previous reports that persons with lower monaural or binaural TFS sensitivity have greater difficulty in understanding SiN (e.g., Füllgrabe et al., 2015; Oberfeld & Klöckner-Nowotny, 2016; Ruggles et al., 2011). However, according to the GDW, the binaural TFS sensitivity was a less important predictor for speech-in-speech identification than the short-term memory performance. Compatible with this result, it was included in only less than 10% of the best 5% subset models (Figure 10), and the bivariate partial correlation with the SRS was nonsignificant (Table 2). This result differs from the pattern observed in our previous study using exactly the same spatial listening task (Oberfeld & Klöckner-Nowotny, 2016), where the binaural TFS sensitivity was the most important predictor of speech identification. While our data support the view that TFS sensitivity is associated with SiN identification, the observed pattern of results highlights that the relative importance of predictors of course depends on the specific set of predictors included in a given study, and that differences between the samples might play an additional role. Also, as we noted above, we deliberately selected two complementary analysis approaches, with a focus on generalizability (i.e., prediction accuracy for new data sets) in the best subset selection based on the cross-validation prediction error, while the full OLS regression model containing all predictors approaches the bias-variance tradeoff from a different angle. Thus, it is not surprising that the two approaches sometimes show somewhat deviating results.
An interesting, and somewhat unexpected outcome of the present study is that individual noise sensitivity as measured postexperimentally by a psychometrically validated 52-item self-report questionnaire assessing a large range of everyday listening situations (LEF; Zimmer & Ellermeier, 1998) appears to play a significant role both in predicting SiN recognition performance and in relating to other psychoacoustic performance measures. As shown in Table 2, the total score on the noise sensitivity questionnaire (NSS) also exhibited a significant positive bivariate correlation with the IPDth in the TFS-LF test, and a significantly negative correlation with the SiN recognitions score. The positive correlation between sensitivity for the TFS and noise sensitivity is conceptually plausible. Individuals who are relatively insensitive to the binaural TFS (high IPDth), i.e., who might have trouble fine-tuning their directional acuity to a particular talker position, might in turn also judge themselves as being more sensitive to interfering noise. Likewise, the negative partial correlation between the speech recognition score and noise sensitivity is plausible, considering that superior performance in identifying utterances by a target talker made in the context of competing speech is associated with low self-rated sensitivity to interfering noise. One might speculate that the latter correlation might have been partially driven by the experience our participants had in the SiN part of the study, thereby influencing their ratings of noise sensitivity in the postexperimental questionnaire, but that explanation is quickly dismissed considering that the employed noise-sensitivity questionnaire measures an individual trait that has been shown to be stable over time and not affected by transitory influences (Zimmer & Ellermeier, 1998, 1999), and by further noting that only four of its 52 items explicitly address multiple-talker situations.
What is novel about these findings regarding noise sensitivity is that previous studies using the same questionnaire have suggested it to be uncorrelated with basic sensory measures of auditory acuity, particularly absolute and difference thresholds (Ellermeier et al., 2001). Rather, noise sensitivity—established by various methods—tended to be related to supra-threshold and evaluative aspects of auditory perception as reflected in judgments of loudness or annoyance (Ellermeier et al., 2020; Gille et al., 2017; van Kamp et al., 2004). As previously established (e.g., Ellermeier & Zimmer, 1997), the correlation between self-reported noise sensitivity and objectively measured short-term memory disruption by noise (the ISE) was weak, and—in the present sample—not statistically significant.
Noise sensitivity, however, turned out to be associated with to speech-in-speech recognition performance. In the full regression model, noise sensitivity failed to emerge as a significant predictor of speech-in-speech recognition, probably because its contribution was “masked” by the significant contribution of TFS sensitivity with which it correlates. However, the GDW for the NSS was among the largest, and in the best subset selection based on the mean squared prediction error in cross validation, which aims for greater generalizability when selecting the predictor variables, it emerged as the second most frequently included predictor of speech-in-speech recognition (Figure 10), immediately after our measure of short-term memory capacity (PCSTM).
In conclusion, the results of our experiment confirm that individual differences in SiN perception in young, normal-hearing listeners are associated with both auditory and cognitive abilities. We observed a strong association between speech-in-speech processing and short-term memory performance per se (simple span in the absence of background noise), but only a much weaker association between speech-in-speech processing and the individual susceptibility to effects of background speech on serial-recall performance (i.e., the ISE). In terms of auditory abilities, our data confirm the role of the binaural sensitivity to the TFS, which is important for spatial hearing, albeit this association was weaker than in some previous studies. In addition, the bilateral asymmetry of audiometric thresholds, which is also related to spatial acuity, was a factor negatively associated with SiN processing. Finally, our dataset showed a substantial association between scoring high on self-rated noise sensitivity and being disrupted by the cocktail-party interference objectively measured in the speech-identification task, a relationship which in our view deserves further investigation.
Footnotes
Data Availability Statement
The dataset used for the regression analyses is available at OSF.io (https://osf.io/daxvz/). The trial-by-trial data in the different experimental tasks are available from the corresponding author (DO), upon request.
Declaration of Conflicting Interests
The authors declared no potential conflicts of interest with respect to the research, authorship, and/or publication of this article.
Funding
The authors received no financial support for the research, authorship, and/or publication of this article.