
Abstract
The objective of this project was to establish cutoff scores on the tinnitus subscale of the Tinnitus and Hearing Survey (THS) using a large sample of United States service members (SM) with the end goal of guiding clinical referrals for tinnitus evaluation. A total of 4,589 SM undergoing annual audiometric surveillance were prospectively recruited to complete the THS tinnitus subscale (THS-T). A subset of 1,304 participants also completed the Tinnitus Functional Index (TFI). The original 5-point response scale of the THS (THS-T16) was modified to an 11-point scale (THS-T40) for some participants, to align with the response scale of the TFI. Age, sex, hearing loss, and self-reported tinnitus bother were also recorded. The THS-T was relatively insensitive to hearing, but self-reported bothersome tinnitus was significantly associated with the THS-T40 score. Receiver operating characteristic analysis was used to determine cutoff scores on the THS-T that aligned with recommended cutoff values for clinical intervention on the TFI. A cutoff of 9 on the THS-T40 aligns with a TFI cutoff of 25, indicating a patient may need intervention for tinnitus. A cutoff of 15 aligns with a TFI cutoff of 50, indicating that more aggressive intervention for tinnitus is warranted. The THS-T is a viable tool to identify patients with tinnitus complaints warranting clinical evaluation for use by hearing conservation programs and primary care clinics. The THS-T40 cutoff scores of 9 and 15 provide clinical reference points to guide referrals to audiology.
Introduction
Subjective tinnitus is the perception of sound without an external sound source and is a symptom of injury or dysfunction that cannot be objectively evaluated. Approximately 10% of the population perceives tinnitus, but not all individuals who perceive it are bothered by it. Those who are bothered by tinnitus most commonly report difficulties with sleep, concentration, and hearing, as well as increased anxiety and depression. Bothersome tinnitus can significantly diminish the quality of life, underscoring the importance of screening for bothersome tinnitus and making appropriate referrals as a fundamental aspect of public health. Active-duty service members (SM) exposed to noise undergo annual audiometric surveillance to monitor potential changes in hearing resulting from noise or blast exposure. Tinnitus can serve as an early indicator of auditory injury arising from noise or blast exposure, with SMs at a heightened risk compared to the general population (Yankaskas, 2013). Consequently, part of the annual surveillance includes screening for bothersome tinnitus so that those who report being bothered can be identified and referred for clinical evaluation and rehabilitation.
Challenges in Current Tinnitus Screening
The current screening procedure is to ask the SM, “During the past month, how much have you been bothered by noises in your head or ears, such as ringing, buzzing, crickets, humming, or a tone?” The response options are “not at all,” “a little,” or “a lot.” A recent evaluation of the prevalence of bothersome tinnitus in the U.S. Army revealed that 17% of Active Duty, Reserves and National Guard Soldiers were recorded as reporting bothersome tinnitus (i.e., they responded “a little” or “a lot”) in the system of record for hearing conservation in the U.S. military, the Defense Occupational and Environmental Readiness System – Hearing Conservation (Sherlock et al., 2023). This estimate is higher than that estimated for the general population and highlights the relevance of screening for bothersome tinnitus. However, a shortcoming to this screening approach is the fact that some SM have transient ear noise rather than tinnitus that does not warrant clinical intervention beyond brief education about the difference between transient ear noise and tinnitus.
Because subjective tinnitus is a symptom with no currently available objective clinical test, validated questionnaires play an essential role in the clinical evaluation and management of tinnitus. Audiologists rely on patient reports to gauge the functional impact of tinnitus. Two commonly used clinical questionnaires administered to patients who report bothersome tinnitus are the Tinnitus Handicap Inventory (THI; Newman et al., 1996) and the Tinnitus Functional Index (TFI; Meikle et al., 2012). The questionnaire scores are used to quantify the self-perceived severity of tinnitus and assess outcomes following clinical rehabilitation of tinnitus, validating patient complaints and reports of improvement.
Role of the Tinnitus and Hearing Survey (THS) in Clinical Evaluation of Tinnitus
The THS (Henry et al., 2015) is a questionnaire that was developed specifically to distinguish problems associated with tinnitus (e.g., difficulty sleeping and concentrating) from problems associated with hearing loss (e.g., difficulty hearing soft voices and in noise), as well as potential problems with reduced sound tolerance to determine an appropriate path for tinnitus management. The questionnaire consists of three subscales: hearing (THS-H), tinnitus (THS-T), and sound tolerance (THS-ST). The brief questionnaire, which has only nine questions across the three scales, can facilitate quick identification of commonly reported problems associated with tinnitus and hearing loss. The short administration time may make the THS attractive for use as a screening instrument in settings such as hearing conservation programs and primary care clinics. Normative cut-offs have recently been established for the THS-H subscale (Davidson et al., 2023) in the military population to facilitate the identification of subjective hearing difficulty that warrants clinical evaluation. Normative data for the THS-T subscale could be used similarly, to determine when a clinical evaluation of tinnitus is warranted.
Questions on the THS-T target commonly reported complaints associated with tinnitus:
Over the last week, tinnitus kept me from sleeping. Over the last week, tinnitus kept me from concentrating on reading. Over the last week, tinnitus kept me from relaxing. Over the last week, I could not get my mind off of tinnitus.
Each question is scored on a 5-point Likert scale, with anchors of “Not a problem” to “Very big problem.” Per the authors of the THS, the questionnaire was designed to compare problems associated with tinnitus and hearing loss within a patient, not across patients, and therefore normative data for the subscales were not developed. Nevertheless, the brevity of the THS, and its widespread acceptance and use across audiology clinics, makes it tempting to determine if the THS-T could be used as a tool to briefly assess subjective tinnitus complaints across individuals in settings other than audiology clinics. The usability of the THS has been enhanced because it has been translated and culturally adapted into Polish (Raj-Koziak et al., 2017), Spanish (Manchaiah et al., 2020), and Brazilian-Portuguese (Scheffer & Mondelli, 2021) versions.
In this study, a large cohort of United States military SMs was recruited from Department of Defense (DoD) hearing conservation programs to complete the THS as part of the annual audiometric surveillance. The results were used to develop normative data and identify cutoff values for identifying patients who might benefit from further tinnitus evaluation and management.
Materials and Methods
Procedures
Participants in this study were SMs undergoing annual audiometric surveillance at several hearing conservation clinics in military installations across the United States. The standard procedure includes measurement of audiometric thresholds spanning the 500–6000 Hz frequency range and questions regarding use of hearing protection devices and tinnitus. Pure-tone thresholds were measured within single-wall booths using CCA-200 Mini audiometers (Benson Medical Instruments, Eden Prairie, MN) connected to TDH-39 audiometric headphones (Telephonics, Farmingdale, NY).
Participants were recruited for the study after they completed the required hearing conservation hearing test. Individuals were asked if they would volunteer their hearing test data for inclusion in a hearing study. Those who agreed to participate were then asked to complete a brief tablet-based questionnaire, which included questions from the THS, the TFI, and additional questions related to their noise exposure and overall hearing health.
Among the questionnaires, participants were asked, “Have you ever experienced tinnitus (a roaring, ringing, or buzzing sensation in your ear) that has lasted more than 2–3 min?” The response options were Never, Once in my lifetime, A few times in my lifetime, Several times a year, Several times a month, Several times a week, and Every day. If the participant selected Several times a year or more, they were prompted to answer the question, “If your hearing technician or provider asks you how bothered you are by your tinnitus, which of these options would you choose: Bothered not at all; Bothered a little; Bothered a lot.”
All questionnaires were administered using the TabSINT application (Shapiro et al., 2019). Questionnaire responses were documented in the participant data record, alongside audiometric and demographic information (age and sex) provided during the annual audiometric surveillance. No personally identifiable information was recorded from any of the study participants, and no compensation was provided for participation.
This study received approval from the Institutional Review Boards of the Walter Reed National Military Medical Center and U.S. Army Medical Research Command.
Participants
A total of 4,589 SMs participated in the study. The majority of SMs were male (n = 3,891) with an average age of 31.0 (SD = 8.5). A total of 2,852 participants only completed the THS-T16, and these scores were converted into an equivalent THS-T40 score before analysis (see Comparison of THS versions with 5- and 11-point Likert scales). Finally, 1,304 SMs completed the TFI. SMs that completed the TFI all reported experiencing tinnitus more than once per year.
SMs were grouped based on their responses to two survey questions: “Have you ever experienced tinnitus (a roaring, ringing, or buzzing sensation in your ear) that has lasted more than 2–3 min?” and “If your hearing technician or provider asks you how bothered you are by your tinnitus, which of these options would you choose: Bothered not at all; Bothered a little; Bothered a lot.” The four groups are as follows:
Individuals who reported experiencing tinnitus < 1/yr. Individuals who reported experiencing tinnitus > 1/yr but were not at all bothered. Individuals who reported experiencing tinnitus > 1/yr and were bothered a little. Individuals who reported experiencing tinnitus > 1/yr and were bothered a lot.
The age, sex, TFI, and THS40 distributions for all 4,589 participants are displayed in Table 1. Missing values were omitted for calculating the TFI mean and standard deviation. All participants who completed the TFI completed the THS-T, but not all participants who completed the THS-T completed the TFI. Therefore, when calculating means and standard deviations for the TFI omitting missing values, the values for TFI scores in the two tables are identical.
Participant Demographics for all SM.

The demographics for the 1,304 SMs that completed the TFI in addition to the THS-T40 are displayed in Table 2.
Participant Demographics for SM who Completed the TFI.

Mean audiometric thresholds are plotted for the four groups in Figure 1.

Mean audiometric thresholds for the four experimental groups with error bars representing ± 1 standard error. Mean thresholds for right ears are plotted on the left and represented with open circles. Mean thresholds for left ears are plotted on the right and represented with X's. Thresholds for listeners reporting experiencing tinnitus < 1/yr are plotted in purple, listeners reporting not being bothered by tinnitus are plotted in navy blue, listeners reporting being bothered a little are plotted in light blue, and listeners reporting being bothered a lot are plotted in lime green (color online).
Comparison of THS Versions with 5- and 11-Point Likert Scales
Similar to the methods described in Davidson et al. (2023), the number of response options on the THS-T was manipulated for the purposes of this study. In the original version of the THS-T (Henry et al., 2015), patients were asked to respond to each item using a 5-point scale (0–4), where each numbered response option was labeled as follows: 0 = No, not a problem, 1 = Yes, a small problem, 2 = Yes, a moderate problem, 3 = Yes, a big problem, and 4 = Yes, a very big problem. After the questions were answered, the scores on the four items for each subscale were then summed to get overall hearing and tinnitus subscale scores ranging from 0 to 16. Because the maximum possible score on this scale is 16, the original version of the THS-T will be referred to as the THS-T16.
Other tinnitus surveys, like the TFI (Meikle et al., 2012), use an 11-point scale. In our studies, we asked participants questions drawn from multiple questionnaires and therefore wanted a scale that was identical across different questionnaires. This motivated the development of an 11-point version of the THS-T where participants were presented with a set of radio buttons on a tablet labeled 0 through 10. The “0” was labeled “No, not a problem” and the 10 was labeled “Yes, a very big problem.”
Whereas the original THS-T16 has a label associated with each response option, the numbered response scale on the THS-T40 has labels only at the endpoints and the respondent selects a whole number in the scale (e.g., “4”) for each item. Again, the four items for each subscale were summed to get overall hearing and tinnitus subscale scores ranging from 0 to 40. Because the maximum possible score on this scale is 40, it will be referred to as the THS-T40. For the purpose of this article, only the tinnitus scores were examined. Refer to Davidson et al. (2023) for normative results for the hearing subscale.
Conversion of the THS-T16 score to the THS-T40 score, and vice versa, was determined by having participants complete both versions of the THS-T (N = 305). Each score was converted to a percentile, and a line was fitted to the data. Error for the line of best fit was minimized using an orthogonal least-squares method. Briefly, orthogonal least-squares methods assume that there is error on both the independent and dependent variables, meaning that the equation for the line of best fit is symmetrical when solved algebraically. The correlation between the THS-T16 and THS-T40 was excellent (r = 0.99, p < 0.001), indicating that SMs use the scales nearly identically (see Figure 2).

Scatterplot of THS-T16 (x-axis) and THS-T40 (y-axis) scores as percentiles. Numbers indicate the percentile of the point. Only select percentiles are shown to improve readability. The line of best fit using least-squares orthogonal regression is pictured in blue. The equation of the line is printed at the bottom of the figure.
The function to convert from the THS-T16 to the THS-T40 is:
Although there are no published norms for the THS-T16, there may be cases where someone who collects scores on the THS-T40 may want to convert those scores to equivalent scores on the THS-T16. The equation for converting from the THS-T40 to THS-T16:
Though there is a high correlation between the percentile scores on the THS-T16 and THS-T40, it is important to note that scores on the THS-T16 are quantized into a much smaller number of possible scores than those on the THS-T40. The normative data presented below suggests that there are some cases where a single-point change in one of the four questions on the THS16 of the test can lead to as much as a 15-point change in the percentile score. Thus, the advantages of improved response resolution obtained by using the 11-point scale outweigh the disadvantages of changing from the 5-point scale used in the original version of the test. This is particularly true given that there are no normative values published for the THS-T16 version of the test. It is also true that the primary clinical comparison made with the THS (comparing the relative scores on the hearing and tinnitus versions of the test to see if the hearing score is worse than the tinnitus score) can be made just as easily with the THS40 response scales as with the THS16 response scales. The 11-point scale on the THS40 is also consistent with other surveys, including the TFI, that are likely to be administered to individuals who are seen for a tinnitus evaluation in a clinical setting. In the remainder of the analysis, results will be presented based on the THS40, but the results transformed into the THS16 will also be presented to make it easier to use the normative data with the original version of the test.
Analysis and Results
Effects of Hearing Profile on the THS Tinnitus Subscale
Figure 3 shows cumulative distributions of the THS-T separated by Military Operational Hearing Test (MOHT)-based hearing profiles (NH, H1, H2, and H3). The hearing profiles indicate military auditory fitness for duty, where H1 indicates no greater than a slight mid-frequency and mild high-frequency hearing loss, H2 indicates no greater than a mild mid-frequency and moderate high-frequency hearing loss, and H3 indicates poorer hearing than an H2 profile. For the purpose of analyzing the THS-T data, we separated SMs with normal audiometric thresholds across 500–4000 Hz (15 dB HL or less) from the rest of those with an H1 profile. Based on Figure 3, there is clearly a tendency for listeners with hearing loss to have higher scores than listeners with normal hearing, but there was a substantial spread in THS-T scores in all three populations. There is also no obvious point in the distributions to set a cutoff that would have a sufficiently high sensitivity and specificity (i.e., a large separation between the curves). Because all the different hearing profile groups include individuals with a wide range of tinnitus symptoms, it is likely that hearing profile is not the correct way to identify “normal” individuals for developing normative scores on the THS-T. Thus, a normative cutoff based on the normal hearing profile was not provided.

Cumulative distribution of THS-T score by hearing classification. THS-T40 score is plotted along the lower x-axis, with the equivalent THS-T16 score plotted along the upper x-axis. Note that the labels on the upper x-axis encompass a range of scores on the lower x-axis. This is due to the extra granularity afforded by the 40-pt scale relative to the 16-pt scale. The cumulative percentage of SM that achieved higher than a given score on the THS-T is plotted along the y-axis. Color designates the hearing classification. For example, 50% of SMs with H3 hearing classifications scored higher than a 10 on the THS-T. Shaded regions represent 95% bootstrap confidence intervals.
The error bars around the distributions were calculated using bootstrapping. Bootstrapping is a procedure in which the experimental sample is iteratively resampled to represent the nature of random sampling from the population as a whole. Here, bootstrapping was accomplished by taking several samples with replacement equal to the sample size of each group (i.e., 2,789 samples in the NH group) and calculating the cumulative distribution of that sample. This was done 10,000 times for each group. The dark line represents the observed distribution from the study sample. The shaded region represents the 95% confidence interval around the study sample. This shaded region was calculated by taking the distributions that marked the 2.5th and 97.5th percentile among the 10,000 bootstrapped distributions.
Normative Data for the THS-T and Comparison to the TFI
As mentioned previously, the TFI is a clinical questionnaire used to quantify the impact of tinnitus on a variety of routine activities and assess outcomes following clinical rehabilitation of tinnitus, validating patient complaints and reports of improvement. It is a 25-item questionnaire evaluating the self-perceived impact of tinnitus across 8 subscales: (1) intrusiveness of tinnitus, (2) sense of control over tinnitus, (3) cognitive interference (e.g., difficulty with concentration), (4) problems falling or staying asleep, (5) hearing difficulty associated with tinnitus, (6) interference with relaxation, (7) quality of life (e.g., enjoyment of social activities), and (8) emotional distress caused by tinnitus, such as anxiety and depression. Based on the frequency distribution of scores on the TFI, scores below 25 suggest mild tinnitus with little or no need for intervention, scores greater than 25 and less than 50 may indicate more significant problems with tinnitus and a possible need for intervention, and scores greater than or equal to 50 suggest tinnitus severe enough to warrant intervention (Meikle et al., 2012).
In order to choose cutoffs for the THS-T40, we compared our data to the TFI. A total of 1,304 SMs completed the TFI in addition to completing the THS-T40, providing a rich dataset for comparing responses on the two measures. The TFI and the THS-T40 were highly correlated with one another (r = 0.85, p < 0.001), indicating that the measures share a large amount of variance. See Figure 4 for a spread of the data.

Scatterplot with TFI score (x-axis) plotted against THS-T40 score (y-axis). The correlation between TFI score and THS-T40 score is 0.85, indicating that the measures share a large amount of variance.
A receiver operating characteristic (ROC) analysis was performed to determine the optimal cutoff for agreement between the THS-T40 and both cutoffs of the TFI (25 for maybe refer, and 50 for definitely refer). The ROC curve is plotted in Figure 5.

Receiver operating characteristic (ROC) curve for the TFI and THS-T40. The false alarm rate (1-specificity) is plotted along the x-axis and sensitivity is plotted along the y-axis. TFI cutoffs of 25 and 50 for maybe refer and definitely refer were used to determine the appropriate cutoffs on the THS-T40. The darker color shows the ROC for the maybe refer cutoff and the lighter color shows the ROC for the definitely refer cutoff.
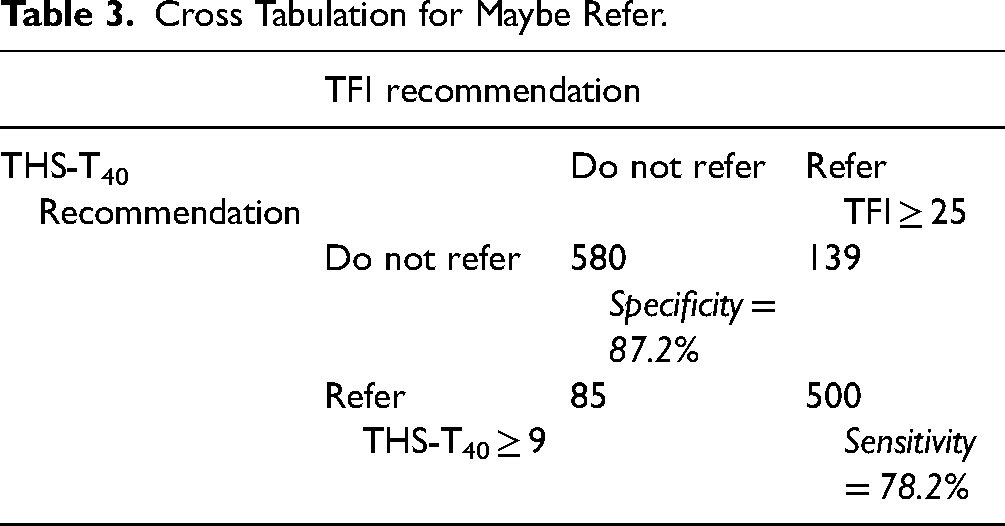
There is generally excellent agreement between the measures, with large areas under the curve and high sensitivity and specificity for both the maybe refer (AUC = 0.90, sensitivity = 0.87, specificity = 0.78) and definitely refer (AUC = 0.94, sensitivity = 0.87, specificity = 0.88) cutoffs. The cross tabulations of recommendations made by both scales and the sensitivity and specificity can be found in Tables 3 and 4.
Cross Tabulation for Maybe Refer.
Cross Tabulation for Definitely Refer.

Finally, we can look at the distribution of THS-T scores by tinnitus severity in Figure 6. The cutoffs based on the TFI analysis for maybe refer and definitely refer are shown with purple and orange-bordered gray bars, respectively. The distribution in Figure 6 shows all 4,589 participants in the study rather than only the subset that completed the TFI.

Cumulative distribution of THS-T scores by tinnitus category. The axes are the same as those in Figure 2. The distributions show the different tinnitus severity categories. Vertical bars show the recommended THS-T40 cutoffs based on the ROC analysis: 9 for maybe refer and 15 for definitely refer.
One notable aspect of the THS-T distributions in Figure 6 is that the distributions of scores were almost identical for individuals who never reported tinnitus and those that reported tinnitus at least once per year but were not bothered by it. This is important because it validates the assumption that individuals who do not experience tinnitus at least once per year can be assumed to fall in the “not bothered” tinnitus category.
Another notable aspect of the THS-T distributions is that there were widespread THS-T responses in the “bothered a lot” group that were above the cutoff value for individuals without tinnitus. Individuals bothered by tinnitus provided THS-T40 responses over nearly the entire range from 9 to 40. This is important because it indicates that there is a wide range of tinnitus severity beyond our recommended cutoff especially for those that are “bothered a lot” by tinnitus, and emphasizes the importance of using a symptom scale like the THS-T40 rather than relying on a single question to describe tinnitus status.
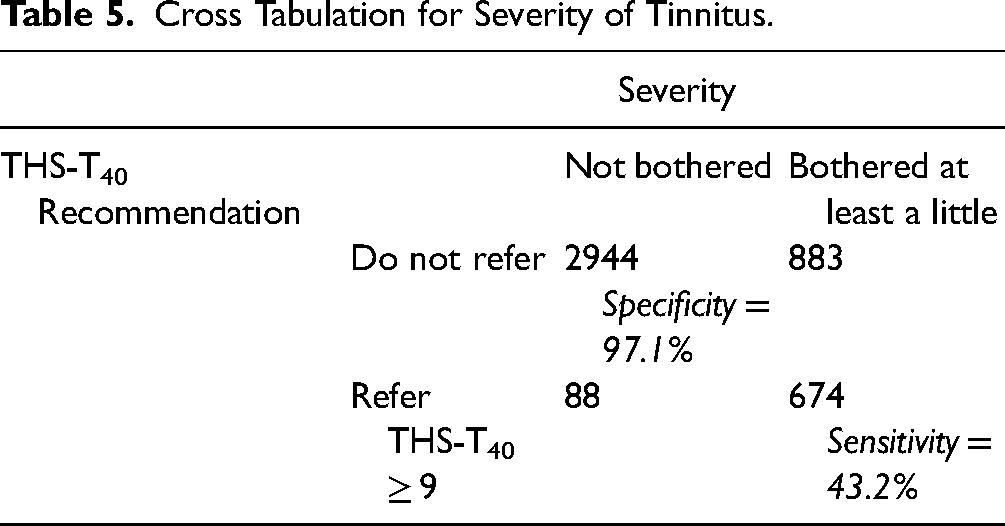
We also performed a sensitivity analysis for determining how well the THS-T40 cutoffs based on the TFI predict whether an individual is bothered a little or a lot by their tinnitus. See Tables 5 and 6 for the agreement between the THS-T40 cutoffs and self-reported severity.
Cross Tabulation for Severity of Tinnitus.
Cross Tabulation for Severity of Tinnitus.

The THS-T40 also seems to be sensitive to self-reported bothersomeness of tinnitus based on the recommended cutoffs. Given the sensitivity and specificity of the 9 and 15-pt cutoffs, it seems that the 9-pt cutoff is a better recommendation for determining whether a patient is bothered or not by their tinnitus. It is important to note that the recommended cutoffs are relatively conservative—they are biased toward correctly identifying individuals that do not experience bothersome tinnitus rather than correctly identifying individuals that do. This could be a desirable trait, given that too many referrals to a specialist may overwhelm the specialist's ability to care for patients.
Discussion
In this study, responses on the THS-T40 from a large cohort of U.S. military SMs were examined. The results provide evidence to support the use of the THS-T40 score to guide referrals for clinical evaluation. Scores on the THS-T40 had notable separations based on the overall severity of self-reported tinnitus, with a clear cutoff to identify individuals with greater severity on the THS-T40 relative to individuals who were not bothered by their tinnitus. Healthcare providers (e.g., primary care managers) and audiologists who treat SMs can use this information to identify individuals who have clinically elevated THS-T40 subscores and to determine the percentile values of individual scores relative to the SM population who do not report tinnitus. They can also use the percentile values provided for individuals with different levels of tinnitus severity to compare the severity of the tinnitus complaints of individual SMs to other SMs.
Routine documentation of the THS-T subscale score in the system of record will facilitate analysis of changes in tinnitus complaints made by noise-exposed individuals over time and identification of trends in tinnitus complaints that could help identify risks for particular sub-populations of military personnel (i.e., those in particular units or who use particular weapon systems).
Although this data set was collected from SMs, the THS-T40 could be a valuable clinical tool for quickly determining the severity of tinnitus complaints made by individuals in the general population as well. This is especially important given that recent studies suggest there are many individuals with normal hearing thresholds who perceive tinnitus. One study evaluating temporary noise-induced and permanent tinnitus in 3892 high school students found prevalence rates of 74.9% and 18.3%, respectively (Gilles et al., 2013). Thus, one could argue that the collection of data from a questionnaire like the THS could provide a valuable supplement to the audiogram for identifying preclinical changes in hearing that might identify individuals who are at risk of developing bothersome tinnitus, or other long-term auditory problems.
Limitations
First, the study population was restricted to active duty SMs being seen in hearing conservation clinics, and therefore the data collected may not be representative of the general population being seen for medical or clinical audiological appointments. Second, the mix of the THS16 and THS40 versions may have introduced some degree of error to the calculations, but we believe that a sufficient sample of SMs (N = 305) completed both versions so that a reliable mapping could be accomplished between the two versions. To address this limitation, a bootstrapping procedure conducted on the slope estimates of the equations for transforming scores between the THS16 and THS40 suggests that there is a 95% chance that the slope estimate is accurate within ± 10%.
Conclusions
The THS is a valuable clinical screening tool for distinguishing problems caused by tinnitus from problems caused by hearing loss. This study analyzed responses on the tinnitus subscale from a large sample of participants to develop normative cutoff scores to guide referrals for clinical evaluation. The THS-T40 can facilitate rapid identification of patients who are good candidates for more comprehensive tinnitus evaluation.
Footnotes
Acknowledgements
The authors would like to thank the audiologists and audiology technicians who collected data for this protocol.
Declaration of Conflicting Interests
The authors declared no potential conflicts of interest with respect to the research, authorship, and/or publication of this article.
Funding
The authors disclosed receipt of the following financial support for the research, authorship, and publication of this article: This work was supported by the Defense Health Program, Congressionally Directed Medical Research Programs Joint Program Committee.