
Abstract
In daily life, both acoustic factors and social context can affect listening effort investment. In laboratory settings, information about listening effort has been deduced from pupil and cardiovascular responses independently. The extent to which these measures can jointly predict listening-related factors is unknown. Here we combined pupil and cardiovascular features to predict acoustic and contextual aspects of speech perception. Data were collected from 29 adults (mean = 64.6 years, SD = 9.2) with hearing loss. Participants performed a speech perception task at two individualized signal-to-noise ratios (corresponding to 50% and 80% of sentences correct) and in two social contexts (the presence and absence of two observers). Seven features were extracted per trial: baseline pupil size, peak pupil dilation, mean pupil dilation, interbeat interval, blood volume pulse amplitude, pre-ejection period and pulse arrival time. These features were used to train k-nearest neighbor classifiers to predict task demand, social context and sentence accuracy. The k-fold cross validation on the group-level data revealed above-chance classification accuracies: task demand, 64.4%; social context, 78.3%; and sentence accuracy, 55.1%. However, classification accuracies diminished when the classifiers were trained and tested on data from different participants. Individually trained classifiers (one per participant) performed better than group-level classifiers: 71.7% (SD = 10.2) for task demand, 88.0% (SD = 7.5) for social context, and 60.0% (SD = 13.1) for sentence accuracy. We demonstrated that classifiers trained on group-level physiological data to predict aspects of speech perception generalized poorly to novel participants. Individually calibrated classifiers hold more promise for future applications.
Introduction
Hearing loss is a chronic condition associated with a myriad of negative consequences, including communication difficulties, stress, and the need for high listening effort (Canlon et al., 2013; Hasson et al., 2011; Hétu et al., 1993; Holman et al., 2019; Pichora-Fuller et al., 2016). These issues are exacerbated in challenging acoustic conditions, such as when the signal-to-noise ratio (SNR) is poor (Picou et al., 2013). Beyond acoustic challenges, these listening situations are frequently underpinned by social contexts that may alter a person's listening behavior and experience (Matthen, 2016; Pichora-Fuller et al., 2016; Pielage et al., 2021). Current routine audiological tests are poor predictors of real-life hearing difficulties and do not account for the social context in which they occur (Keidser et al., 2020).
Predictive tools that account for social context might facilitate more complete diagnosis of listening difficulties and would provide audiologists with additional information to direct counseling and rehabilitation. Such diagnostic tools could incorporate physiological measures, which have been reported to reflect listening effort and stress (Diamond & Otter-Henderson, 2007; McGarrigle et al., 2014; Peelle, 2018; Pichora-Fuller et al., 2016). In this report, we examine whether a combination of features measured from the pupils and cardiovascular systems of listeners with hearing loss could be used to classify listening demand, social context, and sentence accuracy during a speech perception task.
Determinants and Consequences of Listening Effort
Listening effort has been defined as “a specific form of mental effort occurring when a task involves listening” (Pichora-Fuller et al., 2016: 11S). In the case of speech, the underlying premise is that when information in the signal is degraded, for instance by hearing loss, and/or by the presence of interfering background noise, there is a greater reliance on cognitive resources to substitute missing information and understand the meaning of the speech (Peelle, 2018; Rönnberg, 2003; Rönnberg et al., 2008, 2013; Shinn-Cunningham & Best, 2008). Additionally, hearing loss can detrimentally affect selective attention, making it harder to inhibit and ignore surrounding sounds in the first place (Gatehouse & Akeroyd, 2009; Shinn-Cunningham & Best, 2008).
An important factor contributing to listening effort investment in everyday life is the social context in which listening takes place. Social context is thought to moderate listening effort by affecting the success importance of understanding and responding to speech (Hughes et al., 2018; Mackersie & Kearney, 2017; Pichora-Fuller, 2016). Further, the social connectedness achieved by communication may in itself be rewarding, motivating individuals to invest more effort (Hughes et al., 2018; Matthen, 2016). Hearing loss increases the effort needed to listen (Alhanbali et al., 2017) and can give rise to communication breakdown in social situations, causing embarrassment, stress, and even disengagement (Caduff et al., 2020; Mackersie & Kearney, 2017). Indeed, people with hearing loss report that they regularly withdraw from social situations (Holman et al., 2019) and are at higher risk of social isolation than those with normal hearing (Bott & Saunders, 2021; Shukla et al., 2020).
Physiological Responses During Listening
Researchers have inferred information about cognitive processes, including effort and stress, from various physiological measures (Allen et al., 2014; McGarrigle et al., 2014; Pichora-Fuller et al., 2016; Richter & Slade, 2017; Ziegler, 2012). These measures include neuroimaging techniques, such as electroencephalography (EEG) (Berger, 1929; Peelle, 2018), that derive information from the central nervous system, as well as measures of the peripheral nervous system, that is, the activity of the sympathetic and parasympathetic nervous systems (Kahneman, 1973). Effort investment during listening has been assessed as alpha power in the parietal lobe using EEG (Obleser & Weisz, 2012), as changes to the size of the pupils (Zekveld & Kramer, 2014), level of skin conductance (Mackersie et al., 2015; Mackersie & Cones, 2011), duration of the pre-ejection period (PEP) (Plain et al., 2020; Richter, 2016; Slade et al., 2021), and heart rate variability (HRV) (Mackersie et al., 2015; Mackersie & Calderon-Moultrie, 2016).
Individually, these different measures have been presented as correlates of listening effort, yet when applied concurrently, often show minimal agreement with one another (Alhanbali et al., 2019; Strand et al., 2018). For example, three studies measured pupillometry alongside EEG during different listening tasks. McMahon et al. (2016) demonstrated poor agreement between degree of pupil dilation and alpha power during a speech perception task. Ala et al. (2020) showed a similarly absent relationship between the same measures during longer stimuli (news clips). Finally, Alhanbali et al. (2019) measured pupil dilation, skin conductance, and alpha power simultaneously during a digit-repetition task and also found only weak associations between the measures. Physiological measures have also demonstrated limited agreement with behavioral (Seeman & Sims, 2015) and self-reported measures of listening effort (Wendt et al., 2016). Therefore, it has been suggested that different types of measures reflect different aspects of listening effort (Alhanbali et al., 2019; Strand et al., 2018, 2021).
To our knowledge, no studies have implemented both pupillometric and cardiovascular measures simultaneously during listening. This may be due to differences in timescales of traditional analyses using these measures. The pupil data are often extracted during the active listening part of each trial (and shortly after) only and subsequently an average is taken across the trials within a block (Winn et al., 2018). However, the cardiovascular data are typically extracted from a whole task block, including masking noise presentation, pauses between trials and the response time (Mackersie et al., 2015; Mackersie & Calderon-Moultrie, 2016; Plain et al., 2020; Seeman & Sims, 2015). In this work, we extracted trial-level responses from both the pupil and cardiovascular systems. Below we explain the measures that were analyzed in the current study.
Pupil Features
Listening to and repeating a short sentence elicits a transient pupil dilation, known as the task evoked pupil response (Zekveld et al., 2018). Utilizing this phenomenon, three measures are often extracted from the pupils during speech perception tasks: the baseline pupil size (BPS), peak pupil dilation (PPD), and mean pupil dilation (MPD). BPS refers to the diameter of the pupil in the one-second period prior to the onset of the target speech. It provides information about the alertness of the individual (Granholm & Steinhauer, 2004) and anticipation of the upcoming task (Ayasse & Wingfield, 2020). PPD refers to the maximum pupil size elicited by the presentation of the target stimulus, in relation to BPS. It has been robustly demonstrated that as the difficulty of a listening task increases, so does PPD (Wendt et al., 2018; Zekveld et al., 2018). This relationship holds true until the task is deemed impossible or not worth the required effort and the participant disengages, at which point PPD reduces in magnitude (Ohlenforst et al., 2017). MPD refers to the mean of the pupil dilation response, from onset of the target stimulus to the response prompt, relative to BPS (Zekveld et al., 2010). Since pupil data are often noisy, MPD is thought to be a more robust measure than PPD for providing information about cognitive resource allocation (Ahern & Beatty, 1979; Verney et al., 2001; Zekveld et al., 2010), particularly at the trial level.
Of these three pupil diameter measures, PPD has been demonstrated to also respond to manipulation of social context during listening tasks. For instance, Zekveld et al. (2019) demonstrated an increase in PPD for both hearing impaired and normal hearing participants who were given evaluative feedback, in the form of verbal and visual input about their performance during a speech perception task, compared to those who were not given feedback. Similarly, Pielage et al. (2021) found an increase in PPD when normal hearing participants performed a speech perception task in tandem with another participant, compared to when the task was performed alone. In the co-present condition, participants took turns to repeat every other sentence. In both of these studies, the authors interpreted the increase in PPD as an increase in effort, related to increased success importance due to the social context manipulation. Interestingly, in Pielage et al.'s study, performance was unchanged by co-presence, whereas Zekveld et al.'s feedback manipulation improved performance at the easier (speech reception threshold 71%), but not the harder condition (speech reception threshold 50%).
Cardiovascular Features
Various cardiovascular measures reflecting autonomic nervous system (ANS) activity have also been applied to measure aspects of listening effort, including PEP (described in more detail below), HRV, heart rate, and blood pressure (Mackersie et al., 2015; Mackersie & Calderon-Moultrie, 2016; Mackersie & Cones, 2011; Plain et al., 2020; Richter, 2016; Slade et al., 2021). In addition, cardiovascular measures have been applied during nonlistening tasks to demonstrate the effect of the presence of observers (Bosch et al., 2009).
As described above, cardiovascular measures have generally been averaged across an entire task block (Jennings et al., 1992). However, some researchers have analyzed shorter, transient cardiovascular responses during listening. For instance, Francis et al. (2016) measured pulse rate and pulse amplitude at the fingertip using photoplethysmography (PPG) during a sentence perception task (see Discussion section for more details). Pulse rate closely relates to heart rate (or interbeat interval, IBI, in our current study, being the inverse of pulse rate). Pulse rate is influenced by both sympathetic and parasympathetic nervous system activity. Whereas pulse amplitude (also known as blood volume pulse amplitude, BVPA) refers to the volume of blood in the capillaries during a heartbeat, and is related to sympathetic nervous system activity (Iani et al., 2004; Liu et al., 2021; Nitzan et al., 1998). An increase in sympathetic activity during mental effort leads to peripheral vasoconstriction and subsequently a decrease in the BVPA (Iani et al., 2004).
Other measures that may be of interest for trial-by-trial analyses include PEP and pulse arrival time (PAT). PEP is defined as the time interval between the start of the depolarization of the heart's left ventricle and opening of the aortic valve (Newlin & Levenson, 1979; Sherwood et al., 1986, 1990). Similar to BVPA, PEP is also recognized as an index of cardiac sympathetic nervous system activity (Ahmed et al., 1972; Newlin & Levenson, 1979). Though typically averaged across a block, it is possible to extract PEP during shorter time windows. For instance, Kuipers et al. (2017) extracted IBI and a PEP equivalent, referred to as RZ, at the trial level during a flanker task. Conflict trials in the flanker task led to cardiac deceleration and decreased RZ interval as compared to nonconflict trials. This effect could suggest increased effort investment, however the authors noted that changes in RZ did not occur within the physiologically expected time window, hindering the interpretation of this finding (Kuipers et al., 2017).
PAT is also sometimes referred to as pulse transit time (Chan et al., 2019). PAT consists of the time taken for the arterial pressure wave following a heartbeat (measured by the electrocardiogram) to travel to a more peripheral location, often the earlobe, toe, or fingertip (measured by PPG) (Block et al., 2020). PAT inversely relates to blood pressure (Block et al., 2020) and has been applied as a measure of stress (Hey et al., 2009). For instance, an increase in stress elicited by the Trier Social Stress Test (described below) has been demonstrated to correspond to a decrease in PAT, compared to baseline (Hey et al., 2009). To our knowledge, PAT has not been applied during any listening studies to date.
Classification
Combining multiple physiological features obtained during listening requires an analysis tool that is able to evaluate the relationship between these features and the response variable. Classification, where algorithms called classifiers learn to categorize data into different classes, can be used to this end (Drummond, 2010). Classifiers trained on physiological features have been applied within various fields, for example, to diagnose diseases (Sarkar & Leong, 2000), to differentiate emotions (Babiker et al., 2015), to detect attention deficit hyperactivity disorder (Das & Khanna, 2021), and to determine mental states, such as stress (Mozos et al., 2017; Rahman et al., 2015).
In this study, we trained and tested k-Nearest Neighbor (k-NN) classifiers. k-NN is a simple, nonparametric, supervised learning technique that assigns the label of an unlabeled data point based upon the majority vote of its neighbors (Hastie et al., 2009). This is achieved based on the distance between neighboring data points: those within close proximity are likely be grouped together, whereas those separated by a large distance are not (Hastie et al., 2009). When training the classifiers, the optimal number of neighbors (k) must be selected, where k = 1 means that the data point is labeled based upon its single closest neighbor alone.
Aims
The main aim was to use a combination of pupil and cardiovascular features to predict acoustic and contextual aspects of a speech perception task. To this end, we trained k-NN classifiers using seven physiological features at the trial level: BPS, PPD, MPD, IBI, BVPA, PEP, and PAT. We trained the classifiers to predict: (1) the task demand level (i.e., the SNR corresponding to 50% versus 80% correct sentence repetition), (2) the social context (i.e., the presence vs. absence of two observers), or (3) sentence accuracy (correct vs. incorrect repetition). We anticipated that including a range of physiological features in our classifiers would provide superior prediction accuracy over individual measures. The rationale was that the features differ in their level of contribution from the sympathetic (SNS) and parasympathetic nervous system (PNS) branches. For example, PEP and BVPA are thought to reflect primarily sympathetic activity (Iani et al., 2004; Newlin & Levenson, 1979), whereas the other features (including the pupil features) are more mixed in ANS origin (Gordan et al., 2015; Steinhauer et al., 2004). The features also exhibit varied responsiveness to different stimuli and states. For instance, BPS is thought to reflect alertness and anticipation (Ayasse & Wingfield, 2020; Granholm & Steinhauer, 2004), whereas PPD and MPD are task evoked phenomena (Zekveld et al., 2010).
Materials and Methods
General Methods and Previous Analyses
The data were collected from hearing impaired participants during a speech perception task in a two (task demand) by two (social context) within-subject design. The task was conducted at two individually adapted SNRs corresponding to 50% and 80% correct (referred to here as SNR50% and SNR80%, respectively), and in the presence or absence of two observers. Pupillometric and cardiovascular measures were recorded simultaneously throughout. The results from pupillometric and cardiovascular measures have previously been analyzed and presented separately (Pielage et al., 2023; Plain et al., 2021).
In Plain et al. (2021), cardiovascular parameters (HRV, PEP, blood pressure, and heart rate) were measured and averaged across blocks of sentences in relation to a baseline period. The main finding of the study was that baseline-corrected blood pressure change scores (systolic, diastolic, and mean arterial blood pressure) increased in the presence of observers. No cardiovascular measures were sensitive to the task demand manipulation. In Pielage et al. (2023), the main physiological outcome measures were PPD and BPS. BPS increased in the presence of the observers and PPD increased at the SNR50% compared to the SNR80% condition. The results of both taken together demonstrated increased physiological arousal or stress caused by the presence of the observers, and an increase in effort investment at the SNR50% condition compared to the SNR80% condition.
Participants
The data were collected from 29 native Danish speaking, hearing-impaired participants (17 males; average age = 64.6 years, SD = 9.2), who were recruited at Eriksholm Research Centre. Participants had symmetrical (<15 dB difference between ears) sensorineural hearing losses (four frequency pure tone averages across 0.5, 1, 2, and 4 kHz were 50.2 dB HL [SD = 8.9] for the right ear and 51.3 dB HL [SD = 8.7] for the left ear). They were experienced users of Oticon hearing aids. For the purposes of the experiment, they were fitted with bilateral Oticon OPN1 hearing instruments with a double-layered dome attachment. The instruments were programmed to the manufacturer's first fit, microphone settings were omnidirectional; noise reduction, volume control and program functionality were disabled. Participants reported being free from psychiatric, neurological, ocular, or cardiovascular diseases. They provided written informed consent, and all procedures were approved by the Research Ethics Committees of the Capital Region of Denmark.
Speech Perception Task
Task Demand
The task involved a speech perception task, using Danish hearing in noise test (HINT) sentences (Nielsen & Dau, 2011). The participant was required to repeat target sentences spoken by a female talker presented from a frontal loudspeaker in the presence of a four-talker babble masker. The four-talker masker was played from four loudspeakers positioned at 90°, 150°, 210°, and 270° and located 1.2 m away from the participant. Each loudspeaker played back a different recording of a newspaper article with silent gaps longer than 50 ms removed. Two were recordings of male voices and two of female voices; the speech was spectrally altered to match the long-term average speech spectrum of the target speech. The loudspeaker position of each of the voices was randomized between blocks.
The individualized SNRs for the testing blocks (SNR50% and SNR80%) were determined by two adaptive procedures, one targeting 50% and the other targeting 80% correct. Physiological measures were collected during the adaptive procedures, but these data were not analyzed. The adaptive procedures used were described in detail by Plain et al. (2021). The masker was kept constant at 70 dB sound pressure level (SPL) in the adaptive blocks and task blocks. In the adaptive blocks, the target speech level was manipulated adaptively, whereas in the task blocks, the SNR remained constant throughout. Lists of sentences and sentence presentation order within each were counterbalanced across participants and conditions. All blocks consisted of 20 sentences, each of which had 3 s of babble masker preceding and following the target sentence, which lasted on average 1.5 s (range = 1.2–1.9 s). After the participant's verbal response, the experimenter scored the response and waited around 3s prior to initiating the next trial. Word scoring was conducted live during the test session for which errors concerning verb tenses, single/plural nouns, definite/indefinite articles, changes to word order and omission or addition of phonemes were permitted (Plain et al., 2021). Word scoring was then converted to sentence scoring, such that the participant had to correctly repeat all words in a sentence to receive a “correct” score for that trial.
Social Context
The social context manipulation consisted of the above task blocks being completed either alone, referred to as the “alone” condition, or in the presence of two observers, referred to as the “observed” condition. When present, the observers were seated 1.2 m from the central point, facing inwards (toward the participant), at angles of 45° and 315° with respect to the participant. The participant was told to imagine that they were in a social situation with the observers and that the observers had spoken the target sentences. Observers were instructed to act in a neutral and nonthreatening manner and tasked to assess how good the participant would be as a communication partner in real life. The observers were not previously known to the participant however they were hearing-impaired individuals (recruited from the Eriksholm Research Centre database) of a similar age to the participants so that they could be likely social peers of the participant. The presentation order of experimental conditions was counterbalanced across participants, with the constraint that the two alone blocks occurred consecutively, as did the two observed blocks.
Physiological Measures
Pupil Features
Equipment, Data Collection, and Processing
Pupil size was measured during the task using a Tobii Spectrum eye tracker (Tobii, Stockholm, Sweden), at a sampling frequency of 600 Hz. A constant ambient illumination of 200 lux was maintained in the test room for all experimental sessions. Participants were asked to focus on their gaze on the loudspeaker in front of them during stimulus presentation. Pupil data were measured continually during the task blocks and were separated into trials by use of a marker sent at each sentence onset. Sentences one to four were discarded, as the pupil data are considered to be relatively unstable at the start of a block (Winn et al., 2018). Please note that no averaging was conducted within a condition—each trial was considered separately, so that there were more data available with which to train and test the classifiers. Data from the right eye were analyzed unless the tracking of the left eye proved more successful.
The raw pupil data were preprocessed to remove noise and interpolate missing data (Pielage et al., 2023). Missing data were processed differently depending upon the duration of the gaps in the data. Due to an unknown issue, there were some very short gaps (around 5 ms) of missing data (<1% of the full trace). These were interpolated between the last present sample and the third sample after the gap by means of linear interpolation. Gaps longer than 25 ms in duration were not interpolated at this stage. After interpolation of the small data gaps, traces with more than 50% of missing data were excluded, and if more than five sentences in a condition were excluded, then this condition was removed from the analyses. In the accepted trials, any remaining missing samples (>25 ms) were presumed to be caused by blinks. A repeated measures analysis of variance revealed no significant effect of condition on the number of blinks recorded (task demand: F[1,26] = 0.01, p = .92, ηp² = .00; social context: F[1,26] = 0.00, p = .95, ηp² = .00; interaction: F[1,26] = 0.74, p = .40, ηp² = .03). The data surrounding the blinks were removed—the data were cut from 50 samples (83 ms) prior to the first missing sample to the 80th present sample (133 ms) after the blink (Koelewijn et al., 2021). Subsequently, a 51-tap moving average filter that skipped over missing data was applied to smooth the trace and the removed samples were replaced through linear interpolation.
Feature Extraction
The following parameters were extracted per trial from the smoothed, processed pupil data: BPS, PPD, and MPD. The BPS corresponds to the average pupil size during the final second of the masking noise, prior to the onset of the target sentence. The BPS of each trial was subtracted from the other pupil data in the same trial, to baseline correct the values. The task evoked pupil response (TEPR) is the portion of the trace from the onset of the target sentence until the end of noise presentation, prior to the verbal response of the participant. During this window, the PPD refers to the maximum value during the TEPR relative to the BPS and finally, the MPD, which refers to the average of all values during the TEPR (also relative to baseline). For the included sentences, a single value was extracted for each BPS, MPD, and PPD.
Cardiovascular Features
Equipment, Data Collection, and Processing
Cardiovascular measures were recorded by the Cardioscreen 2000 system (Medis, Ilmenau, Germany). The Cardioscreen 2000 measured three streams of continuous data throughout the baselines and task: an electrocardiogram (ECG), an impedance cardiogram (ICG) and a PPG. The equipment uses a standard ECG lead configuration for ECG assessment, lead II of Einthoven's triangle. The ECG and ICG were obtained via three disposable, solid gel, surface electrodes: one positioned on the left side of the neck, one beneath the left armpit at the level of the xiphoid process and one 10 cm lower than this. The PPG sensor consisted of a clip-on sensor, placed on the right earlobe of participants. It should be noted that PPG measured at the earlobe and fingertip have demonstrated mixed agreement—responses at the earlobe may be smaller in magnitude (Armañac-Julián et al., 2022; Awad et al., 2001; Fleischhauer et al., 2023; Hartmann et al., 2019; Kushki et al., 2011). ECG and ICG were measured at a sampling frequency of 1000 Hz, and PPG was measured at a sampling frequency of 200 Hz. Trigger signals were sent to the Cardioscreen 2000 at the onset of the babble masker of every trial, to allow the data to be divided into trials. The device also collected discrete blood pressure data, once per block, from a blood pressure cuff worn on participants’ right arm. The blood pressure data will not be discussed further in this article, but can be found in Plain et al. (2021).
Separate MATLAB (ver. 2018b; MathWorks, Natick, MA) scripts were created for the cardiovascular data processing of each participant. This was preferable because parameters such as the amplitude of the ECG peak varied significantly between individuals. Firstly, the ECG, ICG, and PPG data were loaded into MATLAB. The PPG signal was up-sampled to 1000 Hz to match the ECG and ICG data. For many participants, the PPG signal was contaminated by an artifact at around 5.3 Hz. Where necessary, this was removed using a zero-phase 22nd order infinite impulse response band stop filter between 5.2 and 5.4 Hz. The PPG, ECG, and ICG signals were filtered using 6th order Butterworth bandpass filters. For the PPG signal, a passband of 0.1 to 8 Hz was applied, whereas for the ECG and ICG signals a passband of 1 to 30 Hz was applied (Raza et al., 1992). Data were subsequently divided into individual trials using the trigger information and the duration of each HINT sentence. For each trial, the cut cardiovascular data consisted of 3s of masking noise, the duration of the sentence, followed by 3s of masking noise. Data obtained during the verbal sentence repetition were discarded and sentences one to four for each condition were also excluded, in keeping with the pupil data.
Feature Extraction
Feature extraction was also undertaken in MATLAB (ver. 2018b). Several steps were required to obtain the features from the ECG, ICG, and PPG. The first step involved detecting relevant points in the different data signals (points labeled in Figure 1). For each trial, the R peaks in the ECG signal (indicated with red dots in Figure 1) were detected, representing each heartbeat. Visual inspection of peak detection was conducted to ensure all peaks were correctly detected. Then, for every heartbeat within a trial, semi-automatic procedures were used to detect two points: (1) the Q point of the PQRST complex of the ECG, which corresponds to the onset of left ventricular depolarization (indicated with black dots in Figure 1) and (2) the B point of the ICG, which corresponds to the opening of the aortic valve (indicated with white diamonds in Figure 1). The latter was detected using a tangent-based method. Tangent-based algorithms have been applied successfully to detect other cardiovascular parameters (Escobar-Restrepo et al., 2018; Hermans et al., 2017). The positioning of these points was confirmed to be correct by visual inspection. Where incorrect detection was demonstrated, the parameters of the algorithms were fine-tuned by the experimenter, such that the position was optimal. In addition, B points that were detected greater than two standard deviations from the position of the others within a trial were excluded.
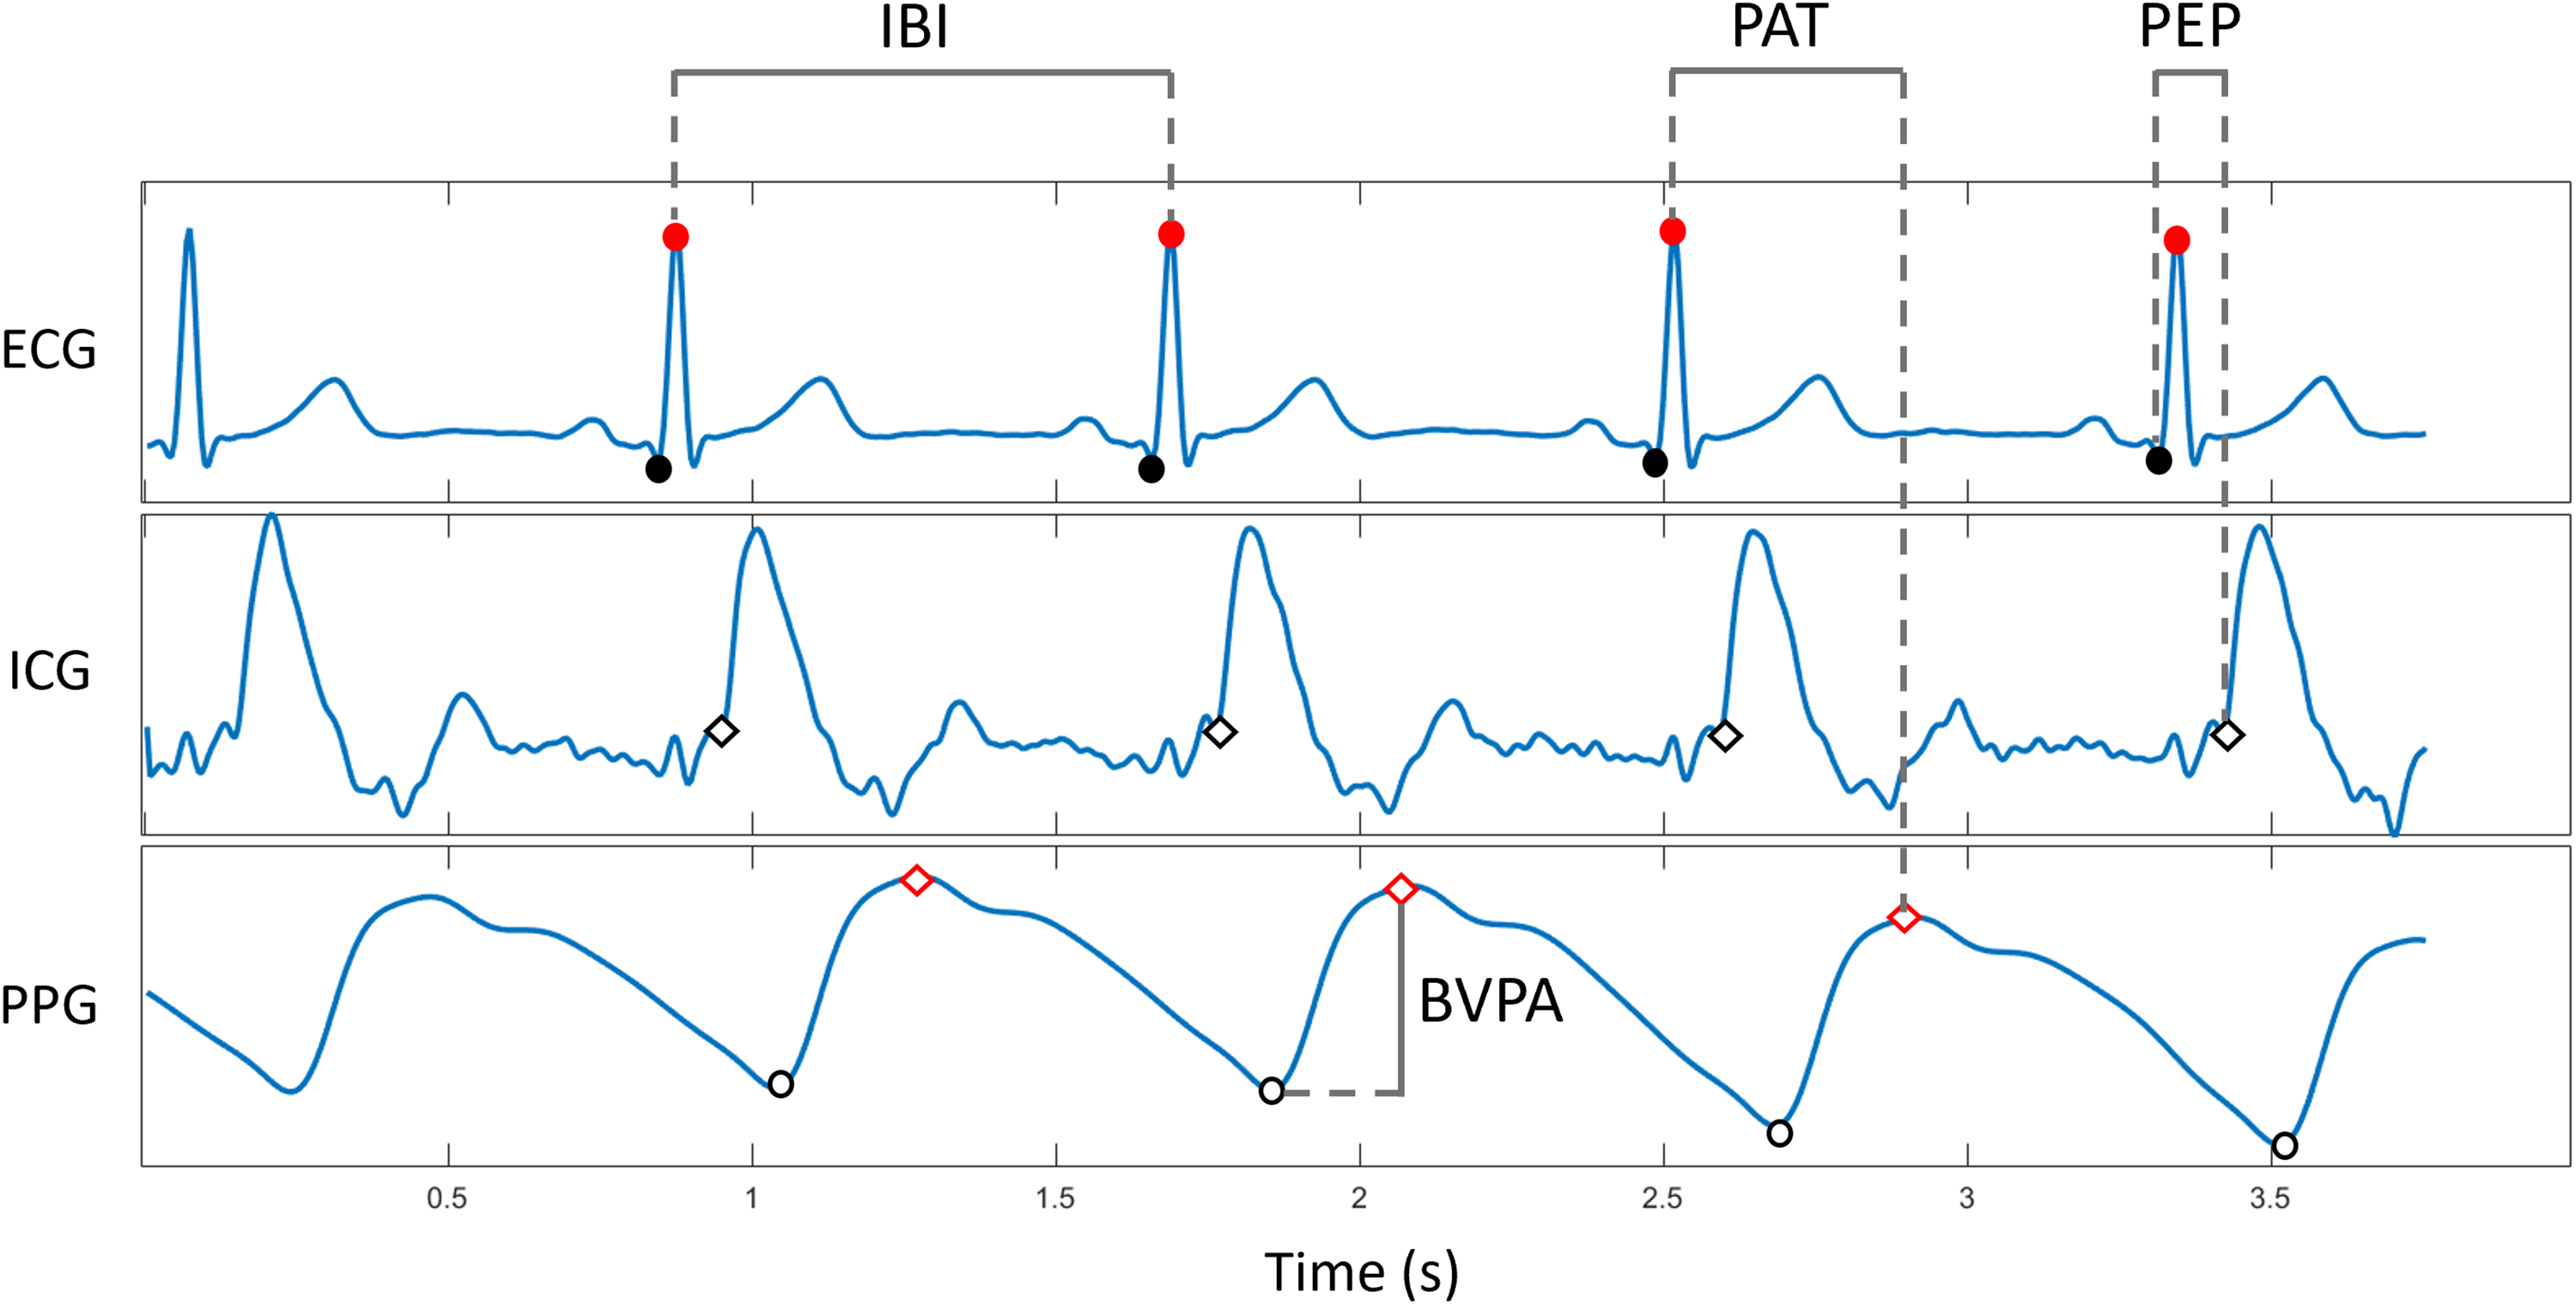
Extracting cardiovascular features from the ECG, ICG, and PPG signals. Q points (ECG) are denoted by black filled circles and R peaks with red filled circles. B points (ICG) are denoted by black unfilled diamonds. PPG peaks are denoted by red unfilled diamonds and the troughs are denoted by black unfilled circles. IBI is the interval between consecutive R peaks (ECG). PAT is the interval between the R peak (ECG) and the following PPG peak. PEP is the interval between the Q point (ECG) and the B point (ICG). BVPA is the difference in amplitude between the PPG peak and trough. The first cycle has not been annotated to show the morphology of the cycles clearly. BVPA = blood volume pulse amplitude; ECG = electrocardiogram; IBI = interbeat interval; ICG = impedance cardiogram; PAT = pulse arrival time; PEP = pre-ejection period; PPG = photoplethysmogram.
Next, the PPG signal corresponding to each heart cycle was detected. Due to noise in the PPG signal, a signal quality index was calculated for each PPG segment to qualify it for feature extraction (Goldberger et al., 2000; Vest et al., 2018). Each PPG cycle was compared to a template PPG cycle for the same participant. Templates were created by the experimenter, by locating and averaging across an optimal section of the participant's PPG signal, without artifact or contamination. PPG cycles not meeting the quality threshold (those with < 80% signal quality score) were discarded and not included in the analysis. The maximum point of the PPG cycle was labeled as the peak, and the minimum point was labeled as the trough (indicated with red diamonds and white circles, respectively, in Figure 1).
The data extracted as above were used to calculate four cardiovascular features in each trial: IBI, BVPA, PEP, and PAT. Figure 1 demonstrates how each of the features were extracted from the ECG, ICG, and PPG signals. IBI was calculated as the difference between each consecutive detected R peak. BVPA was calculated as the difference in amplitude at the foot of the PPG signal to the peak of the PPG signal. PEP was calculated by determining the time duration between the detected Q point of the ECG and B point of the ICG. Finally, PAT was calculated as the duration between the R peak of the ECG and the peak of the PPG signal. Depending on the participant's heart rate they might have around seven values for each feature per trial. The calculated values in each trial for each feature were averaged, such that there was a single number per feature per trial. This approach was selected, because trials contained varying numbers of cycles (due to different heart rates) and to align the cardiovascular with the pupil data (i.e., a single PPD value per trial).
Parameter Optimization
For each trial of each condition for each participant there were three features from the pupil data (BPS, MPD, and PPD) and four features from the cardiovascular data (IBI, BVPA, PEP, and PAT). All seven features were imported into a table which had 1856 rows (all trials of all participants). Cardiovascular data for one participant and pupil data from two participants were excluded completely due to very poor signal quality. The total number of valid trials for each feature was as follows: BPS, 1665; MPD, 1665; PPD, 1665; IBI, 1721; BVPA, 1626; PEP, 1723; and PAT, 1598. To ensure outliers were removed, data that were more than three standard deviations away from the group mean for each feature was excluded. Ultimately, this resulted in no further trials being excluded for BPS, IBI, and PEP, whereas 21 additional trials were excluded for PPD, 17 for MPD, 32 for BVPA, and one for PAT. Finally, the features were standardized in preparation for their inclusion in the classifiers: the data were centered and scaled according to the feature means and standard deviations, respectively.
Classification
In the present study, we trained and tested k-NN classifiers to predict three different aspects of the experiment: (1) the task demand level (SNR50% or SNR80%), (2) the social context condition (presence or absence of two observers), and (3) the sentence accuracy (correct or incorrect repetition).
All k-NN algorithms were trained using the same physiological features but differed in the number of trials included. The first two classifiers, predicting task demand, and social context, included all data from suitable trials. For the third k-NN classifier predicting sentence accuracy, a subset of trials were included as k-NN classifiers are sensitive to imbalanced datasets (Wah et al., 2016). It contained all trials obtained during the SNR50% task demand condition, plus a subset of trials from the SNR80% condition: data obtained during all incorrect SNR80% trials and a subset of 25% of correct SNR80% trials. This resulted in a balanced dataset (50% correctly and 50% incorrectly repeated trials).
We trained classifiers on data at the group level and at the individual level (see summary of data pipeline in Figure 2). The group classifiers were first trained and tested by means of 50-fold cross validation (method 1a in Figure 2). The k-fold cross validation involves splitting the dataset randomly into k (in this case 50) groups of equal size. One group is held out as the test dataset, while the remaining data are used to train the classifier. When trained, the classifier is tested using the test dataset. This procedure is repeated k times. Though k-fold cross validation ensures that training and test data are separate, validating the classifier using this technique meant it was likely that different trials from the same participant were appearing in both the training and test datasets, which can falsely enhance the results of the classifiers (Gholamiangonabadi et al., 2020; Miltiadous et al., 2021; Saeb et al., 2017).
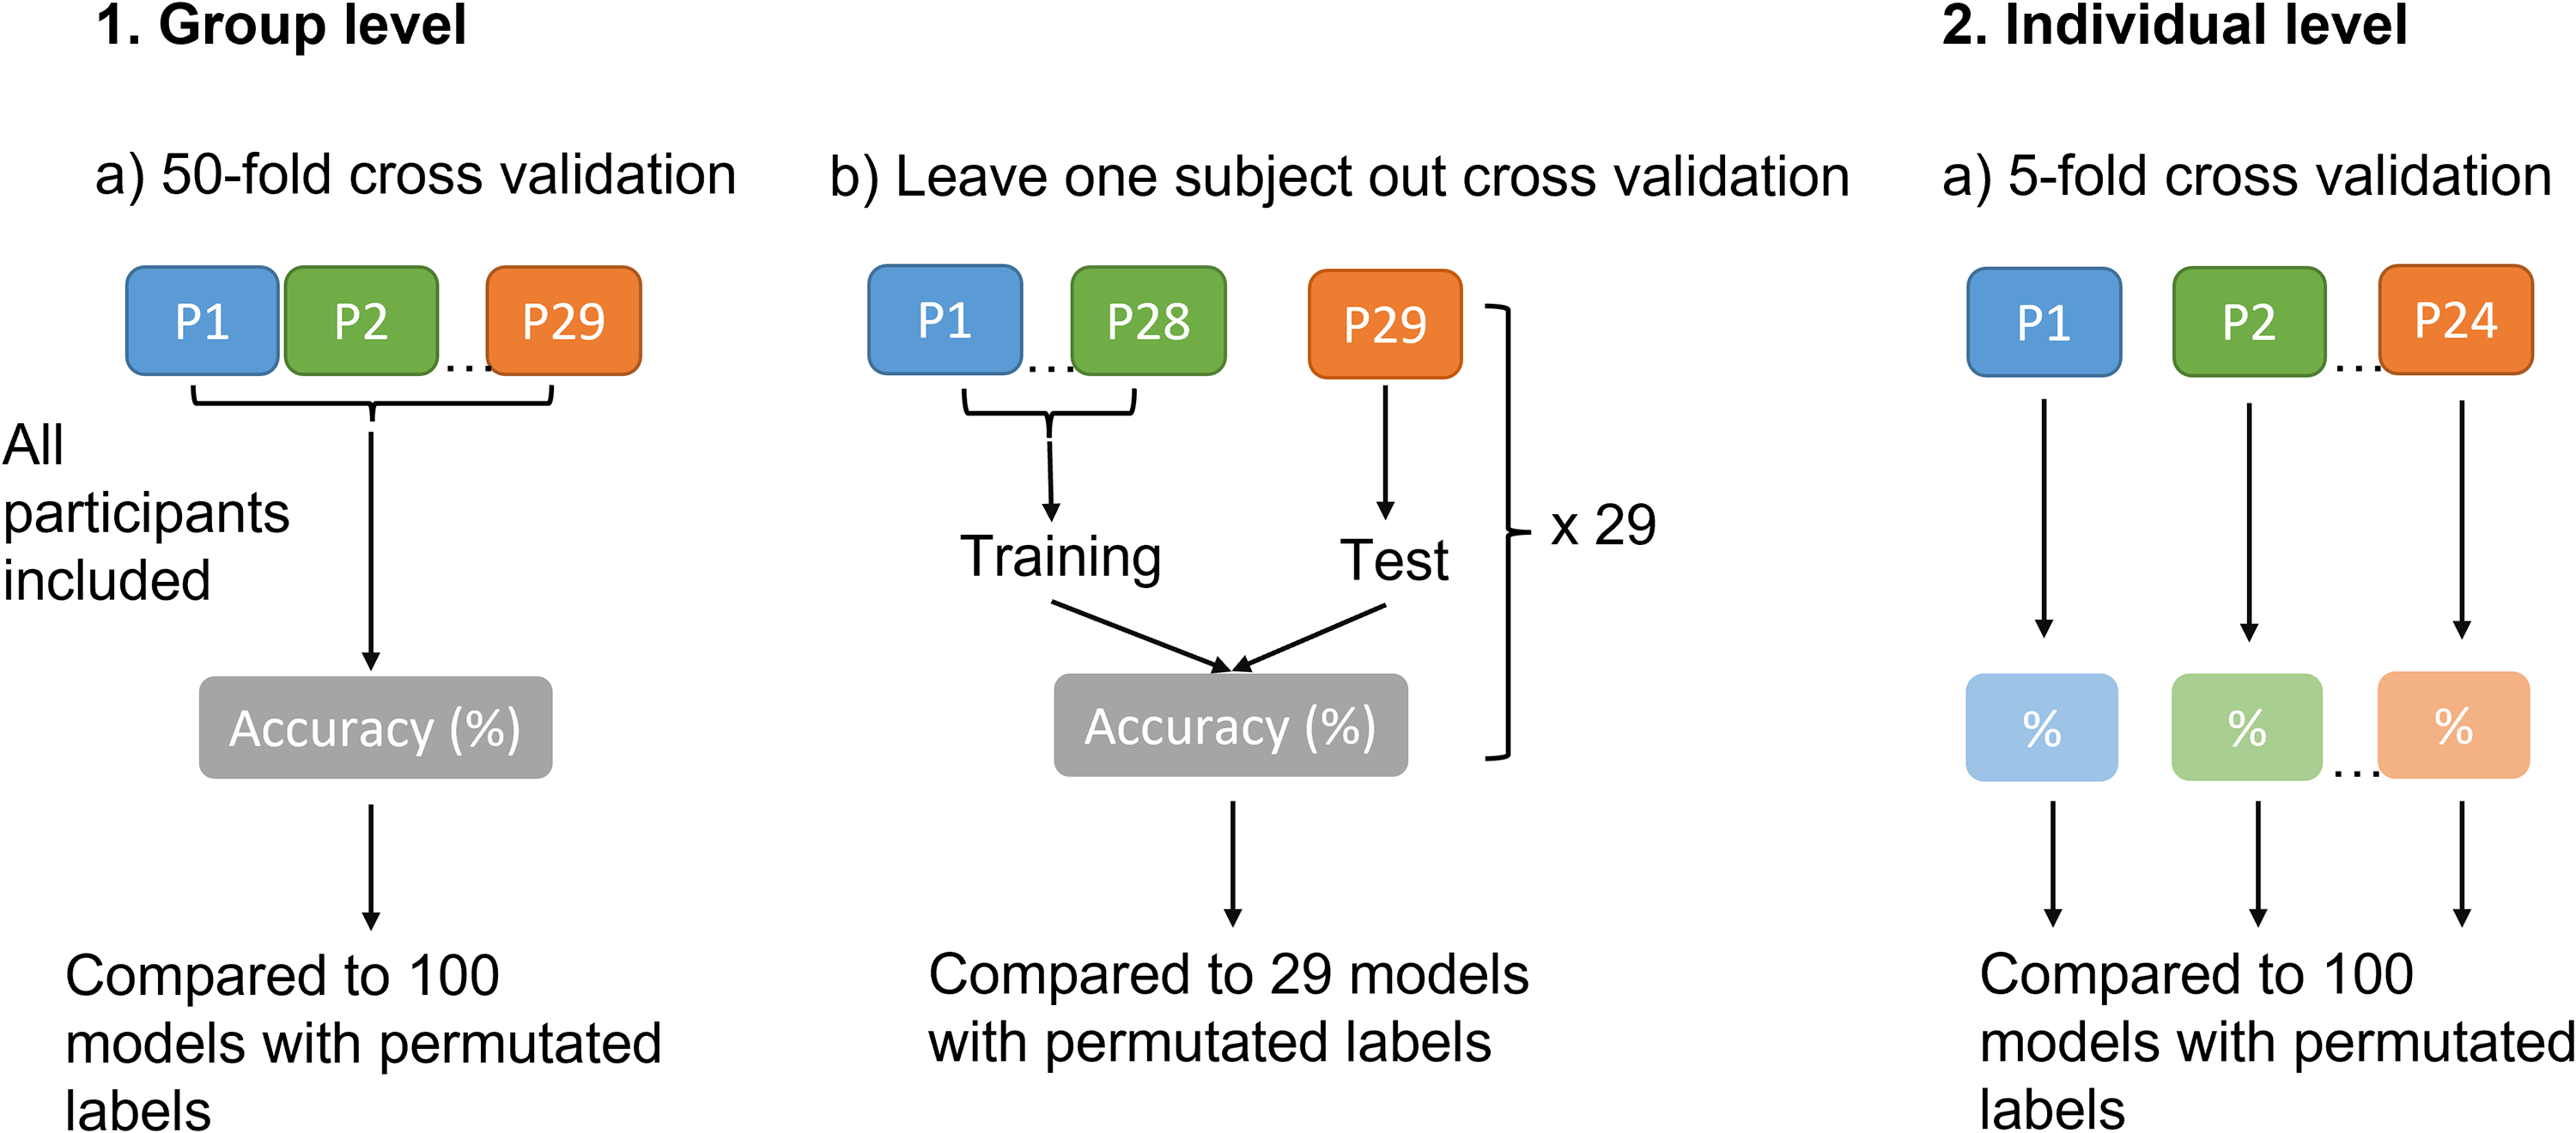
Schematic demonstrating the classification analyses conducted at the group and individual level. P = participant.
To determine how generalizable the classifiers were to novel participants, we then conducted leave one subject out validation, where one participant's data were isolated from the training dataset and used exclusively for testing (method 1b in Figure 2). This was repeated 29 times, with each participant selected once to appear in the test dataset. This approach simulates a possible clinical application of these classifiers—if the group level classifiers performed well during leave one subject out validation, this suggests that physiological data from a novel, unseen individual could be provided to the classifiers to determine the person's task demand, social context or sentence accuracy while they performed the task.
Having trained k-NN classifiers on the group data, we then trained and tested k-NN classifiers on individual participants’ data (method 2 in Figure 2), using five-fold cross validation. This allows classifiers to be calibrated for the individual, removing between subject variability. Training individualized classifiers has been done more often in speech tracking, for example, where the speech signal is encoded based upon the EEG (Fiedler et al., 2019; Jessen et al., 2019; O'Sullivan et al., 2017).
The trained k-NN classifiers were optimized by automatic tuning of hyperparameters in MATLAB (ver. 2018b). The function selected the most appropriate parameters for each classifier including the distance measure and the number of neighbors (k). The optimized classifier results (including distance measures and values of k) are reported here. All seven features were used as the input to each of our classifiers (i.e., no feature selection was undertaken). For each k-NN classifier, we present classifier accuracy, precision, sensitivity, specificity, and F1 score (a measure of the model's accuracy), defined by the formulae below, where TP = true positive, TN = true negative, FP = false positive, and FN = false negative. Classification accuracy (defined by equation below) was our primary measure of classifier performance, and hence is the main focus of the Results and Discussion sections. The other result measures are only presented in tabular form.

Permutation Analysis
To verify whether our classifiers were operating at above chance level, we conducted permutation analysis on the classifier accuracies. Permutation analysis is a simple, nonparametric technique that can be applied to assess the performance of classifiers (Golland & Fischl, 2003; Ojala & Garriga, 2010). The method involved repeatedly shuffling (or permuting) the data labels, such that they were misaligned with the dataset. For each permutation, a new classifier was trained and tested, allowing a null distribution of classifier accuracies to be estimated. A p-value was determined from this distribution, by calculating the proportion of all permutation accuracies that were equal to or that exceeded the original model's accuracy (Anderson & Ter Braak, 2010; Ojala & Garriga, 2010). The null hypothesis stated that there was no difference between the original classifier accuracy and the sampling distribution estimated with randomly shuffled labels. We conducted 100 permutations per original classifier (see Figure 2), allowing minimum p-values of 0.01 to be obtained.
Neighborhood Component Analysis
Finally, to determine the contribution of each of the seven features to the classifiers, neighborhood component analysis (NCA) was conducted in MATLAB (ver. 2018b) for each model. NCA is a nonparametric technique that enables feature selection with a view to maximizing the accuracy of classifiers (Yang et al., 2012). NCA is often applied with the aim of reducing the complexity and improving the efficiency of the model, by selecting significant features and reducing dimensionality. For example, NCA has been applied to EEG data to this end (Javaid et al., 2015; Raghu & Sriraam, 2018). In the present study, however, we had a relatively small pool of features (seven), and therefore opted to apply NCA to obtain information about the classifiers and the contribution of individual features without utilizing this information further to refine the classifiers. NCA was conducted on the classifiers obtained using k-fold cross validation: the group level and the individual classifiers. We opted not to perform NCA on the group level classifiers obtained using leave one subject out cross validation, as these performed close to chance level.
Results
Group Level Classifiers
50-Fold Cross Validation
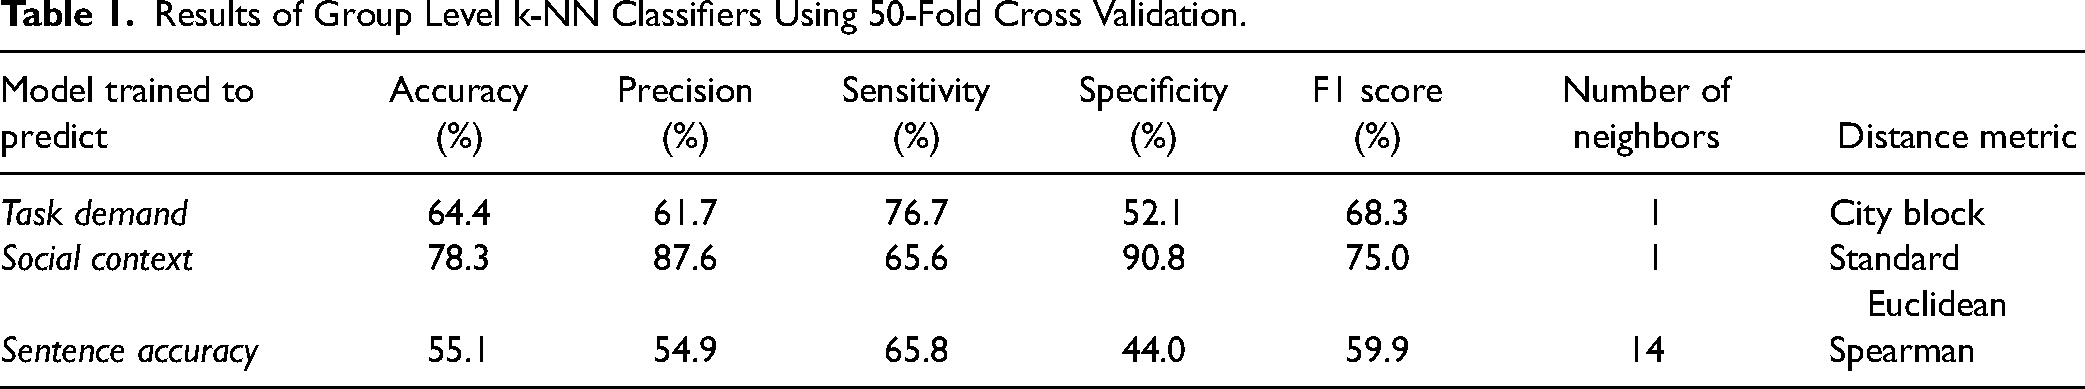
Classifier parameters (number of neighbors and distance metric) and results (accuracy, precision, sensitivity, specificity, and F1 scores) of the three classifiers are presented in Table 1. Confusion matrices are presented in Figure 3. Classification accuracy scores of 64.4%, 78.3%, and 55.1% were obtained for predicting task demand, social context, and sentence accuracy, respectively. These accuracy scores are demonstrated in Figure 4, denoted by vertical dashed lines. Figure 4 also demonstrates the distribution of accuracy scores of 100 classifiers with permutated labels (i.e., the distribution of chance level). The permutation analyses revealed that all three classifiers were operating at above chance accuracy levels (p < .01 for task demand and social context, p = .04 for sentence accuracy).

Confusion matrices of 50-fold cross-validated group classifiers predicting task demand (left), social context (middle) and sentence accuracy (right). The confusion matrices have the following structure: the top left quadrant reflects true positive, the top right quadrant reflects false negative, the bottom left quadrant reflects false positive, and the bottom right quadrant reflects true negative. The shading of the quadrants corresponds to the proportion of the total number of trials; dark shading indicates a high proportion of trials in that quadrant, and light shading indicates a low proportion of trials in that quadrant.
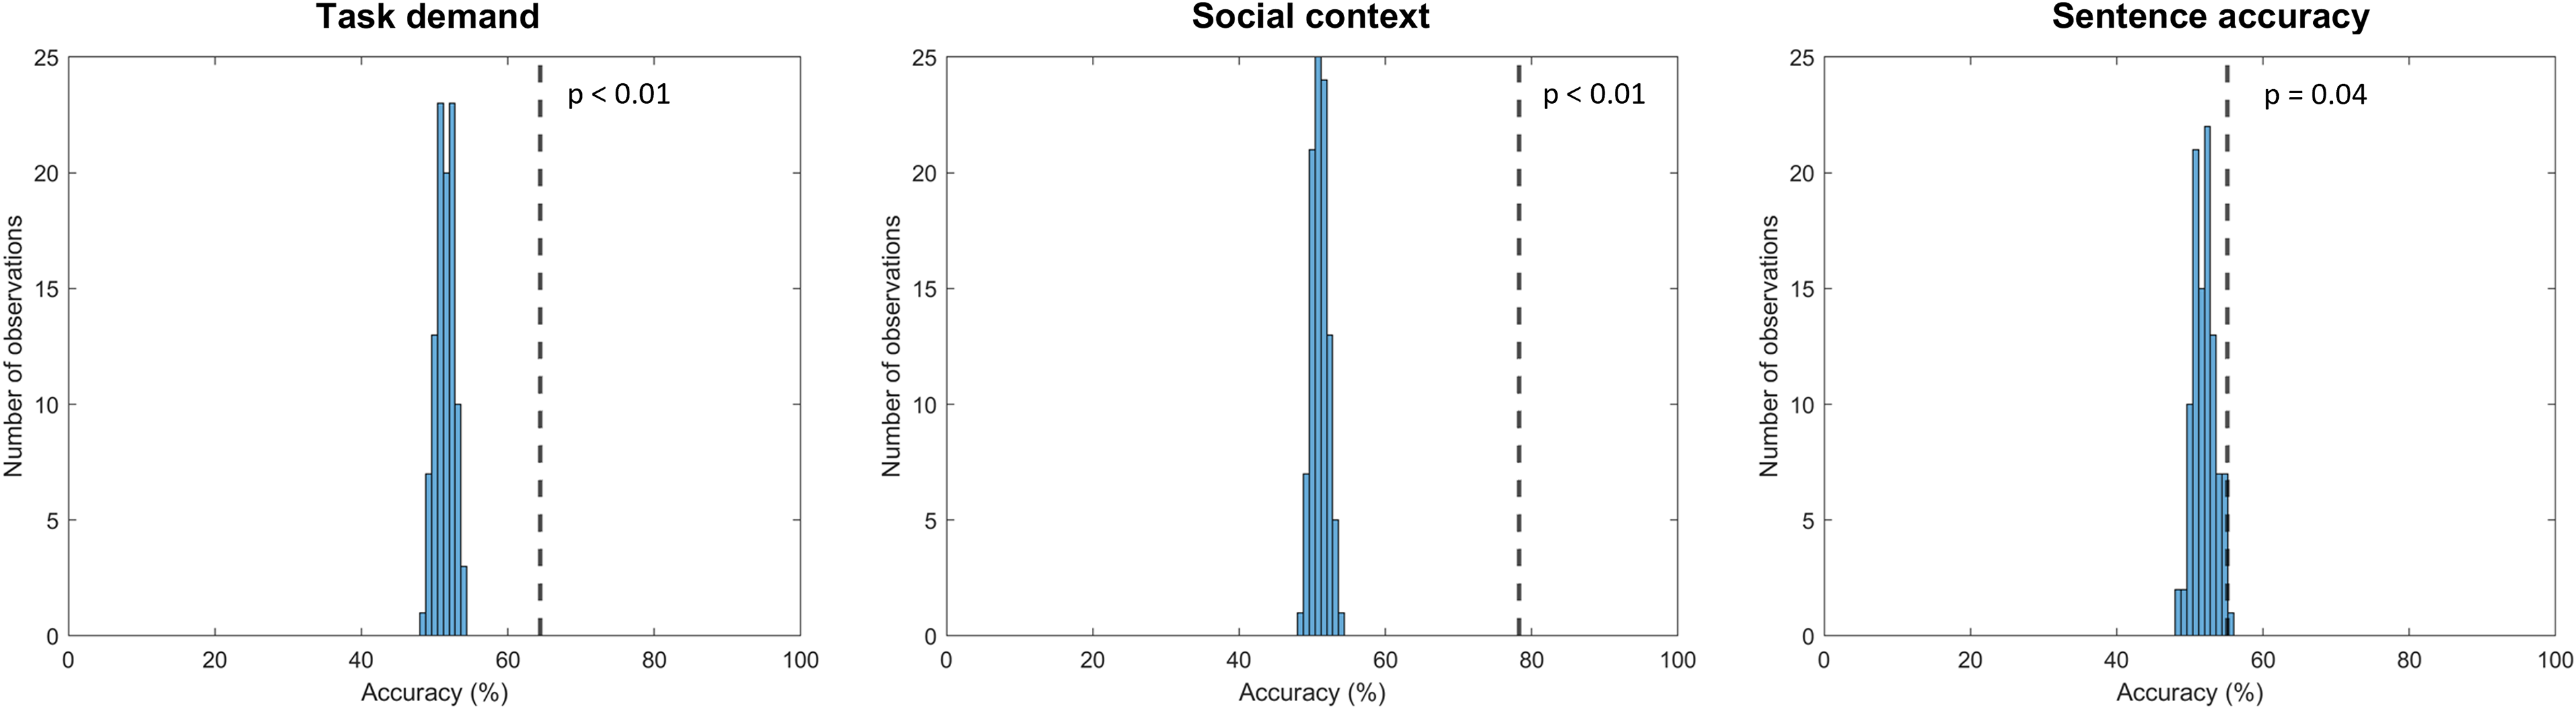
Histograms of permutation accuracy distributions for 50-fold cross-validated group classifiers predicting task demand (left), social context (middle), and sentence accuracy (right). The dashed line represents the performance of the model with correct labels. 100 permutations were conducted.
Results of Group Level k-NN Classifiers Using 50-Fold Cross Validation.
Feature Importance
Figure 5 shows the feature weights obtained by NCA for each of the classifiers. The three pupil features contributed to each classifier to a similar degree. The features contributing most to the prediction of task demand were BVPA and PEP, whereas the other cardiovascular features (IBI and PAT) made a negligible contribution to the model. The features contributing most to the prediction of social context were PEP, PAT and to a lesser extent IBI. Finally, for sentence accuracy, BVPA contributed most to the model, though this was not hugely pronounced in relation to the other features.
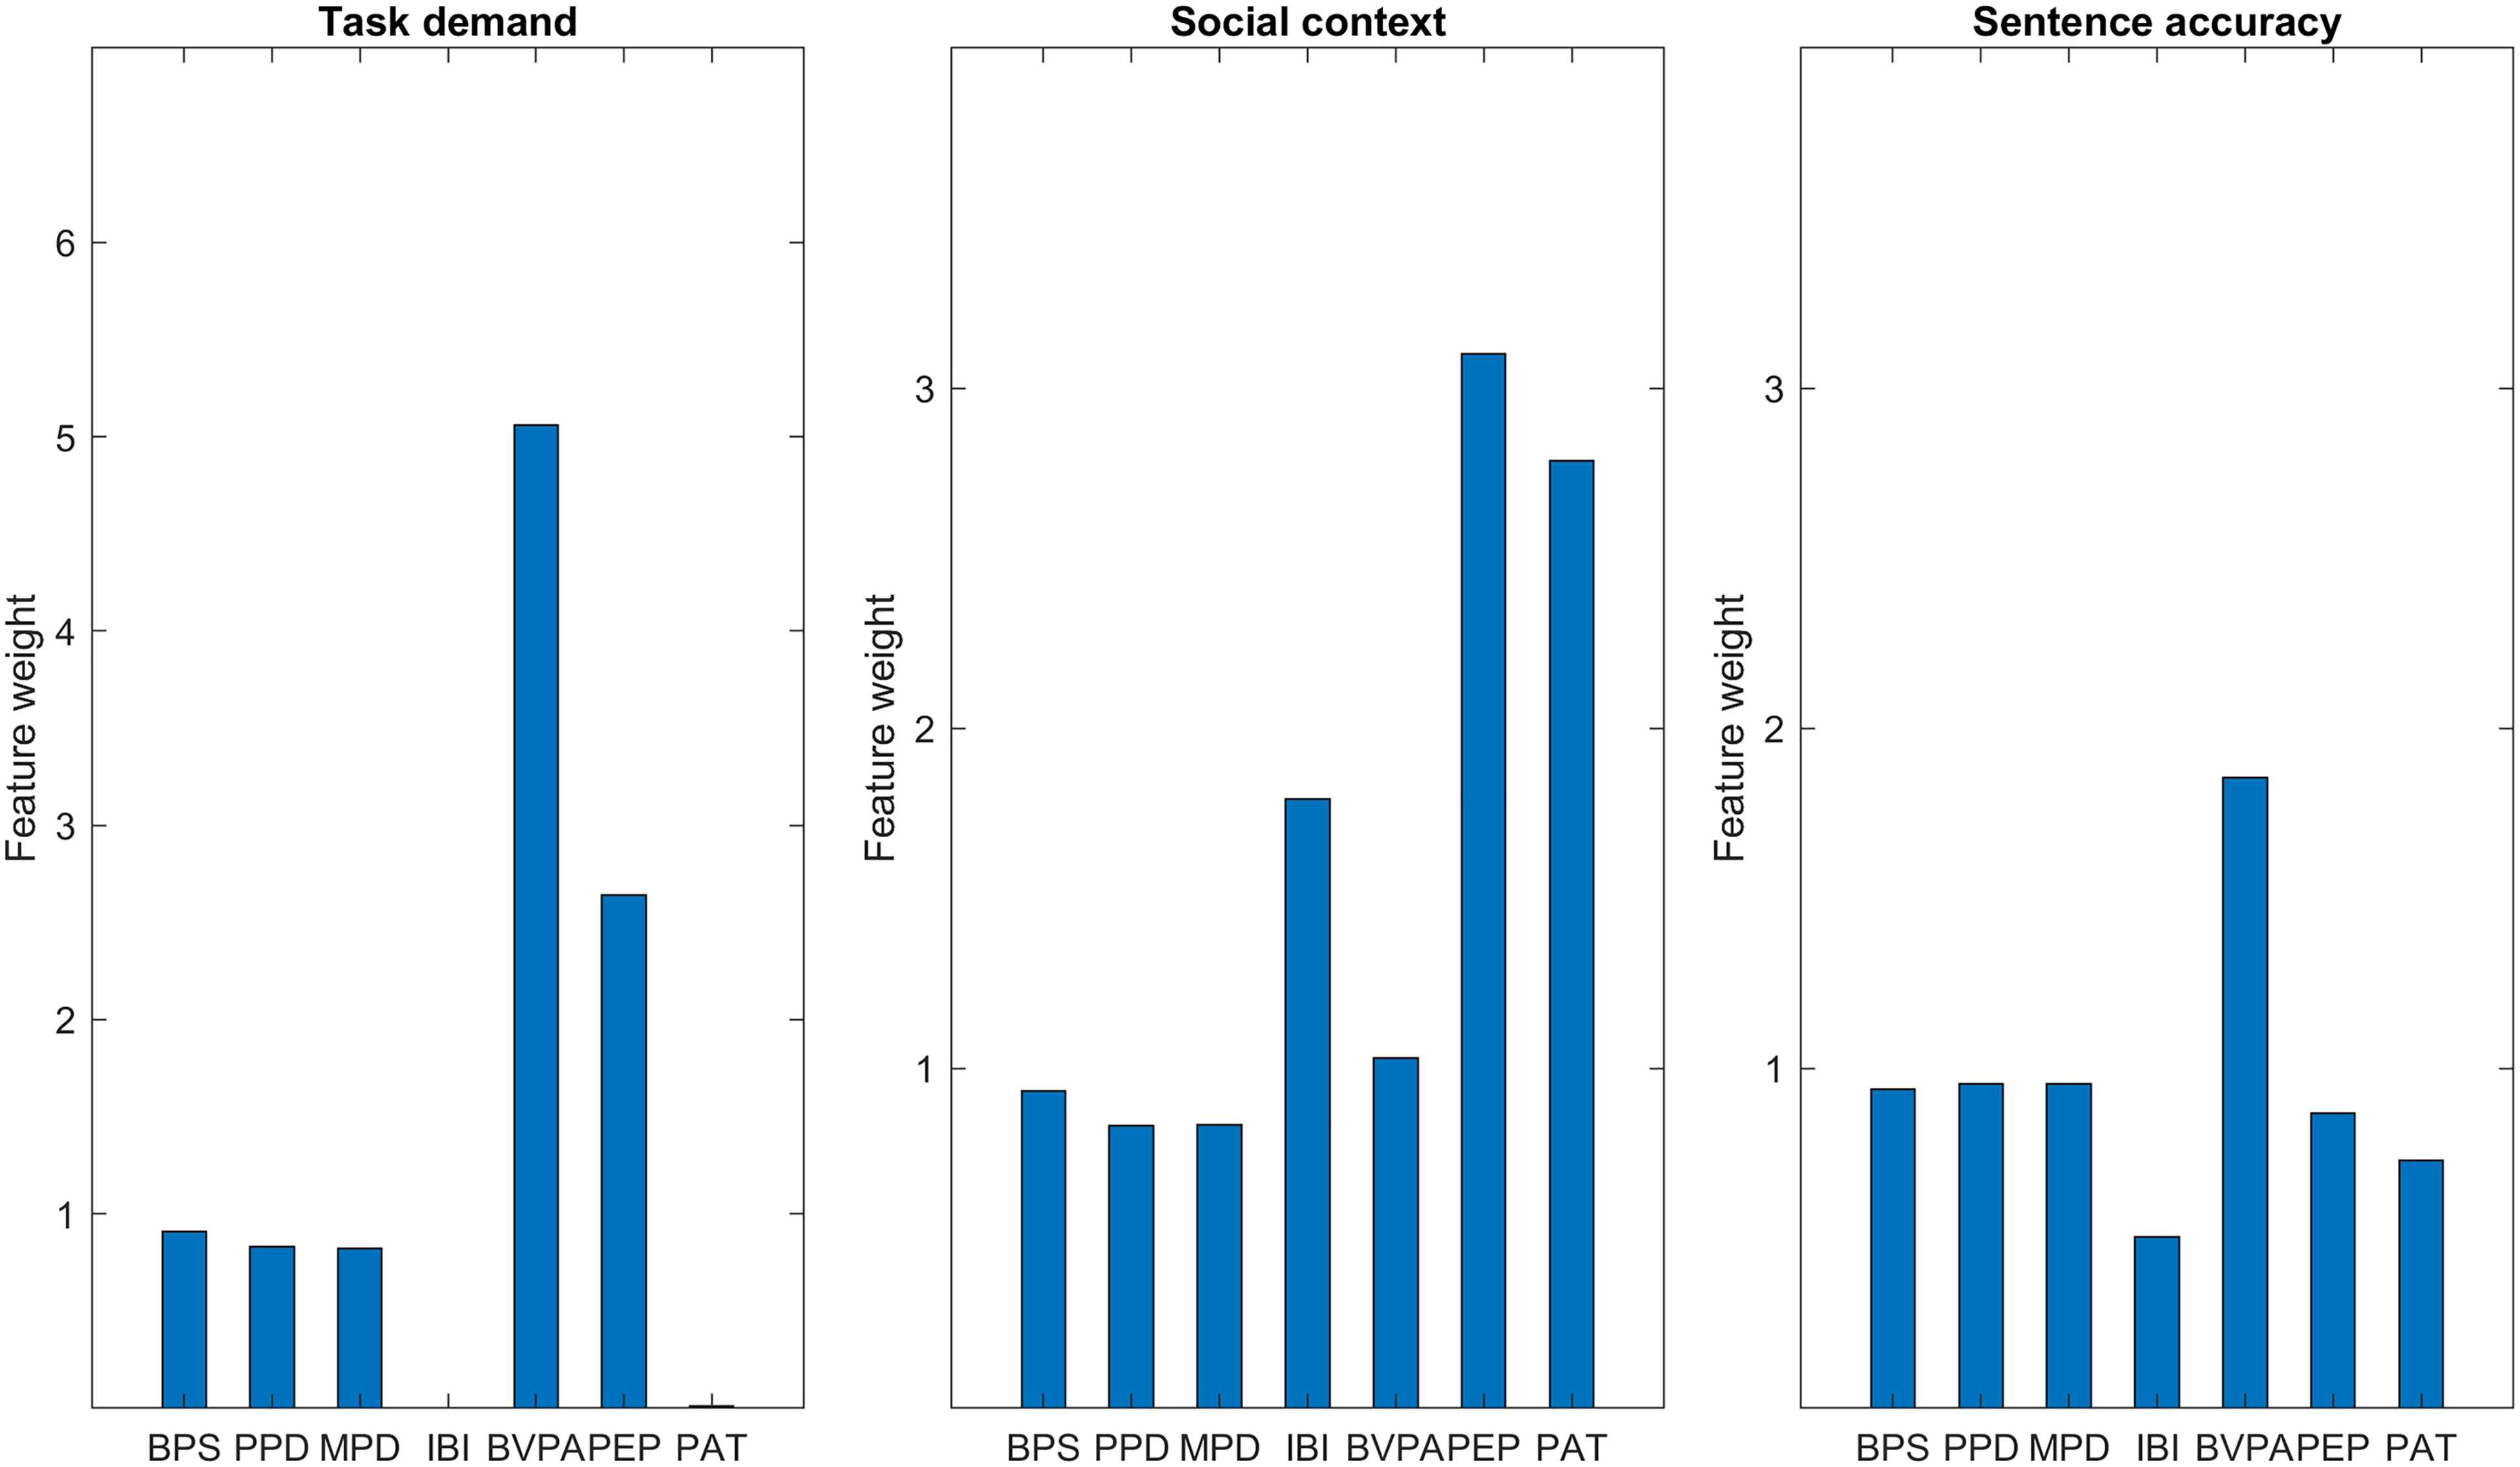
Feature weights obtained by NCA for the 50-fold cross-validated group classifiers predicting task demand (left), social context (middle), and sentence accuracy (right). A feature weight of zero demonstrates that the feature does not contribute, whereas features with a higher weight contribute more. Please note that the left-hand panel has a different y axis scale than the middle and righthand panels. BPS = baseline pupil size; BVPA = blood volume pulse amplitude; IBI = interbeat interval; MPD = mean pupil dilation; NCA = neighborhood component analysis; PAT = pulse arrival time; PEP = pre-ejection period; PPD = peak pupil dilation.
Leave One Subject Out Cross Validation
To ensure that the accuracy levels obtained by the classifiers were not a result of bias in the classifier caused by k-fold cross validation, we conducted leave one subject out cross validation, where all trials from one participant were fully excluded from the training dataset and used exclusively for testing. We repeated this process systematically such that data from all participants were the test dataset on one occasion. Using this validation method, the average performance of each of the classifiers dropped to around chance level (i.e., 50%): average accuracies were 48.3% (SD = 8.7), 50.6% (SD = 18.8), and 52.0% (SD = 11.0) for predicting task demand, social context, and sentence accuracy, respectively. Thus, it is evident that the k-fold cross validation procedure was inflating the performance accuracy of the classifiers, compared to when testing and training were conducted on completely separate participants.
Permutation analyses were conducted on the classifiers validated using leave one subject out cross validation, to allow statistical comparison between the correctly labeled accuracies and permutated classifiers’ accuracies. Figure 6 demonstrates the distributions of accuracy levels for both correctly labeled and permutated classifiers. Means and standard deviations for the permutated classifiers were as follows: 49.4% (SD = 6.3), 46.1% (SD = 9.6), and 48.7% (SD = 8.7) for predicting task demand, social context, and sentence accuracy, respectively. Levene's test revealed equal variances between the correct and permutated classifiers’ accuracy for all three labels. Independent t-tests revealed no significant differences between the correct and permutated classifiers’ accuracy levels for task demand (t(56) = −0.56, p = .58, d = −0.15), social context (t(56) = 1.13, p = .26, d = 0.30), or sentence accuracy (t(56) = 1.28, p = .21, d = 0.36). This suggests that the correctly labeled classifiers have no predictive power.
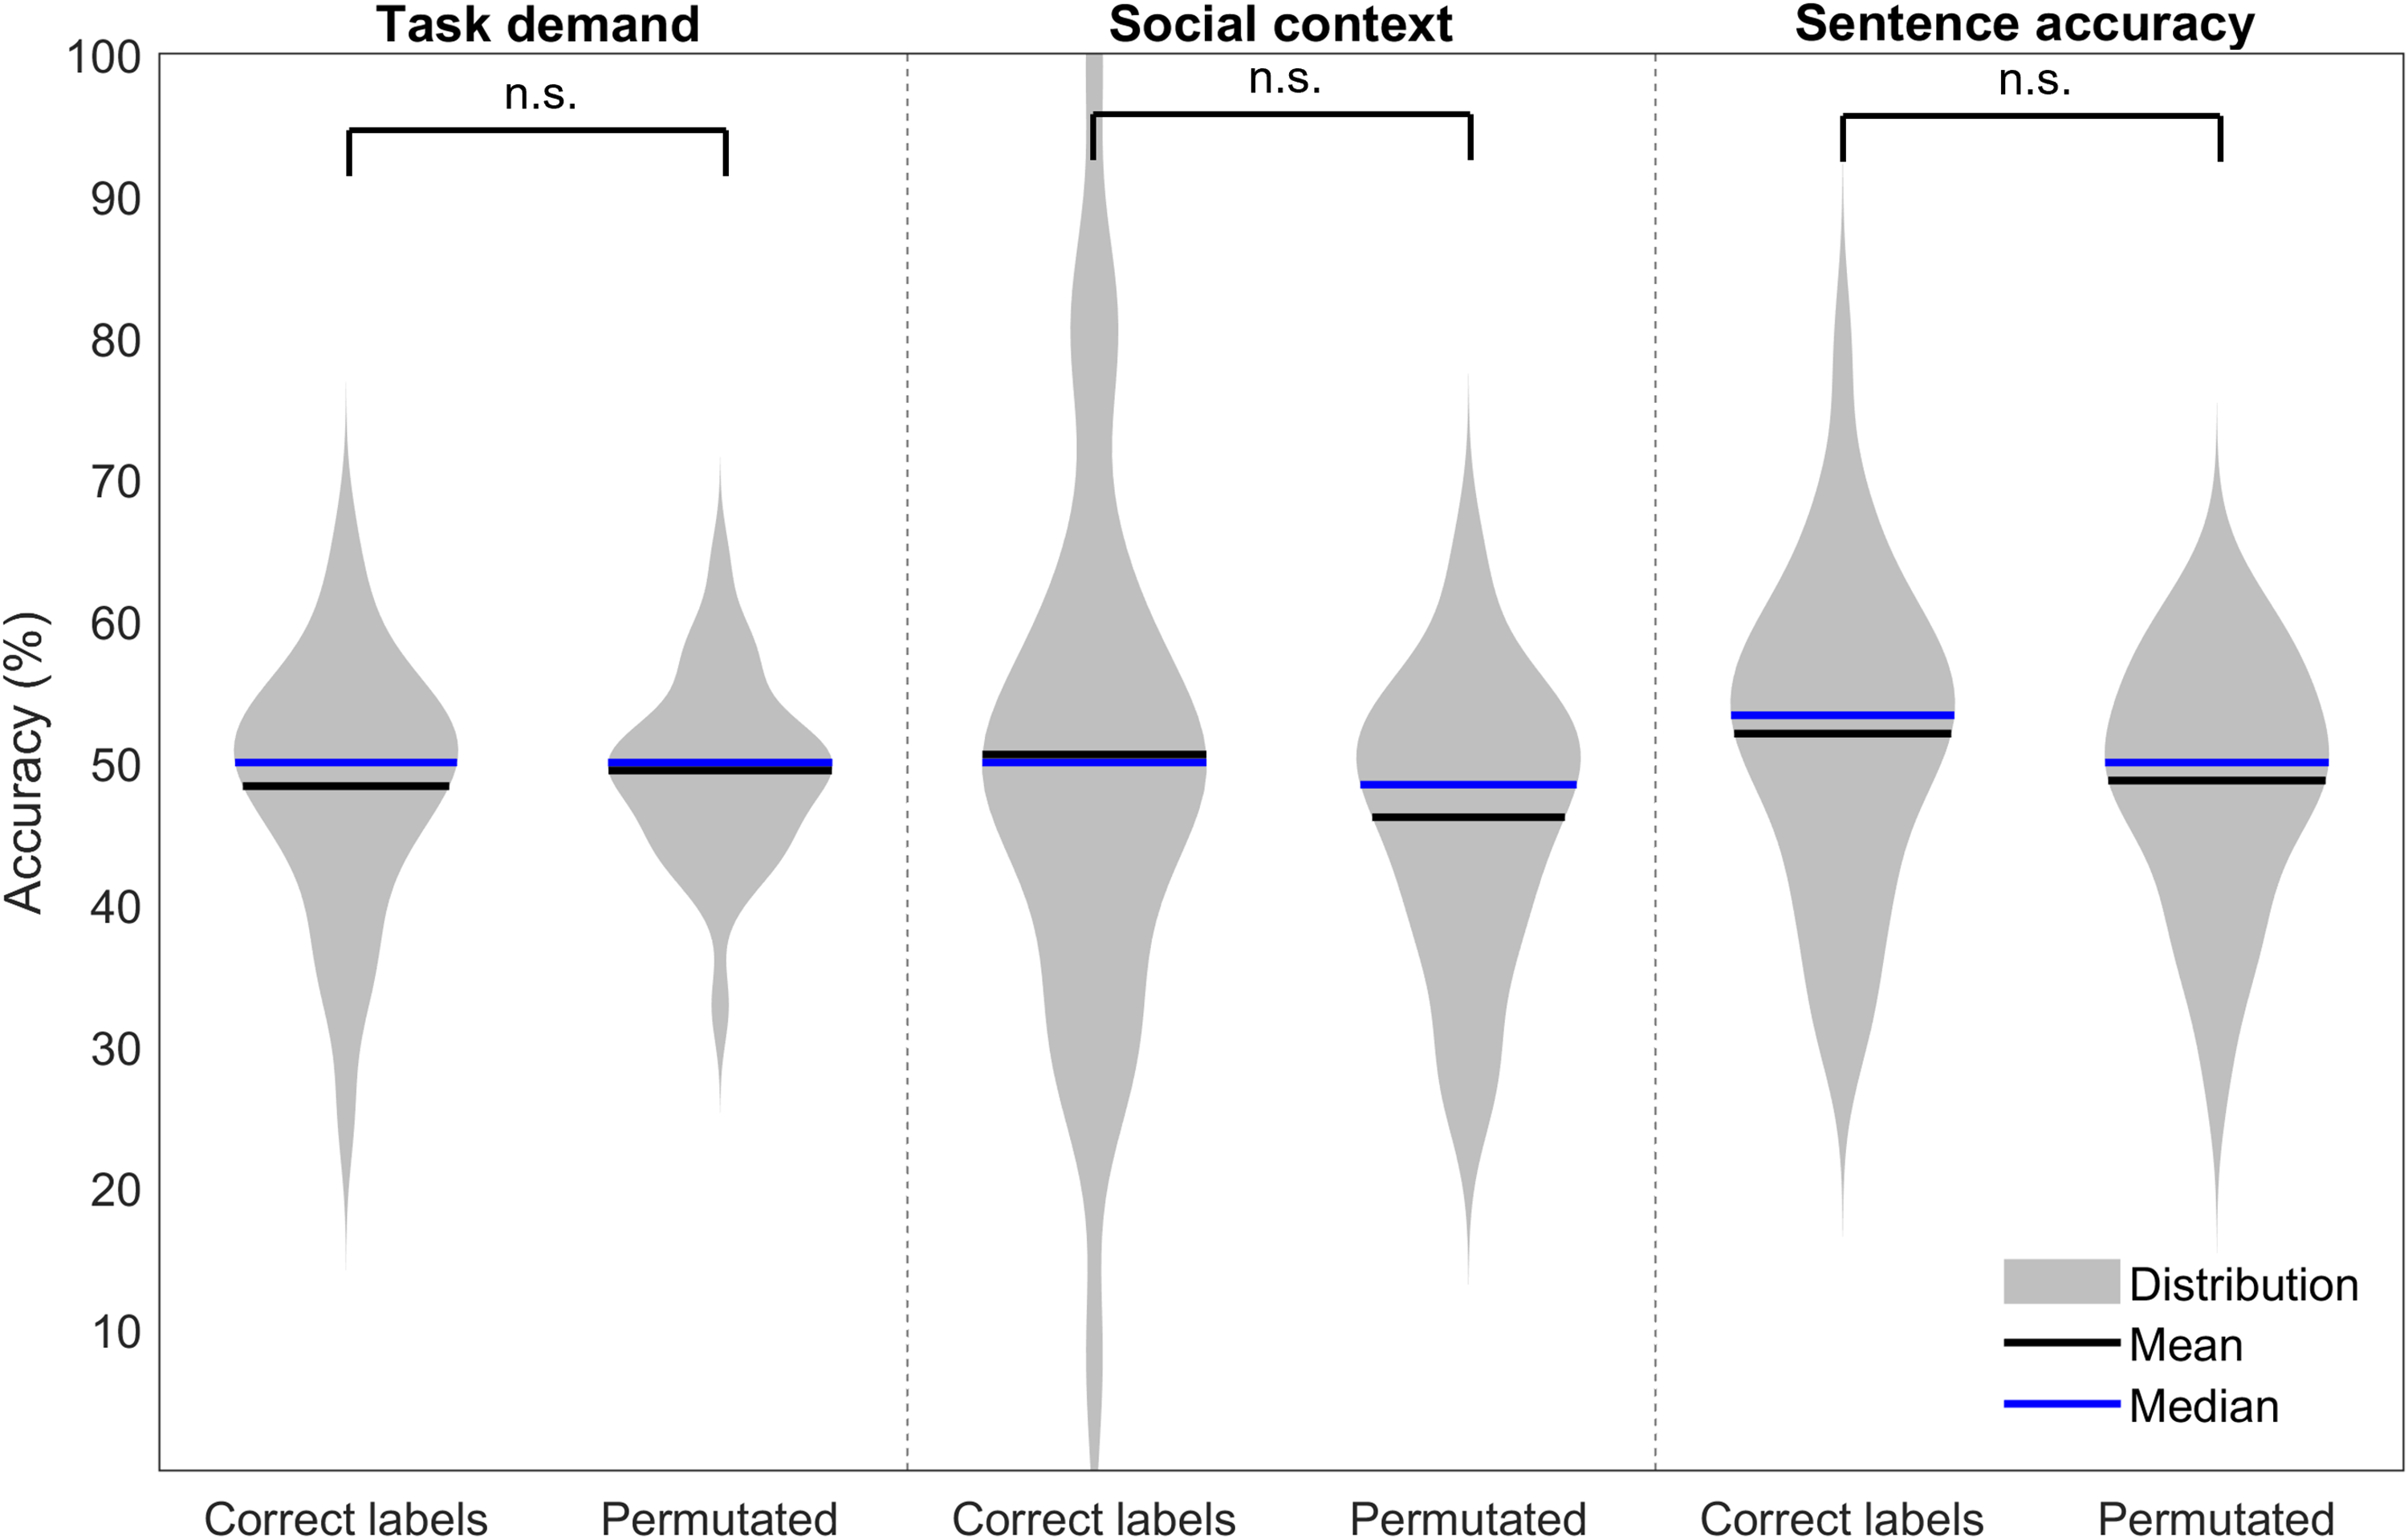
Violin plots demonstrating distributions of correct label and permutated label model accuracies for group classifiers validated with leave one subject out cross validation. Panels demonstrate task demand (left), social context (middle) and sentence accuracy (right). A single asterisk represents a significant difference between the correctly labeled and permutation accuracies at the level of p < .05. n.s. = not significant.
Individual Classifiers
Training separate classifiers for each participant allows classifiers to be personalized or calibrated to the individual. Five participants were excluded from the individual classification analysis due to missing data for one or more of the features. The results of the remaining 24 participants’ individual classifiers are presented in Tables 2, 3, and 4. Generally, the accuracy was higher for individual classifiers than for the group classification, which was expected. Average accuracy levels were 75.7% (SD = 9.9) for task demand, 89.7% (SD = 12.6) for social context and 68.2% (SD = 10.8) for sentence accuracy. Similar to the trend demonstrated by the k-fold cross-validated group level classifiers, average accuracy values for the individual classifiers were higher when predicting social context, compared to the task demand and sentence accuracy.
Average Results of 29 Group k-NN Classifiers Using Leave One Subject Out Cross Validation (Separate Test and Training Participants).

Results of Individual k-NNs Predicting Task Demand.

BVPA = blood volume pulse amplitude; IBI = interbeat interval; PAT = pulse arrival time.
Results of Individual k-NNs Predicting Social Context.

BVPA = blood volume pulse amplitude; IBI = interbeat interval; PAT = pulse arrival time; PPD = peak pupil dilation.
Permutation analysis was conducted to verify whether the individual classifiers were operating at above chance accuracy levels (demonstrated by asterisks (p < .01) and plus signs (p < .05) in Figure 7). The classifiers for 15, 21, or two individuals performed above chance in predicting task demand, social context, and sentence accuracy, respectively. For the social context classifiers especially, the high-performance suggests there is a true relationship between the social context and the physiological data in most individuals. In fact, two of the individual classifiers were able to predict social context with an accuracy of 100%. This suggests that the trained classifiers for these two participants were perfectly able to distinguish between the data in the alone and observed conditions. In contrast, one of the classifiers predicting sentence accuracy never predicted a positive outcome (correct response) and therefore had no sensitivity.
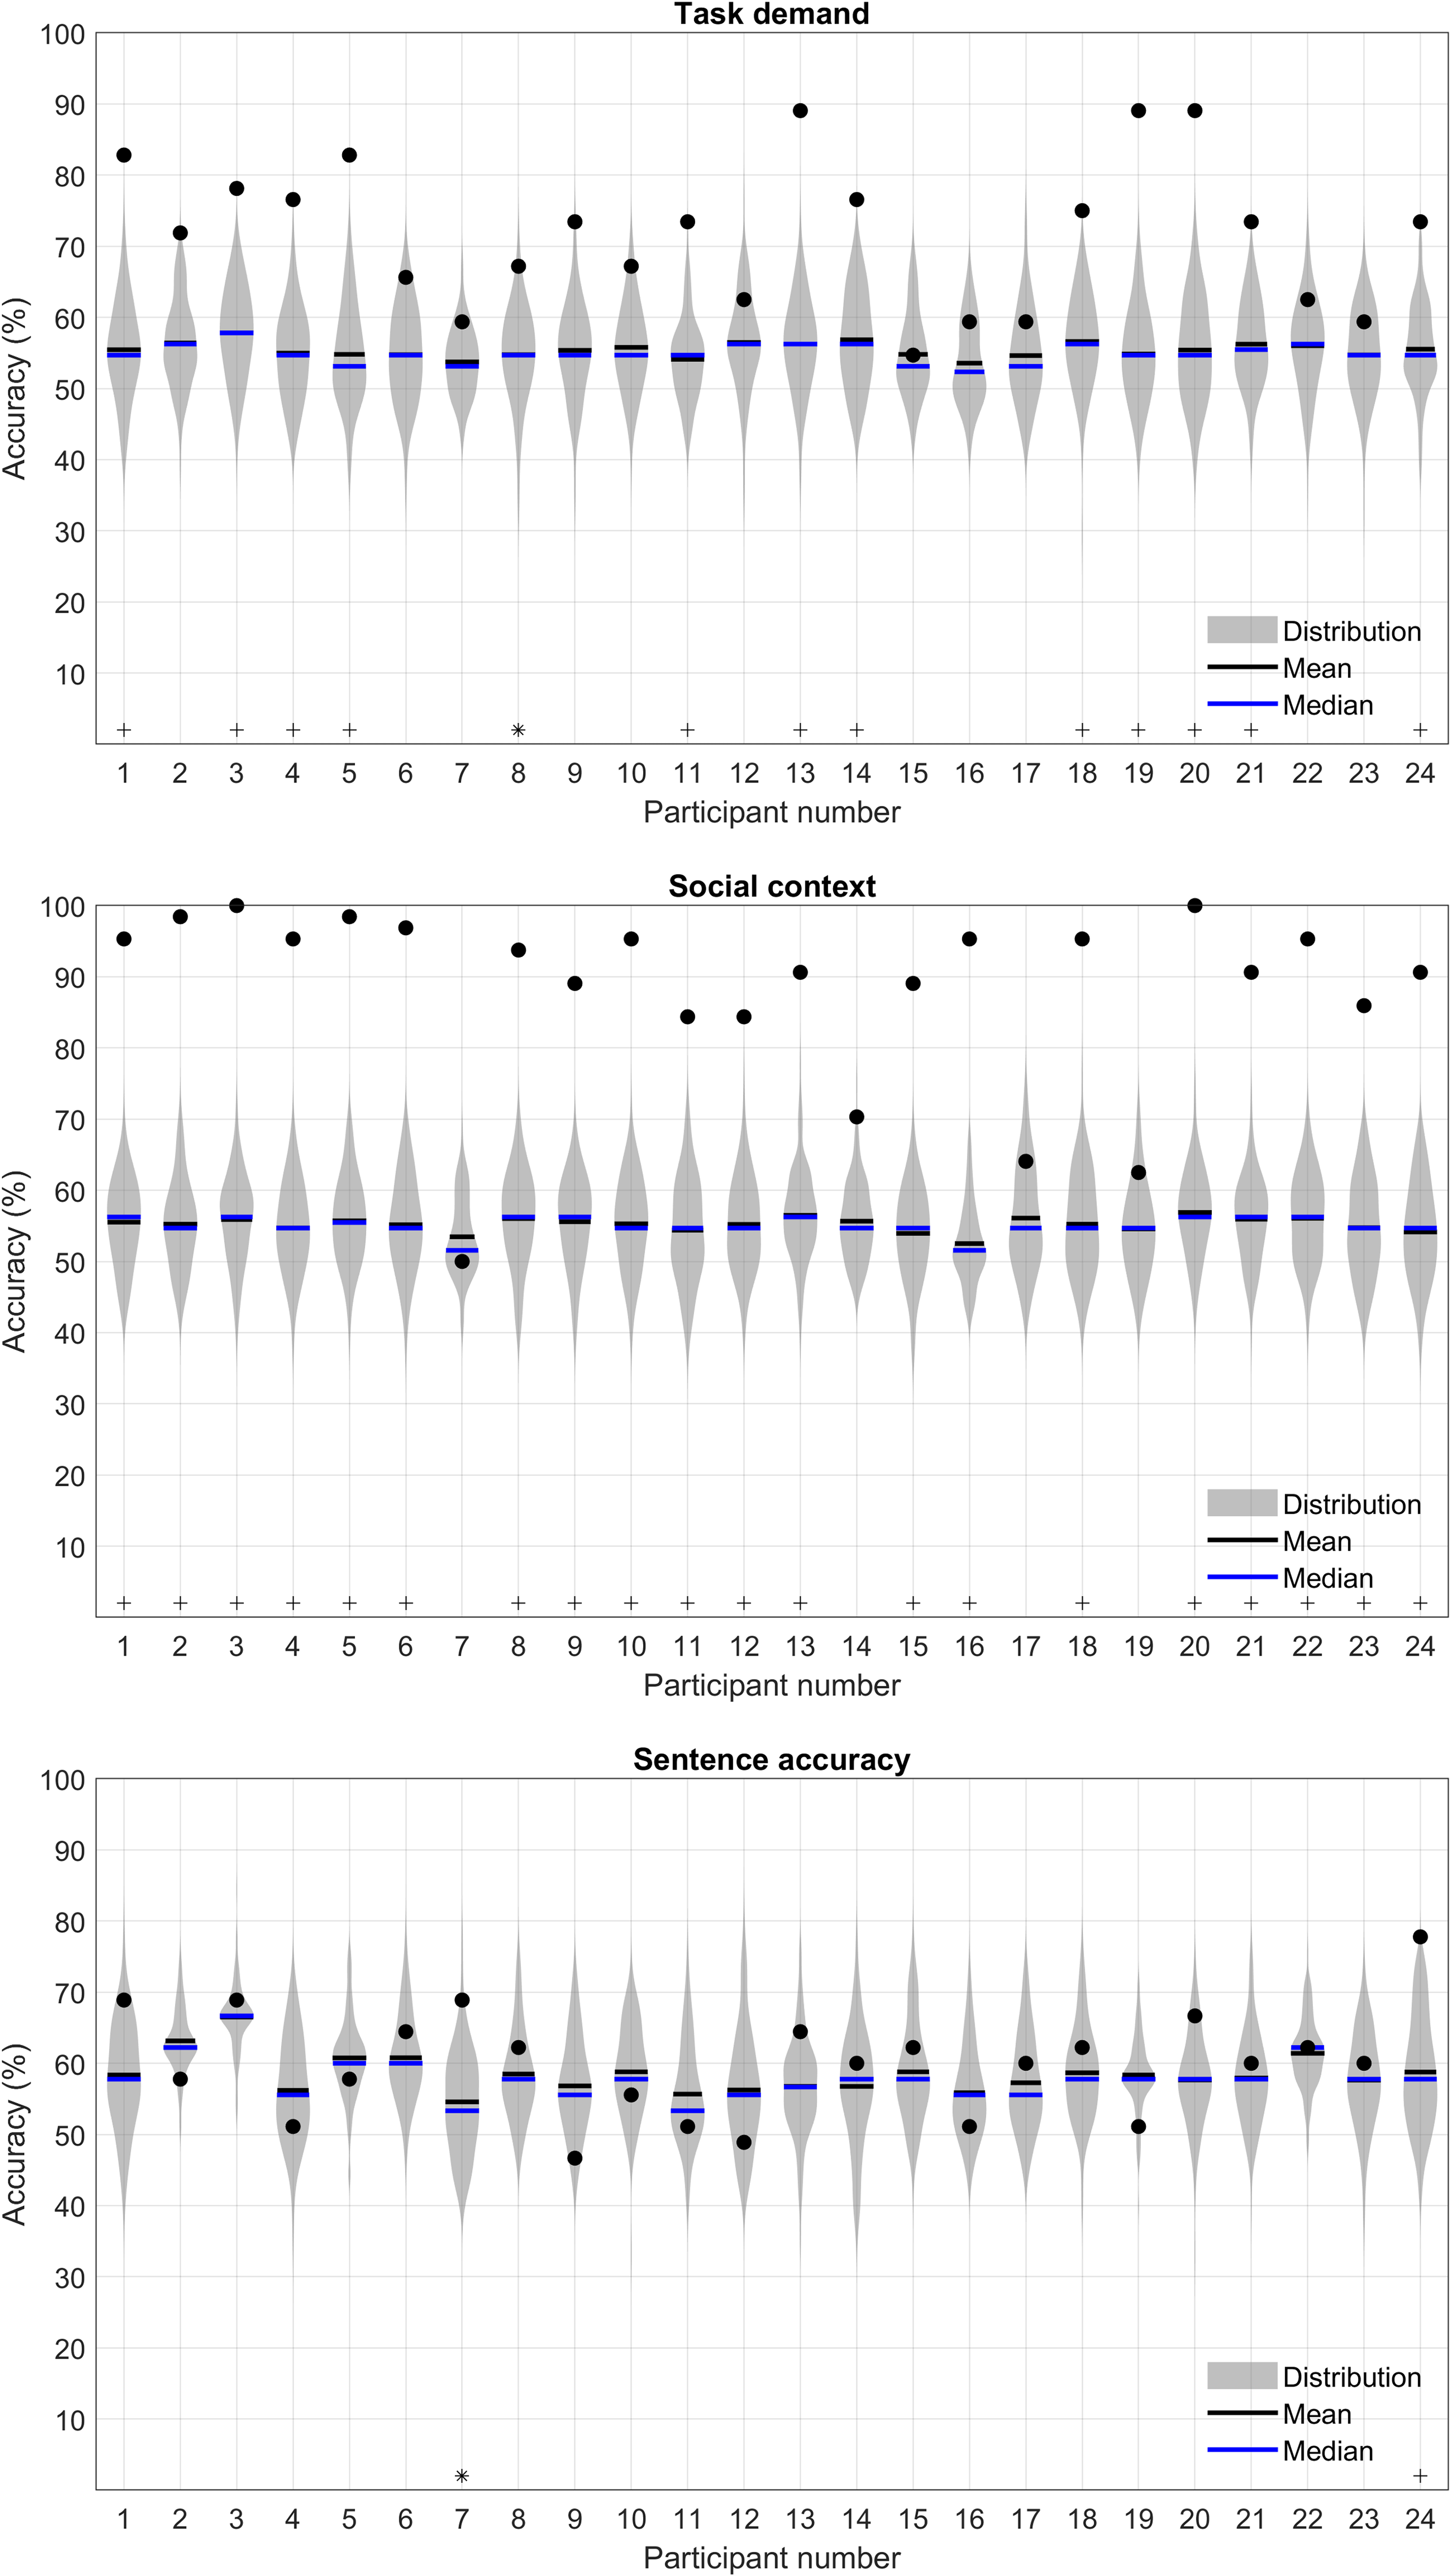
Violin plots demonstrating permutation accuracy distributions for individual classifiers. The upper panel reflects task demand accuracies, the middle panel reflects social context and the lower panel, sentence accuracy. Black filled dots represent the model accuracy using correct labeling (i.e., the original individual classifiers). Significant deviations of the correctly labeled classifier from the null distribution are demonstrated by asterisks at p < .05 and plus signs at p < .01.
The results of NCA for the individual classifiers are demonstrated in Figure 8. Similar to the pattern observed for the group level classifiers, the pupil features appear to have a small, but consistent contribution to the individual classifiers. Of the cardiovascular features, BVPA has a notable contribution to each of the different classifiers. This is also demonstrated in Tables 3, 4, and 5: BVPA was most frequently the greatest contributor to the classifiers. The other cardiovascular features demonstrate more variability in their contributions. For example, IBI was an important feature for the social context classifiers yet provided only a small contribution to the task demand classifiers.
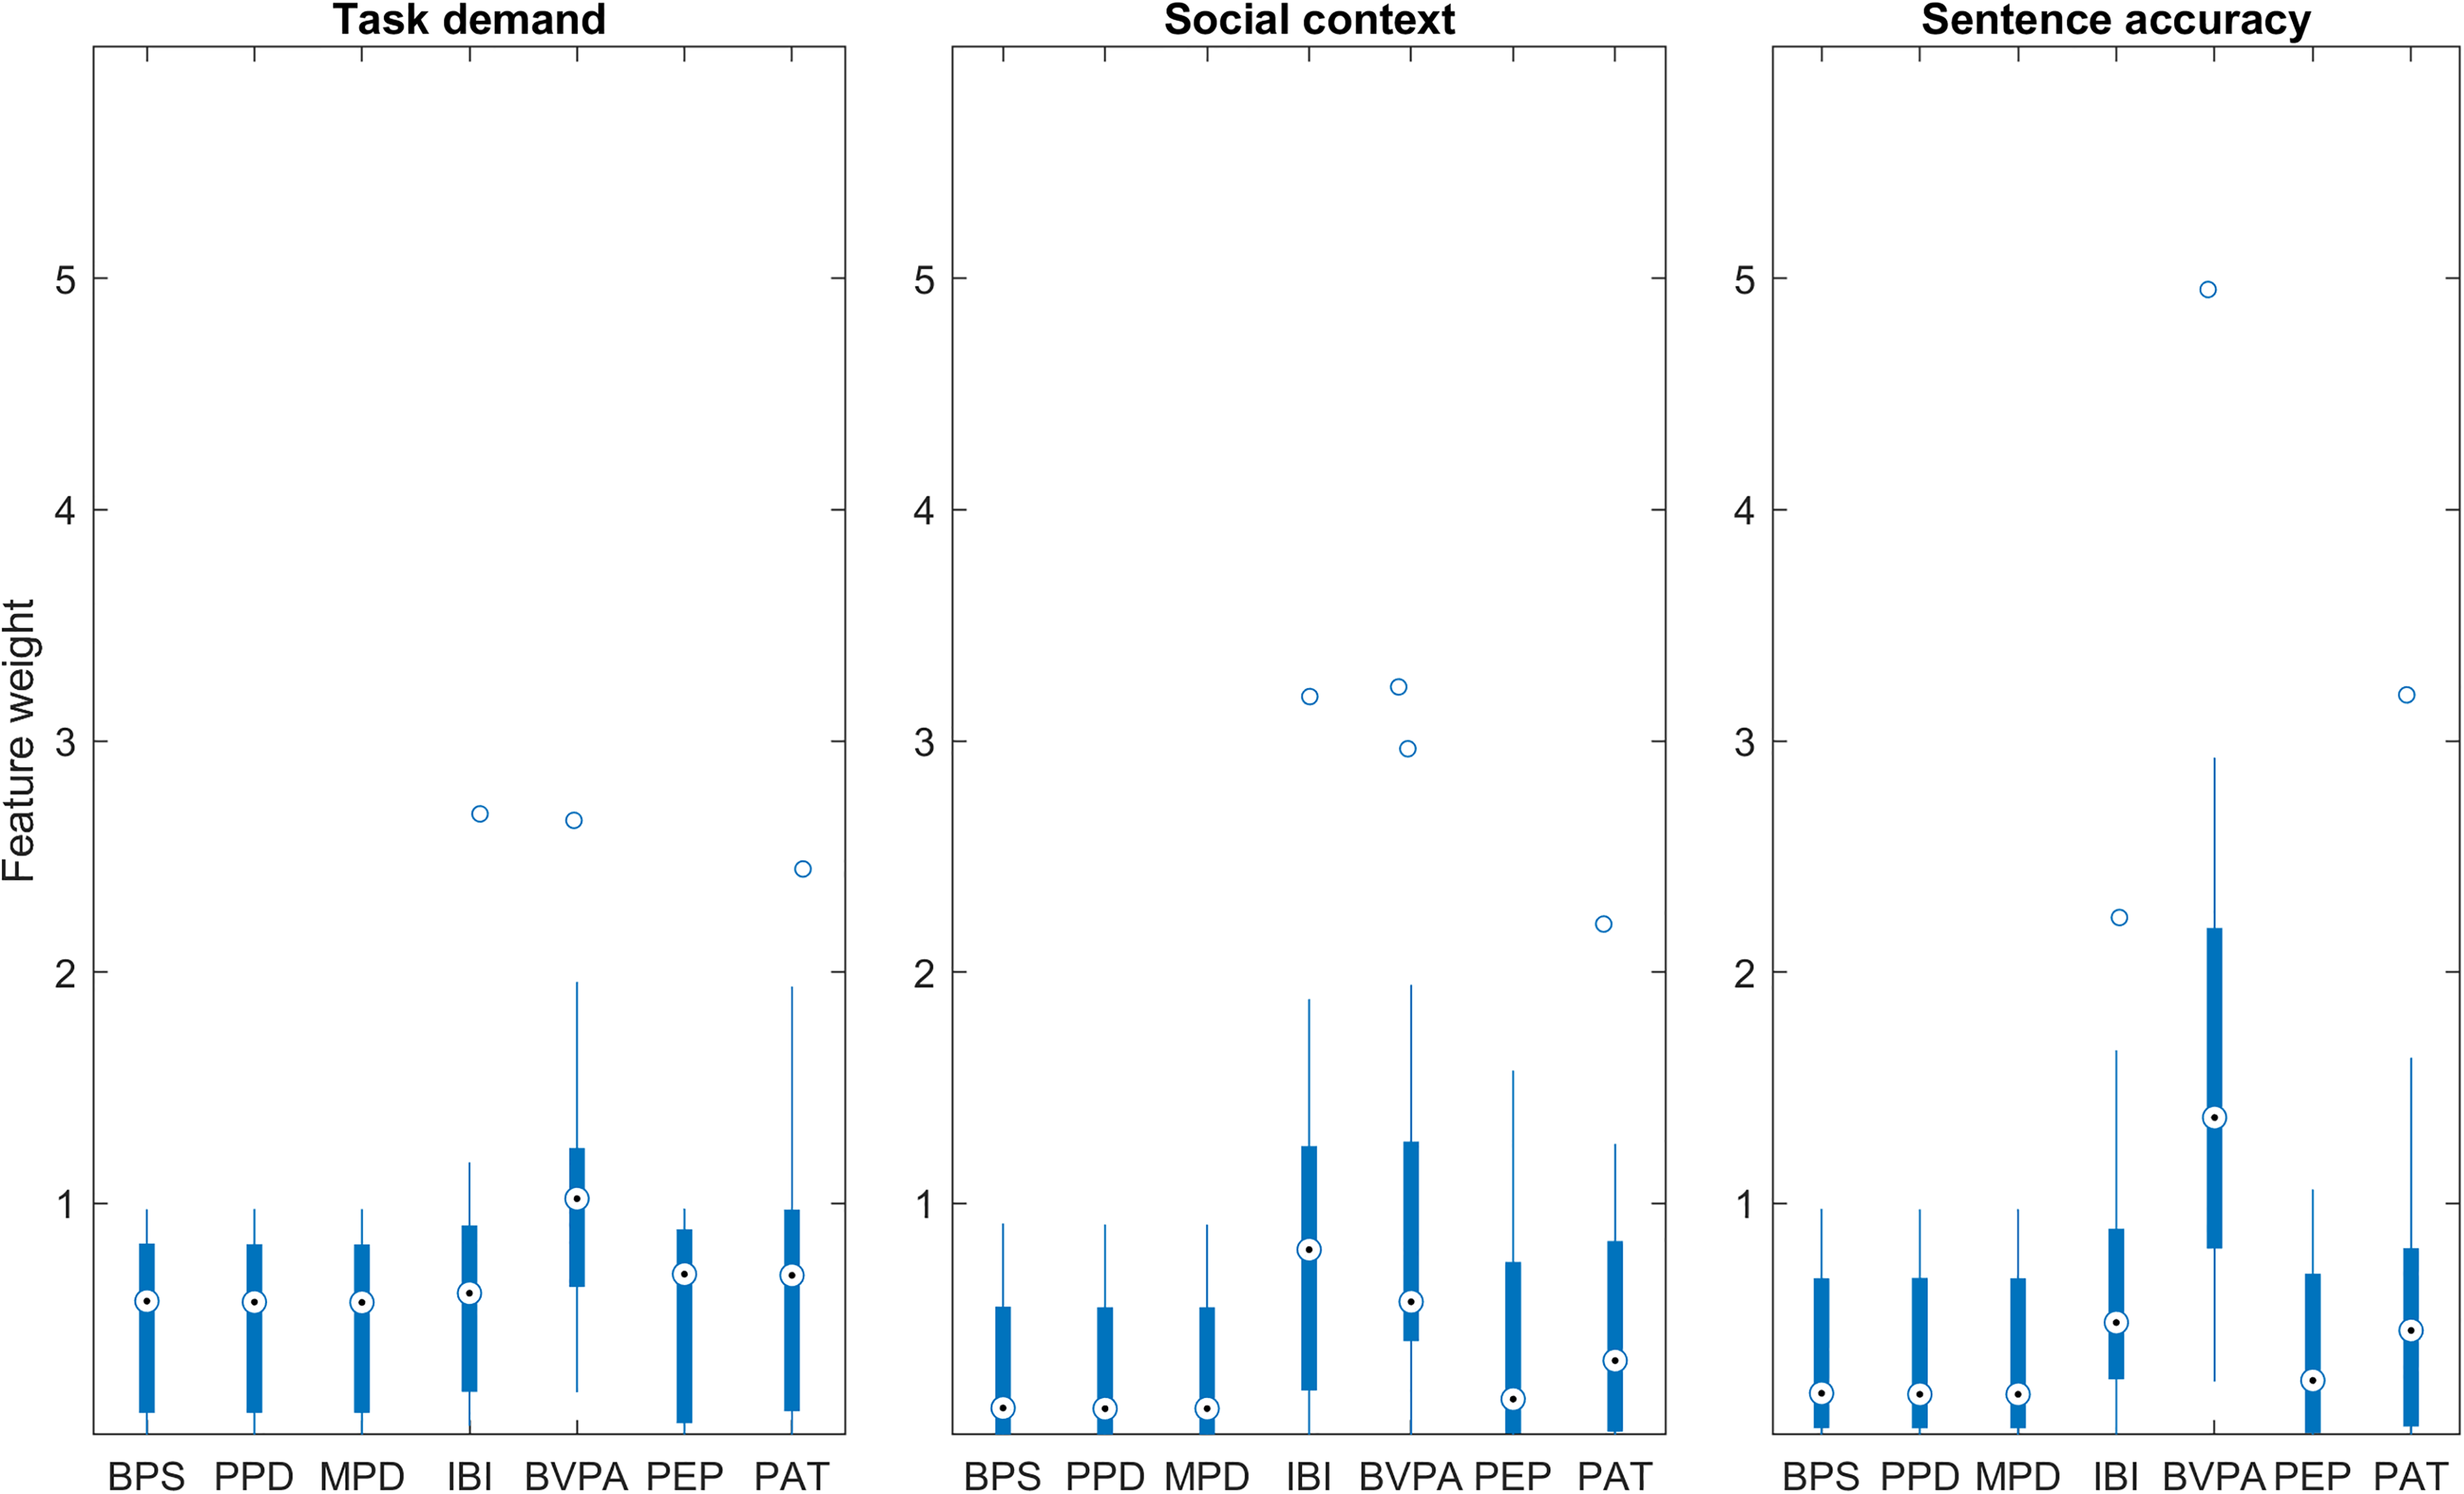
Box plots demonstrating feature weights obtained by NCA for individual classifiers trained to predict task demand (left), social context (middle), and sentence accuracy (right). BPS = baseline pupil size; BVPA = blood volume pulse amplitude; IBI = interbeat interval; MPD = mean pupil dilation; NCA = neighborhood component analysis; PAT = pulse arrival time; PEP = pre-ejection period; PPD = peak pupil dilation.
Results of Individual k-NNs Predicting Sentence Accuracy.

Note that precision, sensitivity, and F1 score are N/A for one participant because the model did not correctly predict any true cases (i.e., there were no true positives). BVPA = blood volume pulse amplitude; IBI = interbeat interval; N/A = not applicable; PAT = pulse arrival time.
Discussion
The current study combined pupil and cardiovascular features from individuals with hearing loss to predict task demand, social context, and sentence accuracy during a speech perception task. In our view, this study boasts three novel aspects. The first pertains to the inclusion of group and individual classifiers, the use of which are relatively unexplored in the listening effort literature, the second, to the incorporation of a social context manipulation in our study design and the third, to the combination of pupil and cardiovascular features at the trial level.
Validation and Generalizability of Classifiers
An important finding from this work was the disparity between classifier performance depending on whether the classifiers were trained on group data or individual data. At the group level, k-fold cross validation (where data from the same participant may have occurred in both the training and test datasets) resulted in higher performance, whereas leave one subject out cross validation (where data from one participant was held out from training and used exclusively for testing) resulted in lower performance. This pattern suggests that the group classifiers generalized poorly to novel participants’ data, a finding that is attributable to the nature of k-NN classifiers. The k-NN classifiers assign the label of a new data point based upon the neighbors nearest to it (in this case, a single nearest neighbor for the task demand and social context classifiers, and 14 nearest neighbors for the sentence accuracy classifier). Therefore, if the classifier has previously been exposed to data from a participant during training, it is better able to assign the same label to a similar data point during testing. Lower classification accuracies may also have resulted from sparsely sampled data in the classes.
The poor generalizability of these group level classifiers suggests that the association between the to-be predicted variable and the physiological response differed between individuals. When classifiers were trained on the individual participants’ data (i.e., within participant classifiers), performance improved (particularly for predicting task demand and social context). This suggests that within-subject variability was considerably smaller than between-subject variability. A similar pattern has also been demonstrated in other studies using physiological data to train classifiers to predict psychological states (Osotsi et al., 2020). The superior performance of individualized classifiers compared to group level classifiers ultimately has implications for future applications and technology incorporating these measures (discussed in more detail in the Future Applications section of the Discussion).
Predicting Task Demand, Social Context, and Sentence Accuracy
The best performance levels were obtained by the k-NN classifiers trained to predict social context, that is, whether the trial reflected an alone or observed condition. The average performance of the individual classifiers was high (89.7%, SD = 12.6) and for all but three individuals, these classifiers were able to predict social context at an above chance accuracy level. The next best performance levels were obtained by the classifiers predicting task demand, that is, whether the trial was presented at SNR50% or SNR80%. Average performance of the individual classifiers was 71.7% (SD = 10.2), with over half of the individual classifiers operating above chance level. Finally, the poorest performance was demonstrated by the sentence accuracy classifiers, which were trained to predict whether the trial was repeated correctly or incorrectly. The average individual classifier performance was 60.0% (SD = 13.1), and just two out of 24 of the individual classifiers were operating at an above chance level.
The timescale of the social context manipulation compared to that of task demand and sentence accuracy may have contributed to the superior classification performance: the observers were present continually throughout the whole block of sentences, which one might expect to produce a consistent physiological response. Whereas the task demand and sentence accuracy timescales were comparatively fluctuating in nature: the stimulus presentation itself only occurred for a short period (3 s of noise, then target sentence presentation plus noise, followed by 3 s of noise), before the participants repeated back what they heard (thus having a chance to score correctly or incorrectly).
Importantly, during the data window selected for our analysis, the participant had yet to repeat the sentence and may therefore not have been aware that they would make an error in sentence repetition. Also, physiological responses caused by sentence accuracy may have impacted the period after the window selected for analysis. For instance, Spruit et al. (2018) have shown decreases in IBI and PEP posterror compared to postcorrect Flanker and switch trials (Spruit et al., 2018). Indeed, the sentence accuracy may have even affected subsequent trials, rather than the present trial. This likely contributed to the relatively poor performance of the classifiers predicting sentence accuracy, compared to the other two classifiers.
Another contributing factor may be that for the purposes of this analysis we considered sentence accuracy as binary in nature (i.e., sentence repeated completely correctly or not), yet, in reality it is more continuous. We also assumed that sentence accuracy errors in the SNR50% condition and SNR80% conditions produced a similar response, where they may not have done. A final, potentially relevant factor is the smaller dataset used to predict sentence accuracy compared to the datasets used to predict social context and task demand.
Feature Importance
The seven features included in our classifiers differ in their autonomic nervous system origins. Pupil size, IBI and PAT are thought to reflect mixed contributions from both the SNS and PNS system branches, whereas PEP and BVPA reflect mostly SNS activity (Ahmed et al., 1972; Czarnek et al., 2021; Iani et al., 2004; Malik et al., 1996; Newlin & Levenson, 1979; Nitzan et al., 1998; Zekveld et al., 2018). The features contributing most to our classifiers differed depending on which response variable was being predicted. The strongest contributors to the group level task demand classifier were BVPA, followed by PEP (both SNS), with no contribution from IBI and PAT (mixed). The importance of BVPA in this classifier corroborates the finding of Francis et al. (2016) who found that significant changes in BVPA, but not IBI, were elicited by varying the acoustic parameters (presenting two unmasked conditions, natural speech or synthetic speech, and two masked conditions, speech-shaped noise or two-talker babble). BVPA was also an important feature in the individual classifiers, contributing to classifiers predicting task demand, social context, and sentence accuracy (see Figure 8 and Tables 2, 3, and 4). The importance of this feature may be due to its SNS origins.
The strongest contributors to the social context classifier at the group level were PEP (SNS), PAT (mixed) and IBI (mixed origin). This pattern was not directly reflected in the individual classifiers. Instead, BVPA (SNS) and IBI (mixed origin) were the most prominent features. Finally, the strongest contributor to the sentence accuracy classifier at the group and individual level was BVPA (SNS), with all other features contributing to a lesser and similar degree. The differences between the group level and individual level NCA reinforces the need for individual classifiers: a one size fits all approach is unsuitable as different people demonstrate different associations between the predicted variables and physiological responses during the same experiment.
When reviewing the classifiers’ feature weights (Figures 5 and 8), one or more of the cardiovascular features generally outperformed the pupil features. The aforementioned variability in autonomic origins of the cardiovascular features may be a contributing factor. It is also likely that the pupil features contain more redundant information because they are closely related to one another, for example, the PPD and MPD both reflect the dilation of the pupil and are both normalized to the BPS (Winn et al., 2018). Correlation between features may have negatively impacted the performance of the classifiers, by increasing redundancy, computational cost and potentially affecting the distance metric (Alin, 2010; Hasan et al., 2021; Yigit, 2013). On the other hand, the cardiovascular measures are not baseline corrected and reflect responses from different physiological systems—IBI and PEP are time intervals extracted from the heart cycle, PAT reflects a time interval that depends upon the heart cycle and the vasculature and finally, BVPA is an amplitude measure that reflects vascular changes. Though the range of the cardiovascular measures is likely to be greater than that of the pupil metrics, we applied standardization during the classification procedure to minimize this effect.
The predictive capacity of the pupil features may also have been reduced by a potential confound due to the timing of blinks with respect to sentence presentation. During preprocessing, it was confirmed that the frequency of blinks did not vary between experimental conditions. However, the timing of blinks with respect to sentence presentation was not explicitly explored during the analysis. The timing of blinks is important to consider as it has been demonstrated that blinks can have an impact on the pupil size during listening (Holtze et al., n.d.; Knapen et al., 2016; Yoo et al., 2021). Though a deeper analysis of the timing of blinks was beyond the scope of this work, it could be important to consider in future work.
To further explore if there was any benefit of including both cardiovascular and pupil features together, we trained k-NN classifiers (k-fold cross validation, method 1a in Figure 2) using the cardiovascular and pupil features separately. The accuracy obtained when including only the four cardiovascular features was similar to the original classifiers: 66.2% for predicting task demand, 82.3% for social context, 53.9% for sentence accuracy. In comparison, the accuracy obtained when including only the three pupil features was lower: 54.4% for predicting task demand, 57.6% for social context, and 53.9% for sentence accuracy. This suggests that there was no additional benefit of including the pupil measures in these classifiers.
Future Applications
We have demonstrated that it is possible to combine different trial-level pupil and cardiovascular features to predict various aspects of a listening situation encountered in the laboratory. Of particular importance is the finding that individual classifiers demonstrated superior prediction abilities over group level classifiers. The real-life generalizability of our work is in part limited by the binary nature of the classifiers presented here. Indeed, in most situations, listening demand and performance are not “on” or “off” but instead operate on a scale. Similarly, social context is not a binary phenomenon in daily situations. Moreover, the present analyses considered each of these response variables independently of one another and did not account for potential interactions between them. Despite this, we believe this study provides a good first step in demonstrating that classification techniques may be useful in this context.
This study presents a step toward using physiological features to predict aspects of listening that are applicable to real life, for example, different SNRs and social contexts. In the future, such a tool may prove beneficial in audiology clinics, in a diagnostic capacity or for testing hearing devices. It has been suggested that future ear level devices, like hearing aids, may even measure from the user's physiology in situ (Goverdovsky et al., 2017). In this study, the predictive power of models trained on the individual was relatively high, which is promising for use in personalized hearing devices. With technology moving in such a direction, an important take home message from this study is that the physiological response to social context was predicted with higher accuracy levels than the task demand or sentence accuracy level. More work is needed to select which feature combinations are optimal, to reduce redundancy in the classifiers and ultimately find features that are better able to predict task demand and sentence accuracy.
Footnotes
Acknowledgments
The authors are very grateful to Lorenz Fiedler and Tirdad Seifi Ala for interesting and helpful discussions regarding the analysis.
Declaration of Conflicting Interests
The authors declared no potential conflicts of interest with respect to the research, authorship, and/or publication of this article.
Funding
The authors disclosed receipt of the following financial support for the research, authorship, and/or publication of this article: GS received support from NIHR Manchester Biomedical Research Centre, and the project received funding from the European Union's Horizon 2020 research and innovation programme under the Marie-Sklodowska-Curie grant agreement No 765329.