
Abstract
An objective method for assessing speech audibility is essential to evaluate hearing aid benefit in children who are unable to participate in hearing tests. With consonant-vowel syllables, brainstem-dominant responses elicited at the voice fundamental frequency have proven successful for assessing audibility. This study aimed to harness the neural activity elicited by the slow envelope of the same repetitive consonant-vowel syllables to assess audibility. In adults and children with normal hearing and children with hearing loss wearing hearing aids, neural activity elicited by the stimulus /su∫i/ or /sa∫i/ presented at 55–75 dB SPL was analyzed using the temporal response function approach. No-stimulus runs or very low stimulus level (15 dB SPL) were used to simulate inaudible conditions in adults and children with normal hearing. Both groups of children demonstrated higher response amplitudes relative to adults. Detectability (sensitivity; true positive rate) ranged between 80.1 and 100%, and did not vary by group or stimulus level but varied by stimulus, with /sa∫i/ achieving 100% detectability at 65 dB SPL. The average minimum time needed to detect a response ranged between 3.7 and 6.4 min across stimuli and listener groups, with the shortest times recorded for stimulus /sa∫i/ and in children with hearing loss. Specificity was >94.9%. Responses to the slow envelope of non-meaningful consonant-vowel syllables can be used to ascertain audible vs. inaudible speech with sufficient accuracy within clinically feasible test times. Such responses can increase the clinical usefulness of existing objective approaches to evaluate hearing aid benefit.
Keywords
Introduction
Universal newborn hearing screening has led to hearing aid fittings by 2–3 months of age in children born with hearing loss (Joint Committee of Infant Hearing, 2019). Since children are unable to participate reliably in clinical hearing tests until 8–10 months of age, objective methods, both electroencephalography (EEG) and spectroscopy-based (NIRS), have been developed for evaluating access to speech with/without hearing aids. The two main EEG-based approaches are speech-evoked cortical auditory evoked potentials (CAEP; Purdy et al., 2005) and envelope following responses (EFR; Easwar et al., 2015b), also commonly referred to as the frequency following response. The present study focuses on the EFR approach—an approach that has so far utilized brainstem-dominant neural activity phase-locked to the fundamental frequency of the voice (∼90–100 Hz) in consonant-vowel syllables to infer audibility of speech. Here, we aimed to assess whether the same consonant-vowel syllables used to elicit brainstem-dominant EFRs can successfully assess audibility using the low frequency neural activity tracking its slow envelope. In this study, we call this response the cortical EFR to acknowledge the dominant cortical contributions at low frequencies (Ahissar et al., 2001; Aiken & Picton, 2008).
The syllabic-rate envelope ranges from ∼2 to ∼8 Hz in conversational speech (Rosen, 1992). Cortical EFRs (also commonly referred to as neural tracking or cortical entrainment) have been evaluated predominantly for uncovering mechanisms that underlie speech intelligibility or understanding (Aiken & Picton, 2008; Aljarboa et al., 2022; Brodbeck & Simon, 2020). Our goal in this study was to apply these analysis principles to non-meaningful stimuli to evaluate audibility or access to speech—the most fundamental goal in auditory habilitation and the primary determinant of intervention outcomes in children with hearing loss (e.g., Stiles et al., 2012). The non-meaningful stimulus we utilize here is a naturally spoken speech token “susashee” or its subsets “sushee” or “sashee” that have been modified in specific ways to elicit brainstem-dominant responses and to infer audibility at low, mid and high frequencies (Easwar et al., 2022b, 2015a, 2015b, 2023). While there are several merits to using brainstem-dominant responses in infancy, including stability during sleep (Aiken & Picton, 2006; Purcell et al., 2004), earlier maturation than cortical responses (Moore & Linthicum, 2007), and cochlear-place/frequency-specific responses (Easwar et al., 2019; Herdman et al., 2002), they are of limited use in the presence of etiologies that compromise synchrony in neural firing (Rance et al., 2005). This includes etiologies like auditory neuropathy spectrum disorder (ANSD) that has a prevalence of ∼1–2 in every 10 children with hearing loss (Berlin et al., 2010). Relative to brainstem responses, onset-based cortical responses are more successful in measuring hearing acuity and/or processing in children with ANSD likely due to the longer integration window of cortical responses (He et al., 2013; Rance et al., 2002; Sharma et al., 2011). Therefore, by exploiting the low frequency tracking responses that are likely more tolerant to such peripheral neural jitter, the EFR approach could become more clinically versatile.
Irrespective of the presence of peripheral neural pathologies, evaluating the low frequency/syllabic rate neural activity that is simultaneously elicited with the brainstem-dominant EFRs could provide another avenue to assess audibility to speech with and without hearing aids, and potentially increase test accuracy and/or reduce test time. Furthermore, it would enable us to infer how low-frequency acoustic temporal cues—important for speech understanding (Ahissar et al., 2001; Molinaro & Lizarazu, 2018; Peelle & Davis, 2012; Shannon et al., 1995)—are encoded by the developing auditory system alongside higher frequency acoustic temporal cues deemed important for speech understanding in both quiet (i.e. optimal) and in adverse acoustic conditions (Rosen, 1992; Mai & Howell, 2022; Oxenham, 2008). The cortical EFR (<15 Hz), concurrently elicited alongside brainstem-dominant neural activity, was demonstrated in our recent work in adults with normal hearing (Easwar et al., 2022a; Pendyala et al., 2022).
Multiple methods, both time and frequency-domain, have been used to assess the low-frequency neural tracking or the syllabic rate cortical EFRs. Time-domain methods include the use of cross-correlation and temporal response functions (TRF), while frequency-domain methods include measurements based on the Fast Fourier transform (FFT). The cross-correlation approach involves computing the correlation between EEG and the slow envelope of speech at several delays (Aiken & Picton, 2008; Aljarboa et al., 2022). The temporal response function (TRF) approach assumes that the EEG response can be modeled as a linear convolution of the slow envelope of continuous speech (input) and an unknown impulse response called the TRF (Lalor et al., 2009; Lalor & Foxe, 2010; method explained in more detail below). The FFT forms the basis of common frequency-domain approaches that evaluate neural phase-locking at the syllabic rate or its harmonics (Ahissar et al., 2001; Tlumak et al., 2012; Pendyala et al., 2022). FFT output could be used directly in response detection (e.g., Pendyala et al., 2022) or could be used as input to machine learning and classification algorithms (Pendyala et al., 2022). A potential challenge with using FFT-based spectra is that it varies with not only the stimulus envelope rate but also with the listener's age (Tlumak et al., 2012) and inaudibility of certain frequencies (Pendyala et al., 2022). In addition, CAEP data suggest that spectra could vary with age and/or hearing experience (Jiwani et al., 2013; Ponton. et al., 2000; Sussman et al., 2008). In order to identify an approach that is agnostic to waveform or spectral features of the response, the present study focused on the TRF method that can be used irrespective of the response morphology. Another advantage of the TRF approach over the machine learning methods used in our previous work is the lack of reliance on prior data when developing the models.
The TRF method estimates the impulse response by using an L2 regularized least-squares approach that minimizes the error between the recorded EEG response and the predicted EEG response obtained by convolving the stimulus with the impulse response. This is a kind of “forward” model/approach that has been shown to have better accuracy compared to cross-correlation for speech stimuli that are autocorrelated, unlike stimuli like white noise (Crosse et al., 2016). The accuracy of the linear mapping is computed in terms of the correlation between the recorded EEG response and the predicted response, and the error between the two can be quantified as either root-mean-square or mean absolute error. TRF has been used with continuous running speech stimuli, commonly audio books. Forward modelling has also been successfully used for detecting cortical EFRs even in single-channel EEG recordings (Aljarboa et al., 2022). Fronto-central channels (e.g., Fz), known to produce the highest correlation between predicted and actual EEG (Di Liberto & Lalor, 2017; DiLiberto et al., 2015), revealed higher detection rates compared to the use of multiple channels (n = 6, 32) in adults with hearing loss likely because channels with higher noise and without strong responses are removed (Aljarboa et al., 2022). Compared to using peak to peak amplitude of the TRF and total TRF power, TRF correlation, which estimates the correspondence between the recorded and modelled EEG, led to the highest detection rates across varied EEG recording times (Aljarboa et al., 2022). On average, the recording time needed for detecting a response at Fz was 6.4 min with TRF-correlation. An alternative way to use the TRF approach with running speech stimuli has been backward modelling. Backward modelling, which predicts or re-constructs the speech envelope from the recorded EEG, has been used to infer how speech is represented and how that influences the accuracy of speech understanding with and without devices (Somers et al., 2018; Vanheusden, 2020; Verschueren et al., 2019). These studies have relied on EEG recordings from multiple channels.
In summary, the aim of the present study was to assess the utility of the cortical EFR, elicited by non-meaningful consonant-vowel syllables, to infer access to speech in children and adults with normal hearing as well as children with hearing loss wearing hearing aids. The three study objectives were: (i) to assess the influence of listener age (child vs. adult), hearing status (normal hearing vs. hearing loss), and stimulus level on cortical EFR characteristics, EFR detectability, and the test time needed to evaluate audibility, (ii) to assess the effect of stimulus type on cortical EFR characteristics, EFR detectability, and the test time needed to evaluate audibility, and (iii) to evaluate the effect of stimulus type on sensitivity and specificity. Although envisioned for clinical use in infants with hearing loss who are unable to participate in hearing tests, the present study was completed with data from older children and adults who could provide reliable thresholds measured behaviorally for the purposes of assessing the usefulness of cortical EFRs.
Methods
Two experimental protocols contributed to the three study objectives. As described in detail below, the protocols used different but related stimuli and different test levels. The objectives were addressed using new datasets as well as datasets that had been previously utilized for assessing the usefulness of brainstem-dominant or cortical-dominant EFRs in the prediction of speech audibility. To address Objective 1, data from Easwar et al. (2022b) and Easwar et al. (2023) were re-analyzed. These included adults and children with normal hearing (ANH and CNH, respectively) as well as children with hearing loss (CHL) wearing hearing aids. The same stimulus /su∫i/ and test levels were used, and will be referred to as Protocol 1. To address Objective 2 regarding stimulus type, data from ANH gathered for a different related stimulus /saʃi/ (Pendyala et al., 2022) was re-analyzed, and new data was gathered in CNH. This is henceforth referred to as Protocol 2.
Participants
Protocol 1 included 21 ANH (mean ± SDage = 22.7 ± 2.2 years; range: 19.6–26.7 years; 17 women), 23 CNH (mean ± SDage = 10.8 ± 3.1 years; range: 6.3–17.0 years; 8 girls), and 18 CHL (mean ± SDage = 12.7 ± 3.4; range = 6.2–17.0 years; 8 girls). Protocol 2 included 25 ANH (mean ± SDage = 22.25 ± 2.94 years; range: 18.59–30.59 years; 21 women) and 23 CNH (mean ± SDage = 11.98 ± 3.54 years; range: 5.64–17.09 years; 14 girls). To be eligible for the normal hearing group, participants were required to pass a pure-tone-based hearing screening at 20 dB HL in both ears, show no indication of middle ear pathology assessed using tympanometry, present no contraindications during otoscopy and have no self- or parent-report neurological disorders diagnosis. Of the 18 CHL who participated in Protocol 1, 17 had sensorineural hearing loss and one child had mixed hearing loss. Of these 18 children, 12 had hearing loss in both ears. Audiograms of test ears are provided in Easwar et al. (2023); their Figure 1. The hearing history of CHL is provided in detail in Table 1 of Easwar et al. (2023). Briefly, the age of diagnosis of hearing loss ranged from birth to 7 years. Of the 18 children, 12 were hearing aid users at the time of the study. Age of hearing aid fitting ranged from 3 months to 10 years. Hearing aids were worn at least 4 h/day. Written consent was obtained from all adult and child participants over 15 years of age. For children between 8 and 14 years, additional assent was obtained. For all child participants, written consent was also obtained from parents. Study protocols were approved by the University of Wisconsin-Madison review board.

Stimulus waveforms (solid grey lines) and their slow envelopes (dotted red lines).
Root-Mean-Square (RMS) Levels of Each Phoneme Relative to the RMS Level of /sa∫i/ or /su∫i/.

Negative values means lower than the overall RMS.
Stimuli
EFRs were elicited by /su∫i/ in Protocol 1, and by /sa∫i/ in Protocol 2 (see Figure 1 for waveforms). The stimuli contain fricatives as well as vowels, specifically a subset of the Ling 6 sounds, that represent the wide range of frequencies important for speech understanding. Both tokens were subsets of the male-spoken, modified /susa∫i/ stimulus originally developed for eliciting brainstem-dominant EFRs in prior studies (Easwar et al., 2015a, 2015b). For the purposes of eliciting brainstem-dominant EFRs from frequency-specific stimuli, both fricatives were sinusoidally amplitude-modulated with 100% depth at 93.75 Hz. Further, all vowels were modified such that the fundamental frequency of the voice in the low frequency first formant (<1000 Hz) was ∼8.5 Hz lower than that in the second and higher formants region in order to elicit two independent brainstem-dominant EFRs. Results of the brainstem-dominant EFRs from Protocol 1 data have been published elsewhere (Easwar et al., 2022b, 2023). The present study focuses on the cortical EFRs elicited by the low frequency envelope of /sa∫i/ and /su∫i/, predominantly <15 Hz. Both stimuli were 1.28 s in duration. Each fricative (/s/ and /ʃ/) was 256 ms in duration and each vowel (/a/, /i/ or /u/) was 384 ms in duration. Table 1 provides the levels of vowel and fricatives relative to the token /sa∫i/ or /su∫i/. The levels approximated the original production (Easwar et al., 2015a).
Stimulus Presentation and EFR Recording
In both protocols, the stimulus was presented monaurally through an ER-2 insert earphone in CNH and ANH. In CHL, the stimulus was routed through individually fit hearing aids, verified to provide amplification as per the Desired Sensation Level v5a prescription (Scollie et al., 2005). Depending on the degree of hearing loss, hearing aids were one of Phonak's 12-channel Sky B50 P, SP or UP. The hearing aids were programmed with direct audio input as the single program, which was the only stimulation mode during EEG recordings. Microphones were turned off after hearing aid output verification with Verifit 2 (Audioscan, ON). Further details of hearing aid fitting are provided in Easwar et al. (2023).
Stimulus presentations in both protocols were identical except for the stimulus level. In Protocol 1, the /su∫i/ token was presented at 55, 65, and 75 dB SPL (RMS). In Protocol 2, the /sa∫i/ token was presented at 65 dB SPL (RMS). In addition, to assess specificity (the true negative rate), a stimulus level of 15 dB SPL was used in Protocol 1 for the normal hearing groups and a condition with no stimulus playing was included in Protocol 2. In both protocols, the digital-to-analogue conversion of the stimulus was carried out by a Fireface UFX+ sound card (RME, Haimhausen). The stimulus was presented continuously at 96,000 samples/s. Stimulus level was calibrated in an ear simulator (Brüel & Kjær Type 4157). In the case of recordings with hearing aids, stimulus level was calibrated using a zero-gain hearing aid. The tokens were presented in one polarity in the first half of each trial and were flipped in the second half, making each trial 2.56 s in duration. In both protocols, the tokens were presented for 400 trials per condition. The vowels and fricatives in both protocols were deemed audible to the participant due to the stimulus levels used. This was explicitly measured in Protocol 1; sensation levels (dB above threshold), ascertained for the vowels and fricatives, were >13.9 dB in CNH, >8.9 dB in ANH (Easwar et al., 2022b), and >9 dB in CHL (Easwar et al., 2023). In the 15 dB SPL condition, only recordings with SL <0 dB were included.
Electroencephalogram (EEG) was recorded using a single-channel montage, with the noninverting electrode placed on the vertex (Cz), the inverting electrode placed on the nape, and the ground electrode on one of the collar bones. Sintered Ag-AgCl electrodes were used with self-adhesive sleeves and conduction gel (Signa-Gel) was used to keep the impedance <3 kΩ at each site. EEG was bandpass filtered between 1 and 5000 Hz and amplified by a gain of 100,000. EEG was digitized by the Fireface UFX+ at 96,000 samples per second and later low pass filtered at 15 Hz and down-sampled to 100 samples/sec. During the recording, all participants were seated in a comfortable chair reclined for comfort and watched a closed-captioned movie of their choice in an electromagnetically-shielded double-walled sound booth.
EEG Analysis
Each trial of the EEG recording was divided into two epochs to perform artifact rejection. The first (Q1) and third (Q3) quartiles, and the interquartile range (IQR) was calculated for each recording based on the RMS amplitudes of all epochs. Epochs with RMS amplitudes that were either less than Q1 − 1.5*(IQR) or greater than Q3 + 1.5*(IQR) were excluded from the final coherent average used for TRF analysis. From each recording, the amplitude of the waveform was estimated as the RMS of the average of all accepted trials. The noise estimate was obtained as the RMS of the noise trace ((A − B)/2)/sqrt(2), where A and B were odd and even trial averages.
Forward modelling was used in the TRF analysis. A Hilbert transform was applied to the /su∫i/ (in Protocol 1), or /sa∫i/ (in Protocol 2) waveforms and the absolute value of the resulting analytic signals were low-pass filtered at 15 Hz to extract the slow envelopes (see Figure 1). The MATLAB TRF toolbox (Crosse et al., 2016) was used to estimate the TRF (i.e., impulse response) between the coherent average of multi-trial EEG recordings and the slow envelope of the repeatedly presented stimulus of identical length. The TRF was estimated by solving the L2 regularized least-squares problem (called Ridge regression) to minimize the error between the actual coherent average EEG signal and the signal predicted using the stimulus.
The available trials were divided into consecutive blocks of 2.56*N sec and their coherent average was calculated. The optimal regularization parameter (λ) was found using K-fold cross-validation by partitioning the coherent average EEG signal and the stimulus envelope into K (K = 5) smaller segments/folds (i.e., K pairs of EEG and stimulus segments). N was chosen as 2 so that in each segment there were at least as many equations as the number of unknown TRF weights. In the next step, for each of the four values of λ in a pre-determined set (10−6, 10−4, 10−2, 100), a model was estimated on K − 1 folds and its accuracy was evaluated on the remaining fold. This process was repeated until each fold appears in the evaluation set. For each λ, the average accuracy over the K folds was noted, and the λ with highest average accuracy was selected. The selected λ was then used to estimate the TRF between the original un-segmented EEG and stimulus pair. K-fold cross-validation was necessary to find the optimal regularization parameter, and regularization was necessary to prevent overfitting and to improve the numerical stability of the TRF estimates (Crosse et al., 2016).
Before the cross-validation process, EEG and the speech envelope were normalized by dividing by their standard deviation. Such normalized inputs can greatly reduce the search space of the cross-validation method used to find the optimal regularization parameter (Crosse et al., 2016). The time range of the TRF was set to 0–375 ms to capture the relationship between a stimulus event and the corresponding response up to a delay of 375 ms. The upper limit was chosen based on previous TRF-based work in cortical response detection (Aljarboa et al., 2022) which aligns with the approximate time within which peaks of the CAEP occur (e.g., Lightfoot & Kennedy, 2006; Wunderlich & Cone-Wesson, 2006). Since the TRF is a finite impulse response (also referred to as FIR) filter which maps the slow envelope of speech to the response, the duration of the TRF is not dependent on the duration of the speech signal.
The accuracy of the estimated mapping was computed using root mean squared error (RMSE), mean absolute error (MAE), and Pearson's correlation coefficient (TRF_corr) between the actual/recorded and predicted coherent average.
Response detection was inferred by estimating the statistical significance of TRF_corr. The p-value of TRF_corr was found by comparing it against a bootstrapped null distribution generated as described in Pendyala et al. (2022). The bootstrapped null distribution was computed with M (M = 500 was used; Lv et al., 2007) incoherent averages of the multi-trial EEG recordings, to represent non-time-locked brain activity. Each incoherent average was created from non-time-locked epochs bootstrapped from the actual recording, by random sampling of epoch starting times throughout the recording (Lv et al., 2007). The linear mappings between the speech envelope and each of the M incoherent averages were then estimated, and the Pearson's correlation coefficients (
Test Time: Minimum Number of Trials to Detection
The statistical test was carried out in 10-trial intervals, i.e., after 10 sequential trials were added to the cumulative average, with the first test completed with the first 10 accepted trials. To reduce the number of false positives due to repeated testing, the response had to remain statistically significant for at least 7 consecutive tests (i.e., over 70 accepted trials; called min-7-rule henceforth). This is higher than the 4 consecutive test rule applied in earlier studies (Choi et al., 2011, 2013; Luts et al., 2008) and was chosen to maintain the false positive rate at 5% (merged across all inaudible trials from both protocols in children and adults with normal hearing; total n = 80). The trial number reported refers to the trial number associated with the first of 7 significant tests.
Sensitivity and Specificity
Sensitivity was computed as the ratio of the number of true positives to the sum of the true positives and false negatives. Sensitivity was essentially the proportion of responses detected because only audible conditions were included. Specificity was computed as the ratio of the number of true negatives to the sum of true negatives and false positives. To assess the effect of age and stimulus on both sensitivity and specificity, data from 65 dB SPL conditions (audible) and 15 dB SPL or no-stimulus conditions (inaudible) from CNH and ANH were included. All trials available after artifact rejection were included.
Statistical Analysis
The influence of listener age, hearing status, and stimulus level on the response RMS amplitude in Objective 1 was assessed using a linear mixed effects model. Fixed factors were level (55, 65, and 75 dB SPL) and group (ANH, CNH, CHL). A random intercept was included for every participant. The influence of stimulus (/su∫i/, /sa∫i/) and group (ANH, CNH) on response RMS amplitude was assessed using a two-way between-subjects analysis of variance (ANOVA). Similar analyses were completed for noise RMS amplitude as well as the minimum number of trials needed for detection. To assess the effect of listener age, stimulus level and hearing status (Objective 1) on EFR detectability, logistic regression was applied with group (ANH, CNH, CHL), level (55, 65, and 75) and their interaction as independent variables, and detection outcome (1 or 0) as the dependent variable. To assess the effect of stimulus and age on EFR detectability (Objective 2), a similar logistic regression was carried out with stimulus (/su∫i/, /sa∫i/), group (ANH, CNH) and their interaction as the independent variables. Sensitivity and specificity were compared with χ2 tests. All p-values reported are corrected for multiple comparisons using the false discovery rate (FDR) approach (Benjamini & Hochberg, 1995). When p < 0.05, results are to be interpreted as statistically significant. All statistical analyses were completed using R v4.2.1 (R core team, 2022). Mixed models and post hoc comparisons were completed using the packages lmer (Bates et al., 2015) and emmeans (Lenth, 2021), respectively.
Results
Response Amplitudes Varied With Stimulus Level and Group
Individual and grand average waveforms from both protocols are shown in Figure 2. Corresponding spectra are shown in Figure 3. The waveforms resemble those in our recent work in ANH where the stimulus /susa∫i/ contained an additional syllable (Easwar et al., 2022a). The waveforms shown represent multiple overlapping acoustic change complexes elicited by each phoneme transition (Martin & Boothroyd, 2000; Martin et al., 2008). They consistently demonstrate a positive/rising peak after the onset of every phoneme. A similar pattern is evident in CNH as well as in CHL wearing hearing aids albeit with larger amplitudes and more prominent negativity following each positive peak. Relatively minor differences as a function of level were evident. Since the wave morphology differs between groups, statistical analyses were completed on the RMS amplitude rather than peak to peak estimates that is common for waveforms.

Individual waveforms (grey) overlaid by the grand average waveform (color; solid) as a function of stimulus level are shown in A. Individual waveforms (grey) overlaid by the grand average waveform (color; solid) as a function of stimulus and group are shown in B. Translucent traces in color closer to the horizontal 0-amplitude mark represent noise floor. Vertical dashed lines represent phoneme boundaries. ANH = Adult normal hearing, CNH = children with normal hearing, CHL = children with hearing loss

Individual spectra (grey) overlaid by the grand average spectrum (color) as a function of stimulus level are shown in A. Individual spectra (grey) overlaid by the grand average spectrum (color; solid) as a function of stimulus and group are shown in B. 1.56 Hz, shown in the top left panel, represents the syllabic rate. 3.12 Hz, the phoneme rate, is abbreviated to 3. ANH = Adult normal hearing, CNH = children with normal hearing, CHL = children with hearing loss.
A linear mixed effects model for Objective 1 indicated a significant main effect of group (F[2,62] = 11.86, p < 0.001), level (F[2,124] = 32.87, p < 0.001) but not a significant interaction (F[2,124] = 2.43, p = 0.051). Merged across groups, response amplitudes grew significantly with each 10-dB increase in level (55 dB SPL: mean ± SD = 1.34 ± 0.63 µV; 65 dB SPL: mean ± SD = 1.49 ± 0.65 µV; 75 dB SPL: mean ± SD = 1.57 ± 0.73 µV). All pairwise contrasts were significant (55 vs. 65 dB SPL: t[130] = −5.03; p < 0.001; 65 vs. 75 dB SPL: t[130] = −2.77, p = 0.006; 55 vs. 75 dB SPL: t[130] = −7.8, p < 0.001). Merged across levels, CNH (mean ± SD = 1.66 ± 0.59 µV) as well as CHL (mean±SD = 1.77±0.81, p = 0.553) demonstrated higher amplitude waveforms relative to ANH (mean ± SD = 0.99 ± 0.23 µV; ANH-CNH: t[65] = −3.92, p < 0.001; ANH-CHL: t[65] = −4.26, p < 0.001).
The ANOVA for Objective 2 revealed that the response RMS varied significantly by group (F[1,88] = 54.89, p < 0.001) but not by stimulus (F[1,88] = 1.28, p = 0.262) or their interaction (F[1,88] = 0.22, p = 0.639). Merged across stimuli, response RMS in CNH (mean ± SD = 1.74 ± 0.59 µV) were significantly larger than that in ANH (mean ± SD = 1.05 ± 0.22 µV). Merged across groups, amplitudes of waveforms elicited by /sa∫i/ (mean ± SD = 1.43 ± 0.59 µV) was only marginally greater than those elicited by /su∫i/ (mean ± SD = 1.36 ± 0.55 µV).
RMS noise amplitudes were compared with similar analysis models. There was no significant effect of group (F[2,62] = 1.79, p = 0.174), level (F[2,124] = 0.66, p = 0.528) or their interaction (F[4,124] = 0.35, p = 0.843). Corresponding analyses for Objective 2 indicated that there was a significant effect of group (F[1,88] = 10.96, p = 0.001) but no influence of stimulus (F[1,88] = 0.97, p = 0.328) . Residual noise was higher in CNH (mean ± SD = 0.46 ± 0.14 µV) than ANH (mean ± SD = 0.38 ± 0.10 µV).
Response Amplitudes Varied With Child's Age Irrespective of Hearing Status
RMS amplitudes as a function of the child's age at test are shown in Figure 4A and B. At all stimulus levels and for both stimuli, response amplitude reduced as the child's age increased.

RMS amplitude as a function of children's ages across different stimulus levels for the /su∫i/ stimulus in (A). RMS amplitude as a function of children's ages for both /su∫i/ and /sa∫i/ stimuli in (B). * refers to statistically significant correlations (all p < 0.001). CNH = children with normal hearing, CHL = children with hearing loss
TRF Morphology Varied Between Children and Adults
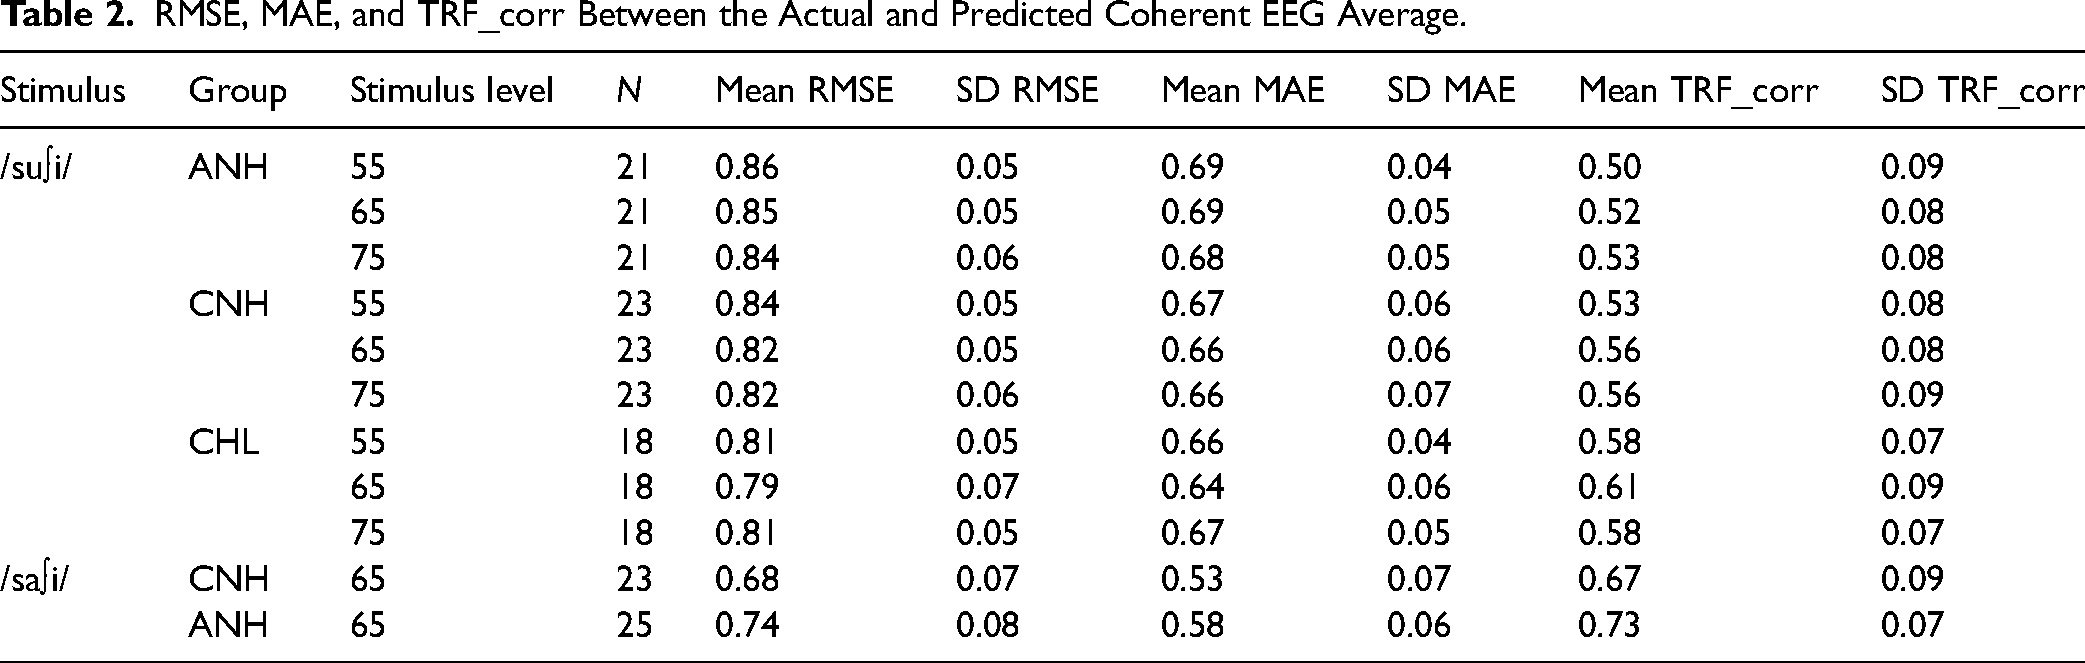
Grand-average TRF filter waveforms from each protocol are shown in Figure 5. As expected, the morphology varied most significantly between adults and children irrespective of hearing status. Individual TRFs are provided in Supplementary Figure S1. The TRF in ANH are similar to the example reported in Aljorboa et al. (2022). The peak-to-peak value and power of the TRF filter across a 375 ms window were calculated (Aljorboa et al., 2022). TRF power was computed as the mean squared value of the estimated weights (Aljorboa et al., 2022). Due to the differences between groups in TRF morphology, TRF power was compared. As expected due to the normalization of inputs, TRF power did not vary by level (F[2,124] = 1.67, p = 0.192), group (F[2,62] = 0.29, p = 0.746) or by their interaction (F[4,124] = 0.42, p = 0.794; sqrt-transformed). Likewise, TRF power did not vary by stimulus (F[1,88] = 2.62, p = 0.109), group (F[1,88] = 0.36, p = 0.552), or by their interaction (F[1,88] = 1.23, p = 0.271). Group means and SD of error estimates and correlations are shown in Table 2.

Grand average TRF filter waveforms for /su∫i/ stimulus are shown as a function of level in each group in (A). Similar waveforms are shown for both /su∫i/ and /sa∫i/ presented at 65 dB SPL in each group in (B). Solid trace represents the grand average. The shaded region represents +/−1 SD. ANH = Adult normal hearing, CNH = children with normal hearing, CHL = children with hearing loss.
RMSE, MAE, and TRF_corr Between the Actual and Predicted Coherent EEG Average.
Detectability was Influenced by Stimulus But Not by Group and Level
EFR detection rates as a function of group and stimulus level are shown in Figure 6A (Objective 1). Detection rate exceeded 81% in all conditions, with rates being similar at 65 and 75 dB SPL and higher than 55 dB SPL in ANH and CHL. The generalized linear model to assess factors influencing detectability revealed no statistically significant effects of group (χ2[2]= 0.53, p = 0.769), level (χ2[1] = 0.87, p = 0.351) and their interaction (χ2[2] = 0.440, p = 0.803) on the detection outcome (detected/ not-detected). Detection rate as function of group and stimulus are shown in Figure 6B (Objective 2). Detection rate was 100% for the stimulus /sa∫i/ in both groups. The generalized linear model to assess factors influencing detectability indicated that detection outcomes varied significantly by stimulus (χ2[1] = 6.1, p = 0.013), but not group (χ2[1] < 0.01, p = 1.0).

Detection rates as a function of level and group shown in A and as a function of stimulus and group shown in B. The number of detected responses as a function of the total number of responses included is shown within each bar. ANH = Adult normal hearing, CNH = children with normal hearing, CHL = children with hearing loss.
Trials Needed for Detection Varied by Group and Stimulus
The number of stimulus trials needed for detection is shown in Figure 7. For the stimulus /su∫i/ (Figure 7A), the number of trials needed for detection was the lowest for CHL irrespective of stimulus level. Statistical analyses were completed on responses that were detected after applying the min-7-trial rule. The linear mixed effects model indicated a significant effect of group (F[2,49.5] = 6.81, p = 0.002), but no effect of stimulus level (F[2,96.6] = 1.64, p = 0.198) or their interaction (F[4,96.6] = 0.25, p = 0.907). Posthoc comparisons indicated fewer number of trials needed for CHL (mean ± SD = 63.7 ± 59.4) than both ANH (mean ± SD = 125.3 ± 80.2; t = 3.56; p = 0.002) as well as CNH (mean ± SD = 102.5 ± 81.1; t = 2.29, p = 0.038).
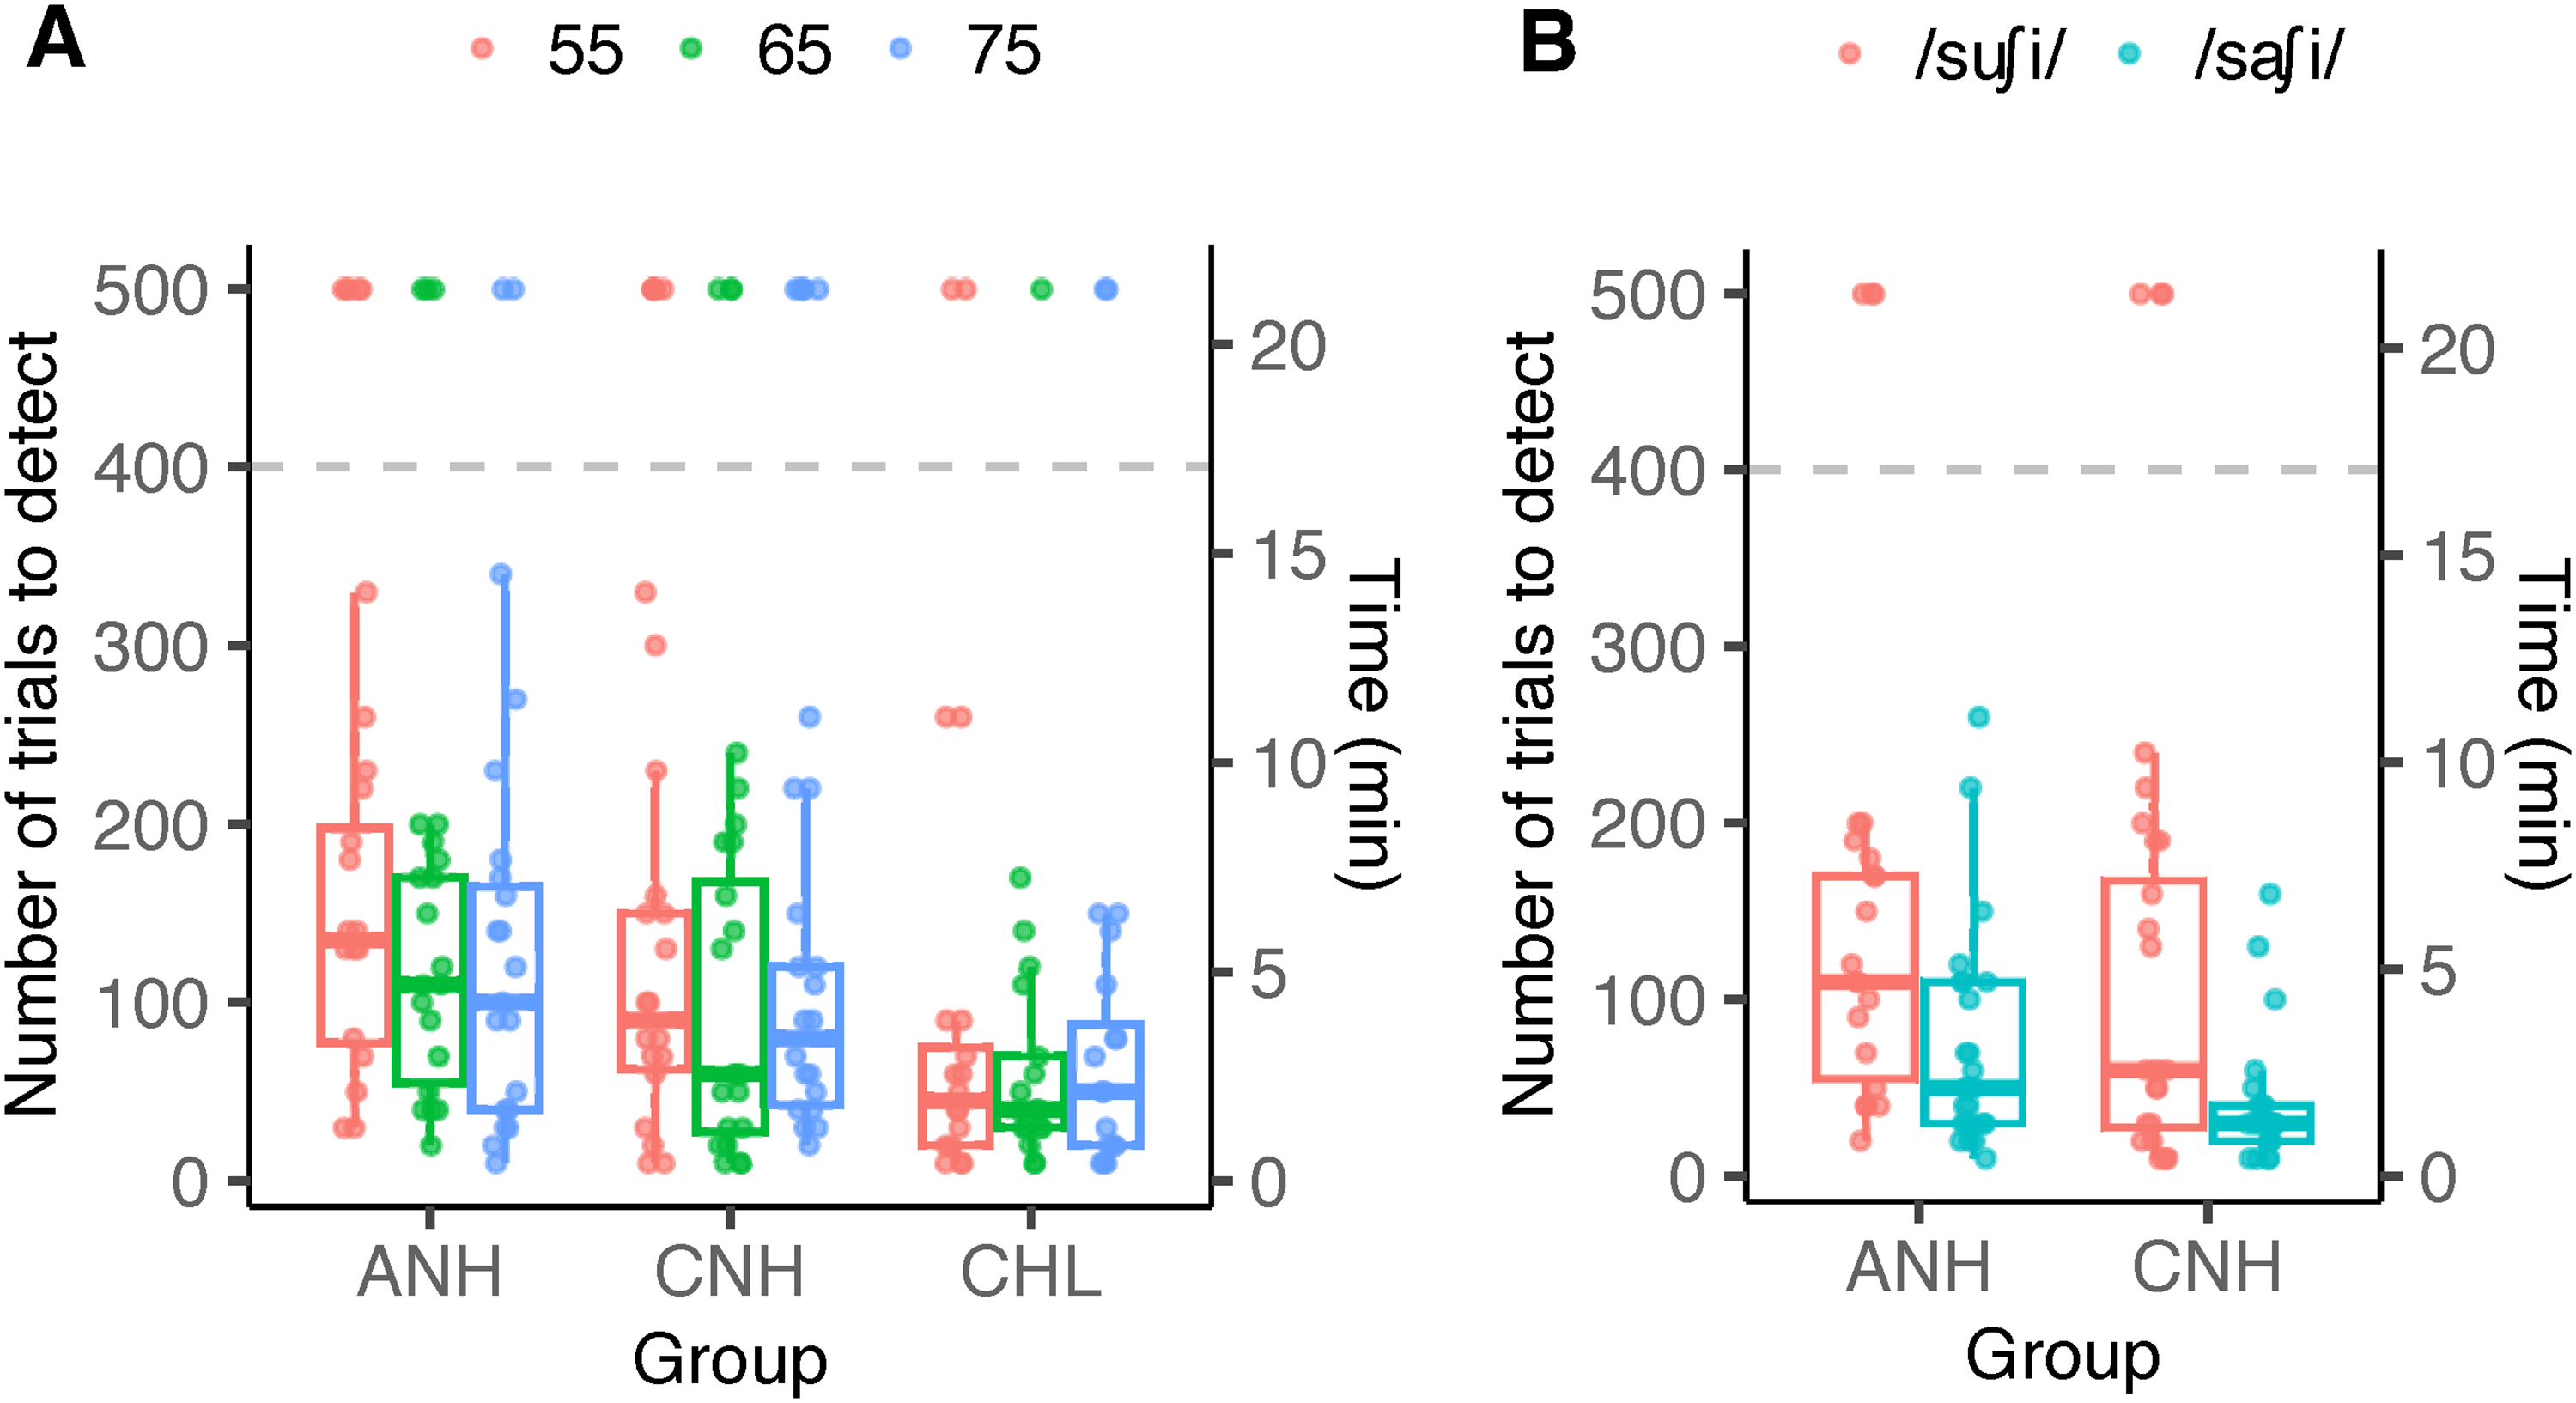
The number of trials needed for detecting a response is shown as a function of group and stimulus level in (A), and as a function of group and stimulus in (B). The secondary y-axis represents the time needed for detecting the response (each trial was 2.56 s). Colored dots represent individual data. The horizontal dashed line represents the maximum number of trials recorded. Individual data shown at y-value of 500 were not detected at the maximum number of trials. Box plots exclude non-detections to represent data included in the statistical analysis. ANH = Adult normal hearing, CNH = children with normal hearing, CHL = children with hearing loss
As shown in Figure 7B, the stimulus used influenced the number of trials needed to detect a response in both ANH and CNH. Specifically, more trials were needed to detect responses elicited by /su∫i/. The between-subject ANOVA indicated a main effect of stimulus (F[1,82] = 11.96, p < 0.001) but no significant effects of group (F[1,82] = 3.28, p = 0.073) or their interaction (F[1,82] = 0.185, p = 0.668). An average of 58.1 trials (SD = 54.4) was necessary for /sa∫i/ compared to 103.4 trials (SD = 71.8) for /su∫i/, merged across both groups.
Sensitivity Varied by Stimulus and Not by Group. Specificity Varied by Neither Stimulus Nor Group
Sensitivity and specificity estimates are provided in Table 3. Both stimuli considered, χ2 tests indicated no statistical difference between adults and children with normal hearing in sensitivity (χ2[1] < 0.001, p = 1) and specificity (χ2[1] = 0.40, p = 0.527). Both groups considered, the stimulus /sa∫i/ was significantly higher in sensitivity (χ2[1] = 4.56, p = 0.033) but not in specificity (χ2[1] = 0.058, p = 0.810).
Sensitivity and Specificity.

Discussion
The study evaluated the utility of the cortical EFR elicited by non-meaningful consonant-vowel stimuli in three different listener groups, viz., children and adults with normal hearing and children with hearing loss using hearing aids. Key findings include (i) larger amplitude EFRs in children compared to adults, irrespective of hearing status, (ii) similar EFR detectability in all three groups at conversational speech levels and fewer number of trials needed for response detectability in children with hearing loss, and (iii) a minor stimulus advantage in sensitivity and the minimum number of trials needed for detectability.
Cortical EFRs and Temporal Response Functions Reveal Immaturity in Children With and Without Hearing Loss
As explained earlier, the waveforms (Figure 2) closely resemble our previous data in adults (Easwar et al., 2022a). To our knowledge, there are no reports in children for comparison. The predominance of the positive peak in adults and the positive-negative complex in children could be explained by the differing effects of interstimulus silent intervals on CAEP components (Draganova et al., 2002; Sussman et al., 2008). In general, the CAEP waveform is simplified (i.e., appears with fewer components) as the interstimulus intervals decrease to phoneme durations (200–400 ms between the onset of two consecutive stimuli). In adults, the N1 is suppressed while the P1 remains dominant. Whereas in children, the P1 and the following N2 remain prominent even at shorter interstimulus intervals (Sussman et al., 2008). Larger amplitudes in children compared to adults align with previous studies that use tonal stimuli presented at different rates; between tone burst repetition rates of 0.75 to 80 Hz, Tlumak et al. (2012) found larger EFR amplitudes in 6-to-9-year children than adults at rates <5 Hz. Similarly, Sussman et al. (2008) found greater power of each CAEP component at younger ages. The TRFs shown in Figure 5 similarly demonstrate clear morphology differences between adults and both groups of children who are comparatively more similar.
Between CNH and CHL, the morphology and overall amplitudes are largely similar despite the use of hearing aids in CHL (Figure 2A, B). The overall similarity likely suggests: (i) similar overall loudness achieved with amplification as per a validated prescription (Scollie et al., 2005), and (ii) similar development of slow envelope processing despite the presence of hearing loss possibly because most children had lower than severe degrees of hearing loss and/or due to adequate amplification with hearing aids provided sufficiently early. Qualitatively inferred, minor differences exist between groups particularly at transitions to vowels from fricatives. CNH demonstrate similar amplitude for all transitions, whereas CHL have larger deflections for vowel onsets compared to those for fricatives. The difference may have risen from better audibility of vowels than fricatives in CHL and/or possibly non-linear hearing aid processing altering the relative perceptual prominence of the phoneme. A comparison of unaided and aided waveforms in CHL may help elucidate these differences.
The effect of stimulus level was similar between ANH, CNH as well as CHL. The response amplitude grew significantly with each 10-dB increase, however, the rate of growth was lower between 65 and 75 dB SPL than between 55 and 65 dB SPL. The slower growth rate at higher levels agrees with the asymptotic pattern evident with onset-based CAEPs (Ross et al., 1999) where P1 demonstrates muted growth in amplitude compared to later peaks like N1 and P2 (Billings et al., 2007). Sensitivity to level in P1 was evident in latency instead (Billings et al., 2007), which we did not track in this study. The lack of level by group interaction in response amplitude coincides with similar growth rates between CNH and ANH in brainstem-dominant EFRs (Easwar et al., 2022b). Age-based differences have been reported in CAEP growth rates with level, however, they have been in infants <1 year (Purdy et al., 2013).
Cortical EFRs Can Serve as Useful Indicators of Audibility in Clinically Feasible Test Times
Sensitivity
When considering soft to loud speech stimulus levels in ANH, CNH and CHL (aided), cortical EFRs were detected at least 81% of the instances (Figure 6). High sensitivity (>90.9%) and specificity (>94.9%) were evident in both ANH and CNH (Table 3). Detectability/sensitivity estimates seem comparable to brainstem-dominant EFRs elicited by the same stimulus /su∫i/. In the same CNH and ANH, the sensitivity of brainstem-dominant EFRs, elicited by each phoneme or parts of phonemes, was ≥ 83.9%, 94.1%, and 97.5% at 55, 65, and 75 dB SPL (Easwar, Purcell et al., 2022b; their Table 2). In CHL (aided), the sensitivity was 82.1% (Easwar et al., 2023; their Table 2). When compared to onset-based CAEPs, the sensitivity estimates of cortical EFRs in this study are higher. For CAEP stimuli that were more than 10 dB higher than the threshold, the sensitivity was 80% for mid frequency stimuli, 60% for high frequency stimuli, and 70% on average, when tested once (Visram et al., 2023). Sensitivity improved to 87%, when repeated. Such comparisons are, however, far from ideal because the study sample in Visram et al. (2023) was infants with hearing loss wearing hearing aids. Infants are likely to be less cooperative than the older children and adults tested in the present study. Systematic differences could also arise from the use of band-limited stimuli for frequency-specific inferences in Visram et al. (2023). The lack of adult/child differences in sensitivity is similar to brainstem-dominant EFRs (Easwar et al., 2022b). Larger amplitudes in children did not necessarily translate to better detectability/sensitivity, despite higher residual noise in children or higher error estimates in adults (Table 2). It is possible that these differences were not large enough to influence detection outcomes.
Test time
For the /su∫i/ stimulus, the average EEG recording time needed in adults to achieve a detection was 6.4 min (53 recordings over 55, 65, and 75 dB SPL test levels from 16, 18, and 19 adults, respectively). For the /sa∫i/ stimulus, the EEG recording time needed was 3.7 min (25 recordings from 25 adults). Compared to the test time (6.4 min) reported for running speech stimuli using the same TRF-correlation parameter in ANH in the best performing channel Fz (Aljarboa et al., 2022), the minimum necessary test times in this study are similar for /su∫i/ and shorter for /sa∫i/. The use of repetitive stimuli in the present study and coherent averaging would be expected to improve the estimates of the TRF/impulse response and thus facilitate earlier detection, however, this was realized only for one stimulus. One must note that the estimates provided in this study may be underestimated marginally because the time was based only on the number of accepted trials post artifact rejection. The time taken for accruing accepted trials (low noise) may vary based on the listener and recording conditions.
Efficiency of Cortical EFRs Varies With Stimulus and Presence of Hearing Loss
An advantage was evident for the stimulus /sa∫i/ compared to /su∫i/ in sensitivity and test time (Table 3 and Figure 7). The amplitude of cortical EFRs elicited by /sa∫i/ was numerically higher than those elicited by /su∫i/ but not statistically significant. Lower error between the recorded and modelled response (lower RMSE and MAE, and higher correlation) for /sa∫i/ over /su∫i/ support the direction of stimulus advantage evident for /sa∫i/. The stimulus difference exists despite matching for overall stimulus RMS level (65 dB SPL) and identical 5 ms ramping (rise and fall) for all phonemes. The relative level differences between neighboring fricatives were higher for /su∫i/ (/s/ to /u/: 12.9; /u/ to /s/: 14.1 dB) than /sa∫i/ (9.3, 10.6 dB, respectively; Table 1). Thus, the stimulus advantage likely reflects the sensitivity of the acoustic change complex to changes in spectra regardless of concurrent changes in stimulus level (Martin & Boothroyd, 2000).
Interestingly, although detectability was similarly high in children with and without hearing loss, the test time needed was considerably shorter in CHL compared to their peers with normal hearing (CNH) as well as ANH (Figure 7). The average minimum recording times were 2.7, 4.4, and 5.3 min in CHL, CNH, and ANH, respectively. Higher amplitude (Figure 2) and correlation between recorded and modelled EEG (Table 2) compared to adults possibly contributed to shorter detection times. Sources contributing to differences between the two child groups are not readily clear. Correlations (Table 2) were largely similar between the two groups of children and so were the EFR amplitudes. It is possible that the peak-to-peak deflections in the waveform (not systematically quantified in this study) were higher in CHL than CNH (Figure 2B) and that facilitated quicker detection.
It is important to note that the present study evaluated the usefulness of cortical EFRs when all or no phonemes in the stimulus were audible. While this is a suitable starting place for such evaluation, it does not adequately capture the frequency-specific effects on audibility due to hearing loss. Since cortical potentials are sensitive to stimulus onsets and offsets (Hillyard & Picton, 1978) and interruptions in a stimulus (Lister et al., 2007), it is likely that inaudible phonemes amidst audible phonemes elicit a consistent CAEP or acoustic change complex (Pendyala et al., 2022; their Figure 4). Machine learning strategies have attempted to infer frequency-specific audibility in adults with simulated hearing loss (Pendyala et al., 2022). The extent to which the TRF approach can be used to infer audibility of one or more frequencies is yet to be determined. It is possible that comparison of traces segmented based on the timing of each phoneme or use of phoneme-based TRFs will be informative (e.g., Di Liberto & Lalor, 2017; Gillis et al., 2022). Further, this study was limited to evaluating audibility in aided conditions in CHL. To assess clinical utility of such an objective measure of hearing aid benefit, further evaluation should quantify the sensitivity of cortical EFRs to improved audibility with the use of a hearing aid. Lastly, we acknowledge that there may be continual changes in the cortically generated response as a function of age and hearing experience (Ponton et al., 2000; Sharma et al., 2005; Wunderlich & Cone-Wesson, 2006). Future work in infants with and without hearing loss is essential to ascertain the clinical utility of this approach.
Comparison With Alternative Approaches Indicate the Need for Additional Investigation
As described earlier, the rationale for choosing the TRF-based analysis was its lack of dependency on the response morphology. A change in response morphology expectedly alters response spectra and thus influences both time- and frequency-domain approaches to detection that often require apriori assumptions to choose the time windows or the frequencies for analysis. To assess whether analytical approaches that make use of such prior assumptions provide comparable results (to the TRF approach which does not need such assumptions), we applied the frequency-domain Hotelling's T2 to the first or second harmonics (Pendyala et al., 2022). The Hotelling's T2 has been a robust approach for brainstem-dominant speech EFRs (Easwar et al., 2020, 2022b). Analyses were constrained to the first (1.5625 Hz) or second harmonic (3.125 Hz) as the first harmonic corresponds to the stimulus syllabic rate and the second harmonic yielded the largest EEG amplitude across all groups and conditions (Figure 3).
The Hotelling's T2 statistic was computed with the frequency domain features (i.e., Fourier coefficients) extracted from multi-trial EEG data, under the null hypothesis of no response. In each trial (of 2.56 s), EEG signals corresponding to the two polarities were averaged, and the Fourier transform was applied on the resulting 1.28 s signal to obtain the real and imaginary Fourier coefficients at each harmonic. The Hotelling's T2 statistic was calculated over a matrix of size M × 2, where M equals the number of trials and the two columns correspond to the real and imaginary parts of the Fourier coefficients of the chosen harmonic number. A p-value was computed per recording by comparing the Hotelling's T2 F value with the standard alpha = 0.05 F table at 2 and M − 2 degrees of freedom. The Hotelling's T2 F value was obtained by multiplying the Hotelling's statistic with (M − 2)/(2*(M − 1)). The cortical EFR was considered as detected when Hotelling's T2 statistic exceeded the critical F value at alpha of 0.05.
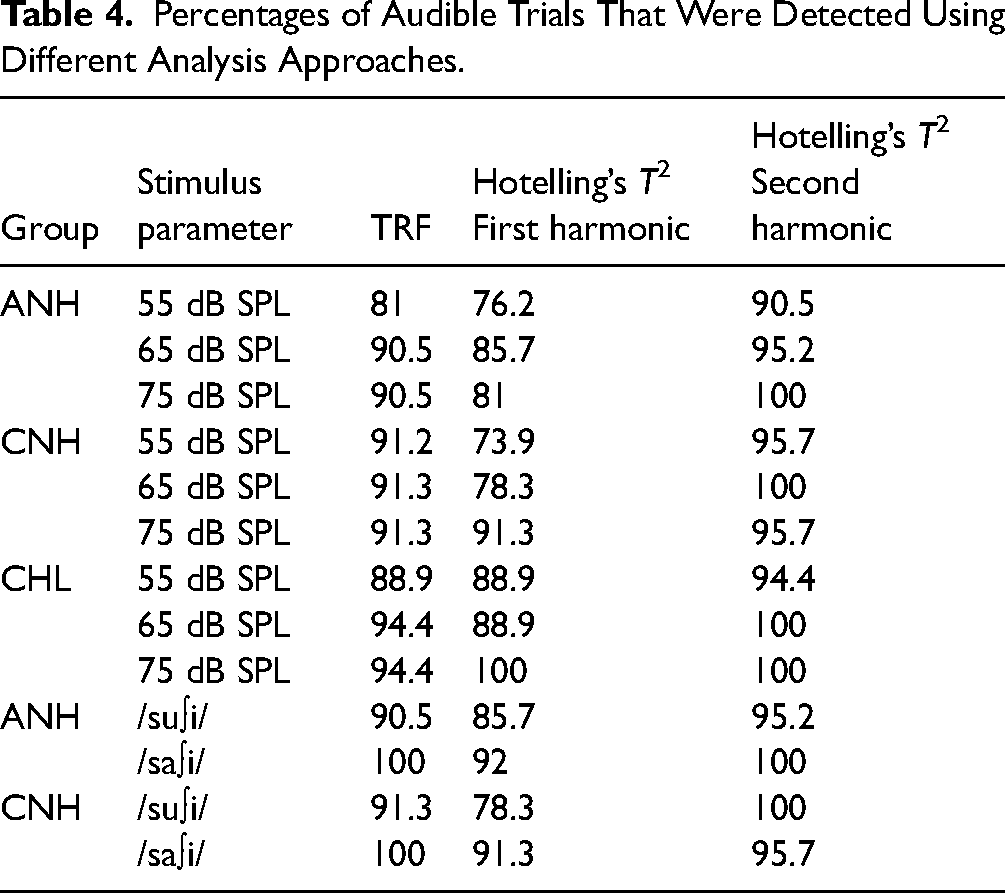
Table 4 provides a summary of the detection percentages. Detection percentages for audible stimuli were higher for the TRF-based approach compared to the first-harmonic Hotelling's T2 by 6.4% on average (range = −17.3 to 5.6%) whereas it was worse than the second-harmonic Hotelling's T2 by 5.2% on average (range = −4.3 to 9.5%). This pattern confirms our expectation that the accuracy of Hotelling's T2 depends on the harmonic number chosen and suggests that apriori knowledge of the response spectrum would be necessary to choose the appropriate harmonics in the analyses. It is nonetheless promising to note that, for the current dataset when all stimuli were known to be audible with or without hearing aids, using frequency-domain methods provides high accuracy in detection. Whether or not these accuracies generalize to a wider range of responses recorded in conditions with varied audibility warrants further investigation.
Percentages of Audible Trials That Were Detected Using Different Analysis Approaches.
Summary and Conclusion
The present study evaluated the use of neural activity elicited by the low frequency envelope of repetitive consonant–vowel syllables to evaluate the audibility of speech in adults with normal hearing, and children with normal hearing and hearing loss. The temporal response function approach, specifically forward-modelling, used previously with continuous running speech samples, proved useful to achieve high accuracy in discerning audible vs inaudible speech within clinically feasible test times. Age and hearing status (hearing loss compensated using a hearing aid) did not influence accuracy despite higher amplitude responses in children compared to adults. The minimum number of trials needed to detect a response was the fewest in children with hearing loss wearing hearing aids. The choice of phonemes in the stimulus influenced accuracy as well as test time needed and thus will be an important factor to optimize for clinical use. Together, this study suggests that the neural activity to the slow envelope of repetitive speech, even if non-meaningful, could be fruitfully used to assess speech audibility. Future work could evaluate the usefulness of this approach when audibility is varied in a frequency-specific manner with and without a hearing aid, and when combined with brainstem-dominant responses simultaneously elicited by each phoneme.
Supplemental Material
sj-docx-1-tia-10.1177_23312165241227815 - Supplemental material for Assessing Speech Audibility via Syllabic-Rate Neural Responses in Adults and Children With and Without Hearing Loss
Supplemental material, sj-docx-1-tia-10.1177_23312165241227815 for Assessing Speech Audibility via Syllabic-Rate Neural Responses in Adults and Children With and Without Hearing Loss by Varsha Pendyala, William Sethares and Vijayalakshmi Easwar in Trends in Hearing
Footnotes
Acknowledgements
Authors thank Veronika Mak, Emma McGrath, Mary Galloy, and Trevor Wright for assistance with data collection, and David Purcell for reviewing the manuscript. Stimuli used were previously created in collaboration with David Purcell, Susan Scollie, and Steve Aiken for brainstem-dominant EFRs.
Author Contributions
VP designed the study, completed EFR analysis and review-edited the manuscript. BS secured funding for study, designed the study, supervised EFR analysis, and review-edited the manuscript. VE secured funding for study, designed the study, supervised EFR analysis, completed statistical analysis and visualization, and wrote the original draft.
Data Availability Statement
Data will be shared upon request to the corresponding author
Declaration of Conflicting Interests
The authors declared no potential conflicts of interest with respect to the research, authorship, and/or publication of this article.
Funding
The authors disclosed receipt of the following financial support for the research, authorship, and/or publication of this article: The study was partially funded by the Hearing Health Foundation awarded to VE, the OVCRGE Promoting industry collaboration initiative awarded to VE and BS, and the Australian Government through the Department of Health and Aged Care.
Supplemental Material
Supplemental material for this article is available online.
References
Supplementary Material
Please find the following supplemental material available below.
For Open Access articles published under a Creative Commons License, all supplemental material carries the same license as the article it is associated with.
For non-Open Access articles published, all supplemental material carries a non-exclusive license, and permission requests for re-use of supplemental material or any part of supplemental material shall be sent directly to the copyright owner as specified in the copyright notice associated with the article.