
Abstract
This study was aimed at assessing listening effort (LE) in quiet and in noisy daily life situations, in 481 adults with hearing aids (HAs) and 62 adults with normal hearing, using an Extended version of the Effort Assessment Scale (EEAS). Participants were invited to self-assess their LE in daily life, on a visual analog scale graded from 0 (no effort) to 10. The EEAS's internal structure identified two separate constructs pertaining to LE in quiet and LE in noise, each with good consistency (Cronbach's α > 0.83). A three-factor model explained 12% of the variance of the EEAS scores, with HA experience the most important one, and better ear hearing threshold (averaged across 0.5–4 kHz) and ear asymmetry as the other two factors. The EEAS subscales differed in behavior, with the LE in noise being the most dependent on HA experience, whereas LE in quiet depended more on better ear hearing threshold. In a subgroup of people with 6 months to less than 24 months HA experience, a significant decrease in LE in noise was observed with increasing HA experience (0.26 points decrease per year of HA experience), whereas in a group of people with at least 24 months of HA experience, a small increase in LE in noise was observed. This effect was not mediated by age, nor hearing threshold. The extended Effort Assessment Scale is therefore offering an assessment of both LE in quiet and LE in noise, with different dependence on HA experience and hearing thresholds.
Introduction
Many different questionnaires have been developed for assessing levels of hearing disability, hearing abilities and benefit of hearing aid (HA) use. A recent review of existing questionnaires in otology (Viergever et al., 2021) counted more than 155 different forms of validated questionnaires, with 84 forms specific to hearing loss. In current practice, self-assessment scales are mostly used to measure the level of hearing impairment, its impact on daily activities and the benefit perceived by people wearing HAs (e.g., the Satisfaction of Amplification in Daily Life [Cox & Alexander, 1999], the Client Oriented Scale of Improvement [Dillon et al., 1997], or the Hearing Handicap Inventory for the Elderly [HHIE] [Weinstein & Ventry, 1982]). The Speech Spatial and Qualities of hearing scale (SSQ) was designed (Gatehouse & Noble, 2004) with the aim of enriching and enlarging the various everyday communication situations people with hearing impairment are asked to report about. This was an attempt to assess hearing disabilities in a world as similar as possible to the real world in which people live. This self-report scale, composed of 49 items grouped into three subscales (speech, spatial, and qualities of hearing), asks people to self-assess on a visual analog scale graded from 0 to 10, their ability to perform the tasks described, tasks that reflect daily life situations (e.g., to follow a conversation among several talkers). Many people can choose a score close to 10 (i.e., they are able to perform the task) even though they can achieve the task only at the cost of increased mental effort. Often, people report that they cannot sustain some of the situations depicted for very long and that these situations tire them, suggesting another dimension beyond hearing ability: the extra listening effort (LE) needed to deploy, which is not necessarily captured by the SSQ. The LE has been defined by McGarrigle et al. (2014) as the “mental exertion required to listen to and understand an auditory message” and by Pichora-Fuller et al. (2016) as “the deliberate allocation of resources to overcome obstacles in goal pursuit when carrying out a listening task.” Both definitions relate to LE for a specific task and numerous studies have addressed task-specific LE using objective methods (e.g., Bernarding et al., 2017; Giroud et al., 2017; Holube et al., 2016; Miles et al., 2017; Rovetti et al., 2019; Seropian et al., 2022; Winn et al., 2018; Zekveld & Kramer, 2014) and behavioral ones (e.g., Bräcker et al., 2019; Desjardins & Doherty, 2014; Sommers & Phelps, 2016). However, as daily life comprises multiple listening tasks in various situations, measuring the mental effort perceived in daily life (Timmer et al., 2018) would help in assessing the benefits of HAs. Indeed, on a daily basis, the demand for prolonged LE from people with hearing impairment can also impact their social behavior, including avoidance of challenging situations (Hétu et al., 1993), and their quality of life (Gopinath et al., 2012). To quantify the LE perceived on a daily basis, the Effort Assessment Scale (EAS) was designed (Alhanbali et al., 2017), using three items from the SSQ (Gatehouse & Noble, 2004) and a similar visual analog scale 0 to 10, and three items from an unpublished work (Alkhamra, 2010). The EAS was then used to explore the relationship between LE and fatigue, assessed by the Fatigue Assessment Scale (FAS; Michielsen et al., 2004). Factor analysis showed a clear separation between the EAS and the FAS, suggesting that the two scales explore different dimensions for people with hearing impairment, with a weak positive correlation observed between the EAS and the FAS. Alhanbali's EAS thus represents the first questionnaire-type tool that specifically aims to measure LE in situations encountered daily by people with hearing impairment. It is composed of six items, each depicting daily life situations similar to those presented by the SSQ, for which the person needs to evaluate his or her LE on a visual analog scale from 0 (no effort) to 10 (maximum effort).
However, although some items of the EAS were developed from the SSQ, the specific environment (noisy or quiet) in which the listening situation is depicted, is not specified in three EAS items out of 6, leaving it to the interpretation of the person. In fact, only EAS_5 (“Do you have to put in a lot of effort to follow the conversation in a noisy environment?”) refers specifically and explicitly to hearing in noise. Our first pilot tests of the EAS yielded a frequent comment by people, that their answer would differ if the situations depicted were in a noisy or a quiet environment. Because the ability to understand speech in everyday situations is of paramount importance for people with hearing impairment, and because noisy environments are far more common in daily life than completely quiet environments, it seemed relevant to address LE specifically in quiet and noisy environments. Indeed, the difference in LE in quiet and noisy environments could provide some clues pertaining to people's hearing abilities and the potential hearing benefit provided by an HA. We would expect a greater (and earlier in life) increase in LE in noisy situations than in quiet situations. This approach is similar to the one adopted by Smith et al. (2011), for the development of the listening self-efficacy questionnaire, where subscales were designed for listening in quiet conditions, and other subscales were designed for listening in challenging situations.
Therefore, we propose here to extend the EAS, creating an extended version, the Extended version of the EAS (EEAS), to take into account LE in both quiet and noisy situations. This EEAS is then validated in a large group of 481 adults with hearing impairment and hearing aids (HIHA), and a group of 62 individuals with normal hearing (NH), following statistical procedures reported in the international guidelines for health scales validation (e.g., Streiner et al., 2014; Boateng et al., 2018). Item level statistics are provided, in order to assess the contribution and relevance of each item to the scale, offering potential refinement avenues for the choice of items for an LE assessment scale, especially as neither internal structure nor individual item scores and characteristics are available in the seminal EAS papers (Alhanbali et al., 2017, 2018). Finally, external and construct validity assessments involved analysis of correlations between EEAS scores and patients-related variables (such as age, hearing impairment, ear asymmetry) and HA-related variables (total experience of aided hearing, current HA experience, daily HA use, and aided hearing thresholds).
Material and Methods
From the EAS to the Extended EAS
Translation and Validation of a French Language Version of the EAS
The cross-cultural adaptation and French language translation of the EAS followed the same procedures and guidelines as those adopted for the translation and validation of the French language SSQ (Moulin et al., 2015). We used a multistep translation procedure recommended by the European Regulatory Issues on Quality of Life Assessment group (Acquadro et al., 2008), following the same guidelines as in Beaton et al. (2000) and Hall et al. (2018). The first step involved obtaining three independent translations in the target language. As some EAS items are very close to the SSQ items (three EAS items are directly taken from the SSQ), one translation used the validated French language version (Moulin et al., 2015) of the SSQ for those items. In a second step, the independent translations were reviewed by a multidisciplinary translation and expert committee, composed of two French native hearing-care professionals, two speech therapists all with a working knowledge of English, and a bilingual translator previously involved in the translation of the SSQ. Such translation and expert committees have been shown to provide better translation and cultural adaptation of self-report measures as compared to back-translation procedure (Epstein et al., 2015). Still, in a third step, this prefinal EAS translation was back-translated into English by a British native health professional. The expert committee then finalized a first version of the translated EAS, which was formatted along the same lines as the SSQ and French version of the SSQ, that is, the item described on the left, and a visual analog scale graded from 0 to 10 on the right, with large bold fonts to accommodate presbyopia, which is very common in the target population. The fifth step involved a small focus group of 10 French native persons wearing HAs, which were given the EAS and encouraged to comment on the scale, content, and presentation. In the last step, the expert committee took into account the feedback given by the focus group: very minor formatting modifications were made, giving the final French language version of the EAS.
Creation of the Extended EAS
To clearly separate listening in noise from listening in quiet, while remaining as close as possible to the EAS, we duplicated three EAS items (EAS items 1, 2, and 6), adding to them the underlined words either “in quiet” or “in noise.” This led to two three-item subscales, related to the same communication situations, and differing only by the existence of quiet or noisy background: EEASnoise3 and EEASquiet, in a similar way as Smith et al. (2011) did for the listening self-efficacy questionnaire (LSEQ), with items in quiet and items in noisy situations. A 10th item pertaining to the LE perceived in a reverberating environment (e.g., airport, churches, and shopping malls) was added, as this aspect was not present in the original EAS, and as reverberation has been shown to increase LE and adversely affect speech perception (Rennies et al. 2014; Schepker et al., 2016). This resulted in three items pertaining specifically to LE in quiet environments, whereas the remaining seven items pertained to listening in noisy environments and were grouped in a larger EEASnoise subscale. The writing of the added items went through the same expert committee, to ensure the homogeneity of wording of the scale.
The EEAS thus comprises 10 items with the same visual analog scale as the initial EAS. Similar to the SSQ, an option in the form of a “not applicable” box was added to each item to consider situations in which the patient did not want to answer the item because he or she did not understand the question or did not relate to the specific situation described. The resulting EEAS, with correspondence with the original EAS items, is provided in an English translation in Table 1.
Details of Items of the Extended Effort Assessment Scale (EEAS).
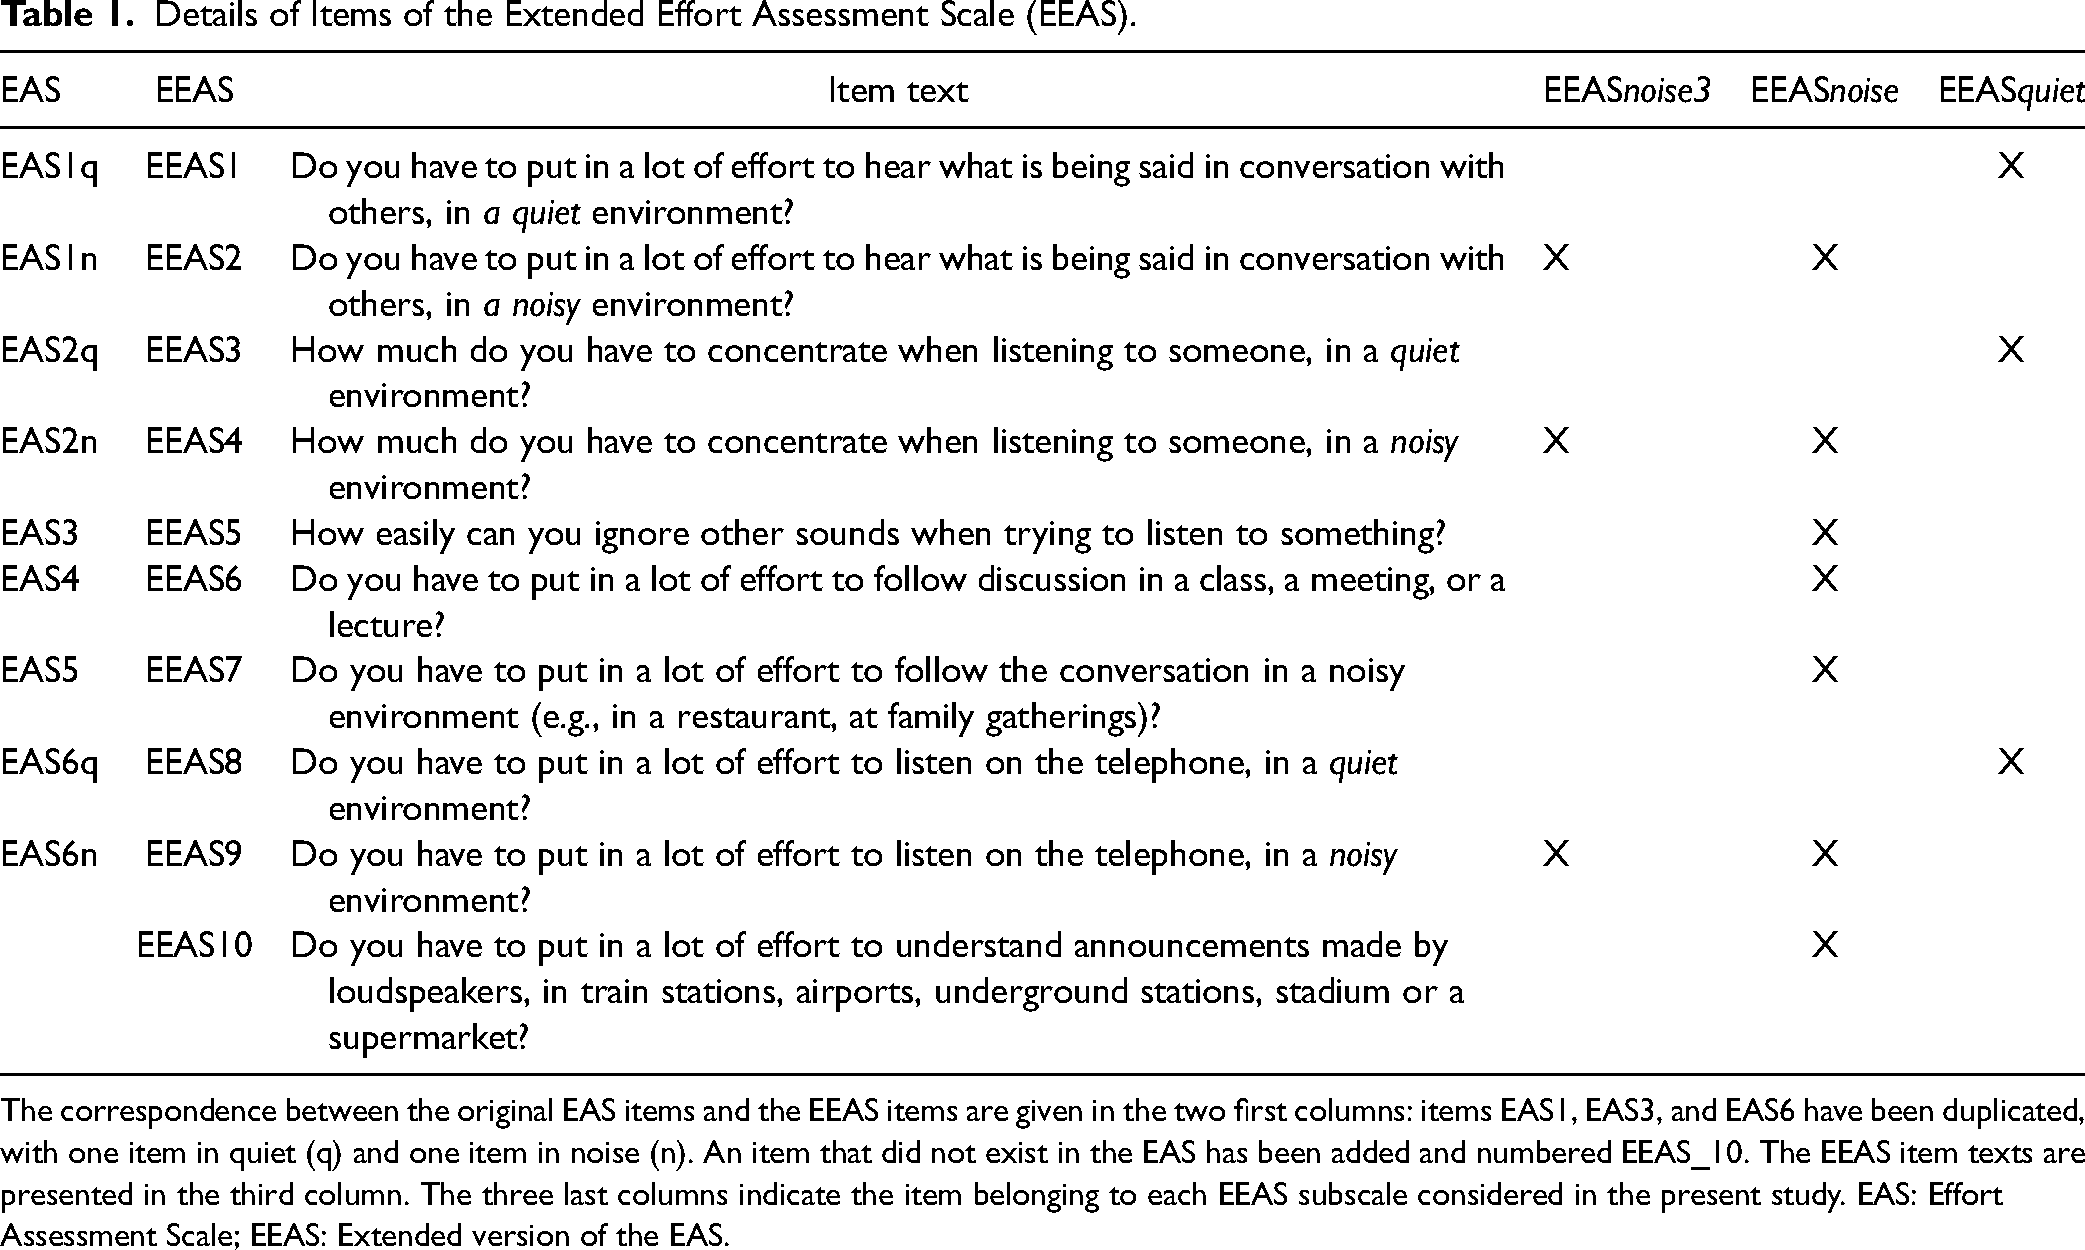
The correspondence between the original EAS items and the EEAS items are given in the two first columns: items EAS1, EAS3, and EAS6 have been duplicated, with one item in quiet (q) and one item in noise (n). An item that did not exist in the EAS has been added and numbered EEAS_10. The EEAS item texts are presented in the third column. The three last columns indicate the item belonging to each EEAS subscale considered in the present study. EAS: Effort Assessment Scale; EEAS: Extended version of the EAS.
Populations Involved
This study was undertaken in agreement with the recommendations guiding physicians in biomedical research involving human participants (Declaration of Helsinki), in agreement with the European General Data Protection Regulation and was approved by an Institutional Review Board (CPP “comité de protection des personnes” of Grenoble Sud-Est V, France, ID-RCB 2019-A00629-48). Written informed consent was obtained from each participant.
Population With Normal Hearing
The population involved 62 adults with NH (38 women) with an average age of 24 years (+ /− 7.22 years) and a maximum age of 35 years, who were free from any hearing problems. The average pure tone threshold (measured at octave frequencies: 250, 500, 1000, 2000, 4000, and 8000 Hz) ranged from 0 to 15 dB HL, with no hearing threshold >20 dB HL at any of the octave audiometric frequencies in both ears.
Population with Hearing Impairment and Hearing Aids
The patient population was recruited from an HA clinic. It was composed of 481 persons with HIHA (56% women), with an average age of 74 years ( + /–11.4 years), an average hearing threshold of 48 dB HL (averaged across octave frequencies from 250 to 8000 Hz) in the better ear ( + /–13.6 dB), and an average gain in the worst ear with an HA of 19.3 dB HL ( + /–11.7 dB). The average aided ear asymmetry was 5.6 dB HL ( + /–11.4 dB) (Figure 1).
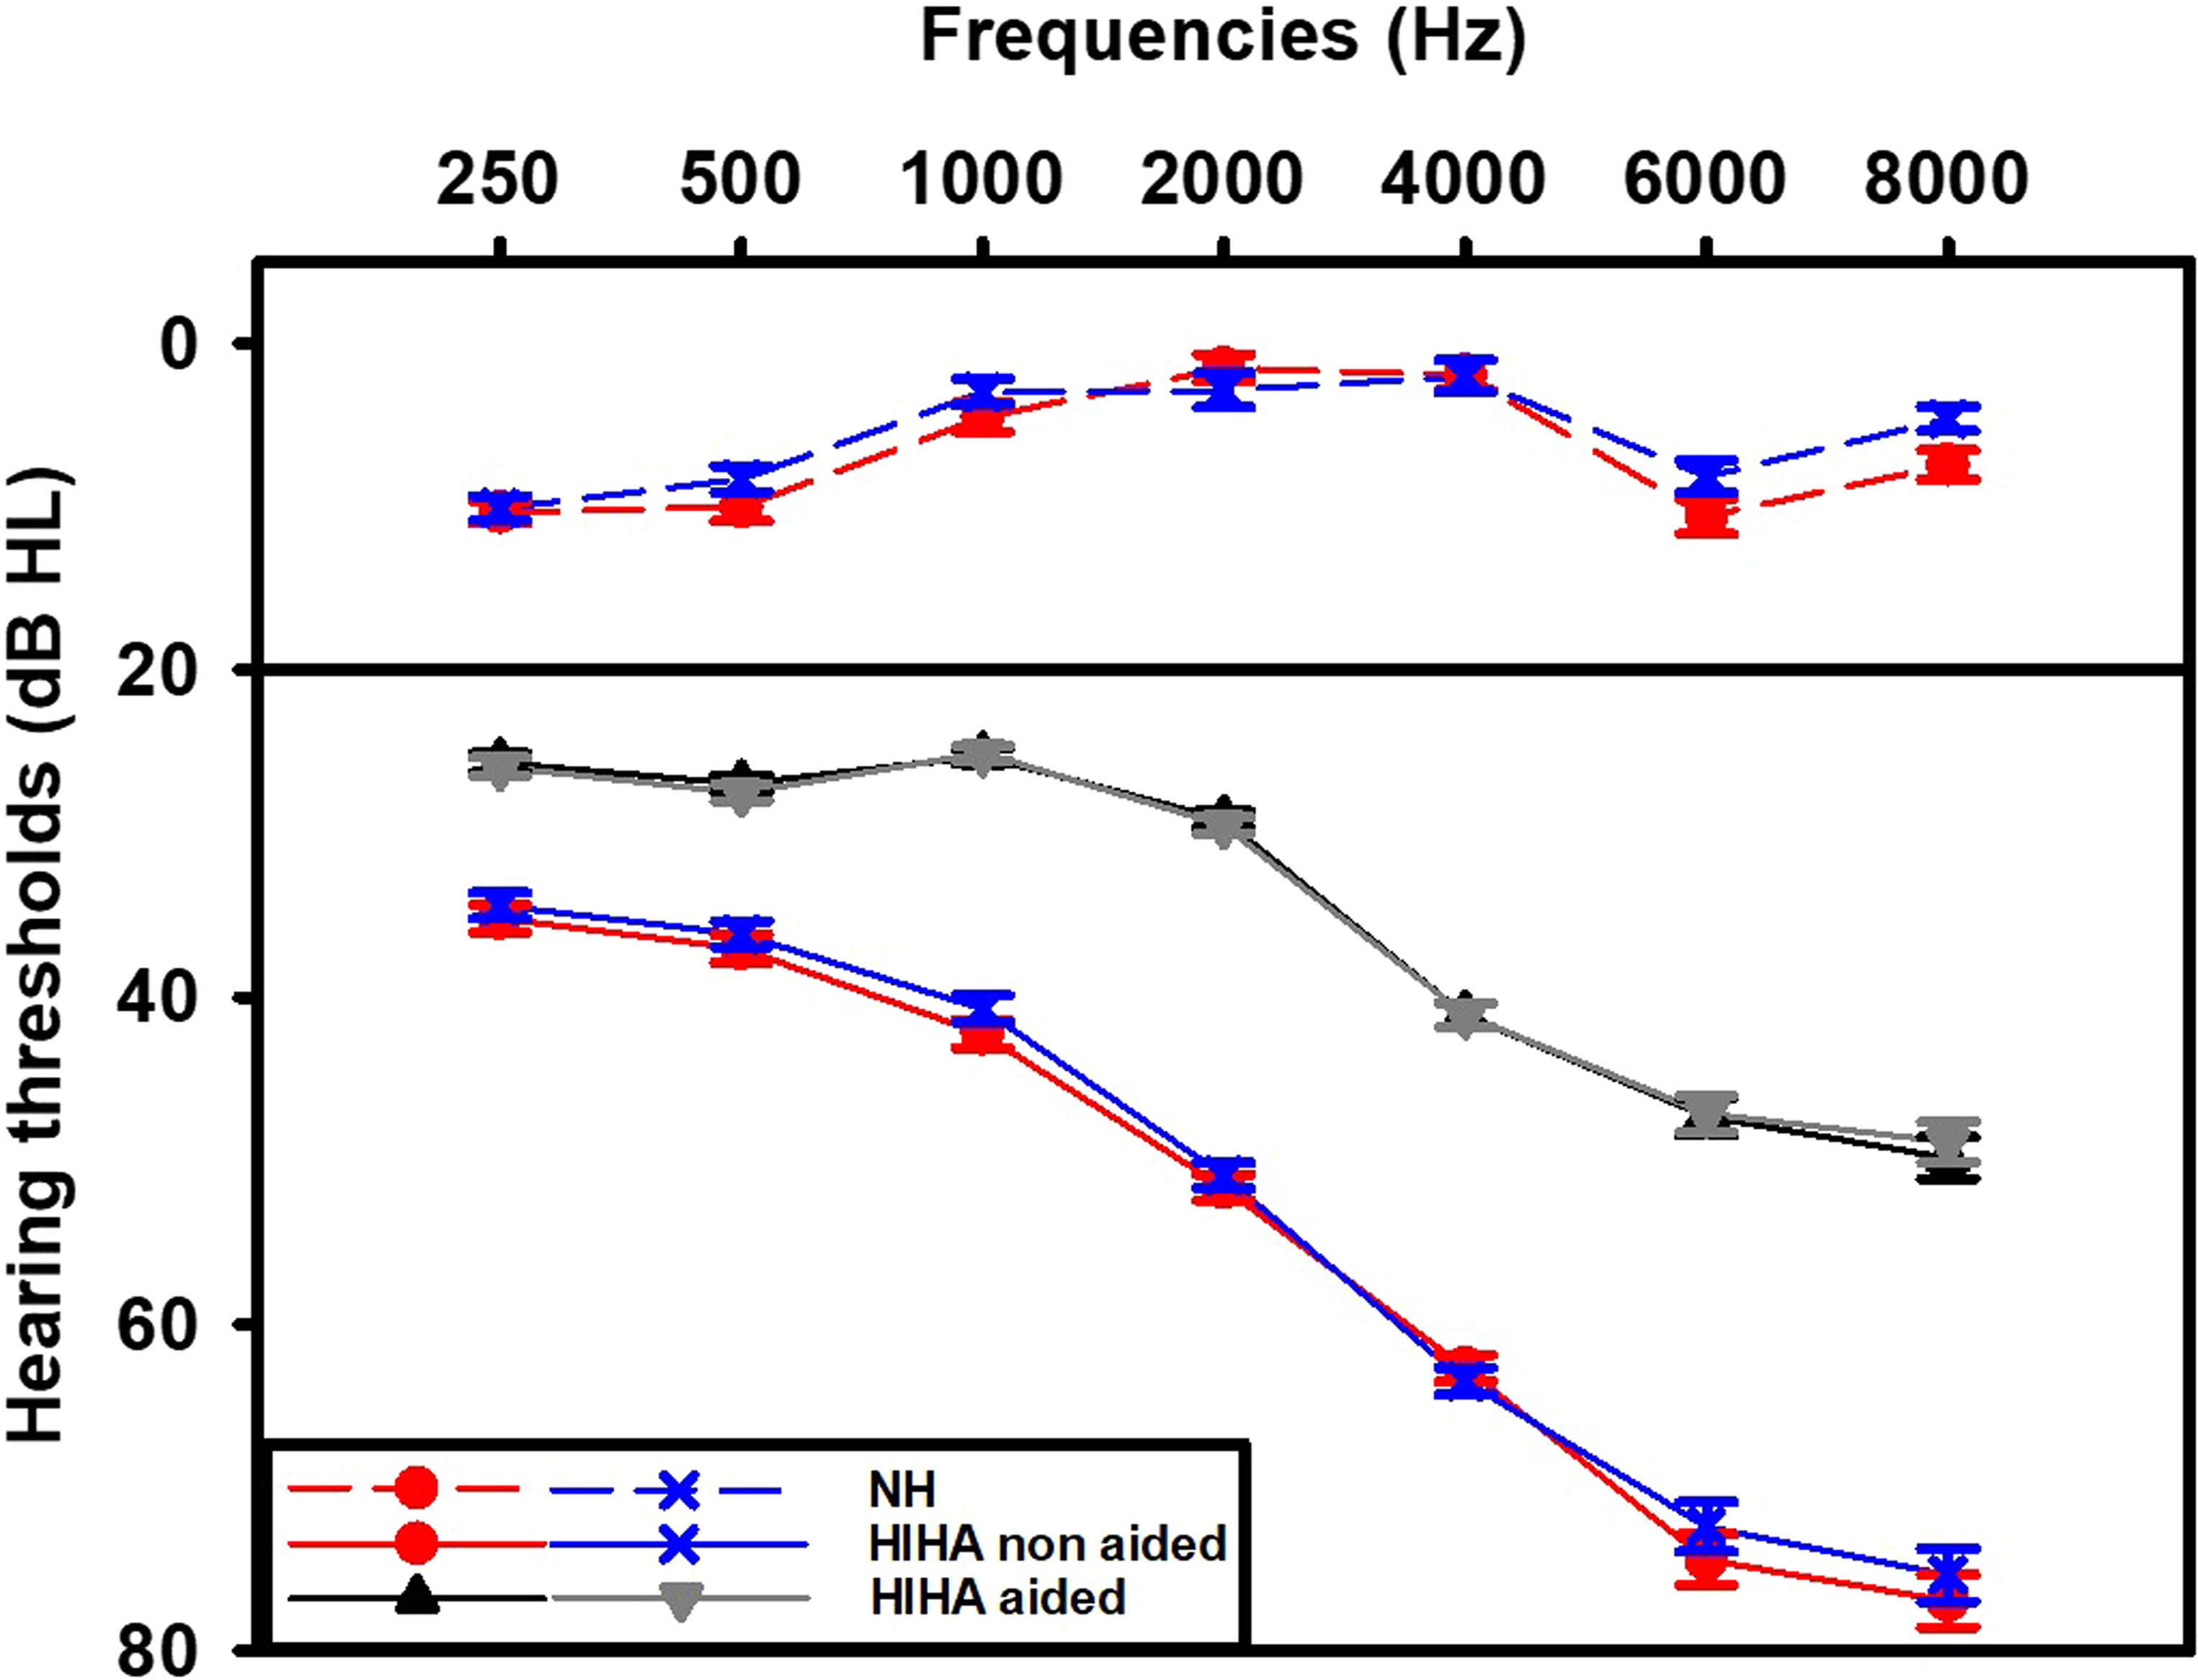
Hearing thresholds (dB HL, mean + /–SD) for the persons with hearing impairment and hearing aids (HIHA), with (gray lines, HIHA) and without hearing aids (red and blue lines, HI). The hearing thresholds of the persons with normal hearing (NH) are presented as red dots for the right ear and blue dots for the left ear (mean + /–sem).
Patients included in the study had to have worn an HA for at least 6 months (there were no new HA wearer) and were free of any cognitive disorders (as ascertained by their health records) that prevented them from being able to read or to understand the questionnaire. Any patient under conservatorship or legal protective measures was excluded from the study. Ninety-two percent of people who wore HAs had bilateral HAs, with 4% with unilateral right ear fitting and 4% with unilateral left ear fitting. They had been fitted with HAs for 4.67 year on average ( + /–5.4 years) with an average age of the current HAs of 0.5 years ( + /–0.02 years). The average daily HA wearing time was 10.8 h ( + /–4.6 h).
Experimental Procedures and Data Collection
Patients were invited to complete the EEAS during one of their usual clinical follow-up assessments or were given the option to complete them at home and return them later.
EEAS Data
The EEAS questionnaire was drawn up in paper format in large print to account for potential mild visual impairments. Each scale had a first page detailing the procedure with a sample question that was used to explain the procedure orally to the patient. Patients were instructed to fill out the questionnaires, in the condition of wearing their HAs.
Audiometric and HAs-Related Data
Audiometric measures were performed in a sound-proof booth. Pure-tone audiometry was performed at octave frequencies for each ear using Astera (Otometrics) audiometric equipment and TDH39 headphones. Aided hearing thresholds were measured using warble tones in a free field with two loudspeakers (Alfa 22, SIARE) placed on each side of the patient. Data pertaining to hearing status and aided hearing were collected as part of the usual clinical follow up: the period (in years) of aided hearing, the age of the current HAs, and the type of fitting (unilateral or bilateral). Daily use of the HAs was collected directly from the data logging facility of the HAs.
Statistical Analysis
Data Collection and Screening
The missing values from the EEAS were handled differently in the internal structure analysis (factor and cluster analysis, consistency measures) from that in the external validity analyses. Patients who showed no missing data (i.e., 344 patients) or a maximum of two missing items for the EEAS were included in the internal structure analysis, that is, 454 patients.
Once the factor structure of the EEAS was ascertained, isolated missing data of the EEAS were replaced by the average calculated within each subscale for a given patient when at least two out of three items were present for the three-item subscales. This person mean substitution method is actually one of the most commonly used for health-related questionnaires (Streiner et al., 2014) and has been shown one of the best methods of imputation, in a comparative study by Huisman (1999), especially in scales with a high number of response options (which is the case for EEAS), and for a rate of missing values lower than 5% (which is the case in the present study).
Most of the variables showed a deviation from normality, as shown by the Shapiro–Wilk test (Shapiro & Wilk, 1965). However, according to the central limit theorem, the means of large samples (i.e., samples >50) tend to follow a normal distribution regardless of the distribution of the observations themselves (e.g., Field et al. 2012). In such large data samples, small deviations from normality can be picked up by normality tests even though these small deviations do not affect parametric test results (Ghasemi & Zahediasl, 2012). Therefore, we used parametric tests and checked the normality of residuals. The variables “experience with HAs” and “current HA's age” were log transformed.
The better ear hearing threshold (unaided and aided) was calculated as the minimum hearing threshold of both ears (unaided and aided) averaged across 0.5, 1, 2, and 4 kHz.
Ear asymmetry (aided and unaided) was calculated as the absolute value of the difference between the hearing thresholds of each ear (unaided and aided) averaged across 0.5, 1, 2, and 4 kHz.
Scales and Subscale Score Calculation
Different EEAS scores were tested and the different items considered per subscales are presented in Table 1:
EEASquiet (average of EEAS_1, EEAS_3, and EEAS_8) represents the “quiet” subscale score; EEASnoise3 (average of EEAS_2, EEAS_4, and EEAS_9) is the score for a “noise3” subscale, that corresponds to the same questions as of the quiet scale but in the context of a noisy environment. EEASnoisy–quiet is the difference score between the two subscales (EEASnoise–EEASquiet), as more than 97% of participants reported a greater effort in noisy situations than in quiet situations. EEASnoise (average of EEAS_2, EEAS_4 to EEAS_7, and EEAS_9, EEAS_10) is the score for a “noisy” subscale, corresponding to all the seven items (out of 10) related to a noisy environment. EASc is the score corresponding to the average of the same six items of the original EAS (with each of the three items that had been duplicated averaged between quiet and noisy situations), calculated to be as close as possible to the original EAS; EEAS is the total EEAS score corresponding to the average of the 10 EEAS items.
Internal Structural Analyses
An exploratory factor analysis (EFA) was conducted on the EEAS scores obtained from the HIHA to ascertain its internal structure.
The procedures for the EFA were similar to those previously used for this type of scale (e.g., Akeroyd et al., 2014; Moulin et al., 2015), that is, a factor extraction performed on a correlation matrix with a maximum likelihood method and an oblique rotation method (oblimin). The output of the EFA was compared to the results obtained by Revelle's cluster analysis (Revelle, 1978, 1979). All statistics were performed using R statistical software version 3.5.1 (2018-07-02), Revelle's “psych” package for R version 1.9.12.31 and the “GPArotation” package for R.
As skewness (ranging from −0.68 to 0.89) and kurtosis (ranging from 1.9 to 2.9, with a mean at 2.3) were well within the limits considered for structural equation modeling (Brown, 2015) and as the ratio of the number of participants to the number of variables was well above 10:1 (which is considered a requirement for a stable EFA; Fabrigar et al., 1999), we chose a parametric correlation matrix as the input to the EFA. The Kaiser-Meyer-Olkin measure of sampling adequacy was 0.87, which is considered “meritorious” (Kaiser, 1970). Bartlett's test was highly statistically significant (chi-squared = 3270, df = 45, p < 10−20), confirming that correlations between individual items were sufficient. Correlation matrix analysis did not show any correlation >0.85, hence ruling out multicollinearity problems. The number of factors to be extracted was determined by the commonly used subjective Cattel's scree test and by the more objective parallel analysis (Horn, 1965). As correlations between the different factors are to be expected, an oblique factor rotation method (direct oblimin) was used, similarly to previous studies of the SSQ internal structure. The cross-loadings of items on different factors are mentioned only if >0.20.
The internal structure was evaluated as well by Revelle's clustering method (Revelle, 1978; 1979), which identifies the first pairs of items with the greatest similarity and then adds other items one by one only if the addition of the item improves internal consistency (measured by the α coefficient [Cronbach's α]) and homogeneity (explored by Revelle's β coefficient, which is the worst split-half reproducibility). This method has the advantage of better identifying relationships between items and being less sensitive to the sample size and the conditions to be met for a stable factor analysis (Cooksey & Soutar, 2006). This procedure, particularly adapted to scale construction, results in a graphical display of clusters reflecting the internal structure of the scale and has been used to complement classical factor analysis for the SSQ (Moulin et al., 2015; Moulin et al., 2019) and Spatial Hearing Questionnaire (SHQ) (Moulin & Richard, 2016).
Internal consistency was assessed by calculating both item-to-total correlations and Cronbach's α (Cronbach, 1951) for each participant group and for each subscale as determined by the outcome of internal structural analysis.
Score Comparisons
The EEAS scores were compared between both groups (NH and HIHA) using mixed analysis of variance (M_ANOVA) with group as the intersubject variable and the EEAS subscales as the intrasubject variable. In the case of nonsphericity, Greenhouse-Geisser's correction was applied. Holm's correction was used for post hoc tests, and effect sizes are given in the form of Cohen's d, with small effect (d = 0.2), medium (d = 0.5), and large effect (d > = 0.8) (Cohen, 1992).
Similarly to Alhanbali et al. (2017), the 95th percentile of EEAS scores in NH was used as a cutoff value to identify participants with “extreme or pathological” LE. The percentages of HIHA with “extreme” LE were determined for each scale and subscale and compared using McNemar tests (McNemar, 1947). The discrimination power of the EEAS (and subscales) to distinguish HIHA from NH was further assessed using receiver operating characteristics (ROC) curves, using Robin et al.’s (2011) pROC R package and López-Ratón et al.’s (2014) Optimal cutpoints R package.
Correlation Analysis
Correlations between variables were assessed using Pearson's r coefficient as the sample was larger than 300 participants, and correlation coefficients were compared using Fisher's z scores (Steiger, 1980).
Correlations were performed between EEAS and subscales scores for the 472 HIHA on the one hand and for the 62 NH on the other. Correlations between EEAS and patient characteristics (age, hearing threshold, ear asymmetry, aided hearing thresholds, aided ear asymmetry, daily HA use, age of current Has, and age of aided hearing) were performed using listwise deletion, hence on a smaller group of 366 patients with HIHAs. All p values for all correlations were entered into the Benjamini–Hochberg procedure (Benjamini & Hochberg, 1995) with a false discovery rate of 0.05, for multiplicity correction. However, for clarity purposes, p values are systematically mentioned but only the p adjusted values (padj) corresponding to p values >.0001 and <.05 are specified in the manuscript.
Multiregression Analysis
Multiregression analysis was performed to determine the potential differential influences of several factors on EEAS scores, using listwise deletion, which resulted in a group of 434 patients.
This group was then split into two subgroups, based on the total HA experience. Indeed, although our population did not include HA wearers of less than 6 months (i.e., to be sure to be outside the main period of acclimatization), we sought to analyze the evolution of LE with HA experience in two subgroups: one group of 106 HIHA that had been fitted with HAs for 6 to 24 months (people who have been recently fitted with HAs) and one group of 281 HIHA that had been wearing HAs for at least 2 years (people with long HA experience).
The same analysis was performed for the whole group, and then separately for the two subgroups. The analysis was performed in two steps: step 1 included better ear hearing threshold and ear asymmetry, as those variables correlated with the EEAS scores. In step 2, we introduced nonhearing factors, such as age and gender, and factors pertaining to patients’ HA history and thresholds: aided better ear threshold, aided ear asymmetry, total experience (in years) of aided hearing, age of current HAs (in years) and daily use of HAs (in hours). Only the factors that showed a significant influence on EEAS scores in, at least, one subscale, were kept. Pearson correlation analysis was performed among all the independent variables to ascertain the absence of multicollinearity. The maximum correlation coefficient obtained was between unaided and aided better ear thresholds (r = 0.68, p < .0001), which is well below the recommended cutoff value of 0.9. The variance inflation factor remained under 2.3 for all regressions and factors, and the Durbin–Watson test of autocorrelation remained nonsignificant. The normality of residuals was assessed using normal qq plots and histograms of standardized residuals.
Results
EEAS's Internal Structure and Consistency
Cattel's scree test of the EFA gave a potential number of factors to be extracted of 2, and Horn's parallel analysis (Horn, 1965) gave two factors with eigenvalues of 5.87 and 1.13. The two-factor extraction explained 65% of the total variance (36% and 29%, respectively). Communalities ranged from 0.4 (EEAS_5 and EEAS_10) to 0.99, with a mean of 0.65. After oblique rotation, EEAS_1, EEAS_3, and EEAS_8 loaded on factor 2 (20% of variance explained) with a cross-loading of EEAS_8 on both factors (see table of factor loadings and model fit indexes in Supplemental material, page 1). All the other items loaded on factor 1 (44% of variance explained), with cross-loadings for EEAS_6. The lowest loading was observed for EEAS_5. The correlation between both factors was 0.55.
Cluster analysis (Figure 2) showed two homogeneous subclusters: one consisting of EEAS_1, EEAS_3, and EEAS_8 (the “quiet” factor, with α at 0.84 and β at 0.77) and the other grouping items EEAS_2, EEAS_4, and EEAS_6, EEAS_7, and EEAS_9 (the “noise” factor, with α at 0.93 and β at 0.82). However, the addition of EEAS_5 and EEAS_10 to the latter induced a loss of homogeneity (α at 0.92, β at 0.77). Cluster analysis also showed that the EEAS involved more than one dimension, and the grouping of both the “quiet” and “noise” factors within the same cluster gave a low β coefficient at 0.78 (with α at 0.92). Hence, a 2-factor structure was retained for the EEAS with two subscales: EEASquiet and EEASnoise.

Hierarchical cluster analysis performed on the 10 items of the Extended version of the Effort Assessment Scale (EEAS) on a population of 454 persons with hearing impairment and hearing aids (HIHA). The most similar items are combined first, and items are added to the most similar cluster so that clusters grow from left to right. For each cluster, the alpha and Revelle's beta coefficients are given and represent indexes of consistency and homogeneity. Here, subcluster C6 represents the “quiet” subscale, whereas C4 represents the “noise3” subscale. Items 5, 6, and 10 behave differently from the others but are still grouped in cluster C8, representing the EEASnoise subscale.
The consistency indexes were good for the EEAS, with item-to-total correlations ranging from 0.62 (EEAS_5) to 0.82 with a mean of 0.71. Cronbach's α was 0.92 for the EEAS, 0.83 for EEASquiet, 0.91 for EEASnoise3, and 0.92 for EEASnoise (see table of item-to-total correlations in Supplemental material, page 2).
Comparison of Scores Between NH and HIHA
The percentage of missing (or nonapplicable) answers across items ranged from 0.21% (EEAS_1) to 12.89% for EEAS_6, with an average of 3.14% across the 10 EEAS items. EEAS_6 was, by far, the most “missed” item. A total of 80.2% of patients (i.e., 386) did not have any missing answers on the EEAS, 13.9% had one missing answer, 3.1% had two missing answers, and 2.7% had three or more missing answers. The number of extreme values (i.e., 0 or 10) was counted per person, in order to assess the possibility of an extreme value bias. In HIHA, the median of extreme values was 1, with <2% of HIHA reporting more than seven extreme values (out of 10), and the median was three for NH, with a greater occurrence of 0 values (“no effort”) as expected (Supplemental material, page 3).
EEAS scores were significantly greater in HIHA (5.1, SD = 2.05) than in NH (2.52, SD = 1.6), t = 9.4, p < 10−17 with Cohen's d at 1.27 (Figure 3).

Extended version of the Effort Assessment Scale (EEAS) scores for a group of 62 participants with normal hearing (NH, light blue) and 481 persons with hearing impairment and hearing aids (HIHA, dark blue). (a) The median of each item of the EEAS (light blue squares for NH and dark blue dots for HIHA), with comparative data from Cañete's Danish EAS (Cañete et al. 2022), on 13 young NH (small orange squares), 47 persons with no hearing aid (HI, small red dots), and 47 persons with hearing aids (small dark red triangles, HIHA). The horizontal axis shows the EEAS items number (in black), with the corresponding EAS item numbers (in blue). The three items of the EEASquiet subscale are circled in green whereas the three corresponding items of the EEASnoise3 scale are circled in red. (b) The box and whiskers plots of the total scores and subscale scores of the EEAS, with dark blue for HIHA and light blue for NH. The mean is represented by the red dotted lines, and the median is represented by the black lines.
All EEAS item scores in HIHA were significantly greater than those in NH (mixed ANOVA (group × items) F(1, 532) = 89.54, p < .001, η2 = 0.079), with a weak but statistically significant interaction between group × items (F(6.42, 3414) = 5.6, p < .001, η2 = 0.004). For each item, the effect size (measured by Cohen's d) ranged from 0.62 (EEAS_9) to 0.82 (EEAS_10) and 1.27 (EEAS_7). The mean of both groups showed a similar pattern across items (Figure 3a), with a strong correlation across the 10 items between the two patterns (r = 0.94, p < .001), that is, the items with the lowest (or highest) scores were the same for both groups. However, there was no significant relationship between the variabilities across the 10 items between the two groups (r = 0.55, p = ns). The median for each group as a function of the item number, is shown alongside data from the Danish EAS (Cañete et al., 2022), obtained from several groups, for comparison purposes (Figure 3a).
The analysis per subscale is shown in Figure 3b. Whether for the total EEAS scores (5.07, SD = 2.14; F(1,532) = 88.54, p < .001, η2 = 0.143) or the EEASnoise scores (6.03, SD = 2.38, F(1, 532) = 82.52, p < .001, η2 = 0.134) and EEASquiet scores (2.78, SD = 2.15; F(1, 540) = 60.41, p < .001, η2 = 0.101), the LE measured by the EEAS was consistently significantly greater for HIHA than for NH with Cohen's d at 1.27, 1.23, and 1.05 for the total, EEASnoise and EEASquiet scores, respectively. Mixed ANOVA (group × EEASquiet & EEASnoise subscales) showed a significant group effect (F(1, 523) = 75.87, p < .001, η2 = 0.077) and a tendency toward an interaction (F(1.003, 533.506) = 5.373, p < .021) with a very weak effect size (η2 = 0.001). When calculated with the EEASnoise3 subscale, this interaction was not statistically significant. No significant differences were obtained between the two EEAS noise subscales. No statistically significant difference was obtained in the differential score EEASnoise–quiet between both groups F(1, 540) = 2, p = .16, with 3.3 (SD = 1.9) for the NH group versus 3.7 (SD = 2.1) for the HIHA group. However, if we select people having an EEASquiet score lower than 5, the same analysis shows a statistically significant interaction between subscales and group (HIHA and NH): F(1,440) = 8.5, p = .004, η2 = 0.003. This was confirmed by the significant difference in the EEAS difference score, between NH (3.3, SD = 1.9, n = 62) and HIHA (4.05, SD = 1.9, n = 380).
The different subscales correlated strongly with each other (Figure 4), with correlation coefficients ranging from 0.58 (EEASnoise3 vs. EEASquiet) to 0.94 (EEASnoise vs. EEAS noise3) for HIHA. The correlations for HIHA and NH are shown separately in supplemental material (page 4). For HIHA, the EEASnoise–quiet score depended significantly more on EEASnoise (r = 0.56, p < .0001) than on EEASquiet (r = −0.36, p < .0001) (z = 5.3, p < .0001). For NH, the stronger dependence of EEASnoise–quiet on EEASnoise (r = 0.92, p < .0001) than on EEASquiet (r = 0.21, p = ns; z > 10, p < .0001) was even greater than that for HIHA. The EASc scores were similar to the EEAS scores, and the correlation between the EASc and EEAS scores was r = 0.987, p <.0001. The EEASquiet subscale showed a weak but significant nonlinear relationship with the other subscales, with a stronger increase in EEASnoise for low EEASquiet scores, than for greater EEASquiet scores: 46% of variance (r = 0.68) was shared between EEASnoise and EEASquiet, using a cubic polynomial model, versus 40% using a linear model (F(3, 468) = 108.3, p < 2.3 × 10⁻¹⁶). Similar cubic polynomial relationships were obtained between EEASquiet and EEASnoise3, the EEAS total score and the EAS score (Figure 4).

Scatter plots of the correlations between the different Extended version of the Effort Assessment Scale (EEAS) scores and subscale scores, obtained in 472 persons with hearing aid (gray dots) and in 62 persons with normal hearing (cyan triangles). The correlation coefficients are mentioned in each panel. When a nonlinear relationship was significantly better than a linear one, both linear regression line (in red), and nonlinear relationship (in blue) are mentioned, and the correlation coefficient pertaining to the nonlinear relationship is mentioned in italics. All correlations are highly statistically significant (p < .0001).
EEAS’s Performance at Classifying HIHA and NH
The cutoff scores were obtained from the 95th percentile of the EEAS score. From there, the percentage of HIHA in the “extreme” range was calculated and ranged from 42% (for EEASnoise3) to 57.4 (for EEAS). The percentages of excess effort were significantly greater for EEASquiet (52.9%) than for EEASnoise3 (41.9%) (χ2 = 17.5, (1), p < .0001) and EEASnoise (46.7%) (χ2 = 5.7, (1), p < .02). There was a weak but significant difference between EEAS (57.2%) and EEASquiet (52.9%) (χ2 = 4.4, (1), p < .04).
The ROC analysis (Figure 5, left panel) showed an area under the curve (AUC) of 0.83 for both EEAS and EASc scores, with EEASquiet at 0.82 and EEASnoise at 0.81, without any significant difference. However, EEASnoise3 subscale was significantly underperforming, with an AUC significantly lower than the others (0.78 versus 0.81 for EEASnoise, Z = 3.4, p < .0006). The AUC was calculated for each individual EEAS item (Supplemental material, page 5) and ranged from 0.68 to 0.82 (for EEAS_1). The lowest AUC values were obtained for EEAS_9 (AUC = 0.68), EEAS_5 and EEAS_10 (both AUC at 0.73). The EEASnoise–quiet difference score was not discriminant at all, with an AUC at 0.55.

Left panel: receiver operating characteristic curves (ROC) for each Extended version of the Effort Assessment Scale (EEAS) scale and subscale scores, using 62 persons with normal hearing as controls and 472 persons with hearing aids as patients. The areas under the curve (AUC) are mentioned in brackets for each scale and subscale. Right panel: each arrow indicates the cutoff value scores calculated from the ROC analysis, as the point of identical sensitivity and specificity. Sensitivity is indicated in dark colors, and specificity in light colors, as a function of the EEAS score.
The cutoff EEAS scores optimizing both sensitivity and specificity of the EEAS as a test able to distinguish HIHA from NH, were 3.75 for both EEAS and EASc, 1 for EEASquiet and 4.7 for EEASnoise (Figure 5, right panel). The cutoff scores obtained, using the ROC method, are presented for each individual item, with the corresponding sensitivity and specificity, in Supplemental material (page 5).
External Validity
Self-Report Measures and Hearing-Related Factors
Correlations performed between self-report measures and patients’ related variables for 366 HIHA patients are displayed in Table 2 (and in the form of scatterplots in Supplemental material, page 6). EEAS scores increased significantly as better ear hearing threshold increased (r = 0.20, p < 9 × 10⁻⁵, padj < .0002), aided better ear hearing threshold (r = 0.13, p < .016, padj < .03) and ear asymmetry increased (r = 0.14, p < .0075, padj < .02). EEAS scores (and EEASquiet and EEASnoise) increased significantly with increasing HA experience (r = 0.28, p < 4×10⁻⁸) and the current HA's age (r = 0.14, p < .009, padj < .02), with a significantly stronger correlation with HA experience (z = 2.5, p < .012 for EEAS; z = 2.7, p < .007 for EEASnoise). There was no significant correlation between EEAS and age, nor between EEAS and daily HA use. EEASquiet increased significantly with both ear asymmetry (r = 0.20, p < .00016, padj < .0005) and aided ear asymmetry (r = 0.20, p < .0002, padj < .0004) and in a significantly stronger manner than EEASnoise (r = 0.08, p = ns; z = 2.7, p < .008).
Correlations between Self-Report Measures (EEAS) and Patients' Characteristics.

Pearson correlation coefficients between self-report measures (EEAS) and patients’ characteristics (age in years, unaided and aided better ear HTs (taken as the PTA averaged across 0.5, 1, 2, and 4 kHz) and ear asymmetry (absolute difference between right ear and left ear audiometric thresholds), current hearing aid experience, total hearing aid experience) obtained in 366 persons With hearing impairment and hearing aids.
All p values have been adjusted (padj) for multiplicity, using the false discovery rate approach. Bold: padj <.05; bold on light gray background: padj <.0005; bold on gray background: padj <10−6. EAS: Effort Assessment Scale; EEAS: Extended version of the EAS; HA: hearing aid; HT: hearing threshold; PTA: pure tone audiometry.
EEAS Scores and Most Influential Hearing-Related Factors
Whole HIHA Population
Multiple regression analyses were run to identify the most important factors influencing EEAS and subscales scores, using the factors that correlated significantly with the EEAS and subscale scores, that is, better ear hearing threshold and hearing asymmetry measures with and without HAs, current HA's age and total HA experience. Daily HA use was not a significant predictor of EEAS scores. Three factors, that is, aided ear asymmetry, aided better ear hearing threshold and current HA's age, did not show any statistically significant influence regardless of the scale or subscale analyzed. Therefore, they were dropped from the list of factors.
All the models built using the same three factors, namely better ear hearing threshold, ear asymmetry, and total HA experience, significantly predicted the EEAS (and its subscale scores), with F(3, 433) = 19.1, p < 1.3 × 10⁻¹¹, R2 = 0.12. Furthermore, each of the two steps led to statistically significant models, with the variable pertaining to the total HA experience having a significant influence and the most important contribution to the overall models. However, the percentage of variance explained by the models remained low, between 7% and 12%. Table 3 summarizes the multiregression results obtained with the three factors for the EEAS and its subscales. Further details are given in Supplemental material (page 7).
Results of Multiregression Analysis Performed on the EEAS Scores Collected on 434 Persons with Hearing Impairment and Hearing Aid.

The same factors have been used throughout. A first model (H0) used the better ear hearing threshold (PTA average at 0.5, 1, 2, and 4 kHz) and ear asymmetry (absolute difference between right ear and left ear audiometric thresholds) as factors. The second model (H1) added total HA experience (total HA experience in years, log transformed). The columns present, from left to right, the different subscales, the model (labelled H0 and H1), the factors, the unstandardized coefficients (nonstandardized), SE, standardized coefficients (beta), t statistics, and associated p values. The last column gives the correlation coefficient (r) and underneath, in italics, the associated p value. More details are presented in Supplemental material, including the same analysis performed for each EEAS item. EAS: Effort Assessment Scale; EEAS: Extended version of the EAS; HA: hearing aid; PTA: pure tone audiometry; SE: standard error.
The main factors were total HA experience (β = 0.20) and, to a lesser degree, a better ear threshold (β = 0.18) and ear asymmetry (β = 0.15). The effort reported by the patients increased by 1.0 points (SE = 0.23) per log(years of total HA experience), corresponding to an average increase of 0.75 points per 10 years of HA experience. For both EEAS noise subscales, the percentage of variance explained by HA experience increased (β = 0.21), comparatively to the other factors (β = 0.16 and β = 0.12 for, respectively, better ear threshold and ear asymmetry). This was even clearer for the EEASnoise3 subscale scores, that were strongly predicted by HA experience (β = 0.21, with score increasing by 1.17 point per log(years of HA experience), corresponding to an average of 0.9 points increase per 10 years of HA experience. However, EEASnoise3 subscale were not statistically predicted by ear asymmetry, and barely by better ear threshold (β = 0.11, p = .022). A different pattern emerged for EEASquiet: the main factors were better ear hearing threshold (β = 0.19) and ear asymmetry (β = 0.19), with β = 0.125 for HA experience. The difference EEASnoise–quiet scores showed a weak but significant relationship with ear asymmetry (β = −0.11) and HA experience (β = 0.12), in a weakly significant model (F(3,433) = 3.3, p <.02, r = 0.15).
The same analysis per individual EEAS item showed a prominent and statistically significant influence of HA experience on EEAS scores for EEAS_2, EEAS_4, EEAS_5, EEAS_7, EEAS_9, and EEAS_10. For items EEAS_1, EEAS_3, EEAS_6, and EEAS_8 (i.e., the three “in quiet” items, and EEAS_6), the most influential factor was better ear hearing threshold (Supplemental material, page 7).
As both LE and total HA experience significantly increased with better ear hearing threshold, we checked that the relationship between LE and total HA experience was not entirely due to a mediation (an indirect effect) by better ear hearing threshold. Mediation analysis evidenced a highly significant direct effect of total HA experience on LE (with more than 1 point increase in EEAS per log(years in HA experience) (1.051 (SE = 0.227), z = 4.6, p = 3.5 × 10⁻⁶), a significant but weaker indirect effect mediated by better ear hearing threshold (0.216, (SE = 0.072), z = 3, p = .003) that represented only 17% of the effect seen (total effect estimate: (1.267 (SE = 0.22), z = 5.73, p = 10−8). Similar results were obtained for EEASnoise, with a small partial mediation effect by better ear hearing threshold that could not explain the entire relationship between LE and total HA experience.
Experienced and Less Experienced HIHA
For people with a long HA experience, multiregression analysis showed the same main effects on EAS scores than the total population, that is, an increase in EEAS score and EEASnoise with the total HA experience: F(3,280) = 7.7, p < 6 × 10⁻⁵, r = 0.28, with the main factor being the total HA experience (β = 0.19, t = 3, p = .002), and then the best ear hearing threshold (β = 0.15, t = 2.5, p < .02). The EEAS score increased by 1.245 (SE = 0.4) per log(years of HA experience), corresponding to an average increase of 0.97 point per 10 years of HA experience. This effect was even stronger for EEASnoise (increase of 1.43 (SE = 0.44) per log(years of HA experience), and not statistically significant for EEASquiet. Per item analysis showed that the greatest increase in LE as a function of total HA experience, was observed for EEAS_2, EEAS_5, EEAS_6, and EEAS_7.
In the group of people recently provided with HAs (between six and 24 months), a statistically significant decrease in EEASnoise score was obtained with the total HA experience: F(3,105) = 4.85, p < .003, r = 0.35 in a model explaining 12.5% of the EEASnoise variance. The main factor was ear asymmetry (β = 0.21, t = 2.2, p < .04), and then the total HA experience (β = −0.198, t = −2.1, p < .04). The EEASnoise score decreased significantly by 3.375 (SE = 1.6) per log(years of HA experience), corresponding to an average decrease of 2.6 points per 10 years of HA experience. This effect was not statistically significant for EEAS, nor EEASnoise3, nor EEASquiet. Per EEAS item analysis showed a significant decrease in EEAS_6 (−4.23 point, SE = 2.1), EEAS_7 and EEAS_10 (−4.51, SE = 2.3).
Discussion
This study was aimed at assessing LE in daily life of adults with HAs, in the two different contexts of listening in quiet and listening in noisy situations, using a self-report measure, and at validating this self-report measure following the international guidelines pertaining to scale validation (Boateng et al., 2018; Streiner et al., 2014). To this aim, we built upon Alhanbali's EAS, which is, as stated by the authors, the first validated scale purposely designed to self-assess LE in daily life of persons with hearing impairment. The six items of the EAS were completed with four other items to develop an extended version of the EAS (the EEAS), which is able to clearly separate LE reported by patients in quiet situations and in noisy situations. Our large sample allowed us to perform a detailed analysis of the internal structure of the EEAS, and to assess the relative contribution of each EEAS item and therefore of each one of the original six EAS items. Furthermore, it allowed the evaluation of the external validity of the EEAS, and to compare the evolution of LE in a group of people recently provided with HAs (6 to <24 months of HA experience), and in a group of people with at least 24 months of HA experience.
Comparisons Between EAS and EEAS
Because one of our aims was to establish normative values for the EEAS, we chose a strictly controlled NH group (i.e., age below 35 and maximum worse ear hearing threshold below 15 dB HL), in contrast to Alhanbali et al. (2017), whose control group was of a similar age as their HI group and who therefore used less strict hearing threshold criteria. We obtained very similar scores: the median EEAS score was 2.17 (2.1 for the EASc), that is, very close to Alhanbali's control group score (approximately 2.0) and to Cañete et al.’s young NH scores (Cañete et al., 2022). The interquartile range was 1.2 to 3.6, which was reduced when compared to Alhanbali's NH group (approximately 1–4), but on par with Cañete et al.’s results on young NH (as pictured in Figure 3). The reduced range obtained here and in Cañete et al.’s data can be easily explained by the more homogenous NH group tested (i.e., young NH vs. older NH). The pattern of the median score per item is similar between the present data and Cañete et al.’s data, with the greatest value obtained for EEAS_7 (EAS_5), and the lowest for EEAS_8 (EAS_6). However, their young participants with NH’s scores for the EAS items are half-way between the “quiet” and the “noisy” version of the corresponding EEAS items, showing that the interpretation of the situation differs between patients, when the presence (or absence) of background noise is not explicitly mentioned. The full EAS median values reported for control participants by Alhanbali et al. (2017) and Cañete et al. (2022) fall between the EEASquiet and EEASnoise3 medians of the present data.
The EEAS scores for HIHA are more difficult to compare with literature data, due to likely differences in hearing loss and patients-related data between studies. The comparison between Cañete et al.'s data and ours, per item, on HIHA, suggests that their patients tended to answer the EAS_1 and EAS_2 as if the situation depicted was in noise. This is less obvious for EAS_6 (“listening on the phone”) whose low score in Cañete et al.'s data, comparatively to the other EAS items, is attributed to either the use of streaming technology that lowers the effort perceived, or a low score given by default by patients not using the phone, as their EAS did not have a “nonapplicable” option. Our results allow to eliminate this second hypothesis, as we did not have more “nonapplicable” answers to that item than for other items, and to offer a new one: for that specific item, it seems that patients answer as if the situation depicted was in a quiet environment, rather than in a noisy one: indeed, experience with the phone, especially in older patients who have known mostly land-line phones and phone booths, phoning is more associated with a quiet rather than a noisy environment. When the environment is specified, as in our EEAS_9 item (“phone in noise”), the effort score is on par with the other noise items.
For the full scale scores, the median we obtained in HIHA is smaller and outside the confidence intervals obtained from pooling both Alhanbali et al. and Cañete et al.'s data: 5.4 versus 6.83, but our population has lower hearing thresholds and less HAs experience than data reported by Cañete et al. (2022). The three EEASquiet items, which had lower scores, may also contribute to reducing our EEAS total score, and the EEASnoise median is closer to the EAS scores (median at 6.5), suggesting that, by default, overall (except for EAS_6), patients tend to answer the EAS items as if they were explicitly depicted in noise. To determine the impact of our transformations of the EAS into the EEAS, a specific score (EASc score) was calculated from only the items pertaining to the EAS, and averaging both scores of the duplicated items: No significant differences between those EASc scores and our EEAS scores were established, whether in NH or in our population with HIHA. The behavior of this EASc score with regards to the correlations with the different factors tested, was similar to the EEAS score. Finally, a coefficient correlation of 0.99 was observed between both scores, which shared almost 98% of the variance. This finding strongly suggests that the results of the EEAS presented here can be compared to Alhanbali's EAS.
EEAS Internal Structure
Exploratory factor analysis identified two factors corresponding to the two intended subscales, EEASquiet (with EEAS_1, EEAS_3, and EEAS_8) and EEASnoise with the other seven items. These subscales each corresponded to a clearly identified subcluster in the cluster analysis. Furthermore, the EEASnoise3 subscale formed a close knit subcluster within the EEASnoise subscale. Consistency within each subscale was very good, with Cronbach's alpha between 0.90 and 0.93, and good item to total correlations, on par with EAS.
One of the advantages of cluster analysis, is the identification of items that show a slight deviation from the others: EEAS_5 (EAS_3) and EEAS_10 showed both the lowest communalities at the EFA, the lowest item to total correlations, the lowest loadings on the EEASnoise and decreased somewhat the cluster homogeneity when they were added to the EEASnoise. Both items were the most weakly predicted (6.5% and 7.1% of variance explained) by the set of three factors used (hearing threshold, ear asymmetry and total HA experience), but both behaved similarly as EEASnoise, with a stronger prediction by total HA experience. EEAS_5 “How easily can you ignore other sounds when trying to listen to something?”, actually refers more to a degree of ability than to the amount of effort needed to perform the task depicted. Indeed, four items (EAS1, 4, 5, and 6) out of six in the EAS (and seven out of the 10 EEAS items), specifically address the effort, for example, “Do you have to put in a lot of effort in…” instead of “How easily can you …” for EEAS_5 (EAS_3). Perhaps, a wording such as “Do you have to put in a lot of effort when trying to listen to something whilst ignoring other sounds?” would have led to a closer score of this item to the other ones. Indeed, EEAS_5 (EAS3) reflects components such as auditory attention and ability to focus and is one of the few items (with the EEAS_3) that have ear asymmetry as a significant (but weak) factor, on par with better ear hearing threshold. EEAS_10 was added to take into account LE in reverberating environments, which was not addressed in the EAS. Its wording was similar to the other noise items and it is one of the few items that decreased significantly with total HA experience in patients recently provided with HAs.
EEAS_6 (corresponding to EAS_4: “Do you have to put in a lot of effort to follow discussion in a class, a meeting, or a lecture?”) showed lower communalities, lower loadings on EEASnoise, and some cross-loadings on EEASquiet. EEAS_6 was the item with the greatest number of missing answers, perhaps because the situation depicted is less similar to situations encountered daily by our population. It was the only EEASnoise item whose factors included the better ear threshold to a high degree comparatively to the usual factor met in the EEASnoise (the total HA experience), and it showed the greatest amount of variance explained (10%) comparatively to the other items.
Although those three items behaved slightly differently from the others within the noise subscale, the EEAS showed very good consistency as assessed by Cronbach's alpha and interitem to total correlations, which are very close to both Cañete et al. and Alhanbali et al.’s figures for the EAS.
EEAS, Hearing Thresholds and Hearing Aids Factors
LE measured by EEAS increased significantly with the better ear hearing threshold, with a 0.45-point LE increase on the EEAS for every 10 dB increase in the better ear hearing threshold, and a 0.3 point LE increase per 10 dB increase in ear asymmetry. This relationship was stronger for LE in quiet than for the EEASnoise subscale, but remained a small effect, explaining <8% of the variance in EEAS scores. Cañete et al. (2022) observed a similar increase of EAS score with hearing level. The apparent discrepancy between the present results and Alhanbali's EAS results, that is, no significant correlations between hearing levels and EAS scores within their 50 HIHA patient group, and in a larger sample of 84 patients, can be easily attributed to (1) a substantial difference in the patients’ characteristics and sample size between their study and ours and (2) the presence of “quiet” items in our EEAS global score, which show a stronger correlation with the hearing threshold than the “noisy” items that compose the EEAS. Indeed, the EEAS noise subscales (EEASnoise) are likely to be closer to the EAS than EEASquiet because there are no specific items pertaining explicitly to “listening in quiet” in the original EAS: it is likely that for most EAS items not mentioning explicitly the type of environment (“quiet” or “noisy”), patients filled the scale as if it was in a noisy situation, as it is the situations the most challenging for them in daily life. This is strongly suggested, as well, by the significantly stronger relationship between the total EEAS and EASc scores with the EEASnoise than with the EEASquiet.
When factors linked to HAs were taken into account, only 12% of EEAS variance could be explained (in a model significantly different than the model involving only better ear hearing thresholds and ear asymmetry), with the most significant factors becoming the total HA experience and, to a lesser degree, the better ear hearing threshold. Basically, each decade of aided hearing increased the EEAS score by 0.75 points, and each 10 dB hearing loss in the better ear increased the EEAS score by 0.35 points. None of the other factors entered were statistically significant (age, aided and non-aided ear asymmetry, aided better ear threshold, current HA experience, daily HA use). The EEAS subscales behaved differently: the EASquiet scores strongly depended on the better ear hearing threshold (β = 0.19) and, to a lesser degree, HA experience, with 10% of the variance explained. In contrast, for both EEASnoise3 and EEASnoise scores, the most important factor was total HA experience (β = 0.21) and, to a much lesser degree, a better ear hearing threshold (β = 0.16), barely reaching statistical significance for EEASnoise3. For the EEASnoise subscale, an average increase of almost 1 point in LE per 10 years of aided hearing was found and the total HA experience was the main factor for six EEAS items out of the seven items belonging to the “noisy” category (EEAS_6 was the exception).
This result of increased LE with total HA experience seems counterintuitive, as one would expect the HAs to decrease the LE perceived in everyday life, and the patient to continue to adapt to his new hearing, even beyond the first 6 months postfitting. In a nice longitudinal controlled study, following persons with newly fitted HAs for the first 6 months with a wide range of outcome measures, Holman et al. (2021) showed a steady decrease in EAS score at 3 and 6 months postfitting. Furthermore, the decrease in LE was significantly positively linked with a reduction in listening-related fatigue, as assessed by the Vanderbilt Fatigue Scale for Adults (Hornsby et al., 2021). The result we obtained in the whole population, that is, an increased effort with the total HA experience, is consistent with the increase in self-reported dissatisfaction with HAs for current HAs use of more than 2 years observed in a large population of people wearing HAs (Bertoli et al., 2009). We used this same limit of 2 years of total HA experience, to split our population in two groups: a group of people recently fitted with HAs (6 months to <24 months postfitting), and a group of people with more HA experience (i.e., 24 months or more). People recently fitted with HAs significantly decreased their LE (EEASnoise) with HA experience, at a rate of 0.26 points (out of 10) per year of HA experience, whereas people with more HAs experience increased their LE by almost 0.1 point (out of 10) per year of HA experience. For both groups, it was the EEASnoise scale that showed the largest effects, EEASquiet depending mostly on the better ear hearing threshold and ear asymmetry. Amongst the individual items, EEAS_6 and EEAS_7 seemed to be the most consistent in changing as a function of HA experience, with, as well, EEAS_5 and EEAS_10.
This small increase in LE for people with the most HAs experience agrees, as well, with the increase in dissatisfaction obtained with the Satisfaction with Amplification in Daily Life outcome measure by Hosford-Dunn and Halpern (2001). In their study, patients with the longest HA experience were those who sought help earlier in their lifetime, with greater hearing losses associated with greater self-assessed hearing disability and lower satisfaction with HAs: therefore, the hearing level could possibly be a confounder. In the present study, the increased LE (in noisy situations) perceived with increasing total HA experience, was only partially mediated by hearing loss, and not at all by age, showing the potential interest in using self-evaluation of LE in noisy situations as part of HAs benefit assessments.
To our knowledge, the present results are the first to show a continuing decrease of LE with increasing HA experience after the first 6 months of HAs fitting, up to around 24 months, beyond which LE tends to increase, albeit at a much smaller rate than the prior decrease. Other factors that could explain this increased LE with the HA experience for people with extensive HAs experience could be sociopsychological factors, such as patients modifying their expectations of HAs benefits over time. Indeed, social interactions and communication needs evolve with age, hearing impairment and HAs benefits. After initial satisfaction over the first 12 months of HAs fitting, it is likely that difficulties in hearing in noise, which are rarely completely compensated, become more obvious to HAs users who had high initial expectations.
Age Effects
Because age affects not only peripheral hearing but also the efficiency of top-down cognitive processes, we would expect an increase in EEAS scores with age. Indeed, the effect of age on LE measured in a dual task paradigm whose primary task was a speech in noise recognition test was shown after partialling out hearing thresholds in a group of 60 participants with NH, participants aged 20 to 77 years (Degeest et al., 2015). Similar increased LE with age was observed in various populations of patients with hearing impairment using dual task paradigms (Desjardins & Doherty 2013; Gosselin & Gagné, 2011; Tun et al. 2009). We would expect that heightened LE, recorded in a task involving speech perception in different noisy backgrounds, would be related to the self-reported effort encountered in daily listening situations. Therefore, we would expect an increase in EEAS scores with age. This was not the case, and age did not appear to be a significant factor linked to the EEAS scores, all hearing thresholds and HA-related factors being equal. Alhanbali et al. (2018) obtained a significant relationship between age and EAS scores, but such result could have been entirely mediated by hearing loss. The lack of association here between age and LE could be attributed to the difference between LE perceived in a single task at a single point in time, and LE perceived in daily activities, on a much longer time frame. Furthermore, motivation to perform a listening task has important bearing of the LE reported during a single task (Ohlenforst et al., 2017; Pichora-Fuller et al., 2016; Picou et al. 2013).
LE in Distinguishing HIHA From NH Population
By comparison with the EAS, the EEAS addresses LE both in quiet and noisy situations. Indeed, due to the specific link between speech in noisy situations and LE (e.g., Eckert et al., 2017), it seems relevant to explore both aspects using the same items in both situations, similar to what was done for the LSEQ (Smith et al., 2011). The EEASquiet subscale was more related to a better ear hearing threshold (and to a lesser degree, ear asymmetry) than EEASnoise, and both EEASnoise and EEASquiet were clearly elevated in HIHA compared to NH. Because complaints of difficulty understanding speech in noisy situations are commonplace in populations with HAs and because the benefits of HAs are well recognized in quiet situations but very often reported as insufficient in noisy environments, we would have expected a greater difference between LE in noisy and quiet situations for HIHA compared to NH, especially because our NH group was quite homogenous in terms of age and hearing thresholds. This was not the case for the total population: equivalent EEASnoise–quiet scores were obtained in the HIHA and NH groups. However, if the population was filtered as to accept only lower EEASquiet scores, patients with HAs showed significantly larger difference between listening in noise and listening in quiet than NH. The apparent lack of difference in the total population can be attributed to a ceiling effect in the EEASnoise scale in HIHA. This is evidenced, as well, in the nonlinear relationship between EEASquiet and EEASnoise, with an initial sharper increase in EEASnoise for low EEASquiet scores. In fact, the percentage of “extreme” LE in our population with HAs (based on the 95th percentile of the NH group) was 53% based on the EEASquiet scale versus only 42% based on the corresponding EEASnoise3 (47% for EEASnoise) due to greater variability of EEASnoise versus EEASquiet in NH group, even though this NH group was young and carefully screened. The percentage obtained here with EEASnoise is similar to the 46% obtained by Alhanbali, using the EAS, in a population of 50 HIHA. This better discriminative power of EEASquiet versus EEASnoise was not statistically significant in the ROC analysis, but the areas under the curves were around 0.81, which is surprisingly good for a questionnaire and close to the values (0.84) obtained for the 15iSSQ in a population with hearing impairment but no HAs (Moulin et al., 2019). As expected, the cutoff scores optimizing the sensitivity/specificity of the EAS were much lower for the EEASquiet (1 point) than for the EEASnoise (4.7 points).
Limitations of the Study
One of the major limitations of this study is the lack of concurrent more objective measure of speech perception in noise, in the same population, with a regular follow up, that would allow to sort out the different components of LE that can be captured by a questionnaire such as the EEAS. The lack of comparative data before and after HA fitting is another major drawback. Indeed, we chose purposely, to have our patients answering in the situation of HA wearing, as it is the most common situation for them, and as the situation before HAs fitting, for long-term users of HAs, is difficult to report accurately. Another concurrent measure of HAs satisfaction could have been useful as well, to see if we had a correlation between the increase dissatisfaction with time reported by other studies, and the increase of LE with HA experience reported here. Furthermore, a longitudinal study with a follow up lasting more than 24 months, could actually identify the time frame within which the LE switches, from a substantial decrease within the first 24 months, to a slow gradual increase afterwards as a function of HA experience.
For the validation of the EEAS, classical psychometric methods were used, mostly for their similarities with what has already been used for the EAS, and, on a more general note, for the majority of other hearing questionnaires (e.g., the SSQ; Akeroyd et al., 2014). However, although the use of visual analog scales with a lot of graded options (from 0 to 10 in the present case) allows ordinal ordering of the answers, it falsely implies a linear scale, with the same intervals between, for instance, 4 and 5, or between 9 and 10 (Tesio et al., 2023; Wright & Linacre, 1989). It is highly probable that the distance between each grade varies from patient to patient, and, within a patient, between the lower end and the high-end of the scale. One way to make those graded scales linear is to use Rasch analysis, that was initially developed for research in education using dichotomous data (Rasch, 1960) but has since known a major development (Aryadoust et al. 2019,), especially into health questionnaires (Boone, 2016; Tennant et al., 2004), with new models adapted to graded scales (Wright & Masters, 1982). Although this type of analysis goes far beyond the scope of the present paper, it is certainly worth considering in future analysis of hearing-related questionnaire data.
Lastly, the small amendments made to the EAS can be a drawback to the validation of a French language version of Alhanbali's EAS, but the present study was aimed beyond that and the strong similarities between the original EAS results and our EEAS and EASc results suggest the validity of the version used.
Insights for Clinical Practice
As we wanted to ascertain the “best options” as to the EEAS subscales, we chose to consider both the EEASnoise3 and the EEASnoise subscales. Both EEASnoise3 and EEASnoise scores were very close to one another, but, probably because it contains more items, the EEASnoise subscale had slightly better performances than the EEASnoise3 subscale. Factor analysis and cluster analysis clearly separated the two EEASquiet and EEASnoise subscales, but showed, as well, that grouping those subscales into a global score was at the cost of homogeneity: the EEAS is therefore not unidimensional and both EEAS and EASc scores reflect mostly EEASnoise subscale. The present study showed two different constructs built within the same instrument using the same items that differed by only a few words, emphasizing the need for detailed specification of what is meant by “LE,” as recently stated by Strand et al. (2020). Therefore, explicitly mentioning the background in all the situations depicted by the EAS would help. The EEAS should not be used as a single score, but rather as two separate EEASquiet and EEASnoise scores. EEASquiet seems to be more related to hearing thresholds, whereas EEASnoise is more sensitive to changes induced by HA experience. The greater variability in EEASnoise versus EEASquiet, evidenced in the control group, gives the EEASquiet a better sensitivity to extreme LE. Conversely, EEASnoise seems to be better adapted to measure LE as an outcome measure HAs postfitting.
Lastly, the relatively small part of the LE in daily life explained by a wide range of mostly audiological factors (12% of the EEAS score explained in the present study) agrees with the multidimensionality of LE that is often emphasized, with weak correlations reported between different types of measures (e.g., Alhanbali et al., 2019a; Strand et al., 2018). This should encourage us to broaden the range of factors to take into account, whenever possible.
Conclusion
Thanks to a large sample of people with hearing impairment and HAs, this study provided a detailed analysis at the item level of the internal structure of an extended version of Alhanbali's EAS, which is the first scale devoted to the assessment of daily LE in persons with hearing impairment.
The extended version (EEAS) has the advantage of exploring two separate constructs: listening in quiet situations (EEASquiet) and listening in noisy situations (EEASnoise), that form separate subscales as evidenced by factor and cluster analysis. These two constructs behaved differently: LE in quiet situations depended more on better ear hearing threshold and, to a lesser degree, to ear asymmetry, whereas LE in noisy situations depended more on total HA experience of the patients, with, for patients with longer HAs experience, a small but significant increase in LE with increasing HA experience, effect that was not mediated by age, nor hearing threshold variations. This increase contrasted with the larger decrease in LE in noise (EEASnoise) with HA experience, obtained in people that were recently provided with HAs (6 months to <24 months).
The discrepancy between LE self-evaluated in quiet situations and LE evaluated in noisy environments, stresses the importance of taking into account explicitly these different situations, and strongly suggest that the two EEAS subscales should usefully complement the assessment of HA benefit.
Supplemental Material
sj-xlsx-1-tia-10.1177_23312165231176320 - Supplemental material for Listening Effort in Quiet and Noisy Environments in the Daily Life of Adults With Hearing Aids: An Extended Version of the Effort Assessment Scale (EEAS)
Supplemental material, sj-xlsx-1-tia-10.1177_23312165231176320 for Listening Effort in Quiet and Noisy Environments in the Daily Life of Adults With Hearing Aids: An Extended Version of the Effort Assessment Scale (EEAS) by Mathieu Ferschneider and Annie Moulin in Trends in Hearing
Footnotes
Acknowledgments
This work could not have been done without the help and time generously given by the participants. The authors wish to thank Professor Stéphane Gallego for his help and the students and their supervisors who contributed to the project, in particular Audition Conseil, France. Mathieu Ferschneider received a Cifre doctoral fellowship (![]() ) from Luz Audio, France.
) from Luz Audio, France.
Data Availability
The data that support the findings of this study are available from the corresponding author upon reasonable request and compatibility with the European General Data Protection Regulation.
Declaration of Conflicting Interests
The author(s) declared no potential conflicts of interest with respect to the research, authorship, and/or publication of this article.
Funding
The author(s) disclosed receipt of the following financial support for the research, authorship, and/or publication of this article:This work received financial support from the “Region Auvergne Rhône-Alpes”, France, Pack ambition recherche 2017–2022, (“project effecbruit”) and was conducted in the framework of the LABEX CeLyA (Lyon Acoustics Center, ANR-10-LABX-0060).
Supplemental Material
Supplemental material for this article is available online.
References
Supplementary Material
Please find the following supplemental material available below.
For Open Access articles published under a Creative Commons License, all supplemental material carries the same license as the article it is associated with.
For non-Open Access articles published, all supplemental material carries a non-exclusive license, and permission requests for re-use of supplemental material or any part of supplemental material shall be sent directly to the copyright owner as specified in the copyright notice associated with the article.