
Abstract
Disturbing factors like reverberation or ambient noise can impair speech recognition and raise the listening effort needed for successful communication in daily life. Situations with high listening effort are thought to result in increased stress for the listener. The aim of this study was to explore possible measures to determine listening effort in situations with varying background noise and reverberation. For this purpose, subjective ratings of listening effort, speech recognition, and stress level, together with the electrodermal activity as a measure of the autonomic stress reaction, were investigated. It was expected that the electrodermal activity would show different stress levels in different acoustic situations and might serve as an alternative to subjective ratings. Ten young normal-hearing and 17 elderly hearing-impaired subjects listened to sentences from the Oldenburg sentence test either with stationary background noise or with reverberation. Four listening situations were generated, an easy and a hard one for each of the two disturbing factors, which were related to each other by the Speech Transmission Index. The easy situation resulted in 100% and the hard situation resulted in 30 to 80% speech recognition. The results of the subjective ratings showed significant differences between the easy and the hard listening situations in both subject groups. Two methods of analyzing the electrodermal activity values revealed similar, but nonsignificant trends. Significant correlations between subjective ratings and physiological electrodermal activity data were observed for normal-hearing subjects in the noise situation.
Introduction
A number of studies have addressed the effort required for hearing-impaired listeners to understand speech in adverse conditions (see, e.g., Downs, 1982; Feuerstein, 1992; Hicks & Tharpe, 2002; Nachtegaal et al., 2009; Picou, Ricketts, & Hornsby, 2013), but an exact definition of the term listening effort is still missing in the field of audiological research. McGarrigle et al. (2014) concluded that listening effort is often regarded as “the attention and cognitive resources required to understand speech” (Fraser, Gagné, Alepins, & Dubois, 2010; Gosselin & Gagné, 2011; Hicks & Tharpe, 2002; Picou, Ricketts, & Hornsby, 2011), but broadened this view beyond speech understanding to “the mental exertion required to attend to, and understand, an auditory message.” Due to the uncertainty about an exact definition, in the present study, listening effort shall be operationally defined as the mental exertion that is required to perform a speech test in an acoustical situation.
Several studies have shown that listening effort decreases in situations with increasing speech recognition, for example, due to less background noise or less reverberation (Mackersie, PacPhee, & Heldt, 2015; Picou, Gordon, & Ricketts, 2016; Rennies, Schepker, Holube, & Kollmeier, 2014; Sato, Sato, & Morimoto, 2007; Schepker, Haeder, Rennies, & Holube, in press; Zekveld, Kramer, & Festen, 2011). One advantage of measuring the listening effort might be to capture those situations in which speech intelligibility scores of 100% are already reached, but listening effort is still decreasing (Rennies et al., 2014; Schepker et al., in press). Therefore, listening effort might be an additional characteristic measure for hearing in surroundings that have acoustical disturbances of the target information. The measurement of listening effort might provide more detailed information about hearing losses (Mackersie & Cones, 2011) and hence help to distinguish differences in hearing aid performance (e.g., Luts et al., 2010). There has been much research in recent years to find reliable measurement procedures for listening effort, using subjective and objective approaches (see Klink, Schulte, & Meis, 2012a, 2012b; McGarrigle et al., 2014). Subjective approaches include judgments or statements of subjects, such as rating scales or questionnaires. Objective approaches include physiological measures or performance-based cognitive or perceptual measures.
Subjective measurements have been used to evaluate the effects of signal-to-noise ratio (SNR; e.g., Larsby, Hällgren, Lyxell, & Arlinger, 2005; Rennies et al., 2014; Zekveld et al., 2011) and reverberation (Rennies et al., 2014; Sato et al., 2007; Schepker et al., in press) on listening effort. A relationship showing increasing listening effort with decreasing Speech Transmission Index (STI; Houtgast & Steeneken, 1985) was established by Rennies et al. (2014) using a subjective scaling method. In that study, variations of noise and reverberation were used to generate different STIs. In subjective measurements, Larsby et al. (2005) determined that hearing-impaired listeners struggle more in speech recognition tasks when compared with normal-hearing listeners and that they require a higher listening effort, measured using subjective ratings and reaction times, for comparable performance in speech recognition. In recent years, measuring physiological parameters to determine listening effort has become increasingly popular (Koelewijn, Zekveld, Festen, & Kramer, 2012; Mackersie & Cones, 2011; Ortmann et al., 2015; Mackersie et al., 2015; Zekveld, Kramer, & Festen, 2010; Zekveld et al., 2011).
Situations with high listening effort may also induce increased stress in the listener (Mackersie & Cones, 2011). When exposed to stress, the human body reacts via the autonomic nervous system with alterations in many physiological parameters (Mackersie et al., 2015). One physiological parameter that is responsive to processes such as mental activity or the influence of stress inducers is the electrodermal activity (EDA), which describes the electrical conductance and changes of potential of the skin (Schandry, 1989). The EDA, also termed skin conductance, is influenced by the innervation of eccrine sweat glands, which are stimulated sympathetically, and not at all parasympathetically (Critchley, 2002). The sympathetic nervous system is that part of the nervous system that mediates performance-enhancing signals in the body (Goldstein & Kopin, 2007). Therefore, the EDA is a good indicator for the sympathetic reaction or the inner tension of a subject (Bruns & Praun, 2002). Even small stress inducers, for example, mental load or emotional arousal, lead to an increased EDA (Bruns & Praun, 2002). The more pronounced the sympathetical activity, the higher the EDA level and the frequency of the spontaneous fluctuations that can be seen as sequences of peaks in a recording of the EDA (Bruns & Praun, 2002; Schandry, 1989). Therefore, it is of interest to see whether changes in this physiological measure can be used as an indicator for the effects of variable listening effort on the body. Among listening situations with variable listening effort, different levels of the mean EDA were observed by Mackersie and Cones (2011) and different numbers of peaks per minute were found by Ortmann et al. (2015). From these studies, it was concluded that the EDA might be the most promising physiological measure, beside pupillometry and reaction time measures, to capture listening effort. Nevertheless, the EDA might not be directly related to the participant’s reactions in subjective rating tasks. Weak or absent correlations between physiological and subjective measures were reported for pupil responses (Koelewijn et al., 2012; Zekveld et al., 2011) and for skin conductance (Mackersie & Cones, 2011; Mackersie et al., 2015). Therefore, the relation between the different measures is still unclear.
The aim of the present study was to explore the relationships between speech recognition, the subjectively rated listening effort and the physiological EDA measure in two easy and in two hard listening situations for young normal-hearing and elderly hearing-impaired participants. These two groups were included as elderly hearing-impaired subjects are the target group for listening effort evaluations and rehabilitation with hearing technology and young normal-hearing listeners are regarded as a reference group that might show largest effects in EDA (Boucsein et al., 2012). In addition, previous experience with subjectively rated listening effort was available for both groups. The easy and hard listening situations differed either by the amount of supplemental noise or by the induced reverberation. It was assumed that more difficult listening situations would result in a higher “subjective listening effort” and that possible differences might be found in the physiological EDA measure. As signals in reverberation and signals in noise with similar STI are said to have a comparable effect on speech recognition, an effort was made to achieve a similar subjective and objective effect in both easy and in both hard situations. Based on Schepker et al. (in press), an adjustment of SNR and reverberation implied a similar effect between easy and hard conditions for normal-hearing and hearing-impaired listeners. Listeners were invited to provide a free response after each listening situation to enhance knowledge about the generated reverberant and noise condition. The responses might give a hint about the dimensions of the perceived listening situation and whether the chosen categories are sufficient to characterize the listening conditions and the listening effort for the different groups.
Methods
Subjects
Thirteen normal-hearing and 19 hearing-impaired subjects were recruited for the experiment. They were each invited for two sessions. The first session included information about the experiment, an interview to obtain the medical history, measurement of the pure-tone audiogram and, for the hearing-impaired listeners, a categorical loudness scaling with the Oldenburg measurement application (Adaptive Categorical Loudness Scaling [ACALOS]; Brand & Hohmann, 2002) using the noise of the experiments to adjust the required background noise level (see later). During the interview, the skin conductance was recorded to ensure that measurements of the EDA were possible and showed sufficient fluctuations. The second session included the experiment described later.
The data of five subjects who participated in both sessions were excluded from the analysis. Three normal-hearing subjects were excluded due to too many body movements or for briefly falling asleep during the experiment. Two hearing-impaired subjects were excluded due to hot flushes and for feeling faint. Thus, the data of 10 normal-hearing subjects (5 male and 5 female) and 17 hearing-impaired subjects (9 male and 8 female) were analyzed. The ages of the normal-hearing subjects were 19 to 28 (average: 23) years and the hearing-impaired subjects were 52 to 85 (average: 73) years old. Normal hearing was defined as a hearing threshold of ≤20 dB HL at all audiometer frequencies in the range from 250 Hz to 8 kHz. The normal-hearing subjects had little to no experience in audiological experiments. The hearing-impaired subjects were mostly experienced regular subjects from the Hörzentrum Oldenburg GmbH and exhibited a mild-to-moderate hearing loss of 23 to 53 dB HL (average of 0.5, 1, 2, and 4 kHz, PTA4). Their audiograms are shown in Figure 1. All participants received compensation (12 Euro/h) for their expenses. The experiment was approved by the ethics committee (“Kommission für Forschungsfolgenabschätzung und Ethik”) of the Carl von Ossietzky University in Oldenburg, Germany (Drs. 32/2011). The subjects gave informed consent for participation in the experiment.
Pure-tone audiograms of the hearing-impaired listeners. The box plots contain the median as a horizontal line, the interquartile range from the first to the third quartile as a box, whiskers to the minimum and the maximum values within 1.5 times the interquartile range from the first and the third quartile, and outliers as “×” symbols.
Stimuli and Test Conditions
Acoustic lists of the Oldenburg Sentence Test (OLSA, Wagener, Brand, & Kollmeier, 1999), with 30 sentences per list, were used as speech stimuli. Different listening situations were created either by mixing the speech stimuli with speech-simulating stationary noise (“Olnoise”, Wagener et al., 1999) or by convolving them with impulse responses of real rooms to add reverberation. For both classes of situations, noise and reverberation, an easy and a hard hearing conditions were generated. Using the same four stimuli, Rennies et al. (2014) and Schepker et al. (in press) showed that a similar “subjective listening effort” rating for normal-hearing and hearing-impaired subjects could be reached both for SNRs of −6 dB (normal-hearing) and −2 dB (hearing-impaired) as hard conditions, as well as 6 dB (normal-hearing) and 10 dB SNR (hearing-impaired) as easy conditions. Therefore, these SNRs were also chosen in the current study. Appropriate room impulse responses characterized by their reverberation time T60 were chosen to provide approximately the same STI (Schepker et al., in press), that is, approximately 4 s (normal-hearing) and 2 s (hearing-impaired) for the hard, and 0.5 s (normal-hearing) and 0.3 s (hearing-impaired) for the easy condition. The level of the speech signal was adjusted to a sound pressure level (SPL) of 55 dB for the normal-hearing subjects. This level corresponds to 19 CU in the ACALOS procedure, that is, a rating between soft and medium (Rennies, Holube, & Verhey, 2013). The level of the speech signal for the hearing-impaired subjects was adjusted to the same individual subjective loudness, that is, 19 CU, in the ACALOS procedure. For the latter group, this resulted in an average presentation level of 69 dB SPL (STD 4.7 dB).
Measurement Procedure
To minimize any disturbing muscle activity due to body movements, the participants were placed in a relaxed position on a couch in a sound-isolated test booth. Using headphones (Sennheiser HD650), the signals were presented diotically. The experiment started with a relaxation phase of about 10 min, followed by a training session using two lists of the OLSA. Then, the first of the four randomly presented test conditions started after a recovery phase of about 5 min. Within each test condition, one test list of the OLSA including 30 sentences was presented. The subjects repeated after each sentence presentation the words they recognized. A speech recognition score was calculated from the correctly repeated words for every condition. After each list, the participants were interviewed and asked to subjectively rate their impression on several scales. Subsequently, the next test condition started with another recovery phase of about 5 min followed by the next test list.
The EDA was measured via electrodes using a low, constant current on the middle phalanx of the index finger and the middle finger of the nondominant hand. During the whole sequence of the experiment, including test and recovery phases, the EDA was recorded as µS with a sampling rate of 32 samples/s by means of a Nexus-10 MKII (Mind Media BV). At the same time, blood volume pulse, electromyography, and respiration were recorded using the same measurement apparatus. The latter data are not reported here.
During the interview, the subjects were asked to rate their “subjective listening effort”, “subjective speech recognition”, and “subjective stress level” on predefined scales. In addition, the subjects were asked to freely describe the conditions in their own words: “How would you describe the hearing situation in words?” (“Wie würden Sie die Hörsituation in Worten beschreiben?” in German).
“Subjective listening effort” was evaluated by asking “How much effort does it require for you to understand the speech?” (“Wie anstrengend ist es für Sie, die Sprache zu verstehen?” in German) using a categorical rating scale with seven labeled categories and six intermediate steps (Luts et al., 2010). This scale was selected to allow for comparisons with Rennies et al. (2014) and Schepker et al. (in press), who used the same stimuli. Effort scale categorical units (ESCUs) were assigned to the categories as numerical entities. The category no effort (“mühelos” in German) corresponded to 1 ESCU, very little effort (“sehr wenig anstrengend”) to 3 ESCUs, little effort (“wenig anstrengend”) to 5 ESCUs, moderate effort (“mittelgradig anstrengend”) to 7 ESCUs, considerable effort (“deutlich anstrengend”) to 9 ESCUs, very much effort (“sehr anstrengend”) to 11 ESCUs, and extreme effort (“extrem anstrengend”) to 13 ESCUs. The numbers in ESCU were not visible to the subjects.
“Subjective speech recognition” was evaluated by asking “How much of the speech do you understand in this situation?” (“Wieviel Sprache verstehen Sie in dieser Situation?” in German) using a categorical rating scale with seven steps without intermediates. This scale was selected because it was used in the assessment of everyday situations by Haverkamp, von Gablenz, Kissner, Bitzer, & Holube (2015) in the same lab and might possibly allow for comparisons between results in and outside the lab. Arbitrary units (a.u.) from 1 to 7 were assigned to the categories as numerical entities. The categories for “subjective speech recognition” were “not at all” (“gar nicht” in German), “very little” (“sehr wenig”), “little” (“wenig”), “half” (“die Hälfte”), “much” (“viel”), “almost everything” (“fast alles”), and “everything” (“alles”).
The sensations for “subjective stress level” were determined by asking “How stressed had you just been?” (“Wie gestresst sind Sie gerade gewesen?” in German). They were rated on a 5-point scale with levels “not at all” (“gar nicht” in German) at the first level and very (“sehr”) at the fifth level.
Analysis
An example of a complete time course of an EDA during a whole experiment for one subject is given in Figure 2. The EDA typically decreased during the recovery phases between different conditions. At the beginning of each test list, the EDA typically showed an onset followed by a subsequent decay but also exhibited several maxima and minima during the recognition work with the test lists. Directly after each test list, during the interviews and the completion of the rating-scales, the EDA showed high amplitudes and substantial variations that are mainly due to motor activities of the body during this phase.
Example of the time course of the EDA for one subject. The green-framed area indicates the time intervals of both training lists, whereas the four red-framed areas denote the time intervals of the four test lists with different listening conditions. Note. EDA = electrodermal activity.
To estimate the measurability of the EDA, the measurement dynamics, that is, the difference between the highest and the lowest EDA value in µS during the whole experiment was analyzed for each subject. Figure 3 shows a broad scatter but a significant difference (U-test, p = .003) between the measurement dynamics for the young normal-hearing subjects and the older hearing-impaired subjects. No significant difference between male and female subjects was observed. The difference between the two subject groups, normal-hearing and hearing-impaired, underlines the necessity to standardize the EDA results.
Measurement dynamics of the EDA for both subject groups, normal-hearing and hearing-impaired. For a description of the box plots, see Figure 1.
The EDA amplitudes during the recognition activity with the test lists were compared across the four test conditions in terms of their averaged z-values (Mackersie & Cones, 2011; Mackersie et al., 2015) and their relative peak rate (Bruns & Praun, 2002; Ortmann et al., 2015; Schandry, 1989). For the z-values, the average EDA amplitude during the last second before the start of each test list was defined as the baseline for each subject and each condition (EDAbaseline). This time period was selected because it showed the lowest EDA values of the recovery phase in almost all participants and therefore seemed to be a representative measure for the status reached at the end of this phase. This baseline was subtracted from the average EDA amplitude of the following test list EDAcondition such that a relative mean amplitude characterized the EDA of a test list of one subject:

These characteristic EDA indicators for each subject and each test condition were converted to z-values by subtracting the average of all test conditions Mean(EDArel) for each subject from the indicators and by dividing the resulting difference by the respective standard deviation STD(EDArel) for each subject:

The second measure, the relative peak rate, indicating the level of sympathetic excitation (Bruns & Praun, 2002), was calculated by counting the peaks of the EDA within the last 3 minutes of every recovery phase and within each test phase and dividing it by the duration of the respective recording periods. The peaks were counted using a Matlab script for peak detection. Small variations were disregarded by applying a threshold which had to be exceeded. The resulting relative peak rate (Δpeak rate) of each test condition was given by the individual difference between the fluctuations/min during the test phase and the fluctuations/min during the previous recovery phase.
Statistical analysis was carried out with the software package SPSS. Shapiro-Wilk tests revealed nonnormal distributions for most of the data. Therefore, nonparametric tests (Friedman, Wilcoxon, U-test, Spearman’s rank correlations) were applied, the level of significance being set to α = .05. When several paired comparisons were conducted, the level of significance was adjusted using the Bonferroni correction. χ2 tests were used to analyze the free descriptions.
Results
Subjective Ratings
The results of the “subjective listening effort”, “subjective stress level”, and “subjective speech recognition” ratings obtained from the normal-hearing and the hearing-impaired subjects are shown in Figure 4 for each of the four conditions. For both subject groups, normal-hearing and hearing-impaired, all three rated entities—“subjective listening effort”, “subjective stress level”, and “subjective speech recognition”—showed significant differences between the conditions (Friedman test p < .001). For almost all comparisons (see Table 1(a)–(c)), post-hoc pairwise Wilcoxon tests revealed significant differences between easy and hard conditions varying either in the SNR or in the amount of reverberation. The ratings for the easy noise and the easy reverberation condition were similar in both subject groups for all three rated entities, but the two hard conditions were significantly different in both groups regarding “subjective listening effort” and “subjective speech recognition” (see Table 1(a) and (c)). The hard reverberation conditions required a higher listening effort than the hard noise conditions.
Results of ratings for subjective listening effort (in ESCU), subjective stress level (in arbitrary units a.u.), and subjective speech recognition (in a.u.) for normal-hearing subjects (left) and hearing-impaired subjects (right) in the “easy” and “hard,” reverberant and noise condition. Subjective listening effort was rated between no effort (1 ESCU) and extreme effort (13 ESCU), subjective stress level was rated between not at all (1 a.u.) and very (5 a.u.) and subjective speech recognition was rated between not at all (1 a.u.) and everything (7 a.u.). For a description of the box plots, see Figure 1. Note. ESCU = Effort scale categorical unit. Results for the Pairwise Comparison with the Wilcoxon Test. Note. rev. = reverberation. In each of the four panels, the p values for the normal-hearing subjects are given in the lower left triangle and for the hearing-impaired subjects in the upper right triangle. Level of significance with Bonferroni correction for four paired comparisons: *Significant (α = .0125), **highly significant (α = .0025).

The ratings for “subjective listening effort” and “subjective stress level” were compared with those for “subjective speech recognition” (see Figure 5). These combinations were selected because “subjective speech recognition” was regarded as the primary experience of the subjects when performing their task in repeating the sentences of the speech test lists. Linear regression lines were separately fitted to the individual values in noise and in reverberation. The respective Spearman’s rank correlation coefficients in Table 2 revealed significant relationships for all comparisons. With increasing “subjective speech recognition”, one observes that the “subjective listening effort” and the “subjective stress level” decrease. The relationship between “subjective speech recognition” and “subjective listening effort” is stronger than the relationship between “subjective speech recognition” and “subjective stress level”.
Subjective listening effort versus subjective speech recognition (top) and subjective stress level versus subjective speech recognition (bottom) for normal-hearing subjects (left) and hearing-impaired subjects (right). The averages and standard deviations for each condition are highlighted in darker colors and larger symbols. The regression lines were separately fitted to the individual data for reverberation and noise. Spearman’s Rank Correlation Coefficients and Levels of Significance for Subjective Rating Scales and EDA Values. Note. EDA = electrodermal activity. rev. = reverberation. *Significant (α = .05).

Measured Speech Recognition
The results of the (objective) “measured speech recognition” test are shown in Figure 6 for all four conditions, separately for both subject groups. Speech recognition scores were at or near 100% in the easy conditions, whereas median scores of 30 to 80% resulted from the hard conditions. For both subject groups, scores for the four conditions were significantly different (Friedman test: p < .001). Post-hoc pairwise comparisons (Wilcoxon test with Bonferroni correction, see Table 1(d)) showed significant differences between the respective easy and hard conditions as well as the two hard conditions. Only the two easy conditions were not significantly different in either subject group.
Measured speech recognition for normal-hearing subjects (left) and hearing-impaired subjects (right) in the easy and hard, reverberant and noise condition. For a description of the box plots, see Figure 1.
The relationship between “measured speech recognition” and “subjective speech recognition” is shown in Figure 7. Linear regression lines and rank correlations are not given for these data because most of the “measured speech recognition” results are at 100% in the easy conditions.
Measured speech recognition versus subjective speech recognition for normal-hearing subjects (left) and hearing-impaired subjects (right). The averages and standard deviations for each condition are highlighted in darker colors and larger symbols.
EDA
The z-values of the EDA in Figure 8 (left panel) show the same trend as for the subjective ratings, but the differences were not significant for the normal-hearing group (Friedman test, p = .073). For hearing-impaired subjects (right panel), the same nonsignificant trend was observed for reverberation only, but not for the noise conditions (Friedman test, p = .153).
Results of the z-values of the EDA for normal-hearing (left) and hearing-impaired subjects (right) in the easy and hard, reverberant and noise conditions. For a description of the box plots, see Figure 1. Note. EDA = electrodermal activity.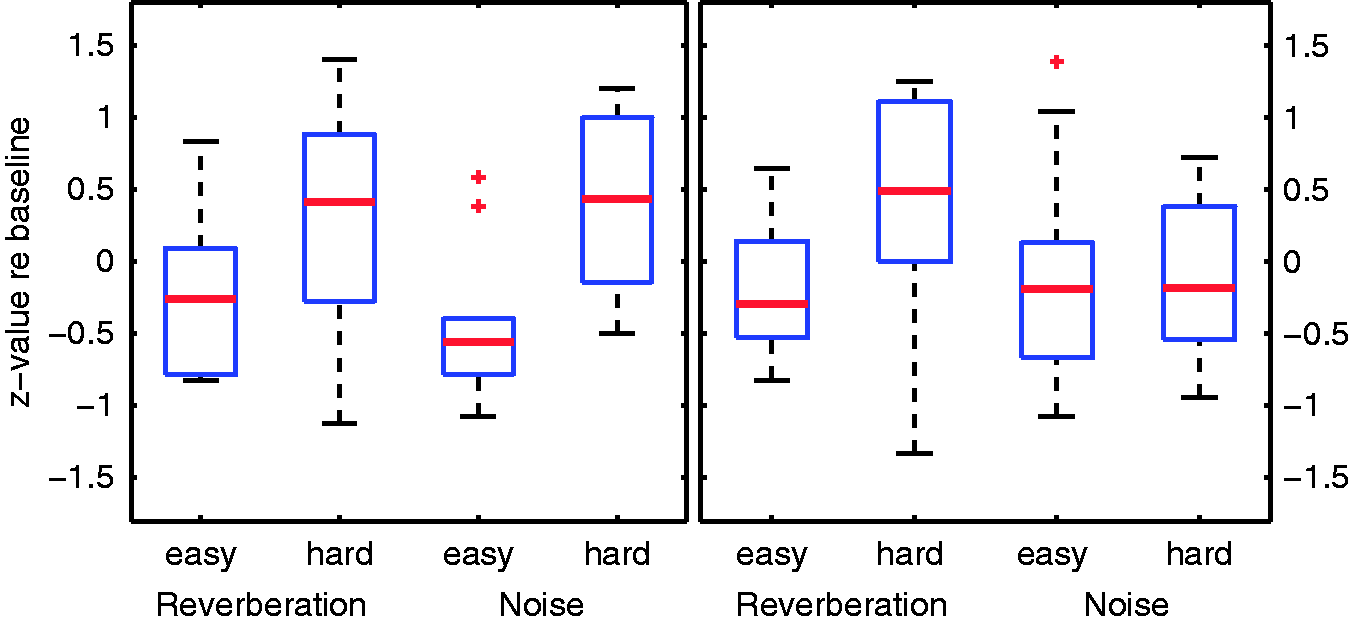
Figure 9 shows the relative EDA peak rates for both groups. For the normal-hearing subjects (left panel), the peak rates were significantly different (Friedman test, p = .008) in all four test conditions. However, post-hoc Wilcoxon paired comparison tests with Bonferroni correction failed to reveal any two conditions that were significantly different. For the hearing-impaired subjects, no significant differences were found between the test conditions (Friedman test, p = .957).
Results of relative peak rate of the EDA for normal-hearing subjects (left) and hearing-impaired subjects (right) in the easy and hard, reverberant and noise conditions. For a description of the box plots, see Figure 1. Note. EDA = electrodermal activity.
Correlation Between EDA and Subjective Ratings
The EDA z-values for all participants were compared with the “subjective speech recognition”, the subjective listening effort, and the “subjective stress level” (see Figure 10). A large scatter, with very different EDA values for the same subjective ratings, can be observed. For the normal-hearing subjects in the noise condition (see Table 2), Spearman’s rank correlation revealed a significant correlation between all three subjective rating items and the EDA z-value.
z-values of the EDA versus “subjective speech recognition” in arbitrary units (a.u., top), subjective “listening effort” in ESCU (middle), and subjective “stress level” in a.u. (bottom) for normal-hearing subjects (left) and hearing-impaired subjects (right). The averages and standard deviations for each condition are highlighted in darker colors and larger symbols. The regression lines were fitted to the individual data for reverberation and noise conditions separately. Note. EDA = electrodermal activity; ESCU = Effort scale categorical unit.
Rating Context—Free Description of Conditions
To investigate the frame of reference that was used by the subjects for their absolute judgments, free descriptions of the perceived hearing situation were collected after the speech recognition task in each condition and classified into categories. One category (recognition and effort) was related to the items rated earlier (“subjective speech recognition” and “subjective listening effort”). Two additional ones referred to the surroundings in which the virtual speaker and listener were placed (category environment) and to the evaluation of this listening context (category evaluation).
In the category environment, a distinction was made between the environments associated with the two types of stimuli conditions, reverberation and noise conditions. The associations during the reverberation conditions referred to the space around the speaker. Typical denominations for the easy reverberation condition were large or empty rooms, for example, a large floor, church, apartment, lecture room, whereas in the hard reverberant condition, the space grew larger, for example, very large room as a church, railway station, cave, tunnel, far away in a store, or floor. Those associations were implicitly related to the differing quality of the transmission channel (the space between speaker and listener) of the two reverberant conditions. The associations during the noise conditions focused on the possible source of the disturbing noise. Typical examples for the hard noise condition were construction area, tram, traffic noise, crowded market, shopping mall, loud train, industrial building and for the “easy” noise condition, for example, conversation with a neighbor, park with trees, garden, restaurant, pub, and in a car. Implicitly, different intensities of disturbing noise were connected to the associations for the hard and easy noise conditions. There was a pronounced difference between the two groups of subjects concerning explicit associations about the imagined environment. For all four listening conditions, on average, 73% of the young normal-hearing subjects described associations of an imagined environment, compared with only 27% of the elderly hearing-impaired. These differences between young normal-hearing and elderly hearing-impaired listeners were statistically significant, χ2(1) = 21.71, p < .001).
The additional category recognition and effort includes descriptions of the “subjective speech recognition” and the performance in the listening situation. The descriptions assess the degree of speech recognition as, for example, good hearing, not simple, bad understanding, and refer to the “subjective listening effort”. Obviously, the terms used were triggered by the items that were previously rated. On average, 25% of the normal-hearing subjects commented on the perceived recognition and effort compared with more than 71% of the hearing-impaired subjects who associated the easy condition with, for example, good hearing, intelligible, clearly audible, with success and the hard condition with expressions such as unintelligible, mumble, not simple, bad understanding. Obviously the hearing-impaired subjects focused significantly more on their speech recognition and performance than did the normal-hearing subjects, χ2(1) = 21.05, p < .001.
The category evaluation includes evaluated items such as unpleasant, creepy, disgusting, lousy situation, comfortable and reflects an affective assessment of the condition experienced. Only 23% of the normal-hearing listeners and 59% of the hearing-impaired subjects expressed their evaluation of the listening situation, χ2(1) = 13.41, p < .001.
Discussion
The following important aspects are discussed: The subjective ratings as psychological measures of different aspects of the listening condition, the EDA as a physiological measure, the experimental listening conditions together with the choice of stimuli, the free descriptions in which the contexts of the ratings in the listening condition are addressed, and the correlation between the psychological and physiological measures.
Subjective Ratings
The ratings of “subjective speech recognition”, “subjective listening effort”, and “subjective stress level” mirrored the “measured speech recognition” scores in the listening conditions. The ratings for the two easy conditions, in noise and in reverberation, were not significantly different, but significant differences were observed between the ratings of the two hard conditions. The main objective for applying subjective ratings was to distinguish the effects in listening effort or stress between the easy and hard condition within one factor, either noise or reverberation. All three subjective ratings distinguished very well between the easy and the hard test conditions for both subject groups. Nevertheless, the differences between the easy and hard test conditions were less pronounced in the noise conditions than in the reverberation conditions. In addition, the difference in the reverberation conditions is smaller for the older hearing-impaired subjects compared with the younger normal-hearing subjects. This might be related to the small differences in “measured speech recognition” for both subject groups. Another explanatory approach might be the longer lasting listening experience of the older hearing-impaired subjects compared with the young normal-hearing subjects under adverse conditions, especially in hard noise conditions, which might result in lower ratings of listening effort and stress (see, e.g., Larsby et al., 2005; Schepker et al., 2016).
One advantage of the ratings of “subjective listening effort” and “subjective speech recognition” compared with the “measured speech recognition” is the variability of the subjective ratings for the easy condition in contrast to the ceiling effects observed in the “measured speech recognition”. Thus, the subjective ratings can differentiate between conditions even when speech recognition is at 100%. On the other hand, “subjective listening effort” and “subjective speech recognition” are highly correlated. Hence, the participants in this study did not distinguish between the amount of speech they could repeat correctly and “the attention and cognitive resources required to understand speech” (Hicks & Tharpe, 2002). Nevertheless, “subjective speech recognition” was more often rated at 7 a.u. (everything) than “subjective listening effort” was rated at 1 ESCU (no effort). Therefore, the scale for listening effort seems also to be advantageous compared with the scale for “subjective speech recognition” in the easy conditions with speech recognition scores of about 100%.
The ratings of “subjective stress level” on the other hand indicate that the subjects did not experience much stress. Even in the hard listening conditions, stress ratings were hardly in the upper half of the scale. Especially, the hearing-impaired listeners rated the stress level often as 1 a.u. (not at all). This observation is in agreement with anecdotal statements of the participants in the experiment and might be related to their familiarity with lab experiments.
EDA
The experimental situation activated neural information processing, which resulted in motor reactions of the speech production system as responses in the test. In addition, the low acoustic energy was also capable of triggering more complex physiological reactions, one of which was the variation of the monitored EDA. In contrast to the “measured speech recognition” and the subjective ratings, both methods of analyzing the EDA show a large scatter of the results as well as small or absent (nonsignificant) differences between the four test conditions for both subject groups. Even though the test conditions were selected to manifest very different “subjective listening effort”, differences in the EDA were difficult to demonstrate. In both methods, z-value and Δpeak rate, the first exhibited more pronounced differences between the easy and hard conditions for the normal-hearing subjects in noise and in reverberation as well as for the hearing-impaired subjects in reverberation, even though they were not significant. The z-value seems to capture at least a trend for stronger bodily reactions in the hard compared to the easy conditions.
z-values as a measure for the EDA were also used by Mackersie and Cones (2011) and Mackersie et al. (2015). Mackersie and Cones found significantly different z-values of the EDA for listening situations with differing difficulty but similar recognition scores. They interpreted the changes in EDA z-value as stress reactivity due to focused listening. In contrast, Mackersie et al. did not observe significantly different z-values of the EDA for conditions with varying SNR. However, the skin conductance of hearing-impaired listeners in the noisy conditions was significantly higher than in the quiet condition. Although z-values of the skin conductance were used by Mackersie and Cones and Mackersie et al., as well as in this study, the experiments differed with respect to the speech material used, disturbing factors, and durations for the recovery period as well as the calculation procedure of the z-values, which thus hinder direct comparisons.
The smaller differences in the z-value between the easy and hard noise condition in the hearing-impaired subjects compared with the normal-hearing subjects in this study might be related to the smaller differences in “measured speech recognition” and “subjective listening effort” as well as the lower stress experienced by the hearing-impaired subjects. Another reason might be the older age of the hearing-impaired subjects, which is frequently accompanied by skin alterations and therefore possible problems in recording the EDA. A potential general difference in the EDA recordings for the two subject groups of different ages is also supported by the significantly different measurement dynamic shown in Figure 3. That may be caused by differing habituation to hearing impairment and additional covariates, such as age and experience, with psychoacoustic test situations. Long habituation to situations and abilities and much experience with experimental conditions are suitable factors to reduce stress reactions.
Experimental Listening Conditions
The listening conditions were selected based on Rennies et al. (2014) and Schepker et al. (2016) to be able to present an easy noise condition with a low “subjective listening effort” rating of about 1–4 ESCU and a speech recognition score of 100%, and a hard noise condition with a high “subjective listening effort” rating of about 7–12 ESCU and a speech recognition score of about 85%. Based on the frequency-independent reverberation time T60, the two reverberant conditions possessed the same STI as the noise conditions. Although Rennies et al. and Schepker et al. showed that this STI calculation should be modified to take the frequency-dependent modulation transfer function, the hearing loss of the listeners, and the presentation level into account, the simplified STI was kept for this experiment to be able to select the same conditions as in the previous studies.
When comparing the scores for “measured speech recognition” in the hard condition to the previous results of Rennies et al. (2014) for normal-hearing subjects and Schepker et al. (2016) for hearing-impaired subjects, similar results were observed for the hearing-impaired subjects but not for the normal-hearing subjects. The normal-hearing subjects in Rennies et al. (2014) were less affected by reverberation than by noise for the same STI, as shown by higher recognition scores in the reverberant condition. By contrast, the hearing-impaired subjects of Schepker et al. (2016) achieved higher speech recognition scores in noise than in reverberation for the same STI. The normal-hearing subjects in the present experiments also scored lower in the reverberant condition than in the noise condition. These observations are limited to the hard conditions, because speech recognition scores were at the ceiling (100%) in the easy condition. As the age and the hearing thresholds of the normal-hearing subjects in this experiment were similar to those of Rennies et al. (2014), the only explanation for the difference is the different listening experience of the two subject groups. The normal-hearing subjects in the present experiments had little or no experience with this kind of listening test, in particular, the OLSA. The normal-hearing subjects in Rennies et al. (2014) had, on average, more and in some cases extensive experience with the test. Although all listeners in the present experiments were trained with two lists of the OLSA, the different amount of experience, in combination with the closed test material in the matrix test as discussed in Rennies et al. (2014), could influence the outcome in “measured speech recognition”.
Rating Context—Free Description of Conditions
The ratings of “subjective speech recognition”, “subjective listening effort”, and “subjective stress level” were made using category scales and hence, by nature, they are absolute judgments. Since the introduction of this class of judgments into psychophysics by Wever and Zener (1928), it has been acknowledged that these absolute judgments are in fact relative judgments with respect to a frame of reference or context. To explore the frame of reference that was built up by the subjects in their experimental situation, an open question was used during the interview at the end of the rating procedure to qualify the specific condition in words. The answers were distributed over three categories: environment, recognition and effort, and evaluation.
Among the expressions of the category environment, there was a distinction between the environments associated with the four different conditions. Here, the subjects’ perception of the virtual environment was well in line with what could be expected in a real environment. In those environments, the disturbing effects are attributed to the properties of the speaker’s voice.
For many normal-hearing subjects (73%), it was rather important to use the acoustic information they perceived via headphones for orientation purposes. Their expressions were related to visualized places, category environment. A successful orientation process might lower the stress that a person encounters when acoustically faced with an initially not identifiable environmental situation. Only 27% of the hearing-impaired subjects described imagined situations, which shows that this orienting action was of less importance for them during the experimental procedure.
The importance of the category recognition and effort and evaluation also varied between the groups of subjects but differed from the category environment. The majority of the hearing-impaired subjects used expressions for the perceived recognition and effort (71%) and evaluation (59%). Obviously, the speech recognition task and the related performance were of greater importance for the hearing-impaired subjects than for the normal-hearing ones. The comments concerning performance during the speech recognition task were partially accompanied by evaluations of the situation. Thus, high performance might suggest a positive evaluation and vice versa, as subjects for whom the performance is important are likely to comment on it by appropriate evaluations.
Comparing both groups of subjects, apart from the hearing ability, there are two additional covariates: age and experience in listening tests. The young normal-hearing subjects in this experiment only had little or no experience with these kinds of listening tests and especially with the OLSA. The missing experience of these subjects may generate higher stress, at least in the hard test conditions, which they may attempt to lower by orienting to a known hearing surrounding, as was named by 73% of the young normal-hearing subjects. The (for normal-hearing listeners) unusually poor speech recognition may also contribute to enhanced stress reactions. In contrast, however, the older hearing-impaired subjects were faced with a known experimental situation together with more expectedly poor speech recognition, which might reduce the likelihood of strong stress reactions. These findings correlate with the less pronounced differences in the subjective ratings and the smaller differences in the EDA.
Correlation Between Subjective Ratings and EDA
The differences between the easy and the hard conditions in the subjective ratings are, on the whole, also visible in the EDA results, albeit in a less pronounced (as less reliable) manner. In general, the normal-hearing subjects experienced larger effects than the hearing-impaired subjects in the EDA results as well as in the subjective ratings. However, Figure 10 shows a large scatter of the z-values for the same subjective scaling results and hence no clear relationship between the measures, as is also demonstrated by the small correlation coefficients. The correlation analysis between the EDA and the subjective ratings only revealed significant correlations for all three subjective ratings and the EDA z-values for the normal-hearing subjects in the noise condition. For the hearing-impaired subjects, only one significant correlation was found between the EDA z-values and the “subjective speech recognition” in the reverberant condition. Weak or absent correlations between physiological and subjective measures are in line with findings of Koelewijn et al. (2012) and Zekveld et al. (2011) for pupil response outcome measures, as well as Mackersie and Cones (2011) and Mackersie et al. (2015) for skin conductance. The EDA is apparently still influenced by additional factors that are unknown and thus could not be held constant throughout the experiment.
It is still uncertain whether the EDA would be better able to distinguish between listening conditions and show higher correlations with subjective ratings if it were possible to generate more stress than in the lab conditions applied here. It is also unclear whether other physiological measures (e.g., heart rate variability) would be more sensitive in differentiating between more or less stressful or effortful easy and hard listening conditions than the EDA. On the other hand, it can be questioned whether the subjective ratings, especially the “subjective listening effort”, are the “gold standard” for listening effort. Subjective ratings, as well as physiological values, might measure different aspects (Zekveld et al., 2010) and are regarded as multidimensional constructs influenced by several other factors (see, e.g., Hancock & Szalma, 2006; Yeh & Wickens, 1988). Further experiments are needed to analyze whether both approaches, subjective judgments as well as physiological measures, are needed to describe the complexity of listening effort and, therefore, whether physiological measures are able to complement subjective measures.
Conclusions
Ratings of “subjective listening effort” were successfully used with normal-hearing and hearing-impaired listeners to compare easy and hard listening conditions and show variations even for speech recognition scores of 100%. Listening situations with lower speech recognition scores and higher “subjective listening effort” display a (nonsignificant) trend toward higher skin conductance. z-transformed EDA data are more sensitive to variable requirements in listening situations than are Δpeak rates. Significant correlations between the physiological measure EDA and subjective ratings were observed only for normal-hearing listeners in the noise situation, and not for hearing-impaired listeners in either the noise or reverberant conditions. The responses to open questions revealed the different contexts of the ratings during the experimental conditions. In particular, they showed the different importance of orientation processes, speech recognition, and listening effort between the young normal-hearing listeners who are inexperienced in these types of test and the elderly hearing-impaired listeners with long habituation to hearing impairment and more experience in psychoacoustical tests.
Footnotes
Author Note
This article was previously published in a shortened version at the International Symposium on Auditory and Audiological Research, ISAAR 2015, in Nyborg, Denmark.
Acknowledgments
Declaration of Conflicting Interests
The authors declared no potential conflicts of interest with respect to the research, authorship, and/or publication of this article.
Funding
The authors disclosed receipt of the following financial support for the research, authorship, and/or publication of this article: Supported by governmental funding initiative “Niedersächsisches Vorab” of the Lower Saxony Ministry for Science and Culture, research focus “Hören im Alltag Oldenburg (HALLO).”