
Abstract
Several studies have established that Cochlear implant (CI) listeners rely on the tempo of music to judge the emotional content of music. However, a re-analysis of a study in which CI listeners judged the emotion conveyed by piano pieces on a scale from happy to sad revealed a weak correlation between tempo and emotion. The present study explored which temporal cues in music influence emotion judgments among normal hearing (NH) listeners, which might provide insights into the cues utilized by CI listeners. Experiment 1 was a replication of the Vannson et al. study with NH listeners using rhythmic patterns of piano created with congas. The temporal cues were preserved while the tonal ones were removed. The results showed (i) tempo was weakly correlated with emotion judgments, (ii) NH listeners’ judgments for congas were similar to CI listeners’ judgments for piano. In Experiment 2, two tasks were administered with congas played at three different tempi: emotion judgment and a tapping task to record listeners’ perceived tempo. Perceived tempo was a better predictor than the tempo, but its physical correlate, mean onset-to-onset difference (MOOD), a measure of the average time between notes, yielded higher correlations with NH listeners’ emotion judgments. This result suggests that instead of the tempo, listeners rely on the average time between consecutive notes to judge the emotional content of music. CI listeners could utilize this cue to judge the emotional content of music.
Introduction
Music is commonly considered a vessel of human emotions. It is impossible to encompass the entirety of the richness of all emotions conveyed by music, and studies have focused on the five basic emotions (happiness, sadness, fear, anger, and love/tenderness) or on two orthogonal dimensions representing pleasantness and arousal (Schubert, 1999). Out of the five basic emotions, happy and sad are the most easily recognized emotions in music (Fritz et al., 2009; Gabrielsson & Juslin, 2003; Juslin & Laukka, 2003) and are determined by two fundamental musical features: tempo and mode (Gabrielsson & Lindström, 2012; Gagnon & Peretz, 2003; Hevner, 1935, 1937). Tempo is the speed or rate of the musical rhythm (Tan et al., 2018) and mode (major or minor) refers to the tonality of a music piece (Hevner, 1935). Fast tempo and major mode are associated with happy emotions whereas slow tempo and minor mode are generally linked with sad emotions (Juslin & Laukka, 2003). Although both tempo and mode play a crucial role in shaping music emotional expression, studies have demonstrated that tempo is more dominant in judging happy-sad emotions (Dalla Bella et al., 2001; Gagnon & Peretz, 2003). The difference between major and minor modes is subtle, being just one semitone, which can make it difficult to perceive for people with profound hearing impairment such as Cochlear Implant (CI) listeners (Knobloch et al., 2018).
A CI is a prosthetic device designed to restore speech perception for people with sensorineural hearing loss, by directly stimulating the auditory nerve. (Zeng, 2004). CIs have been shown to significantly improve speech perception, communication abilities, and quality of life for many people with severe to profound hearing loss (McRackan et al., 2018). Many studies have provided accounts of developments in sound processing and their impact on CI listeners’ music perception (McDermott, 2004). Currently, most sound processing strategies discard the temporal fine structure and preserve only the temporal envelope of stimuli filtered into up to 22 frequency bands. The preservation of the temporal envelope allows the extraction of temporal aspects of musical stimuli. CI listeners perform at a nearly comparable level to normal-hearing (NH) listeners in tasks such as simple rhythm pattern perception and identification (Cooper et al., 2008; Gfeller et al., 1997; Kong et al., 2004). However, discrimination of complex rhythmic patterns remains a challenge for most CI listeners (Jiam & Limb, 2019). Spectral limitations in CI devices are related to the small number of channels, current spread and physical placement of the electrodes, leading to CI systems’ limited frequency resolution (Zeng, 2004). This leads to poor perception of the spectral aspects of music. CI listeners perform poorly in tasks involving spectral aspects of music, such as pitch perception, timbre perception, instrument identification, and melody recognition (Kong et al., 2004, 2011; McDermott, 2004).
Despite poor pitch perception, CI listeners tend to recognize the basic emotions of happy and sad in music quite well. However, studies have shown that they may have difficulty recognizing other basic emotions, such as anger, disgust, and fear (Ambert-Dahan et al., 2015; Luo & Warner, 2020). It has been argued that CI listeners rely mainly on the tempo of the music to judge the conveyed emotion (Caldwell et al., 2015). Hopyan et al., (2016) found that a change in musical mode did not affect emotion judgments of music by CI listeners, but a change in tempo did affect their judgments.
Vannson et al. (2015) asked 11 NH listeners and 19 CI listeners to rate the emotion conveyed by 28 piano pieces. Fourteen piano clips were intended to convey happiness, and 14 to convey sadness (Vieillard et al., 2008). Although CI listeners’ results differed slightly from those of the NH listeners, the former on average judged the emotion of the music pieces accurately: all of the sad pieces were judged as “sad,” indicated by an emotion rating below 50% on the happy/sad scale; all of the happy pieces received an emotion rating above 50%. As the effect of tempo was highly significant, the authors concluded that CI listeners probably relied on tempo to rate emotion.
Marozeau (2021) conducted a re-analysis of the data of Vannson et al. (2015). The re-analysis revealed that the emotion judgments were not correlated with tempo when only happy pieces were considered, and a weak correlation was found when only the sad pieces were considered. The weak correlations between tempo and emotion judgments in the subsets of music pieces suggested that tempo may not be a reliable cue in judging emotion.
The goal of the current study was to investigate the utilization of tonal and temporal cues in emotion recognition by NH listeners. Two experiments were conducted. Based on the findings from the two experiments, the aim was to extrapolate and predict possible cues that might have been used by the CI listeners of Vannson et al. (2015) to judge emotion in music. Since CI listeners may not perceive tonal cues, they would be expected to rely primarily on temporal cues. However, given the possibility that other cues may covary with mode, one cannot rule out the possibility that tonal cues might also play a role. The first experiment aimed to ascertain the extent to which emotion judgments can be made solely based on temporal cues in music. The experiment of Vannson et al. (2015) was replicated with NH listeners and a non-tonal instrument: the congas. The aim was to investigate if NH listeners could judge emotion based on the tempo of the music pieces. The hypothesis was that, with non-tonal stimuli, NH listeners’ emotion judgments would be similar to those of CI listeners for piano stimuli, as found by Vannson et al. (2015). In both cases, emotional judgments would be largely based on temporal cues.
The tempo of music pieces is based on the music score and does not always correspond to the perceived tempo. Throughout this paper, a distinction is made between the two terms, “assigned tempo” and “perceived tempo”. Assigned tempo is written in the music score, typically indexed in beats per minute (BPM), while perceived tempo corresponds to the rate at which the musical beat is felt by the listener, and is strongly correlated with preferred tempo. Preferred tempo corresponds to the speed of sounds that appears most natural, and people are able to synchronize their motor responses such as tapping to the beat (London et al., 2019; Repp & Su, 2013; van Noorden & Moelants, 1999). In laboratories, perceived tempo is generally studied with a finger-tapping paradigm (Hammerschmidt et al., 2021; Repp & Su, 2013).
While the assigned and the perceived tempo are often similar for a music piece with a strong emphasis on each beat (such as in techno music), one may tap the beat at a different speed from the assigned tempo, sometimes at half or double the assigned tempo (Gabrielsson & Lindström, 2012). It is possible that the perceived tempo is a more appropriate predictor of music emotion than the assigned tempo. A second experiment was designed to investigate the extent to which NH listeners’ perceived tempo can predict their judgments of emotion in music. The congas from the first experiment were played at three assigned tempi 60, 120, and 150 BPM. The selection of the three tempi values was based on the following: (i) listeners can tap at rates up to 300 taps per minute (Tan et al., 2018), (ii) The assigned tempo of 120 BPM corresponds to an estimate of preferred tempo (Moelants, 2002), (iii) The perceived tempo might be the same, double, or half the assigned tempo. As an example, for congas with an assigned tempo of 120 BPM, one might tap at 60 BPM (half) or 240 BPM (double). Similarly, for congas with an assigned tempo of 150 BPM, one might tap at 75 BPM (half), or 300 BPM (double). The hypothesis was that emotion judgments would be better predicted by the perceived tempo than the assigned tempo.
Marozeau (2021) proposed a new physical correlate of perceived tempo called Mean-Onset-to-Onset Difference (MOOD), a measure of average time between the notes. The final portion of this paper tests whether the objective descriptor, MOOD, can accurately predict emotion judgments of music.
Experiment 1
Listeners
Twelve NH listeners (10 males, 2 females) aged 22 to 29 years (mean 25 ± 2.3 years) participated in this experiment. All were graduate students at the Technical University of Denmark. The listeners came from different countries with varied cultural backgrounds but were widely exposed to western music. All listeners had normal hearing based on audiometry or a standard screening test. Prior to the experiment, listeners were asked the number of years they received musical training, if any. Six stated that they had received formal education in music for 10 years or more. Formal education in music included any of the following: private music lessons, music instrument lessons as a part of an educational curriculum, or vocal musical training. Two stated that they played musical instrument (bass) as a leisure activity for more than 12 years and the remaining four did not have any kind of musical training. The Science-Ethics Committee for the Capital Region of Denmark approved the research (reference H-16036391). All listeners provided written informed consent before participation and were paid for taking part in the study.
Apparatus
The experiments were carried out in a double-walled sound-insulated listening booth. The experiments were designed and implemented in the Graphical User Interface (GUI) of MATLAB. The listeners were seated in front of a computer with instructions displayed on the GUI. Responses were recorded using a mouse or keyboard depending on the task required. During the experiment, audio was played via an RME Fireface audio interface at a sample rate of 48 kHz and a 24-bit audio bit depth. The audio was presented binaurally using Sennheiser HDA-650 headphones at a sound level of 70 dB SPL.
Stimuli
Two sets of stimuli were used. The first was the same as used in Vannson et al. (2015) and originally designed by Vieillard et al. (2008). It was composed of 28 piano clips, including 14 composed to convey happiness and 14 to convey sadness. The happy pieces were written in major mode and had an assigned tempo range of 92 BPM – 196 BPM (mean – 137 BPM). The sad pieces were written in minor mode with an assigned tempo range of 40–60 BPM (mean – 46 BPM). The music excerpts were composed by a professional musician, were devoid of lyrics, and contained resolved musical phrases based on classical western harmony. The original music scores were in MIDI format and were obtained from https://peretzlab.ca/online-test-material/material/emotional-clips/. To recreate realistic musical stimuli, each note of the score was replaced by the corresponding recording of a note played on grand piano using music production software (Ableton Live). The second set of stimuli was similar, except that samples of congas were used instead of piano. All of the notes played on the F-clef musical staff (played with the left hand) were recreated with a low conga, and all the notes on the G-clef staff (played with the right hand) were recreated with a high conga. Figure 1 illustrates the conversion of one of the piano stimuli into congas by mapping the onset of the notes played on the right hand to the high congas, and that of the notes played on the left hand to the low congas. The duration of each musical excerpt was approximately 10 to 12 s.

Example of a piano stimuli score adapted to a congas score. The temporal cues were kept, while the tonal ones were removed.
Verbal instructions were given to the listeners, followed by a training session to familiarize them with the task. Listeners were asked to indicate the degree to which they thought the piece was intended by the composer to be happy or sad. The music clips used in the training session were not used in the actual experiment. The interface had instructions and a continuous scale with happy/sad anchors on either extreme of the slider. The range of the scale was 0 (sad) to 100 (happy). Once the listeners pressed the validate button on the GUI to save their response, the next piece was presented. Listeners first responded to the congas and then to the piano pieces in a random order. This was done to eliminate any priming received from the tonal information and melodic cues of the piano pieces, which might bias the emotion ratings for congas.
Results
Figure 2 shows the average emotion judgments for each music piece. The listeners could correctly identify the intended emotion for both piano and conga but were more accurate for piano. In general, all happy pieces were judged as happier than the sad pieces (scores > 50% on the happy/sad scale).

Mean emotion judgments of 12 NH listeners for each music piece. The first 14 pieces were composed as happy and the rest as sad. Red and blue bars represent the average ratings for pieces played on piano and congas, respectively. The error bars represent standard errors.
A mixed linear analysis was performed with statistical analysis software JMP15 using the Rationalized Arcsine Transform (RAU, Studebaker, 1985) of the judgments to account for the bounded data range. The listener and piece were considered random factors; the intended emotion (happy/sad) and the instrument (piano/congas) were fixed effects. The following interactions were included: emotion*instrument (fixed), listener*emotion (random), listener*instrument (random) and listener*instrument*emotion (random). There was a significant effect of intended emotion (F (1,11) = 246,91, p < 0.001), but not of instrument (F(1,11) = 0.10, p = 0.7574); there was a significant interaction of the two (F (1,11) = 63.36, p < 0.001). A post-hoc Tukey HSD analysis revealed that each of the four combinations of instrument and intended emotion were significantly different (p < 0.05), confirming that listeners could identify the intended emotion with both instruments, but were better for the piano.
Figure 3 shows a scatterplot of the NH data collected in this experiment, versus the CI data collected by Vannson et al. (2015). The two studies were similar, except that in Vannson et al. (2015) CI listeners rated the stimuli played on a piano, while here NH listeners rated the same stimuli played on the congas. The data were highly correlated (r = 0.95, df = 27, p < 0.0001). Nevertheless, it is worth noting that the orthogonal regression line had a steeper slope and a more negative ordinate (y = 1.7x – 31.45) than the identity line, signifying that the data for the NH listeners were more compressed towards the middle of the scale than for the CI listeners.
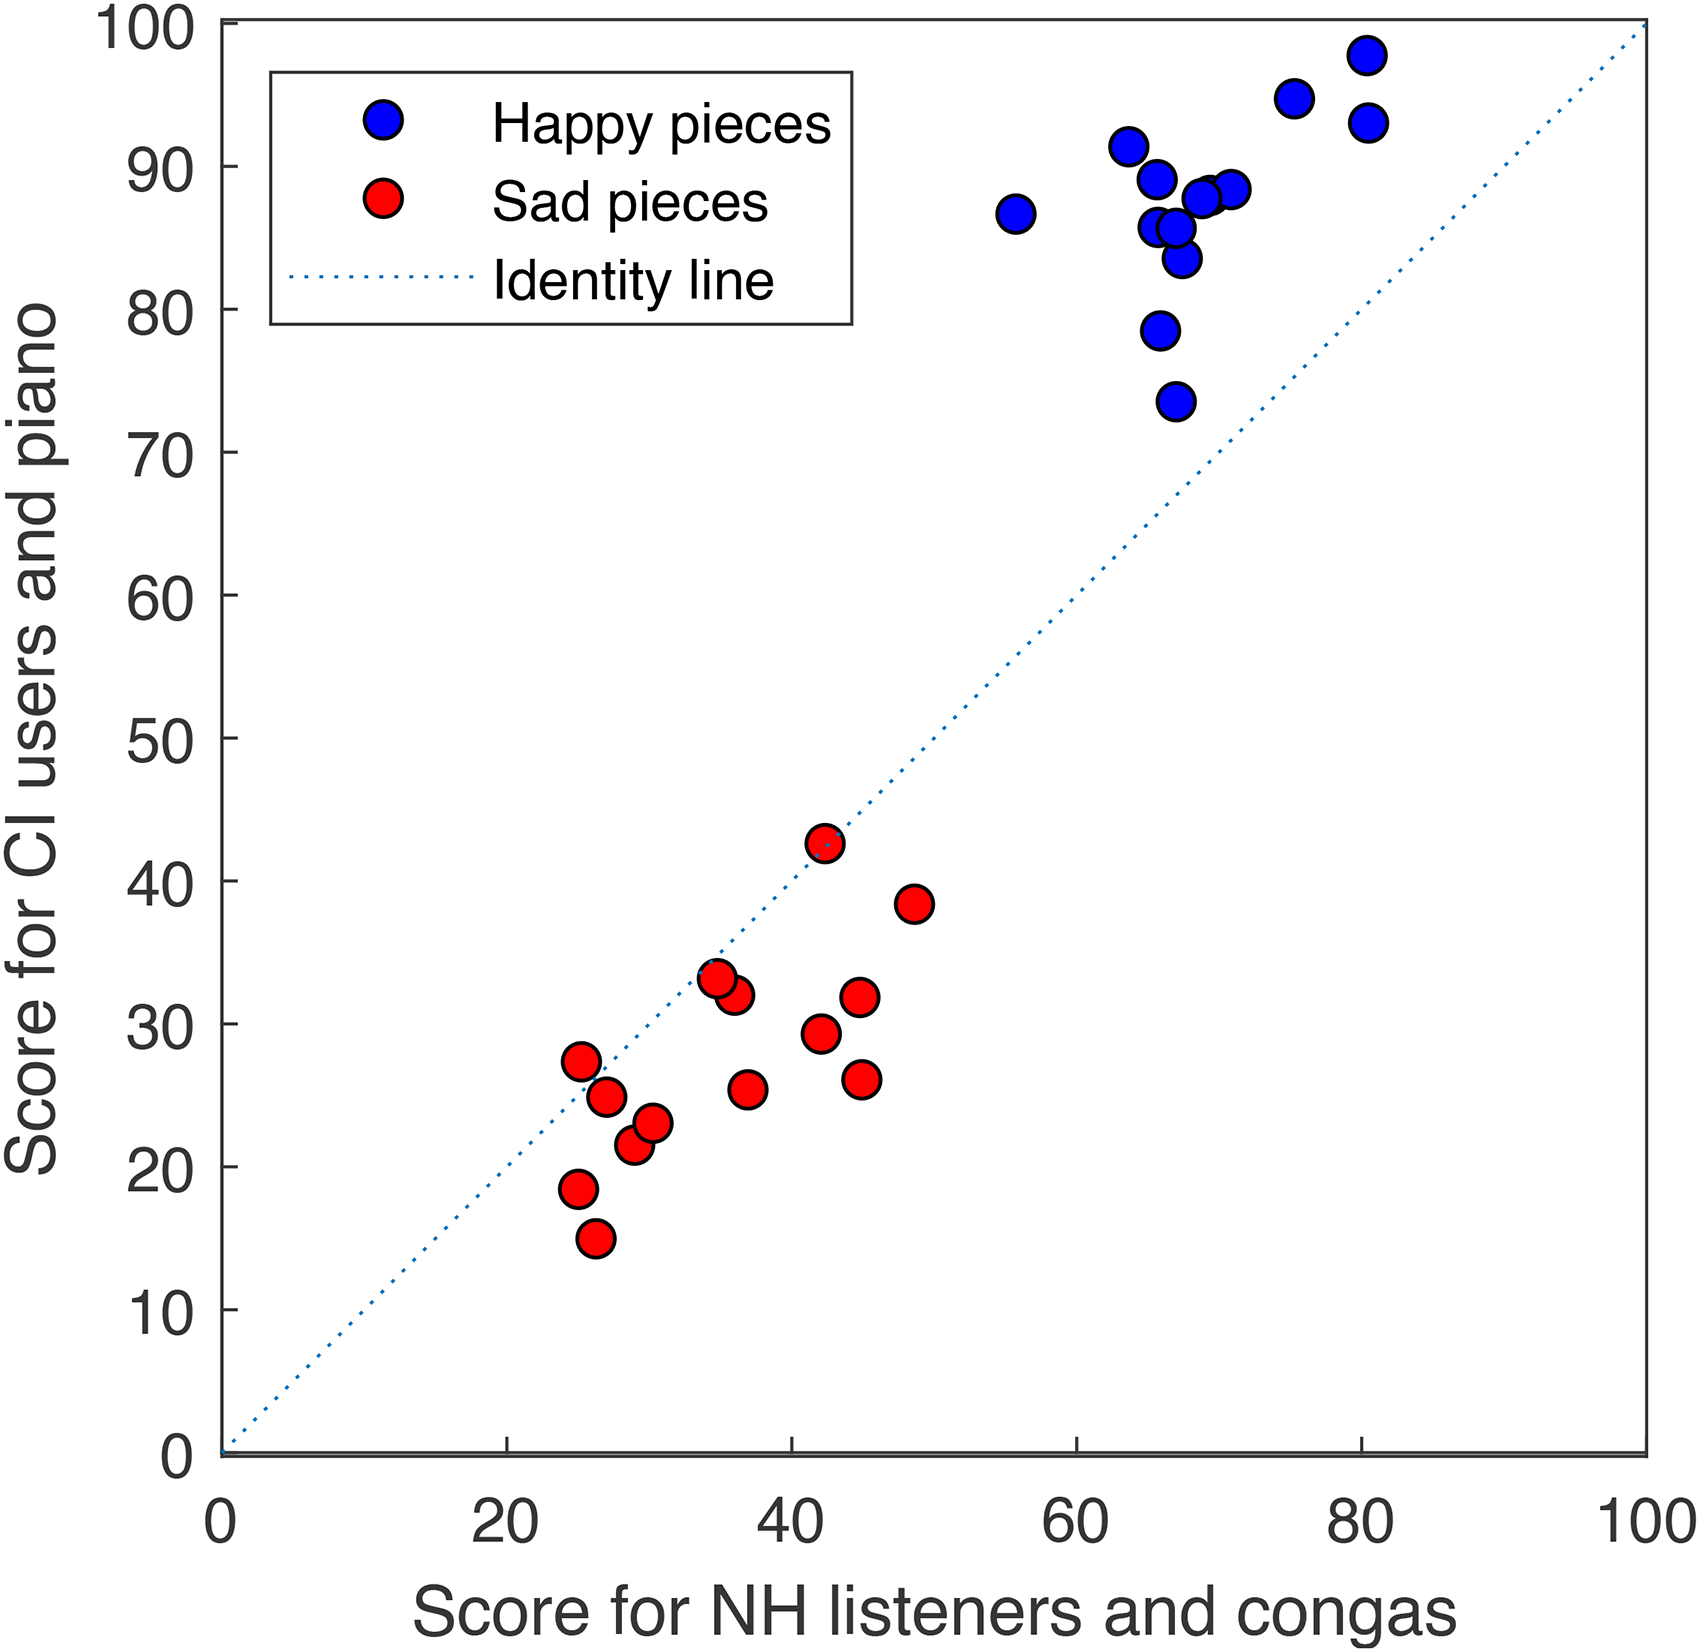
Scatterplot of scores collected in this study with NH listeners and congas against scores collected by vannson et al. with bilateral CI listeners and piano. Scores are RAU transformed.
The effect of assigned tempo on judged emotion was evaluated. As the happy pieces had a fast tempo and sad pieces had a slow tempo, they were analyzed as two subsets of music pieces. There was no significant correlation between judged emotion and assigned tempo when considering only the subset of happy pieces (R2 = 0.13, df = 13, p = 0.20), or the subset of sad pieces (R2 = 0.16, df = 13, p = 0.6).
The findings of this experiment suggest two key points: firstly, the intended emotion of a musical composition can be judged solely relying on temporal cues. Secondly, the assigned tempo does not appear to be the primary cue influencing listeners’ emotion judgments. Instead, it seems that other temporal cues play a more significant role. This implies that modifying the assigned tempo of a music piece while maintaining the relative onset timing between notes might aid in indicating its perceived tempo and play a significant role in predicting listeners’ emotion judgments. This approach was tested in experiment 2.
Listeners
Twelve NH listeners (including five females) (mean 26 ± 2.8 years) took part in Experiment 2. None of them participated in Experiment 1. The listeners were recruited through a listener database and advertisement of the study on the university portal. Six listeners stated that they received formal education in music for 8 years or more, and six had no formal education in music. All listeners provided written informed consent before participation and were paid for taking part in the study.
Stimuli
The stimuli were a modified version of those used in Experiment 1. Each of the 28 congas clips was played at three assigned tempos: 60 BPM, 120 BPM, and 150 BPM, resulting in 84 stimuli (28 pieces * 3 tempi). The assigned tempo was set using the
Procedure
Experiment 2 consisted of two tasks: The first task was the same emotion judgment task as Experiment 1. In the second task, the listeners reproduced their perceived tempo by tapping on any keyboard key. The listeners were instructed to press only one key of their choice on the keyboard by tapping with one finger. They were further instructed to indicate their perceived tempo and not to tap on every note.
The listeners started the perceived tempo production task by clicking a ‘push’ button on the GUI. A two-second gap was inserted between the push and the start of the track. Once the track started, the GUI instructed ‘Start tapping in 3,2,1’. The timer to record the perceived tempo started only after the first three seconds of the music piece had been played. This was done so that listeners could get a sense of the underlying pulsation of the music piece. However, they were informed that they could start tapping at any point regardless of the timer's start and prior instructions that appeared on the screen. While the listeners were tapping, the word ‘Tapping’ was displayed. In this way, the listeners were assured that the tapping was being recorded. After completing one music clip, the listeners started the next clip by pressing the assigned button.
Results
Figure 4 shows the emotion judgments for each of the 12 listeners as a function of their tapping speed (i.e., perceived tempo). Each panel represents the responses of one listener. The six panels on the left show responses from the listeners who did not have formal music training, and the six on the right show the responses from the ones with musical training. The average tapping speed for each stimulus is shown on the X-axis. The Y-axis shows the emotion judgment for each piece. Blue and red symbols depict happy and sad pieces, and pieces presented at 60, 120 and 150 BPM are shown by circles, triangles and squares, respectively. Despite the lack of tonal and assigned tempo cues, the happy stimuli were judged overall as happier than the sad ones. The blue lines are the regression lines relating emotion ratings and tapping speeds. The correlation between those quantities varied from −0.13 (n.s.) to 0.73 (p < 0.0001). The correlation was significant for 10 out of 12 listeners.
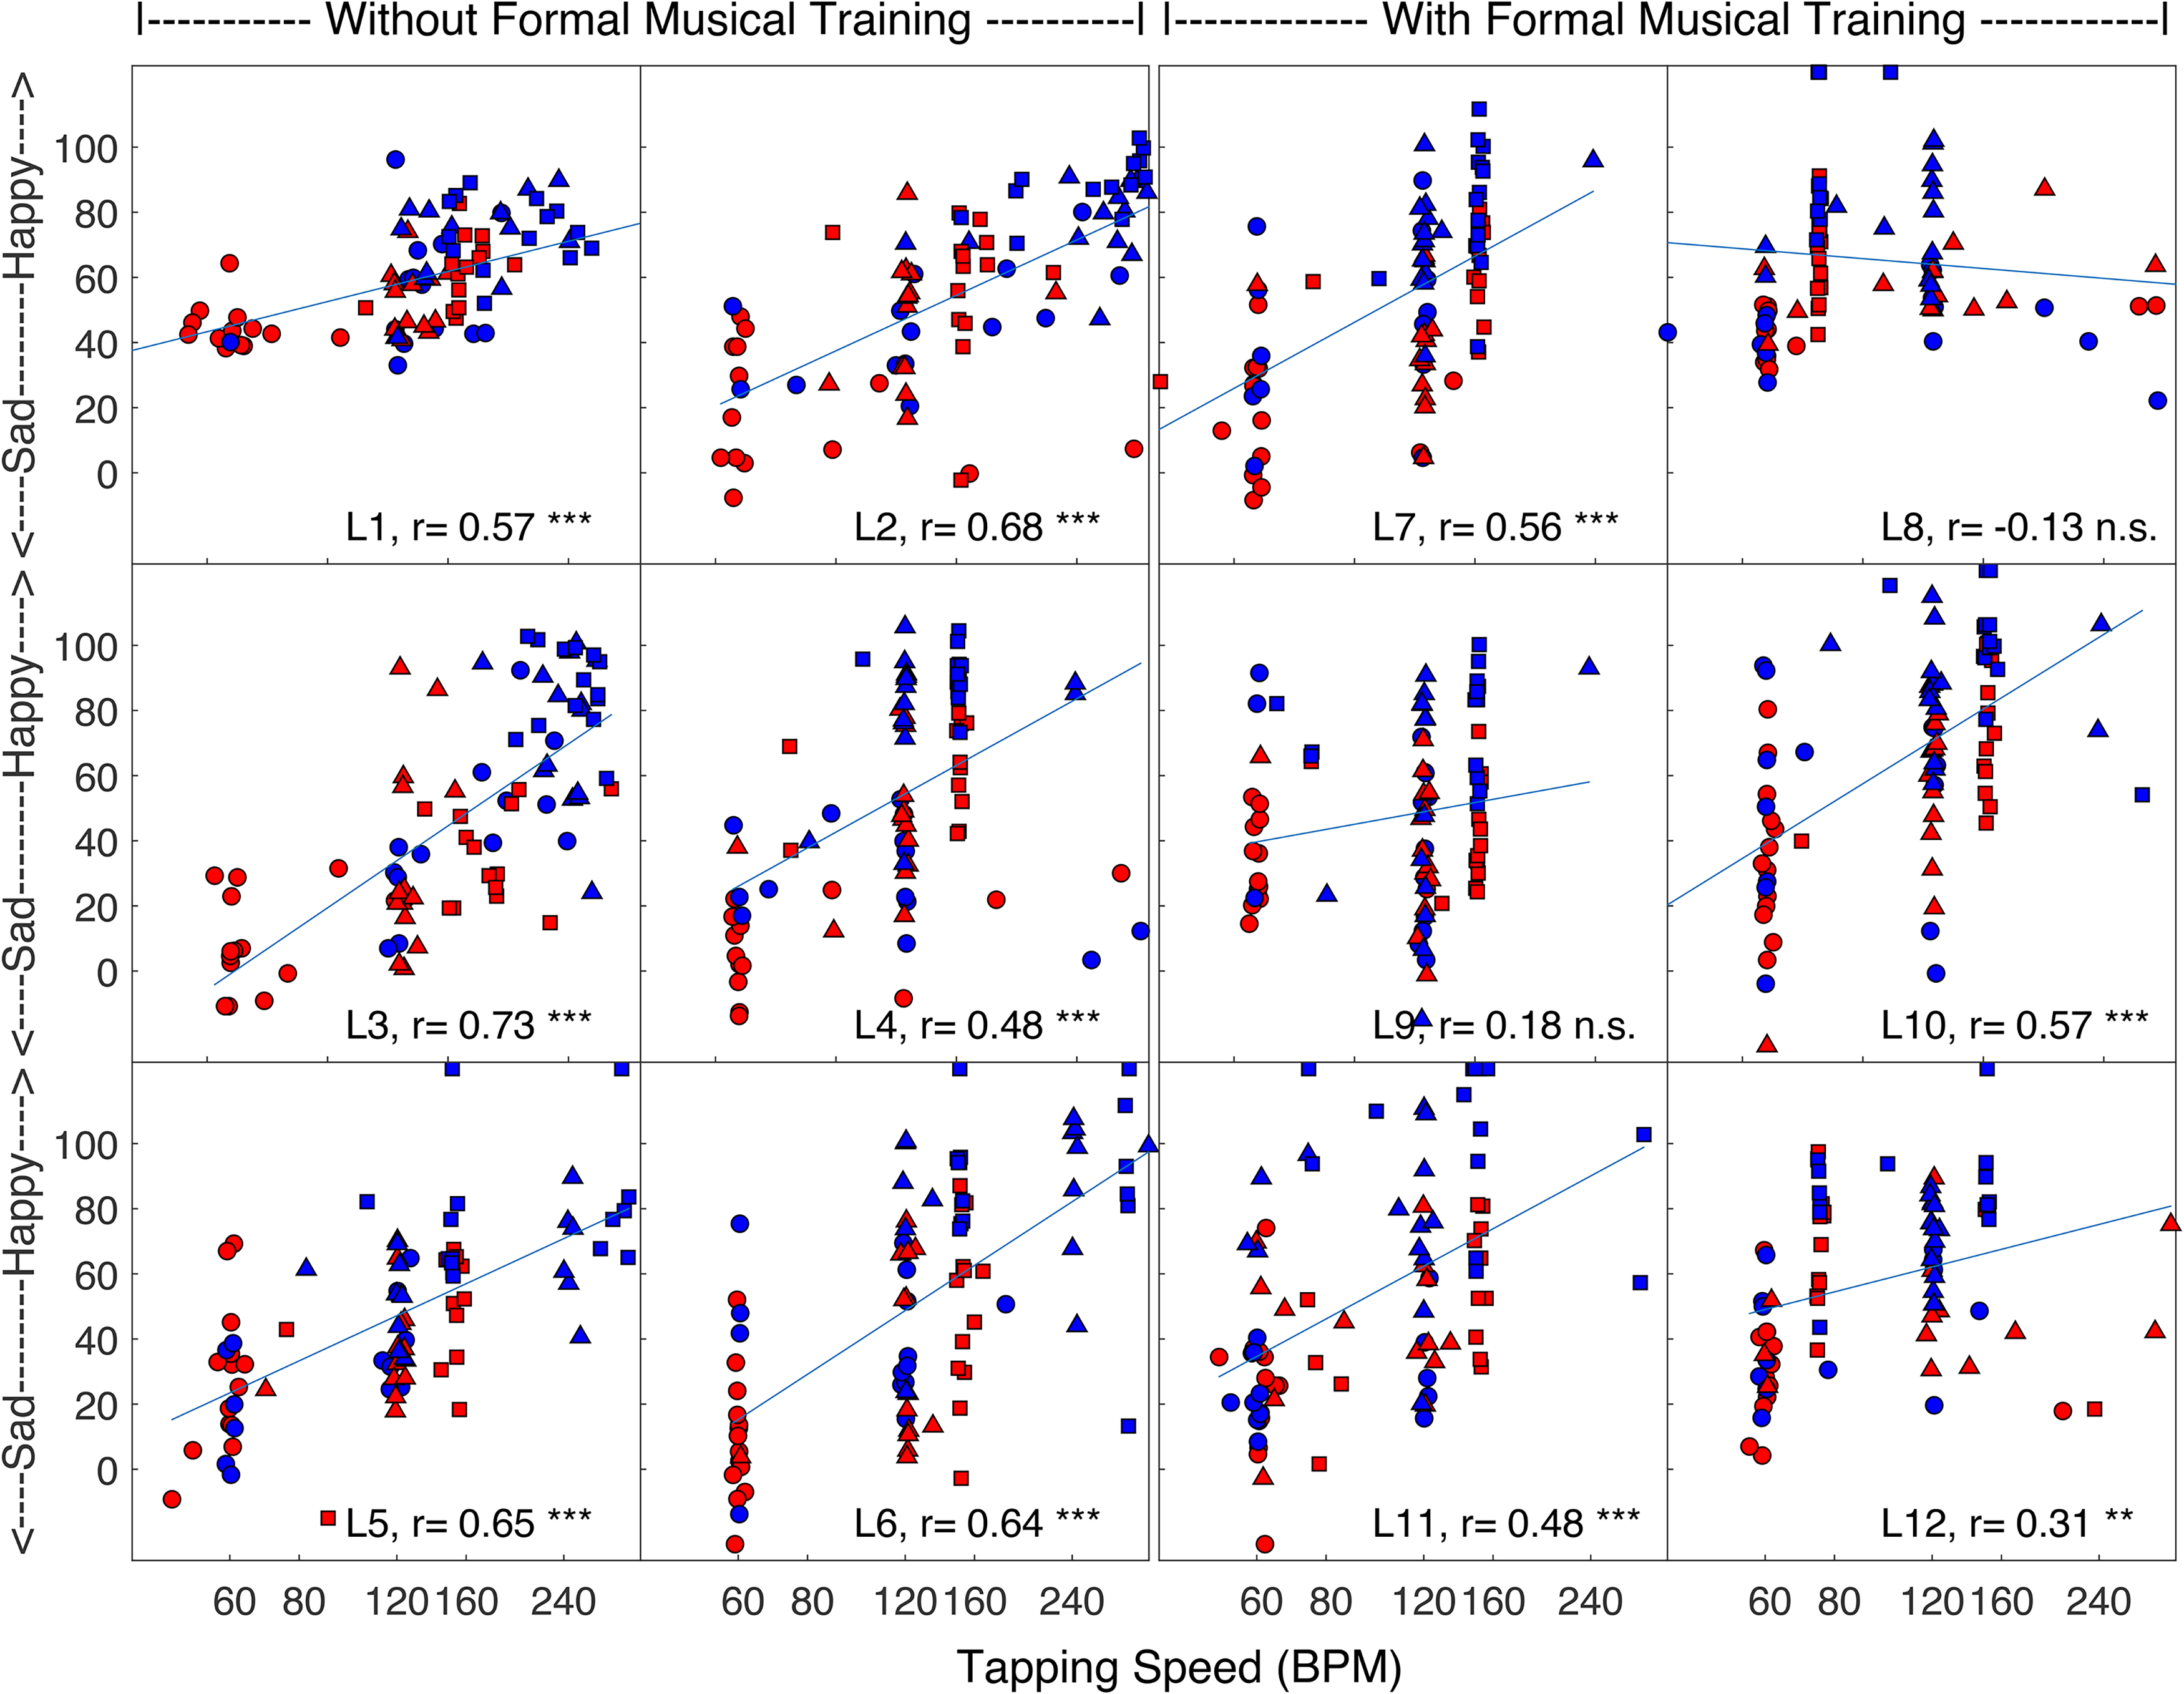
Individual emotion judgments of 12 NH listeners as function of their tapping speed for congas played at tempi of 60 BPM (circles), 120 BPM (triangles) and 150 BPM (squares). The color represents intended emotion: blue for happy and red for sad. The y-axis shows RAU transformed scores.
A mixed linear model was implemented with RAU-transformed judgments as dependent factor, listeners and music pieces as random effects, and the tapping speed and the intended emotion as fixed effects. The following interactions were included: tapping speed*emotion (fixed), listener*tapping speed (random), listener* emotion (random), listener*tapping speed* emotion (random). There were significant effects of tapping speed (F(1,10.96) = 29.5883, p = 0.002), and emotion (F(1,10.55)= 85.8142, p < 0.001), but not their interaction (F(1,9.997) = 2.1188, p = 0.0104). The regression analysis revealed that happy pieces had a significantly higher offset of 18 points on the RAU scale than sad pieces. Additionally, there was a positive slope of 0.19 between judged emotion and tapping speed. In simpler terms, an increase of 100 BPM in tapping speed corresponds approximately to a difference in emotion judgment equivalent to the contrast between happy and sad pieces.
A mixed linear model was run with the ratio of tapping speed and the assigned tempo as dependent variable, the intended emotion as a fixed factor, and listener and piece as random factors. There was a significant effect of intended emotion (F(1,19.08) = 14.7, p = 0.0011). On average, the mean tapping rate for the “happy” pieces was 1.45 times faster than the assigned tempo (s.e. = 0.09), while for the “sad” pieces, the mean tapping rate was similar to the assigned tempo (mean ratio = 1.04, s.e. = 0.09). Regression analysis revealed a significant effect of tapping speed when considering only the happy pieces (F(1,9.048) = 18.61, p = 0.0019), with a slope of 0.1662. There was also a significant effect of tapping speed for the subset of sad pieces (F(1,11.04)= 23.75, p = 0.0005) with a slope of 0.23. The results support the hypothesis that the perceived tempo is a better predictor of intended music emotion than assigned tempo.
Although perceived tempo was found to be a better predictor of emotion in music, it would be more convenient to use an objective descriptor based on the signal to accurately predict the perceived emotion of a new piece of music. In a recent study, Marozeau (2021) demonstrated that the CI emotion judgments obtained by Vannson et al. (2015) were strongly correlated with a physical descriptor called mean-onset-to-onset difference (MOOD). Therefore, it is reasonable to expect that this descriptor would also be correlated with the NH listeners’ emotion judgments from the current experiment, thereby providing an objective measure related to perceived emotion.
To assess if an objective descriptor could predict the emotion judgments, MOOD index was extracted for each piece. The conga stimuli from Experiment 2 were processed using the MiningSuite Toolbox (Lartillot, 2019) to extract the position of each major waveform peak, corresponding to the onset of a note. Then, the log of the geometric mean time difference between all consecutive peaks, the MOOD index was computed:
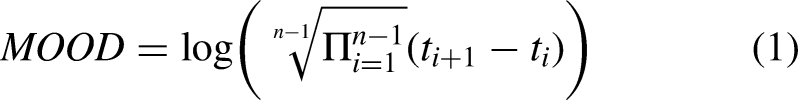
Figure 5 plots the judgments of Experiment 2 as a function of the MOOD index and shows their correlation. There was a correlation for each listener (ranging from r = 0.47 to r = 0.85), showing that MOOD can predict each listeners’ emotion judgments.

Individual emotion judgments of 12 NH listeners as function of the MOOD index for congas played at tempo of 60 BPM (circles), 120 BPM (triangles) and 150 BPM (squares). The color represents intended emotion: blue for happy and red for sad. MOOD values are displayed on a logarithmic scale of seconds. The y-axis shows RAU transformed scores.
Figure 6 shows that MOOD can also accurately predict the average results with a correlation of r = 0.94 (df = 83, p < 0.001). Moreover, this correlation was significantly higher (t(166) = 3.18, p < 0.001) than the correlation observed between the average judgment score and the average tapping speed (r = 0.85, df = 83, p < 0.001). The MOOD index was also highly correlated with the perceived tempo (r = −0.88, df = 83, p < 0.001).
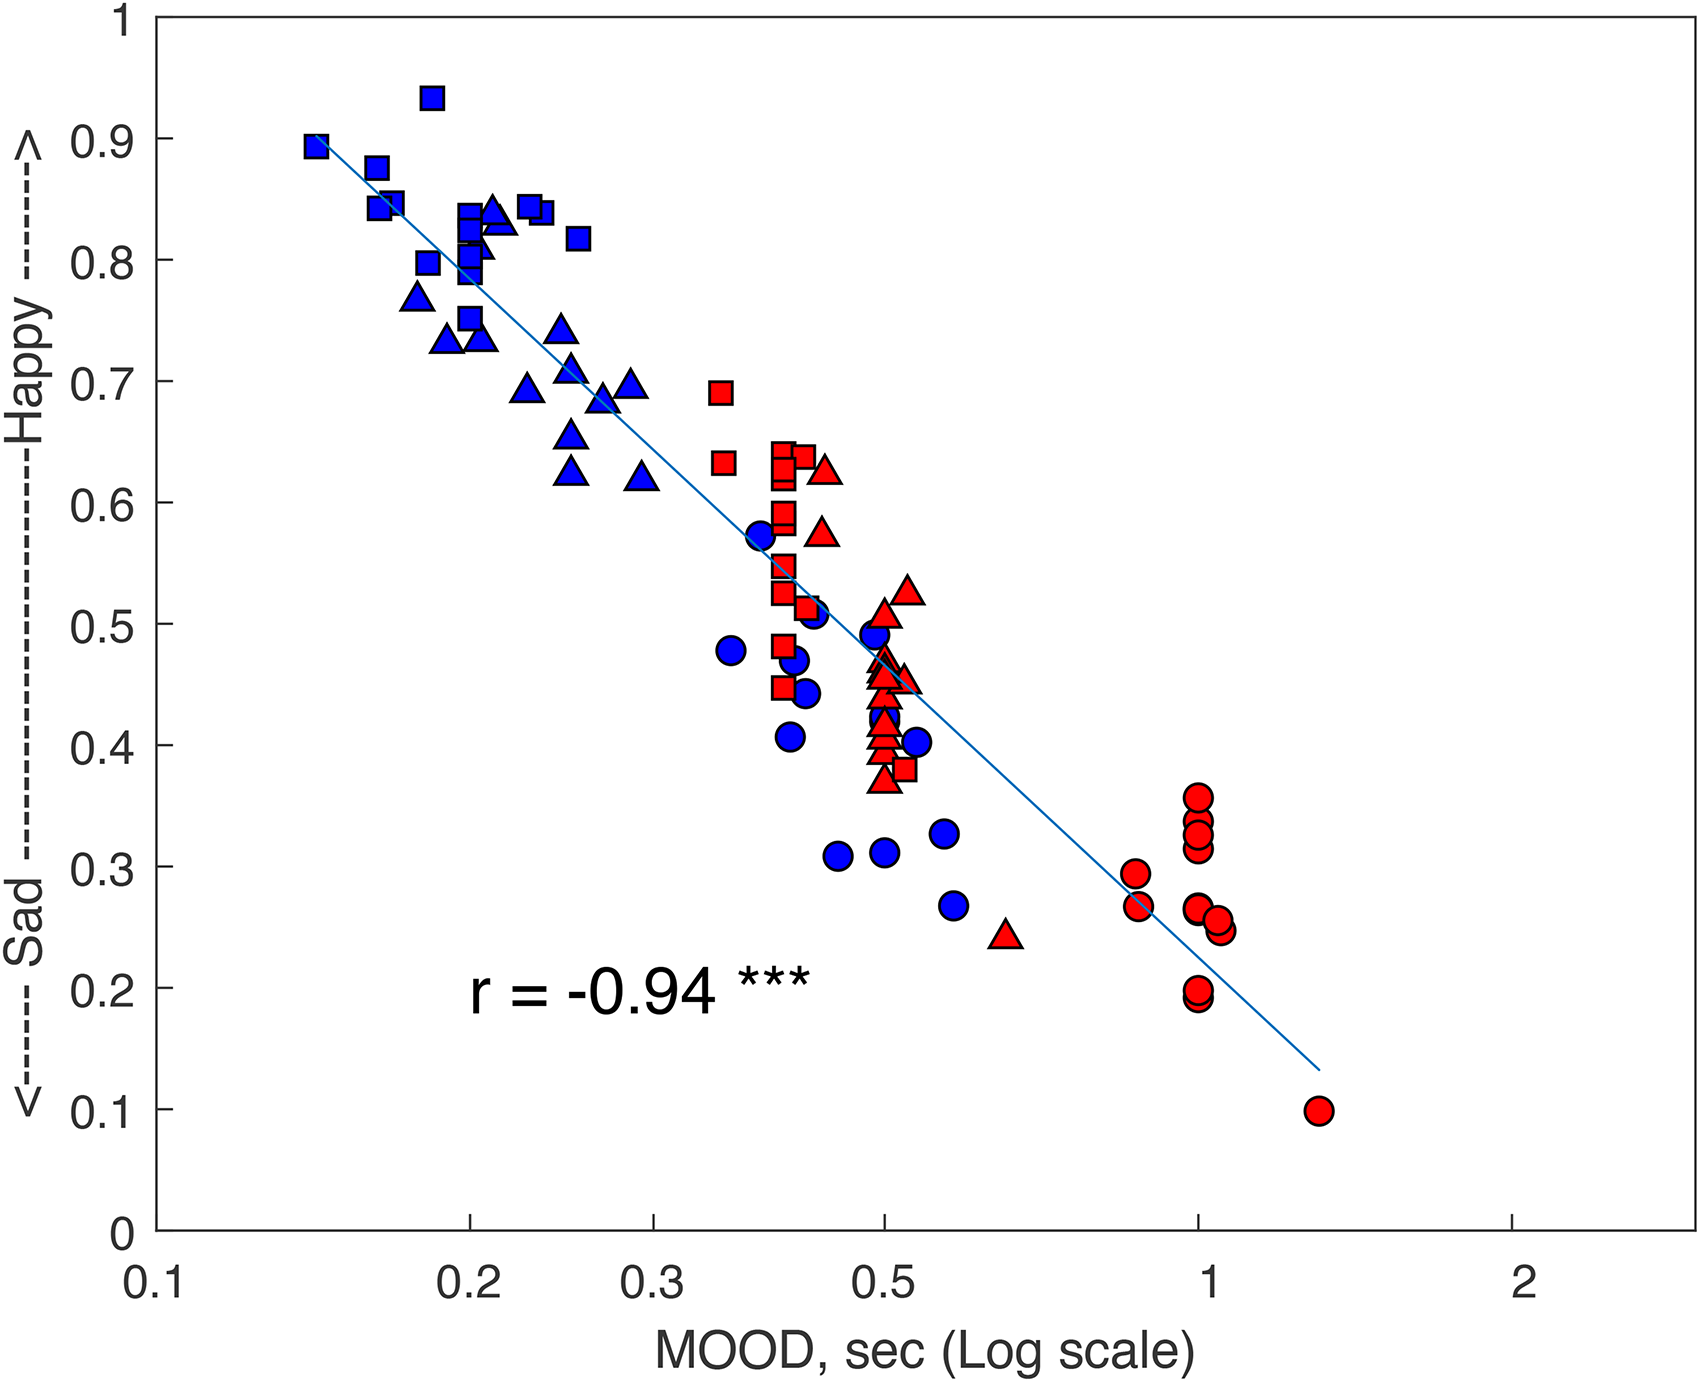
Average emotion judgments of 12 NH listeners for congas pieces as a function of MOOD in seconds for congas played at tempi of 60 BPM (circles), 120 BPM (triangles) and 150 BPM (squares). The color represents intended emotion: blue for happy and red for sad. MOOD values are displayed on a logarithmic scale of seconds. The y-axis shows RAU transformed scores.
Mode and Assigned Tempo are not Necessary to Judge the Emotion Conveyed by Music
The first experiment showed that NH listeners were able to identify the intended emotion of music pieces without any tonal information, suggesting that they can use temporal cues to perceive emotion in music. Figure 2 showed a similar trend when the pieces were played on the piano or the congas (without tonal information). Although the separation between judgments for happy and sad pieces was larger when they were played on the piano (average ratings of 82% and 20% for the happy and sad pieces, respectively) than when played on the congas (68% for the happy and 36% for the sad), the listeners scored well above chance in identifying the emotion of a piece of music stripped of all tonal information. This supports the study of Laukka and Gabrielsson (2000) showing that listeners were able to judge the intended emotion from the drummer's performance for three rhythms (swing, waltz, and beat). However, the judged emotion was weakly correlated with the assigned tempo when considering the happy and sad pieces separately. As the sad pieces had slow assigned tempi, ranging from 40 to 60 BPM, and the happy pieces had faster tempi, ranging from 96 to 196 BPM, it is possible that the listeners used assigned tempo in a categorical way (i.e., everything below 75 BPM was judged as sad, and everything above 75 BPM as happy). Alternatively, they could have used other temporal cues.
Modeling CI Perception of Music
Figure 3 shows that CI listeners’ judgments of emotion for piano pieces (Vannson et al., 2015) were similar to those of NH listeners with congas. For both NH and CI listeners, the judged emotion was weakly correlated with the assigned tempo when considering the happy and sad pieces separately. This result suggests that NH listeners’ data with music composed of only temporal cues can serve as a useful model to understand how CI listeners perceive music in general, without claiming that their experiences are identical. It is analogous to a speech vocoder that can model speech perception scores, but not the sound quality of the speech (Karoui et al., 2019). A speech vocoder is a valuable tool for studying speech perception in CI listeners as it simulates speech performance of CI listeners with NH listeners. Although there is a common misconception that listening through a vocoder is equivalent to listening through a CI, several studies have shown that this is not the case (Karoui et al., 2019; Marozeau et al., 2020).
Perceived Tempo for Judging Music Emotion
Within the sub-groups of happy and sad pieces, the lack of effect of assigned tempo might indicate that the tempo as assigned by the composer on the music score was not perceived as such by the listeners. It was hypothesized that they based their judgments on their perceived tempo instead of the assigned tempo. This led us to design and conduct experiment 2 in which the listeners were asked to tap to stimuli that varied in assigned tempo.
If the listeners tapped at the assigned tempo, the data, as displayed in Figure 4, would have taken the shape of three vertical lines at 60, 120, and 150 BPM. This pattern can almost be observed for L9, with the exception of one stimulus played at 120 BPM which was tapped at twice (about 240 BPM) the assigned tempo and three stimuli tapped at half the assigned tempo (originally at 150 BPM but tapped around 75 BPM). Also, the tapping speeds of listeners L7 and L10 quite accurately matched the assigned tempi. Those three listeners (L7, L9, and L10) had received formal musical training. At the other extreme, three listeners without musical training (L1, L2, and L3) showed continuous distributions of tapping speeds. The correlation between tapping speeds and emotion judgments varied between listeners. For listeners L8 and L9, there was no correlation between judged emotion and tapping speed. In contrast, for listeners, L1, L2, L3, L5, and L6, the correlation was above 0.55. These five listeners never had any music training. A t-test on the Fisher Z-transformed correlations showed that the correlation was significantly larger for the listeners without musical training than those with music training (t(10) = 3.0715, p = 0.0118). The findings of this experiment support those of Scheurich et al., (2018) demonstrating that musicians exhibit greater synchronization accuracy in tapping tasks than non-musicians.
Groove as a Possible cue
Apart from synchronization accuracy, another possibility is that the listeners without musical training, specifically L1, L2, and L3, tapped on every note of the music pieces or used cues such as groove, to judge the emotion of the pieces. Groove is an attribute of music which makes people move to music (Madison, 2006; Matthews et al., 2019) and is based partly on an emphasis of the weak beat called syncopation. Keller and Schubert (2011) showed that syncopated melodies were judged as happier than unsyncopated melodies played at the same assigned tempo. Musicians and composers use complex rhythms to induce groove in listeners and to convey happy emotions (Madison & Sioros, 2014). It is possible that the listeners without musical training relied more on the small, adjacent timing information that formed the groove than the overarching perceived tempo to judge music emotion.
Mean-Onset-to-Onset Difference (MOOD) – An Objective Measure for Judging Music Emotion
The judged emotion plotted as a function of the MOOD index, as in Figure 5 showed a strong correlation for each listener. Interestingly, the correlation was particularly strong for the listeners whose tapping speed did not match the assigned tempo (L2 and L3). On the other hand, the correlation was weaker for the listener (L9) whose tapping speed quite accurately matched the assigned tempo (as seen in Figure 4). The findings indicate that listeners who are unable to synchronize their tapping speed with the assigned tempo tend to rely more heavily on the average timing of notes. As evident from Figure 6, MOOD can accurately predict average emotion judgments. No significant effect of musical training was found for the correlation strength.
The possible role of other temporal cues, such as the standard deviation of the onset-to-onset of the notes, pulse clarity, the ease with which listeners perceive underlying pulsation in a given music piece (Lartillot et al., 2008) and nPVI (normalized Pairwise Variability Index), a widely employed metric for quantifying rhythmicity in languages and music (Patel & Daniele, 2003), was tested with MiningSuite. However, none of these cues gave higher correlations with the emotion judgments than the MOOD.
Conclusion
To gain insight into the possible cues used by CI listeners in the study of Vannson et al. (2015) to judge musical emotion, the current study investigated the role of various temporal cues in music with NH listeners. The first experiment illustrated the limitations of assigned tempo as a cue in judging emotion for NH listeners. Additionally, it showed that CI listeners’ emotion judgments for tonal music pieces were similar to the emotion judgments of NH listeners for music with a non-tonal instrument. Experiment 2 showed that the perceived tempo was a better predictor of emotion judgments than the assigned tempo. However, the perceived tempo could accurately predict emotion judgments only for a few listeners. The temporal index MOOD was found to be an accurate objective predictor of judgments of emotion in music.
Footnotes
Acknowledgements
We would like to thank Dr. Brian Moore, and two anonymous reviewers for their valuable comments on the previous versions of this paper. This study was a part of the first author's master thesis project. We express our gratitude to the authors of ![]() for providing the CI emotion judgment data that served as the main background for our study. The data are accessible through the last author, who supervised both studies.
for providing the CI emotion judgment data that served as the main background for our study. The data are accessible through the last author, who supervised both studies.
Declaration of Conflicting Interests
The author(s) declared no potential conflicts of interest with respect to the research, authorship, and/or publication of this article.
Funding
The author(s) received no financial support for the research, authorship, and/or publication of this article.