
Abstract
While previous research investigating music emotion perception of cochlear implant (CI) users observed that temporal cues informing tempo largely convey emotional arousal (relaxing/stimulating), it remains unclear how other properties of the temporal content may contribute to the transmission of arousal features. Moreover, while detailed spectral information related to pitch and harmony in music — often not well perceived by CI users— reportedly conveys emotional valence (positive, negative), it remains unclear how the quality of spectral content contributes to valence perception. Therefore, the current study used vocoders to vary temporal and spectral content of music and tested music emotion categorization (joy, fear, serenity, sadness) in 23 normal-hearing participants. Vocoders were varied with two carriers (sinewave or noise; primarily modulating temporal information), and two filter orders (low or high; primarily modulating spectral information). Results indicated that emotion categorization was above-chance in vocoded excerpts but poorer than in a non-vocoded control condition. Among vocoded conditions, better temporal content (sinewave carriers) improved emotion categorization with a large effect while better spectral content (high filter order) improved it with a small effect. Arousal features were comparably transmitted in non-vocoded and vocoded conditions, indicating that lower temporal content successfully conveyed emotional arousal. Valence feature transmission steeply declined in vocoded conditions, revealing that valence perception was difficult for both lower and higher spectral content. The reliance on arousal information for emotion categorization of vocoded music suggests that efforts to refine temporal cues in the CI user signal may immediately benefit their music emotion perception.
Introduction
A cochlear implant (CI) helps regain hearing function for hard-of-hearing or deaf populations, by replacing (residual) acoustic hearing with electrical hearing (for an introduction to cochlear implants, see Clark, 2004, or Macherey & Carlyon, 2014). While CIs partially restore hearing, the spectro-temporal details of the sounds transmitted are reduced compared to normal hearing (NH) (for a review of relevant factors related to electric stimulation of the nerve, the nerve-electrode interface, and physiological/clinical aspects, see Başkent et al., 2016). Thus while music 1 enjoyment has been reported to contribute to quality of life in CI users (Fuller et al., 2021; Lassaletta et al., 2008), the difficulties in hearing and appreciating music still persist within this population (e.g., Caldwell et al., 2017; Fuller et al., 2019; Gfeller et al., 2000; Lassaletta et al., 2008).
One aspect of music that contributes to listener enjoyment is the emotion it conveys (Garrido & Schubert, 2011; Grewe et al., 2005; Mazaheryazdi et al., 2018). Emotion is conveyed by a range of musical features inherent to the composition, for example, information based on pitch and time dimensions as written in the score, as well as features inherent to the production of the sound by performers, for example, variation in loudness, tempo and micro-timing (Gabrielsson & Lindström, 2001) (though these latter features can be indicated by the composer).
Music Emotion Perception with Normal Hearing
Emotional affect can be described along the planes of valence and arousal (Feldman, 1995). Valence is the positive or negative association, for example joy has positive valence and sadness has negative valence. Arousal is the visceral association, how excited one becomes physiologically, for example fear has high arousal, whereas serenity has low arousal. These four emotions were previously plotted along valence and arousal axes (see Table 1 in Materials; e.g., Bigand et al., 2005), and classical music excerpts have been consistently classified into these four emotion categories (Filipic et al., 2010; Lévêque et al., 2018).
Participant demographic information. For participants who reported to have musical background and where participants listed multiple instruments, the instrument with the most years played is reported. Years of formal training and years active refer to years where one or more instruments were played, though only the primary instrument is reported for each participant in the table.

The positive or negative valence of an emotion in music is often conveyed by pitch relationships, for example: ‘happy’ and ‘sad’ emotions are typically associated with the major third and minor third pitch intervals prevalent in major and minor mode, respectively (Nieminen et al., 2012), and ironic, angry or melancholic music often makes use of pitch relationships from e.g., pentatonic interval relationships of the Dorian mode (e.g., rock music; Temperley & de Clercq, 2013). Pitch relationships that form simple integer ratios (e.g., the same note one octave apart) are moreover perceived as consonant and those that form complex relationships (e.g., chromatically sequential notes) are perceived as dissonant (Berg & Stork, 2004). The dissonance is also less saliently reflected in roughness in the acoustic envelope (Tramo et al., 2001); consonance and dissonance are globally perceived as exhibiting positive and negative valence, respectively, reflected in distinct activations in emotion networks in the brain (i.e., the amygdala; Koelsch et al., 2005). The degree of emotional arousal conveyed by music, on the other hand, is consistently linked to perceived tempo and loudness. When normal-hearing listeners continuously rated emotion at frequent fixed points throughout classical music excerpts, acoustic analysis of the excerpts revealed that sudden loudness (measured as weighted intensity) had immediate and most pronounced influence on higher arousal ratings, followed by an increased tempo (Schubert, 2004). Consistent with this, faster and louder music is consistently rated as more arousing than slow and soft music (Ilie & Thompson, 2006).
Music Emotion Perception with CI Hearing
Compared to normal hearing, CI hearing has reduced spectral and temporal resolution of sound, as well as a smaller dynamic range, which affects the perception of pitch, envelope and loudness of music. In the implant, frequency-specific information is primarily transmitted in the form of temporal modulations of electric pulse trains sent to different electrodes, mimicking the tonotopic organization of the healthy ear (Loizou, 1998). A typical modern implant has 12 to 22 electrodes (Macherey & Carlyon, 2014). One of the main factors that typically limits the potential benefit from increasing the number of electrodes in the implant is the spread of current, leading to channel interaction (de Balthasar et al., 2003; Shannon, 1983): when the current spreads far around each stimulating electrode, the populations of neurons of the spiral ganglion excited by each electrode become less distinct from each other. This reduces the capacity to discriminate different frequency profiles, i.e. limits the effective spectral resolution of the implant. Furthermore, a secondary consequence of current spread is that the envelope information carried by each electrode – or channel – becomes effectively contaminated by the surrounding electrodes. Thus fine-grained frequency and temporal information is often lost to the CI listener, which means that their experience of music is qualitatively different from that of a NH listener. Impaired pitch perception might result in impaired perception of interval relationships that normally would inform mode, and in turn emotional valence in music. In a paradigm with short musical bursts improvised by musicians to convey the intended emotion, participant categorization of the stimuli was analyzed according to acoustic features including brightness (spectral energy above 3000 Hz), root mean square energy, roughness, and pitch. NH listeners correctly identified happy, sad, threat and neutral emotions while CI users were only able to identify the happy musical emotion above chance (Paquette et al., 2018) —interestingly, among CI users, spectral information did not inform valence ratings while roughness in the envelope and intensity cues did. Contrastingly, valence ratings of NH listeners exclusively correlated with pitch-related cues. A study investigating the perception of mode and tempo in music found that when tempo was held constant, implant hearing could not utilize mode cues when judging emotional valence (D’Onofrio et al., 2020). Similarly a study with children reported that changes in mode did not affect happy and sad ratings in CI user children whereas NH peers assigned emotion ratings according to differences in mode (Hopyan et al., 2013). Moreover, compared to NH listeners, CI users are also reported to be less sensitive to changes in musical consonance and dissonance (Caldwell et al., 2016), which also convey valence. In that study, dissonance was created by sequentially playing tonally distant chords, and CI users ratings of pleasantness were independent of consonance and dissonance while NH listeners consistently rated progressions with dissonant chords as unpleasant.
Valence has been reported to be perceived by CI-users (Ambert-Dahan et al., 2015). In one study, CI-users categorized musical excerpts into emotional categories happiness, fear, sadness and peacefulness and additionally rated the valence and arousal. Valence was accurately rated. However, the majority of participants possessed residual hearing in their contralateral ear, which has been previously reported to greatly improve music perception (El Fata et al., 2009; Gfeller et al., 2006).
Implants have been developed with the primary clinical aim to perceive speech, and early research reported that the temporal resolution available to implants was sufficient for speech intelligibility (in ideal listening conditions), even with few frequency channels (Shannon et al., 1995), and particularly slow-varying temporal information (Shannon, 1992). This preserved perception of the envelope may have consequences for CI users’ music listening. Namely, despite reduced temporal resolution compared to NH listeners, CI user and NH perception of information encoded in the envelope of music may still be comparable — at least performance regarding tempo portions of music perception tests are similar across NH and CI groups (Cooper et al., 2008). With regard to music emotion perception, the consequence would be that emotional arousal cues could still be available to CI users enough to complete music emotion perception tasks, though the CI users’ performance is still significantly below that of NH controls (e.g., Caldwell et al., 2015; D’Onofrio et al., 2020; Hopyan et al., 2013). Adult CI users rating classical music excerpts as happy or sad seem to have based their judgements on tempo alone, while NH counterparts seem to have used both tempo and mode cues (Caldwell et al., 2015). Also in CI children, tempo seems to be used almost exclusively to judge whether emotion in classical music excerpts is happy or sad in both original form and when tempo is changed to faster or slower, while their NH peers in contrast seem to use tempo as well as mode to make these emotion judgements (Giannantonio et al., 2015; Hopyan et al., 2013).
CI outcomes for speech perception largely vary across individual CI users (Blamey et al. 2013). This large inter-individual variability suggests that CI users would differ in their abilities in hearing both temporal and spectral properties of CI-transmitted music as well. Two questions emerge with respect to CI users hearing music and perceiving music emotion. On the one hand, it remains unclear whether and to what degree improved spectral resolution would contribute to emotional valence perception in CI users at all, considering that in the literature they seem to rely almost exclusively on arousal features captured by temporal properties of the envelope and dynamic changes. In other words, given the limitations from electric stimulation, the spectral resolution may not easily reach a precision that can transmit valence features. On the other hand, it is not clear how good the temporal resolution of the signal needs to be before emotional arousal features are transmitted to the listener. The above paragraphs outlined that regarding perception of music emotion, temporal cues are typically more available than spectral cues in CI hearing (e.g., Giannantonio et al., 2015; Hopyan et al., 2013), however, it is not clear how dependent the arousal features could be on temporal resolution abilities of CI users, given their large inter-participant variability (Blamey et al., 2013).
Vocoders with Temporal and Spectral Smearing
CI users comprise a heterogeneous population, thus it would prove cumbersome to satisfactorily create groups with systematically matched perception abilities in spectrotemporal resolution to address the current questions. And even if we managed to achieve such matching in performance, we still would not be able to know with certainty that the underlying hearing-related factors causing this functional match would be the same across different implant users. Vocoder technique provides a tool such that the spectrotemporal resolution of the signal can be systematically manipulated to approximate the heterogenous range of acoustic features offered by implant transmission of acoustic features, to be used with NH listeners, such that the hearing-related factors remain homogenous. During vocoding, a signal is reduced to several frequency bands, similar to the number of electrodes in a modern implant (12–22), as well as the range of the number of independent frequency channels (4–16) that CI users seem to be able to make use of (Friesen et al., 2001; Fu & Nogaki, 2005). The envelope is extracted at each frequency band; then the envelope is superimposed on a carrier signal at each frequency band, and the resulting envelope modulated carrier signals are summed across all frequency bands (e.g, Davis et al., 2005). Broadband noise carriers simulate less temporal content from the original signal, as intrinsic fluctuations of the noise result in a non-flat envelope, which means that the envelope transmitted with that carrier will be contaminated by the carrier's own envelope. Broadband noise carriers are moreover very effective at simulating current spread because their spectral shape can easily be adapted with the appropriate filter to simulate current spread in the cochlea (e.g., Bingabr et al., 2008). Sinewave carriers comprise a signal with more temporal information: because the envelope of a sinewave is intrinsically flat, it does not alter the channel's envelope and transmits it faithfully. With each carrier type, the spread of excitation in electrical current can in turn be simulated with the filter order used in bandpass filters that determine the distinct frequency bands. A sharper, higher order filter will simulate less spread of excitation among electrodes, whereas a less steep, lower order filter increases the spectral smearing simulating more spread of excitation. Note that spectral and temporal modifications to the signal are not wholly independent of each other, see ‘Methods’.
Vocoders have successfully simulated CI users’ music emotion ratings in previous studies with NH participants (Giannantonio et al., 2015; Paquette et al., 2018). Giannantonio et al. (2015) investigated musical emotion categorization using a happy-sad forced choice paradigm. Excerpts were composed as happy (major mode, fast tempo 80–255 bpm), sad (minor mode, slow tempo 20–100 bpm), or ambiguous (same excerpts transposed to the opposite mode or a neutral tempo of 80 bpm) and vocoded with either 22 or 32 channels or noise-masked (pink, white) conditions. It was found that judgments incorporated both tempo and modal cues in the non-vocoded/non-masked condition, while in the CI-simulated conditions, judgments aligned with tempo changes but ignored modal changes. This finding informatively showed the same pattern as CI users, that tempo cues but not modal cues were utilized for music emotion judgments. Paquette et al. (2018) investigated the categorization of happiness, sadness, fear and neutrality in musical stimuli that were short bursts of notes (<2 s), as well as assessing ratings along valence and arousal dimensions. It was found that NH listeners with vocoded stimuli used the timbral features of energy and roughness to inform both arousal and valence ratings. This study used one type of vocoder (8 channels with a noise carrier). Thus while these studies showed that music emotion perception was possible in vocoded conditions, the chosen vocoders did not investigate the degrees of temporal or spectral content available in the signal, and how this might contribute to emotion categorization.
The present study will add to the literature by systematically manipulating the vocoding parameters along temporal and spectral dimensions, as well as including four emotion categories that allow the assessment of valence and arousal perception in music emotion. In order to assess how varying temporal and spectral resolution content across the heterogeneous range of CI user hearing contributes to music emotion categorization, we asked NH participants to categorize emotions from musical excerpts that cover four corners of the valence-arousal plane: joy, fear, serenity, sadness (see Table 2 in Materials). The musical excerpts were vocoded using conditions that offered greater or less temporal information (sinewave and noise carriers, respectively), and greater or less spread of excitation, or spectral smearing (low vs. high order synthesis filters, respectively). Our hypothesis was that overall emotion categorization would improve as the quality of both temporal and spectral content improved. Moreover improved transmission of arousal features would correspond to improved temporal content, while improved transmission of valence features would correspond to improved spectral content.
Emotion categories from music stimuli inhabit the four quadrants of valence and arousal. In parenthesis, the musical work from which an iconic example of the emotion was played during training. Famous musical works were avoided for actual stimuli in the experimental phase (Bigand et al., 2005).

Materials and Methods
Participants
Participants were recruited by an advertisement on social media or word-of-mouth. Twenty-four participants responded, but one did not complete the experiment. As a result, 23 (mean age 31.39 years, range 21–63 years, standard deviation 11.90 years; 12 self-reported female, 11 self-reported male) self-reported normal-hearing adults participated in the study. All participants were residing in the Netherlands or Flemish Belgium, and all grew up in countries with a Western Tonal music tradition (Netherlands, United Kingdom, Germany) and could understand Dutch sufficiently to follow experimental directions (self-reported). Demographic information is listed in Table 1. Participants were given the option to self-report whether they had a musical background (yes/no), and if so listed the instrument they played, amount of years of formal training (lessons), and total years played. This information was not factored into the main analysis (see S3. supplementary analysis addressing musicianship differences) but rather demonstrated that participants experienced a wide range of musical backgrounds, thus reflecting varying musical experience occurring in the general population. Participants received 8€ per hour and were tested in accordance with the University Medical Center Groningen medical ethics protocol PICKA-XL (NL66549.042.18).
Materials
Stimuli consisted of 40 classical music excerpts previously determined to represent one of four emotions each: joy, fear, serenity, and sadness (Bigand et al., 2005; Lévêque et al., 2018; Liégeois-Chauvel et al., 2014; a full list of the stimuli material can be found in supplementary table S3 of Pralus et al., 2020 https://doi.org/10.1016/j.cortex.2020.05.015.). While original excerpts were 20 s each in duration (Lévêque et al., 2018; Pralus et al., 2020), feedback from participants during an informal pilot of the online testing version of this experiment indicated that the excerpts were too long to keep attentional vigilance, especially in their vocoded versions. Therefore, we divided each of the 20-s excerpts into two 10-s excerpts presented consecutively. The split halves of each excerpt were always played sequentially, with smooth fade-out and fade-in over 1 s to avoid abrupt onsets and offsets. The categorization of first and second halves was compared in a supplementary analysis (see S4).
The musical excerpts were taken from various recording sources, as a result the relationship between the physical intensity of the excerpts and their intended loudness was not consistent across the excerpts of the set (e.g., an orchestra clearly playing excitedly was the same intensity in the recording as an acoustic guitar solo). While NH listeners can easily deduce loudness cues independently of intensity from spectrotemporal features in the signal (McKenna & Stepp, 2018), degradations introduced by the vocoders may disrupt these cues. As loudness is one of the acoustic features that greatly contribute to the emotional content of music, the loudness of the musical excerpts was adjusted in a separate experiment, described in supplementary materials (S1). The purpose of this loudness manipulation was to make loudness consistent with intended loudness, and hence ensure it is a reliable cue across excerpts despite their various origins. This is particularly relevant for the cases where the physical degradations imposed by vocoding or electric hearing might prevent the perception of acoustic details that would provide the listener information about the intended loudness independently from physical intensity.
Vocoder Processing: Varying Temporal and Spectral Content
Channels. While earlier research shows voice and speech perception performance in CI users best overlaps with the range of 4–8 channel vocoders in typical implementations (e.g., Friesen et al., 2001; Gaudrain & Başkent, 2018), here we chose 16 channels for the vocoder implementations. This overlaps with the number of electrodes in modern implants, and this choice gives more options for systematic changes in vocoder parameters for manipulating channel interactions (Bingabr et al., 2008). Moreover, 16 channels were used in a previous vocoder study with music materials (short melodies) that manipulated the current spread similarly to the current study (Crew & Galvin, 2012). Each loudness-adjusted excerpt was thus processed with a 16-channel vocoder implemented in Matlab 9.9 (R2020b, The MathWorks, Inc., Natick, Massachusetts, United States). The band partitioning was based on Greenwood's cochlear place-frequency mapping function (Greenwood, 1990) between 150 and 7000 Hz. The analysis filters were 12th order zero-phase Butterworth filters.
Carrier. The carrier was either a
Channel interaction/Spread of excitation. The envelope in each band was extracted using half-wave rectification and an 8th order zero-phase Butterworth low-pass filter with a cutoff frequency that was at least 30 Hz, and at most one tenth of the center frequency of the channel. These values were chosen to limit envelope cues to those that could not result in resolved sidebands with the sinewave carrier. Synthesis was achieved by multiplying the envelope with the carrier. The spread of excitation of each channel informs the quality of the spectral content of the signal, but also determines the amount of channel interaction, which, in turn, also affects the quality of the temporal modulation cues in each channel. In our experiment, the spread corresponded to either a 4th or a 12th order zero-phase Butterworth filter (corresponding to slopes of 24 and 72 dB/oct, respectively). We chose these orders to build from a previous study: Crew and Galvin (2012) modulated channel interaction with 1st, 2nd and 4th order filters. Aside from a condition with no channel interaction, the condition with a 4th order filter was considered to have optimally reduced channel interaction. In their experiment, participants tasked with identifying the melodic contour of vocoded melodies performed significantly better with 4th order compared to 1st or 2nd order filters. In our study, we took the 4th order as our starting point and improved quality of spectral content even further by using a 12th order filter; informal piloting within the lab determined that 12th order filters were still degraded but noticeably provided more spectral information in our musical excerpts.
In the case of the sinewave carrier, the spread of excitation was simulated following the method used by Crew and Galvin (2012). In each channel, the frequency response of the 4th and 12th order was used to add scaled copies of the channel's envelope to the surrounding channels. In the case of the noise carrier, the resulting envelope-modulated noise was filtered in the band with the synthesis filter, which was a 4th or 12th order zero-phase Butterworth filter, before the bands were summed together. The RMS of the vocoded stimulus was adjusted such as to match that of the original stimulus in the 150–7000 Hz frequency band. Spectrograms of selected conditions are shown in Figure 1; see supplementary materials for spectrograms of the remaining conditions (S2).

Example stimuli spectrograms shown in non-vocoded and vocoded conditions. Fear, a high-arousal emotion, shows more energy at frequencies across the spectrum in all conditions. Sadness, in comparison, is lower arousal and accordingly displays lower spectral energy across frequencies, especially compared to higher frequencies in the fear condition. Compared to non-vocoded spectrograms, vocoders with sinewave carriers contain energy more localized to channel frequencies whereas in the noise carrier, energy is smeared across multiple frequencies.
Procedure
All testing was conducted online using jsPsych 6.1 software (de Leeuw, 2015) on a secure server. Participants were emailed an invitation with general instructions: they were asked to conduct the experiment in a quiet background on a computer, laptop, or tablet with an updated internet browser and stable internet connection. Participants were further recommended to use headphones but told that built-in speakers were acceptable. The email contained a unique link where they first read a consent form and agreed with the terms before proceeding to the experiment. Participants were informed that self-paced breaks would occur approximately every 10 min where they could continue the experiment with a button-press, but to please complete the experiment in one sitting. The experiment lasted approximately 1.5 h determined by informal piloting within the lab and the estimate for online participants was rounded up to 2 h; remuneration was therefore €16 (8€/hr) or, upon incompletion, a flat rate per trial completed.
The experimental task was embedded in a graphically illustrated story (Figure 2) about an alien planet (“The aliens need participants’ help to understand emotions in earth's music!”).

Participants were presented with the scenario that they were an astronaut on an alien planet who was helping aliens to understand earth music. (Illustration by Kristin Hrycyk, image published under the CC BY NC 4.0 license, https://creativecommons.org/licenses/by-nc/4.0/).
The task was to listen to the excerpts and to judge which emotion was evoked by the music. Response options given to participants were four buttons with the options joy, fear, serenity and sadness (“vreugde”, “angst”, “sereniteit”, “droefheid” respectively). After task instructions, an 8-trial training with feedback was conducted (e.g., this emotion was “joy”) with each vocoder carrier per emotion, but only with the high filter orders. After having categorized the item into the emotion category, participants gave confidence judgments using scale 1–7 (1 defined as little confidence, 7 defined as utmost confidence) with instruction to rate the confidence of their previous emotion categorization. Training items were musical excerpts with iconic emotion status: Joy (Vivaldi's Four Seasons: Spring) – Serenity (Monoman's Meditation) – Fear (Mussorgsky's Night on Bald Mountain) – Sadness (Beethoven's Moonlight Sonata) that were not included in the experiment (Table 2). The experiment consisted of three blocks: one for the two carrier conditions (sinewave and noise, 80 trials each) followed by a block for the non-vocoded condition (40 trials). Within each of the vocoded blocks, the filter order randomly alternated between the two selected values (4th and 12th order). Each filter order was assigned to an equal number of trials. Filter order remained the same between first and second halves of full stimuli excerpts. In these blocks, a self-paced break was added after about 40 trials. The order of carrier conditions was counterbalanced across participants. The third block was always non-vocoded, to minimize learning of the experimental stimuli. Before each block, a sample sentence from the Vrije Universiteit sentence corpus (Versfeld et al., 2000) introduced the vocoder carrier to familiarize the participant with a new vocoder before the trial. The sentence was presented visually (in text) and auditorily at the same time, a method that is known to facilitate rapid perceptual learning of degraded speech (Benard & Başkent, 2014; Davis et al., 2005). No responses to the sample vocoder sentences were recorded or analyzed. To reduce testing time and potential testing fatigue, each participant was presented half of the stimuli set. The full stimuli set was counterbalanced across participants. During the experiment there was no control for participants closing the experiment and resuming later; if this happened, the 8-trial training always opened the new session to re-familiarize the participant with the task. It was not possible to return to earlier trials once responses were registered. A progress bar showed participants how much of the experiment they had completed. On average, excluding the time spent on the breaks, the whole experiment lasted about 1h, which corresponds to about 19 s per trial. Correct and incorrect answers per trial were recorded and formed the basis of the raw data confusion matrix.
Analysis
Scores were first analyzed across vocoder conditions using a Generalized Mixed Effect Model (gLMM) based on a binomial distribution, i.e., using logit as a link function. The analysis was implemented in R (v4.0.3, R Core Team, 2020) using the lme4 package (v1.1.27.1, Bates et al., 2015) The model had binary score (correct or incorrect) as dependent variable, Vocoder (non-vocoded, sinewave 12th order filter, sinewave 4th order filter, noise 12th order filter, noise 4th order filter) as fixed effect, and Participant and Presented Emotion as random factors. Note that the Presented Emotion is the emotion label that was assigned to the musical excerpt by the experimenter during the design and selection of the material by Bigand et al., (2005). An analysis of deviance was performed on the fitted model using the car package (v3.0.11, Fox & Weisberg, 2019). Post-hoc pairwise comparisons were performed using the emmeans package (v1.7.0, Lenth et al. 2021). Multiple comparisons were here corrected with the Tukey method.
Using raw scores, while informative, does not make the sensitivity of the participants apparent. For example, if a participant always answered one emotion, this one category would score 1 (all correct) while not taking into account that other emotion categories also incorrectly received that answer. Therefore, sensitivity, d’, from the Signal Detection Theory (Green & Swets, 1988; Macmillan and Douglas Creelman, 2004) was derived from the raw data for each emotion category. For a given emotion, the d’ was calculated by considering the correct categorization responses as hits (for a given row of the confusion matrix, the entries term on the diagonal), and incorrect categorization responses, i.e., trials where other emotions were presented but the considered emotion was responded, as false-alarms (the terms off the diagonal on the same row). In order to determine whether sensitivity was above chance-level (d’ = 0), a 1-sample t-test was performed for each emotion category and each vocoder condition. A comparison of responses to first and second halves of each original excerpt is conducted in supplementary analysis S4. The d’ values were then analyzed with a Repeated Measures ANOVA using the ‘ez’ package (Lawrence, 2016) in R (R Core Team, 2020). The RM ANOVA had Presented Emotion (joy, fear, serenity, sadness) and Vocoder (non-vocoded, sinewave 12th order filter, sinewave 4th order filter, noise 12th order filter, noise 4th order filter) as repeated factors. A separate RM ANOVA designed to investigate effects of vocoder type on emotion categorization was also conducted, with factors Presented Emotion (joy, fear, serenity, sadness), Carrier (sinewave, noise) and Filter order (Low-4th, High-12th). When the sphericity hypothesis was violated, the degrees of freedom were adjusted using the Greenhouse-Geisser method, and the adjusted p-value was reported as pGG. All ANOVAs used a Type 3 sum of squares. Generalized eta-squared (
In order to account for the degree that vocoded materials may have rendered participants unsure of their responses, and therefore confound their sensitivity, confidence ratings were collected after each trial, and scaled to the mean and SD, of each participant before being correlated with d’ (Pearsons, 2-tailed). Confidence ratings from both correct and incorrect categorization trials were used. Confidence ratings were further entered into the same analysis as sensitivity in order to assess any differences between the two metrics.
Multiple comparisons (post-hocs and sequential t-tests and correlations) were corrected using the false-discovery-rate method (Benjamini & Hochberg, 1995).
The raw data of emotion categorization were also compiled as confusion matrices. In a confusion matrix, a ‘perfect score’ would be represented as one diagonal line with points only on the same emotion category for both ‘presented’ (x-axis) and ‘responded’ (y-axis). Errors are represented by data points off the diagonal, or ‘confusions’, where a different category was responded from what was presented. The confusion matrices were followed up with an analysis of feature information transmission (Miller & Nicely, 1955). In feature information transmission analysis (FITA), considered features were the valence and arousal classes of each emotion category: each emotion was quantified as having either positive or negative valence, and low or high arousal (see Table 1). The analysis allowed us to estimate how much of the information associated with the feature was effectively received by the listener, which is particularly useful to compare acoustic features in the stimuli (van Wieringen & Wouters, 1999). The outcome measure was the relative quantity of transmitted information in proportion to the total available information (Trel,). As this was a continuous variable bound between 0 and 1, it was logit-transformed before being entered in a RM ANOVA with Feature (arousal, valence) and Vocoder (carrier, filter order) as repeated factors.
Results
The proportion correct per vocoder and per presented emotion are reported in Table 3.
Proportion correct per vocoder and per presented emotion.

The gLMM analysis on raw scores showed a significant effect of the vocoder condition [χ²(4) = 311.7, p < 0.0001]. All pairwise comparisons between vocoder conditions were significant (p < 0.001) except the two sinewave vocoders (4th vs. 12th order, p = 0.71), the two noise vocoders (4th vs. 12th order, p = 0.13), and the sine-4th order compared to the noise-12th condition (p = 0.05).
Sensitivity index d’
In order to account for false alarms in the categorization of participants (see ‘Analysis’ above), the sensitivity index (d’) was calculated. The sensitivity data are reported in Figure 3. Results with the sensitivity analysis were the same as with the proportion-correct scores.

Sensitivity in perception of presented emotion categories (d’) as a function of vocoder manipulations (x-axis), and shown for different emotions (color and symbol). The horizontal line in the boxplot shows the median sensitivity across participants. The box extends from the 25th to the 75th percentile, and the whiskers extend to the value most remote from the median within 1.5 times the interquartile range. Individual data points are overlaid on top of the boxplots. d' = 0 denotes the chance level.
d’ values for each presented emotion and vocoder were all greater than zero, i.e., the performance was better than chance [t(22)>2.42, pFDR<0.05], except for serenity in the noise, 4th order condition [t(22) = 1.81, pFDR = 0.08].
The repeated measure ANOVA with Presented Emotion and Vocoder as repeated factors confirmed that both Emotion [F
Emotion: The main effect of Presented Emotion showed that joy (average d’ = 1.15) was the best recognized, followed by fear (d’ = 0.98), then serenity and sadness (both d’ = 0.71).
Non-vocoded vs vocoded: The main effect of Vocoder showed that, again, emotions were best categorized in the non-vocoded condition. The non-vocoded condition yielded the highest sensitivity (d’ = 1.74), but in the vocoded conditions, the performance was relatively higher for sinewave vocoders (d’ = 0.89 for 12th order; d’ = 0.78 for 4th order) than for noise vocoders (d’ = 0.60 for 12th order; d’ = 0.42 for 4th order).
Vocoded carrier type and filter order: In order to examine the effect of carrier type and filter order within vocoded-only conditions, we analyzed only the vocoded data in a separate ANOVA with factors Emotion (joy, fear, serenity, sadness), Carrier (sinewave, noise) and Filter order (low-4th, high-12th). The effect of Emotion was again significant [F(3,66) = 20.74, p < 0.0001,
Confidence Ratings
Confidence ratings were entered into correlations with sensitivity. Combining all non-vocoded and vocoded conditions, correlations ranged between .54 and .64 (all p's < .0001) across all four emotions, indicating that confidence increased with sensitivity with each emotion judgement. Correlations are separated by vocoder in Table 4 (and shown in Figure 4). All correlations were significant except the non-vocoded condition.

Confidence ratings per vocoder. In all except the non-vocoded condition, confidence was reported higher as sensitivity increased.
Correlations between d’ and confidence ratings (df = 458).

Furthermore, confidence ratings were entered into the same ANOVAs as the sensitivity values. The same main effects of Presented Emotion and Vocoder were observed as with sensitivity ANOVA (F's>18.61, p's<.oo1,
Raw Data – Confusion Matrices
The raw data presented in the form of confusion matrices (Figure 5) show that, in vocoded conditions, emotions were systematically confused within arousal type but confused across valence type. In other words, high-arousal joy and fear were most often mistaken for each other, and low-arousal serenity and sadness were most often mistaken for each other, despite the opposing valences. The non-vocoded condition shows relatively good performance as most of the responses can be found on the diagonal. The confusions of the diagonal appeared to grow from sinewave to noise carrier and from 12th to 4th order filter. Moreover, the number of confusions also seemed to depend on the emotions themselves: high arousal emotions (joy and fear) seemed to be better identified than low arousal emotions (serenity and sadness) with systematic confusion of the valence within both arousal conditions. The FITA analysis below statistically addresses the visual pattern in the confusion matrices.
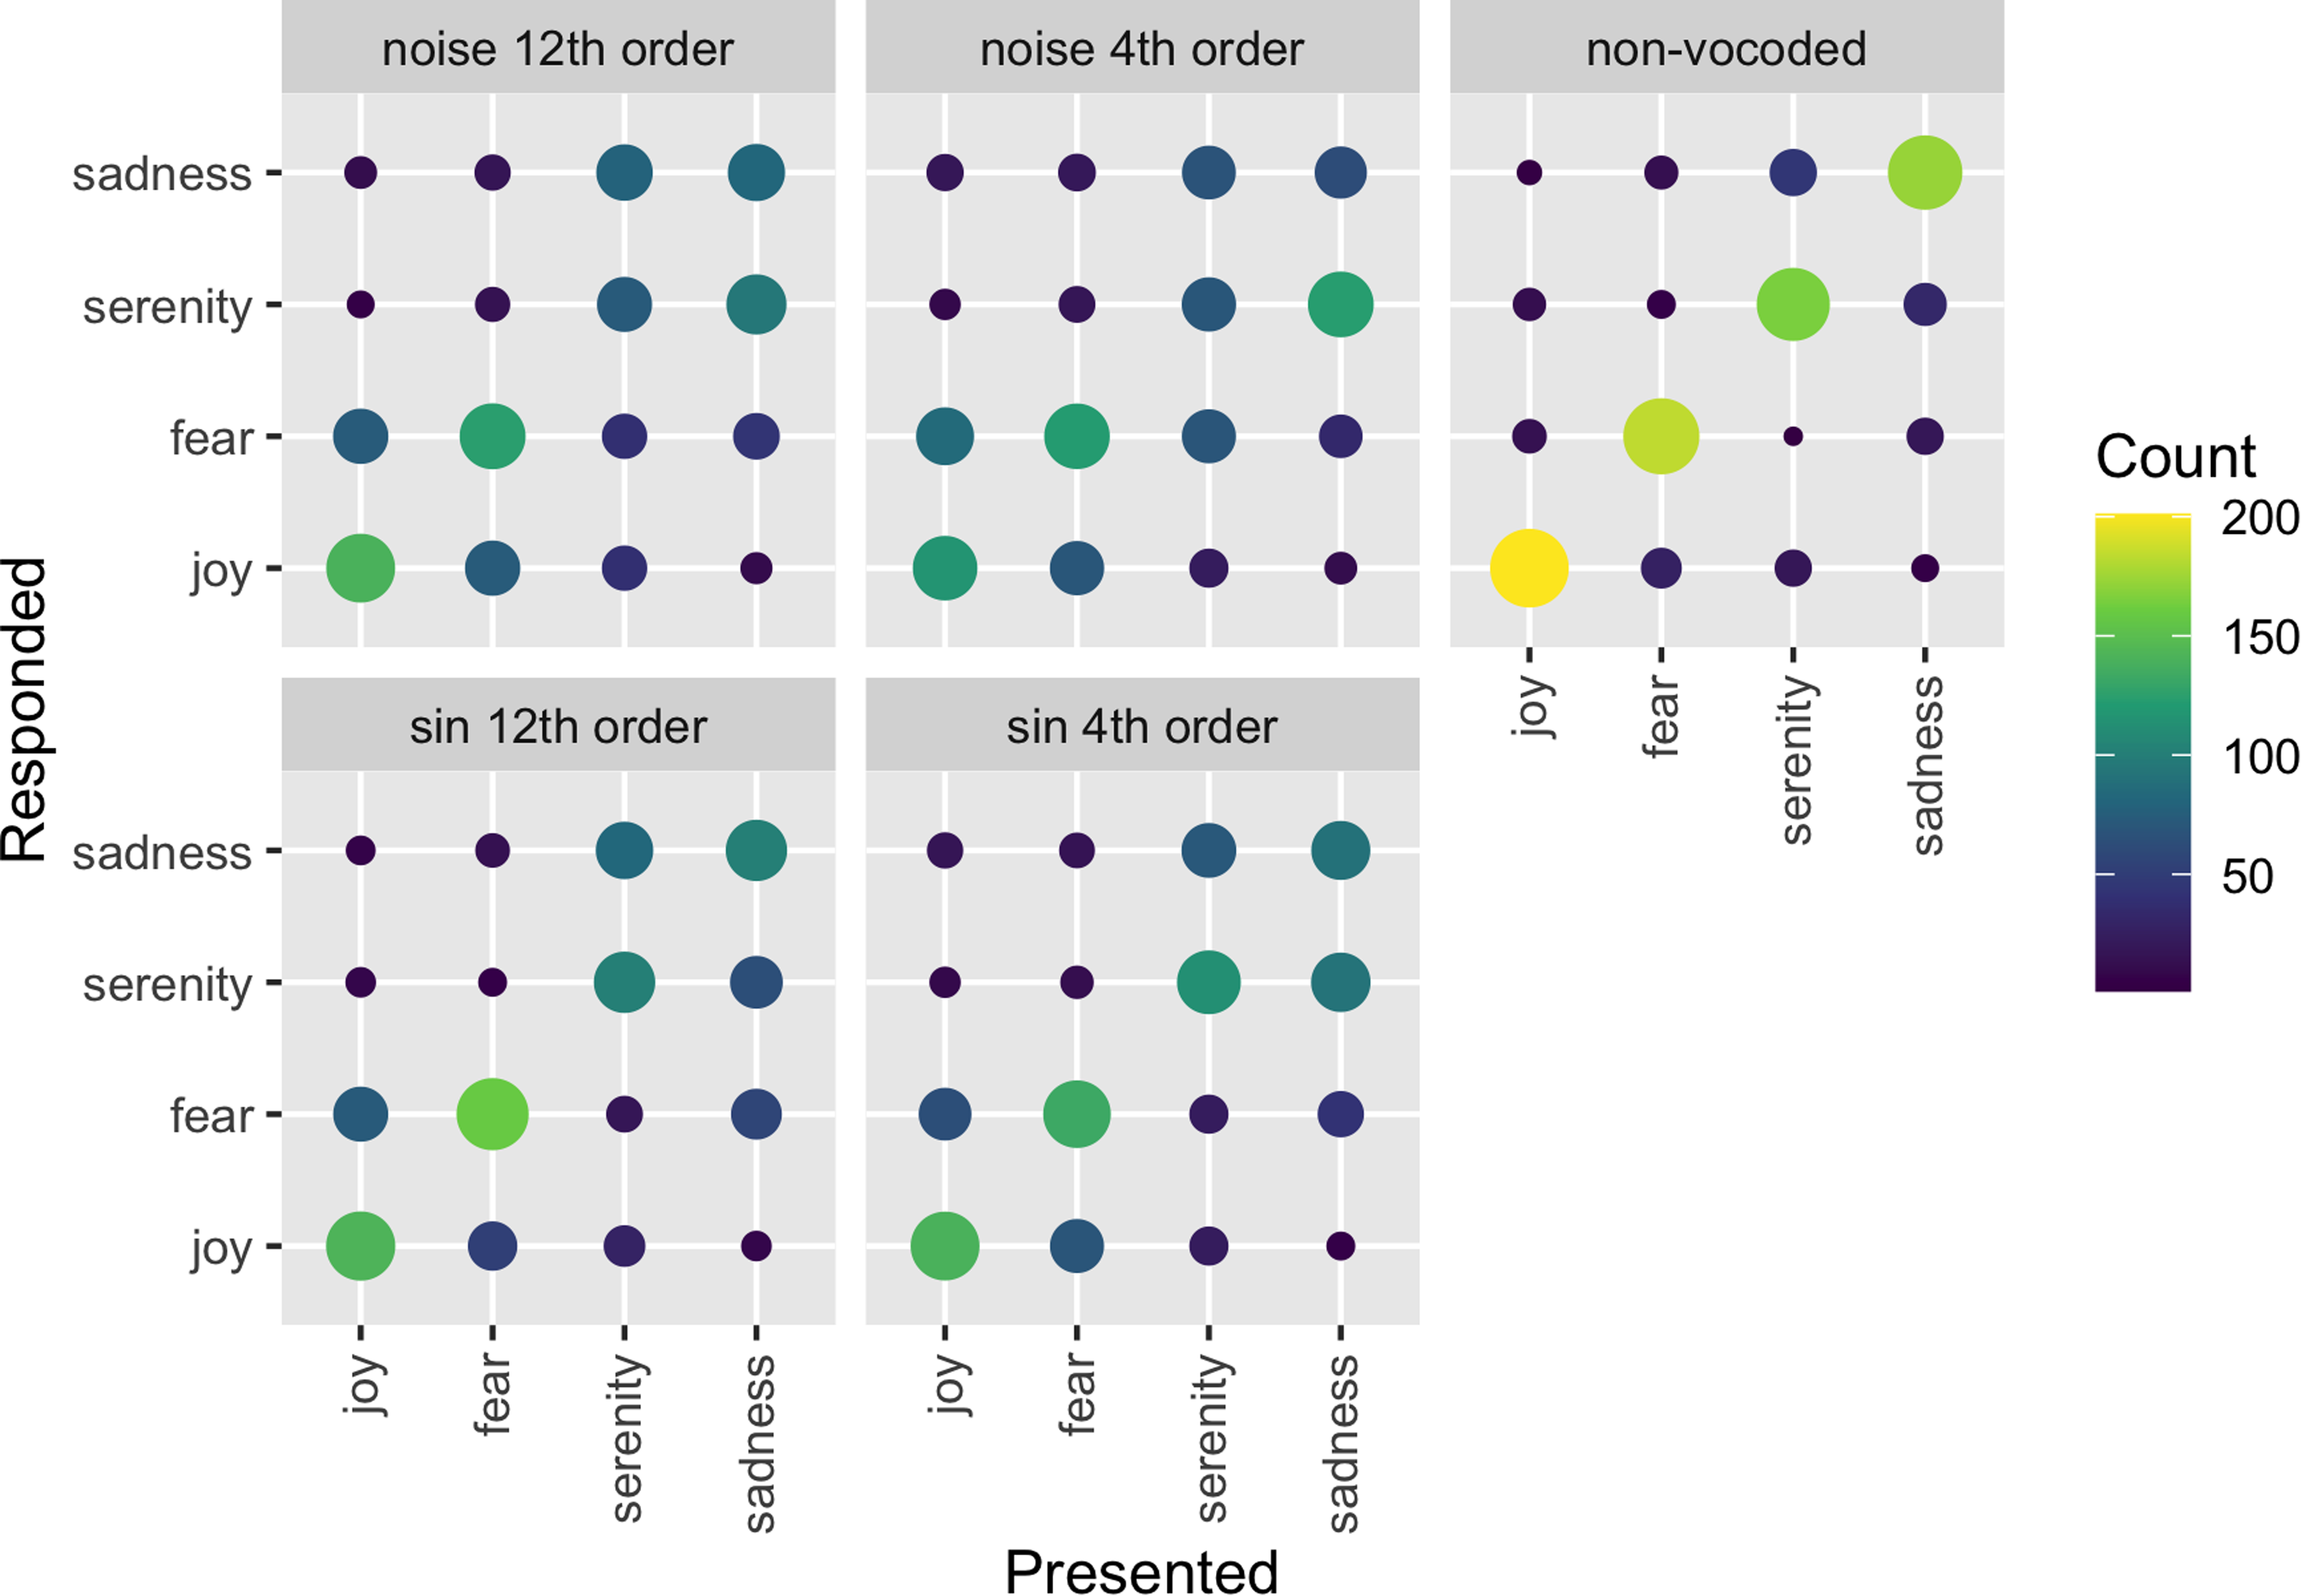
Confusion matrices for emotion categorization shown for each vocoder condition. The size and color of each dot is proportional to the number of relevant responses. The presented emotion categories are listed on the x-axis, while the responded emotion categories are listed on the y-axis.
Feature Information Transmission Analysis (FITA)
The raw-data confusion matrices (Figure 5) indicated that confusions primarily occur within arousal class (joy confused with fear and vice versa, and serenity confused with sadness and vice versa). This pattern was analyzed with FITA using the features arousal and valence (Miller & Nicely, 1955; see ‘analysis’). The FITA outcomes (Trel,) are shown in Figure 6. Note that variability was high across participants, with individual participant means ranging from 0 to 100% in most conditions. The RM ANOVA with factors Feature (arousal, valence) and Vocoder (non-vocoded, sinewave 12th order filter, sinewave 4th order filter, noise 12th order filter, noise 4th order filter) showed that both Feature [F(1,22) = 83.8, p < 0.0001,

Relative transmission in percent of the total available information, shown as a function of feature (hatched vs. solid) and vocoder (x-axis). The sinewave and noise carriers are further marked by color (sinewave: blue; noise: red). The signification of the boxplot details is identical to that of Figure 3.
Arousal. Post-hoc comparisons showed that for arousal, the non-vocoded and sinewave vocoders did not significantly differ in loss of transmission (pFDR>0.32 for 12th order, pFDR>0.06 for 4th order) while both had higher Trel values than the noise vocoders (pFDR<0.001 for both orders). The noise 4th order vocoder was worse at transmitting arousal than the sin 12th order vocoder [t(22) = 3.25, pFDR<0.05]. All other comparisons for arousal transmission were non-significant (pFDR>0.06).
Valence. Further post-hoc comparisons show that, for valence, the non-vocoded condition yielded higher Trel values than all the vocoded conditions (pFDR<0.0001). Furthermore, the sin 12th order vocoder was better at transmitting the valence than the noise 4th order vocoder [t(22) = 2.56, pFDR<0.05]. All other comparisons for valence were non-significant (pFDR>0.06).
Discussion
Our study investigated to what degree changes in temporal and spectral content of vocoded musical excerpts would impact music emotion categorization in NH listeners. For this purpose, we varied the carrier type and filter order of vocoders, and hypothesized that emotion categories would be better perceived in vocoded conditions that offered better temporal- (e.g., sinewave carriers vs noise carriers) and spectral (e.g., high-order vs low-order filters) content. The four emotions used covered the four quadrants of the valence and arousal plane. We hypothesized that categorization across arousal classes would improve with better temporal content, and that categorization across valence classes would improve with better spectral content. We intentionally introduced these systematic manipulations with the aim to observe how the differing content might affect CI hearing of musical emotion. This allowed a more controlled variation than can be implemented with actual CIs.
Supporting our hypothesis, the vocoder type influenced the categorization of emotions, such that better temporal content (sinewave vocoders) and better spectral content (high filter orders) both improved music emotion categorization. In addition to these main effects, the following pattern emerged: improved quality of temporal content was associated with improved categorization across emotional arousal classes, while improved quality of spectral and temporal content transmitted valence significantly better than reduced quality of spectral and temporal content. Within the parameters we have selected for spectral manipulation there was little effect of spectral content only.
Music Emotion Categorization with Normal Hearing
Our sensitivity findings with non-vocoded conditions indicated that musical emotions were successfully categorized far above chance-level. This aligns with an earlier study (Bigand et al., 2005) where participants freely sorted the same longer excerpts from existing classical works (we halved these excerpts in duration for our stimuli; see Methods) into four emotion categories that were labeled joy, fear, serenity and sadness during analysis. Bigand et al. evaluated consistency of the categorization across participants, and it was shown that the categorization was highly stable across both musicians and non-musicians, across two experiments conducted a week apart. Moreover, categorization in turn roughly corresponded to arousal and valence dimensions (see Table 1), as well as a third, weakly emerging dimension of melodic movement. These categories were also stable even when the first few seconds of excerpts were used, though in the shortest condition the melodic movement ceased to factor into the emotion categorization. Thus we replicate the general stability of music emotion categories from this original study with the same musical excerpts in longer and shorter lengths, in participants with a range of musical experience (based on supplemental analyses presented in S3 that show no difference in sensitivity across our participants with self-reported musical vs. non-musical backgrounds).
In addition to the sensitivity, we have also collected confidence ratings. Interestingly, in our study, confidence was high for all emotion categories in the non-vocoded condition, independently of accuracy. This is in line with previous literature for NH music emotion recognition where confidence did not increase with increased accuracy (Vieillard et al., 2008). This may also be due to the fact that non-vocoded blocks were always presented after vocoded blocks, thus lowered confidence in preceding blocks was at once improved, perhaps inflating confidence, once the signal was no longer vocoded.
In the current study, sensitivity was better than chance across almost all (non-vocoded and vocoded) conditions. High arousal emotions (joy and fear) were categorized with more sensitivity and confidence than low-arousal emotions (serenity and sadness), and when mistakes in categorization were made, they tended to be within arousal class (e.g., serenity confused with sadness or joy confused with fear). In other words, high arousal emotions were categorized with more sensitivity and confidence than low-arousal emotions, independently of valence. This phenomenon was reported previously as well. One study investigated arousal and valence dimensions with the stimuli of Vieillard et al. (2008): a study on NH adults and children found a main effect of arousal, where joy and fear were more accurately identified than sadness or peacefulness, though the effect was much larger in children (Hunter et al., 2011). Results were interpreted such that cultural assignment of mode cues is less available to children than overtly salient tempo. In our case, this explanation is not likely as all participants were adults. One possible explanation pointed out by Vieillard et al. (2008) is that more musical events occur over a shorter time in high arousal conditions, thus, more information is provided to meet the decision threshold. However, Vieillard et al. (2008) did not find the same result in adults, rather categorization accuracy was greatest in happy and sad excerpts compared to threat and peaceful excerpts. Thus this effect in the current study, though comprised of non-vocoded materials, may heavily be influenced by the vocoded conditions and not interpretable per se from the perspective of music emotion categorization with NH.
Music Emotion Categorization with Vocoded Materials
Our results globally indicated that while music emotion categorization accuracy was well above chance with non-vocoded materials, vocoded conditions demonstrated significantly lower, but still above-chance performance. These differences between non-vocoded and vocoded conditions reflect previous comparisons between non-vocoded and vocoded music emotion categorization accuracy rates (Giannantonio et al., 2015; Paquette et al., 2018), validating our approach. Confidence ratings correlated with sensitivity, indicating that as sensitivity increased, so did confidence. This is intuitive and suggests that participants were aware of the missing acoustic information that they otherwise would have used to judge the emotion category.
The feature transmission analysis showed that arousal features of the signal were conveyed better across all conditions. Non-vocoded and sine-wave-vocoded conditions were collectively better at transmitting arousal compared to noise vocoders, with little influence of filter order. Thus perhaps the noise vocoders disrupted the temporal content beyond some threshold that efficiently conveyed emotional arousal, which was still discernible in the sine and non-vocoded conditions. On the other hand, valence feature transmission, though significantly better in high order filter with sinewave carrier compared to low order filter with noise carrier conditions, was perceived significantly worse than arousal features in all vocoded conditions. In other words valence transmission only improved with combined improvement of spectral and temporal content quality. Within the parameters selected for spectral manipulation, there was little effect of spectral content alone on valence perception.
This finding is consistent with a previous music emotion study that investigated vocoded and noise-masked CI-simulated materials in NH listeners (Giannantonio et al., 2015). The paradigm used piano excerpts (∼10 s long) taken from Western classical music with happy (major mode, fast tempo 80–255 bpm) and sad (minor mode, slow tempo 20–100 bpm) emotions, and changed the same excerpts to the opposite mode or a neutral tempo (80 bpm). They then compared the categorization of original and changed excerpts in order to assess which features, tempo or mode, informed the categorization. It was found that modal cues informed non-vocoded/non-masked music emotion perception but exclusively tempo cues informed vocoded and masked music emotion perception. Thus spectral cues were not used as well as temporal cues during music emotion categorization with degraded acoustic signals. Our findings were able to generalize this phenomenon to a paradigm with four emotions. Moreover, our shift along temporal and spectral dimensions in the vocoders further highlight the role of temporal information informing music emotion categorization with reduced acoustic input.
Another music emotion perception study approximating CI listening with vocoded materials and NH participants found somewhat contrasting results (Paquette et al., 2018), where valence and arousal were rated during categorization of simple melodies of bursts of notes of short duration (<2 s) containing the emotions happiness, sadness, fear and neutrality. It was found that NH listeners with vocoded stimuli used the timbral features of energy and roughness to inform both arousal and valence ratings. In that study, stimuli were taken from a set of improvised emotional content played on clarinet and violin instruments, consisting of only a few notes (Paquette et al., 2013). While the stimuli description does not indicate whether chords were played on the violin, at least half of the stimuli were monophonic (played on the clarinet, which can only play one note at a time), in contrast to our fully orchestrated excerpts or classical piano excerpts in Giannantonio et al. (2015). It may be that vocoded monophonic bursts in their materials provided clearer spectral cues than the fully orchestrated excerpts from our study or Giannantonio et al. (2015), offering more salient spectral information. It would be interesting to apply the current vocoders with varying spectral and temporal content to the Paquette et al. (2018) paradigm, to evaluate how valence and arousal cues in short bursts are modulated as the quality of spectral and temporal content varies. If results still diverge from vocoded conditions in Giannantonio et al. (2015) and the current study, it would add an intriguing nuance to future directions for music emotion perception with CI (simulated) hearing.
Limitations to the Current Paradigm
Vocoder Parameters
The current study systematically varied the quality of temporal and spectral content by way of changing carrier and filter order, respectively. While we chose these parameters based on previous studies that manipulated spread of excitation (Bingabr et al., 2008; Crew & Galvin, 2012), the choices are still only capturing a limited range of temporal and spectral content variation. Moreover, it cannot be said that the two parameters have equivalent effects, ie., that our current spread contrast (4th vs. 12th order) is meant to yield a physical or perceptual difference equivalent to that induced by our carrier contrast (sinewave vs. noise). Instead, we can only argue that for each parameter, we had one condition providing more information than the other. This means that any interaction, or lack thereof, as it happened, could be very different if we had chosen different parameter values (e.g., if we had contrasted 2nd order to 24th order, or if we had compared sinewave carriers to pulse-spreading harmonic complexes).
This being said, the parameter values were not chosen arbitrarily, but were instead based on reports in the literature in order to either realistically mimic certain aspects of electrical stimulation, or to allow comparison to previously collected data. We used 16 channels in all conditions, as this is an average of what modern implants offer (12–22 channels) and 16 channels were moreover used in Bingabr et al. (2008) and Crew and Galvin (2012). We moreover took the best spectral content that previously aided melodic contour identification in Crew and Galvin (2012), 4th order filters, and treated it as our lowest spectral content here. Our best spectral content was achieved with a 12th order filter, which we found during informal piloting to offer the best noticeable contrast in spectral content. Future studies could add more conditions, or a different range; for example, while spectral quality seemed to have a small effect on music emotion categorization in the current study, perhaps a larger difference would be observed if we degraded content even further, e.g., 1st order filter).
Furthermore, while we branded the two parameters as temporal vs. spectral, their effect on the stimuli is not as orthogonal as one may wish, and we cannot rule out that spectral differences might have resulted from our manipulation in the temporal domain, and vice-versa, which could in turn influence emotion categorization. Indeed, decreased filter order could also potentially result in smearing temporal information in each channel as it gets mixed up more with neighboring channels. Nevertheless, one can expect this effect to remain relatively limited compared to the drastic change of carrier we introduced: while the noise carrier introduces an exogenous source of noise in the temporal envelopes, current spread only mixes envelope information coming from the same original signal, and reduces envelope information in as much as the envelope is uncorrelated across bands (for music, one could expect it to be relatively well correlated). As for the reciprocal influence of carrier nature on spectral resolution, specific steps have been taken to limit its extent, notably by making sure that the sinewave carrier is not generating unresolved side-bands. Therefore, here as well, we can expect that the manipulation of filter order should be the primary drive of spectral resolution, and that carrier type should only have a secondary effect.
Since we found here that the responses to first and second halves of the stimuli were highly correlated (see supplementary analysis in S4), our experiment can be conducted with half the amount of items, leaving room to test more parameters in future paradigms. In order to preserve fidelity of emotion during performance, intensity in our stimuli was kept ecological within and across emotion categories by our loudness adjustment experiment (see supplementary materials). This was mostly aimed at preserving the ecological cues in the vocoded condition, as this is the first instance that the current stimuli were presented with a vocoder. Loudness, along with tempo, is informative of arousal, and in turn arousal cues are the most useful type of cue for CI users. Ultimately, increased dynamic range may allow larger differences in intensity that could provide more salience to loudness and in turn arousal. Thus spectral energy may prove an interesting parameter to systematically adjust in vocoder conditions in future research.
Interpretation of Observed Effects
We furthermore cannot assume that the vocoders introduce all of the confusion between emotions in the stimuli. Indeed, in the non-vocoded condition (Figure 5), there was some categorical confusion between joy and fear, and to a stronger extent serenity and sadness. While vocoders might have amplified an existing confusion between categories, the acoustic cues to valence were perhaps more subtle than the acoustic cues to arousal and therefore more susceptible to degradations.
We also note that we are not per se investigating the emotion experienced by participants when they hear the music, rather we asked them to identify which emotion corresponds to the music heard. Participants were not asked to distinguish between felt and perceived emotions, a distinction that can be ambiguous to perform in an explicit way (e.g., Scherer, 2004), or even impossible according to theories of embodied cognition (e.g., Niedenthal, 2007). Moreover, the acoustic manipulation in vocoded conditions may have distanced recognition of the content from the actual emotional experience, in particular for NH participants who are not used to listening to music with reduced spectrotemporal content. Our investigation thus is limited to the recognition of intended emotional content of music by the composer/performers, also with reduced spectrotemporal content, can generally contribute to overall music listening pleasure and experienced emotion (e.g., Sachs et al., 2015; Fuller et al., 2019, 2021). Future studies could moreover explore the perceived/expressed emotion judgements with either open choice responses or more fine-grained response options.
Implications for Music Emotion Categorization with Cochlear-Implant Hearing
The two previous studies investigating music emotion categorization with vocoded conditions described above (Giannantonio et al., 2015; Paquette et al., 2018) also incorporated experiments with actual CI users. Giannantonio et al. (2015) found that CI users rely more strongly on tempo cues than NH listeners, and that when modal/pitch cues factored in ratings, these were linked to residual hearing abilities in the implant users. Our findings from vocoded conditions align with these results, indicating greater reliance on tempo to judge music emotion without spectral cues (e.g., vocoded simulations have less spectral information than might be available in residual hearing). We moreover show that this is the case with listeners with a broad range of musical training, though this influence was assessed only in a supplementary analysis here (see S3). Our study supports the findings from Giannantonio et al. (2015), which in turn suggests that the findings may extend to stimuli with natural tempo and modal changes, and into emotional dimensions of valence and arousal, in CI users.
Paquette et al. (2018) found that CI users used the timbral features of energy and roughness to inform arousal and valence such that increased energy and roughness were associated with lower valence and arousal ratings. Interestingly, the minimum pitch in the burst also informed arousal (though other spectral cues did not inform categorization; brightness, maximum- and mean pitch), contrary to our results. However; CI users have previously demonstrated limited ability to perceive the contour of a short succession of notes (Galvin et al., 2007), which may be more accessible than in longer musical passages such as fully orchestrated classical music excerpts used in our study.
While the literature is consistent that valence is informed strongly by spectral cues among normal-hearing listeners, the literature is also consistent in reporting that CI users are not able to efficiently make use of such spectral cues. This was echoed by our vocoded condition results, where valence was not efficiently transmitted in the vocoded signal in either of the spectral content conditions. An alternative to using spectral cues to inform valence could be to use sensory dissonance from envelope roughness as a musical device: A previous study found that CI users rated dissonant-chord accompaniment to be as pleasant as consonant-chord accompaniment, whereas NH listeners rated dissonant-chord accompaniment to be less pleasant than consonant-chord accompaniment (Caldwell et al., 2016). All chords in the stimuli were either dissonant or consonant, with no within-trial variation. Thus if CI users can detect envelope roughness, it is possible that they might still be able to detect differences in dissonance and consonance if played in succession within the same passage. Future research could investigate how sensitive CI users are in perceiving envelope roughness, and whether they are inclined to attribute this cue to valence or whether a valence association with roughness might be created by cultural instruction to inform musical emotion perception. That could in turn allow tension and relaxation patterns associated with music enjoyment (Bigand et al., 1996; Lehne & Koelsch, 2014) to become available to CI users.
It might be argued that while our results seem to align with previous studies with a happy-sad paradigm, our findings differ from a previous report of CI music emotion categorizations with more nuanced valence and arousal ratings and more ecological (e.g., no manipulated mode or tempo) stimuli similar to ours (Ambert-Dahan et al., 2015). On a visual analog scale, CI-users rated the emotion expressed in musical excerpts in terms of the presence of happiness, fear, sadness and peacefulness, as well as the arousal and valence of each excerpt. Overall, it was found that CI users had preserved valence perception but impaired arousal perception, and that ‘peacefulness’ was the most accurately rated emotion. However, an explanation why this study may have found preserved valence in CI hearing compared to NH hearing was that 11 of the 13 CI user participants had residual hearing in the contralateral (hearing-aided) ear. Residual hearing significantly benefits music perception in CI users (El Fata et al., 2009; Gfeller et al., 2006), including, as previously indicated (Giannantonio et al., 2015), that CI users could use modal cues to perceive emotion when they have residual hearing. Thus we speculate that results may have resembled our findings with vocoded materials (and the CI-alone condition in D’Onofrio et al., 2020) if CI users were using CI hearing alone with no acoustic hearing. Moreover, the analysis was carried out differently than in our study, assessing the difference between CI user and NH responses within each emotion category but not what the responses were relative to other emotion categories within groups. For example, visual inspection of the results indicates that the pattern of responses was perhaps similar to our findings: arousal ratings seemed to be higher for happy and fear than for peaceful and sad in both groups, but with globally lower arousal ratings for CI compared to NH listeners. It is furthermore not clear whether valence ratings were different at all among the categories within the groups, especially CI users.
Finally, a main finding of our vocoded conditions was that arousal was still conveyed efficiently with less temporal content. Moreover, changing spectral content among vocoders had only a small impact on valence transmission, and then in combination with the quality of temporal content. When considering the implication of this for CI users, it is important to note that manipulation of temporal information via different types of vocoding is different from what happens in cochlear implants. However, our results could indicate that even implants that transduce signals with less optimal temporal content could still be capable of conveying emotion in music, reaffirming generalizability of previous music emotion research with CI users, especially arousal. Considering that we found the quality of temporal content to impact both arousal and valence in vocoded conditions, future technology efforts aimed at improving the quality of temporal content in implanted hearing may directly benefit music emotion perception for CI users.
Conclusion
Music emotion perception in CI users is limited by the acoustic cues that can be transmitted by the electrical signal of the implant. By systematically varying availability of acoustic cues along temporal and spectral dimensions, our vocoder results with NH participants complement previous results that arousal cues informed by temporal content are likely most reliably available to the CI listeners and form the basis of their music emotion recognition. In vocoded conditions, arousal with both higher and lower temporal content was perceived better than valence, even in the condition with better spectral content. While these observations may be specific to our study and the specific parameters we have used in vocoding, the results of the present study seem in line with previous results from CI users. Based on this, we speculate that while increasing spectral resolution in implants might certainly help with music emotion perception when technically possible, our findings suggest that a promising direction for efforts to improve music emotion perception for CI users may also lie in the temporal domain. Future research could focus on CI users’ perception of envelope roughness in musical passages, for example; an interesting direction for CI-designed music composition might be to create musical tension-relaxation patterns with alternating degrees of envelope roughness.
Supplemental Material
sj-docx-1-tia-10.1177_23312165221141142 - Supplemental material for Musical Emotion Categorization with Vocoders of Varying Temporal and Spectral Content
Supplemental material, sj-docx-1-tia-10.1177_23312165221141142 for Musical Emotion Categorization with Vocoders of Varying Temporal and Spectral Content by Eleanor E. Harding, Etienne Gaudrain, Imke J. Hrycyk, Robert L. Harris, Barbara Tillmann, Bert Maat and Rolien H. Free, Deniz Başkent in Trends in Hearing
Footnotes
Acknowledgments
We would like to thank Dr. Christina Fuller for support in conceptual planning and proofreading the manuscript, and Ms. Jennifer Breetveld for administrative support.
Declaration of Conflicting Interests
The author(s) declared no potential conflicts of interest with respect to the research, authorship, and/or publication of this article.
Funding
The author(s) disclosed receipt of the following financial support for the research, authorship, and/or publication of this article: This study was funded by the Dorhout Mees Foundation, the Gratama Foundation, Heinsus Houbolt Funds, and the VICI grant (grant number 016.VICI.170.111) from the Netherlands Organization for Scientific Research (NWO) and the Netherlands Organization for Health Research and Development (ZonMw). The team Auditory Cognition and Psychoacoustics of the Lyon Neuroscience Research Center is part of the LabEx CeLyA (Centre Lyonnais d'Acoustique, ANR-10-LABX-60). The data that support the findings of this study will be openly available in the DataverseNL repository via ![]() .
.
Supplemental Material
Supplemental material for this article is available online.
Notes
References
Supplementary Material
Please find the following supplemental material available below.
For Open Access articles published under a Creative Commons License, all supplemental material carries the same license as the article it is associated with.
For non-Open Access articles published, all supplemental material carries a non-exclusive license, and permission requests for re-use of supplemental material or any part of supplemental material shall be sent directly to the copyright owner as specified in the copyright notice associated with the article.