
Abstract
Cochlear implants (CIs) are optimized for speech perception but poor in conveying musical sound features such as pitch, melody, and timbre. Here, we investigated the early development of discrimination of musical sound features after cochlear implantation. Nine recently implanted CI users (CIre) were tested shortly after switch-on (T1) and approximately 3 months later (T2), using a musical multifeature mismatch negativity (MMN) paradigm, presenting four deviant features (intensity, pitch, timbre, and rhythm), and a three-alternative forced-choice behavioral test. For reference, groups of experienced CI users (CIex; n = 13) and normally hearing (NH) controls (n = 14) underwent the same tests once. We found significant improvement in CIre's neural discrimination of pitch and timbre as marked by increased MMN amplitudes. This was not reflected in the behavioral results. Behaviorally, CIre scored well above chance level at both time points for all features except intensity, but significantly below NH controls for all features except rhythm. Both CI groups scored significantly below NH in behavioral pitch discrimination. No significant difference was found in MMN amplitude between CIex and NH. The results indicate that development of musical discrimination can be detected neurophysiologically early after switch-on. However, to fully take advantage of the sparse information from the implant, a prolonged adaptation period may be required. Behavioral discrimination accuracy was notably high already shortly after implant switch-on, although well below that of NH listeners. This study provides new insight into the early development of music-discrimination abilities in CI users and may have clinical and therapeutic relevance.
Keywords
Introduction
With the significant advancements achieved in cochlear implant (CI) technology in terms of speech perception, it is understandable that many current CI users wish to be able to listen to music. Furthermore, because music has played a vital role in many of these patients’ cultural and social lives prior to deafness, the promise of regaining music enjoyment is a major motivator for CI candidates (Fuller et al., 2021; Gfeller et al., 2000). This is confirmed by self-reports stating that music is the second most significant stimulus for CI users after speech (Gfeller et al., 2002).
Given the high temporal resolution and transmission accuracy of the implant, CI users, in general, perform on par with normally hearing (NH) controls in rhythmic tasks (Brockmeier et al., 2011; Jiam et al., 2017). Several studies, however, have shown that due to inadequate spectral resolution and compromised temporal fine-structure information, discrimination of fundamental features in music such as pitch, melody, and timbre is significantly poorer in CI users than in NH listeners (Bruns et al., 2016; Cooper et al., 2008; Petersen et al., 2012; Timm et al., 2012). Another reported deficit is the reduced ability to discern dynamics or intensity in music, which is ascribed to the high level of compression in the CI signal (Limb & Roy, 2014). Thus, for most CI users the music experience is unsatisfying, leading to little or no music enjoyment (Fuller et al., 2021; Mirza et al., 2003).
Nevertheless, some CI users seem to overcome the technological limitations and engage in a variety of music-listening activities (Riley et al., 2018), often reporting increased appreciation after repeated listening practice (Looi et al., 2012). Moreover, a few studies have indicated that targeted music training may significantly enhance the discrimination of specific features such as melodic contour, musical timbre, and rhythm (Gfeller, 2016; Gfeller et al., 2015; Jiam et al., 2019). Such improvements are an indication of the auditory system's capacity to reactivate brain function in response to new stimuli (Carcea & Froemke, 2013; Kolb et al., 2003) and the important role of neural plasticity in determining patient outcomes. It also suggests that the information delivered from the CI signal may not be fully utilized by CI users (Moore & Shannon, 2009).
These neuroplastic changes are due to the central nervous system's ability to reorganize itself by forming new synapses and rewiring neuronal circuits. The plastic changes, which can be both functional and structural, can happen throughout the lifespan and may help people recover from, for example, stroke (Johnston, 2009). In the case of cochlear implantation, plastic changes may occur at two levels. First, deprivation of auditory input may result in significant maladaptive changes in the central auditory system and potential cross-modal reorganization of the auditory cortex in support of other sensory processes, including visual and somatosensory input (Rettenbach et al., 1999). Second, after switch-on of the implant, the novel auditory stimulus itself induces plasticity, thereby allowing for the essential experience-dependent adaptation to the input from the CI (Glennon et al., 2020; Ito et al., 2004; Moore & Shannon, 2009).
The initial rehabilitation process following cochlear implantation has been the focus of several studies. In a study with 48 bilaterally implanted CI recipients, Chang et al. (2010) found that the strongest benefit on word recognition occurs within the first month, with performance continuing to improve up to 48 months after implantation. Using positron emission tomography and a speech perception test, our group measured 15 recently implanted CI users 3 and 6 months after switch-on (Petersen et al., 2013). In addition to a significant gain in speech perception scores achieved within the first 3 months, activation of Broca's area increased over time. Employing electroencephalography (EEG) to measure auditory event-related potentials, Sandmann et al. (2015) assessed the ability to discriminate 1, 12, and 18 semitones frequency changes in 11 postlingually deafened CI users <1, 8, 15, and 59 weeks postimplantation. The authors found that the most pronounced improvement occurred over the first 8 weeks of CI experience, as reflected in increased N1 amplitudes and decreased latencies. Taken together, these findings suggest that the most dramatic progress in outcomes happens in the early stages after the initial CI switch-on. We hypothesize that this may also be the case for music-discrimination skills.
In addition to the N1, EEG offers the possibility to record the mismatch negativity (MMN) response which has been successfully applied as a reliable objective marker for CI users’ discrimination ability (Cai et al., 2020; Näätänen et al., 2017; Petersen et al., 2020). The MMN is a preattentive component of the event-related potential. It is elicited by a violation of expectancy, or a deviation, in a sequence of stimuli, that is, the sequence of regular stimuli (standard) is infrequently interrupted by a deviant stimulus. Stimuli are often presented in oddball paradigms, though newer developments within the MMN paradigm include multifeature paradigms with multiple deviants that deviate on independent features (e.g., intensity, pitch, timbre, and rhythm for musical tones) (Pakarinen et al., 2007; Petersen et al., 2020; Vuust et al., 2011) and multifeature paradigms without any standard stimuli (Kliuchko et al., 2016; Petersen et al., 2020). Typically, the negative peak occurs around 100–250 ms from deviation onset (Kujala et al., 2007; Näätänen et al., 2007). In a study involving 11 experienced CI users and 14 NH controls, our group recently validated a novel musical multifeature (MuMuFe) no-standard MMN paradigm that presents deviants in intensity, pitch, timbre, and rhythm at four levels of magnitude. The results showed that for all deviants, the CI users displayed MMN responses that were not significantly different from those of NH controls, neither in terms of amplitude nor latency. By contrast, measurements of behavioral discrimination of the same deviants showed that CI users scored significantly below NH controls in intensity and pitch (Petersen et al., 2020). The results suggest that preattentive neural discrimination is established before behavioral discrimination abilities, which require higher-order processing; a distinction that has also been established in studies concerning, for example, amusia (Moreau et al., 2013). To investigate the reliability of this hypothesis, a longitudinal study of the adaptation process in CI users is warranted.
So far, no studies have examined the early development of music-related discrimination skills in recently implanted CI users. Hence, the study aimed to investigate recently implanted CI users’ development of music-discrimination abilities in the early phase following implant switch-on applying both neurophysiological and behavioral measures. Considering previous findings, we hypothesized that recently implanted CI users would show significant development in their neural and behavioral discrimination of changes in intensity, pitch, and timbre after a period of approximately 3 months. By contrast, we expected that detection of changes in rhythm would be strong even shortly after CI activation and thus remain unaffected by the adaptation process. Moreover, based on previous reports of continued adaptation to the CI signal, we expected to see significant differences between recently implanted and experienced CI users, as reflected through smaller MMN amplitudes, longer latencies, and poorer behavioral discrimination accuracy for recently implanted CI users. The study may contribute to the general knowledge about music perception in CI users. It is critical to expand the research in this area since ameliorating CI users’ experience of music might have beneficial implications for their quality of life. Finally, gaining insight into the early development of music-discrimination abilities in CI users with the use of both neurophysiological and behavioral measures may have both clinical and therapeutic relevance.
Materials and Methods
Participants
Twelve recently implanted CI users (CIre) were recruited for the study. Due to technical problems and a coronavirus disease 2019 (COVID-19)-related cancelation, three participants were excluded, leading to a total number of nine (median age: 61 years; range: 30–85; two women). CIre participants were tested twice: within 6 weeks after switch-on of the implant (T1) and approximately 3 months after T1 (T2). However, because of logistical and individual issues, three participants had to postpone their T2 tests. CIre users had a median CI experience of 21 days at T1 (range: 3–42) and 118 days at T2 (range: 105–188). One CIre user was bilaterally implanted and eight were bimodally aided, that is, using a hearing aid on the side contralateral to their CI. The CIre users had a median duration of severe-profound deafness (defined as the period from the point of time at which an ipsilateral hearing aid was no longer beneficial to the time of CI switch-on) prior to CI of 2 years (range: 0–16). Seven participants reported being able to communicate over the phone (see Table 1 for details).
Demographic and Clinical Characteristics of CIre and CIex Participants.

Note. Duration of severe-profound deafness prior to CI is defined as the period from the point of time at which an ipsilateral hearing aid was no longer beneficial to the time of CI switch-on. Hearing aid: whether the participant wears a hearing aid on the ear contralateral to the implanted ear. Telephone ability: the participant reports ability to communicate via telephone.
Additionally, 13 experienced CI users (CIex; median age: 56 years; range: 18–77; nine women) and 14 adults with normal hearing (NH; median age: 62 years; range: 55–77; seven women) were included for reference and only tested once. Participants in the CIex group had a median CI experience of 7 years (range: 1–14). The CIex users had a median duration of severe-profound deafness prior to CI of 0 years (range: 0–4). Prior to the study, NH participants were required to pass an online hearing test that adaptively estimated a threshold for the perception of words and numbers in background noise 1 .
To be included in the study, CI users had to meet the following criteria: >18 years of age, postlingual hearing loss (i.e., acquired profound hearing loss on the implanted ear developed after language acquisition), absence of neurological and severe psychological disorders, and no use of medication affecting brain function. The CI users were recruited in cooperation with the Department of Otorhinolaryngology, Head and Neck Surgery, Aarhus University Hospital and through the Danish CI users’ organization and their online platform.
Participants were informed about the study orally and in print before giving consent to participate. Participants were not compensated monetarily. Each participant was anonymized using a participant code (ID). The study was conducted in accordance with the Helsinki declaration, and it was approved by the Research Ethics Committee of the Central Denmark Region (#55018).
The study was part of a broader project which tested and validated the CI MuMuFe MMN paradigm, reported in Petersen et al. (2020). Importantly, data from all NH controls and 11 of the CIex participants are the same as those presented in the previous study (see Petersen et al., 2020). However, as the main focus in the present study is on the early development of CIre, the data from NH and CIex are merely included here as a reference for this study's CIre data. Participants were also presented with a free-listening EEG paradigm, presenting real music, which will be reported in a separate paper.
Stimuli
The CI MuMuFe MMN paradigm (Petersen et al., 2020) consists of an Alberti bass melody in which deviant notes are inserted to elicit MMN responses (Figure 1). It is a no-standard paradigm, meaning that it contains no melodic patterns without a deviant note. The deviant note always occurs on the third out of four notes in the melodic pattern, and it involves a change in either the intensity, pitch, timbre, or rhythm feature. On each of these four features the degree of deviation alternates between small (S), medium (M), large (L), and extra-large (XL) deviant magnitudes. For intensity deviants, the intensity of the note is reduced by 3 dB (S), 6 dB (M), 9 dB (L), or 12 dB (XL). Pitch deviants involve a lowering of the pitch by one (S), two (M), three (L), or eight (XL) semitones. The standard timbre is a grand-piano sound, whereas the deviant timbres are bright piano (S), blues piano (M), trumpet (L), or guitar (XL) sounds. For rhythm deviants, the second note is shortened by 26 ms (S), 52 ms (M), 103 ms (L), or 155 ms (XL) and the third note prolonged accordingly. The order of these deviants is pseudo-randomized. All notes in the Alberti bass melody have a duration of 200 ms (with 18-ms rise and fall) and a 5-ms silent interstimulus interval. The Alberti bass melody is played in four different keys (C, Eb, Gb, and A) with resulting notes spanning the range between Ab3 (208 Hz) and E5 (659 Hz). For further details regarding the CI MuMuFe MMN paradigm see Petersen et al. (2020).

The CI MuMuFe no standards MMN paradigm with four deviant features at four levels of magnitude. Note. The paradigm is presented randomly in four different keys: C, Eb, Gb, and A major. Lowest note: Ab3 (208 Hz); highest note: E5 (659 Hz). S: small; M: medium; L: large; XL: extra-large. Reprinted from Petersen et al. (2020). MMN = mismatch negativity; MuMuFe = musical multifeature; CI = cochlear implant.
Procedure
The experiment was conducted at Aarhus University Hospital, Denmark. Participants were assessed using both EEG and a behavioral three-alternative forced-choice (3-AFC) task. For each session and for each participant, the sound level was individually adjusted to a comfortable level from a set starting point of 65 dB SPL. The sound was delivered bilaterally to NH participants through in-ear Shure headphones. For CI users, sound was transmitted unilaterally and directly to the implant through an audio connection with microphones switched off. This step was made to prevent the participants from using their residual hearing. Bilateral CI users were instructed to use their preferred implant, whereas bimodal CI users were instructed to remove their hearing aid. CI users were tested with their everyday processor settings. If the CI speech processors did not contain a direct audio input, the participant's personal maps were programmed onto a spare processor, which was used instead.
Electroencephalography
EEG was recorded in an acoustically shielded room with a BrainAmp amplifier system (Brain Products, Gilching, Germany) at a sampling rate of 1000 Hz. A 32-electrode cap was used, and electrodes were placed in accordance with the international 10/20 system. All electrode impedances were ensured to be <25 kΩ. To record the electrooculogram, electrodes 28 and 32 were placed beside and above the left eye. For online recording, the FCz was used as a reference electrode. The audio stimuli were presented at a 44.1 kHz sample rate during the EEG recording using the Presentation software (Neurobehavioral System, Berkeley, CA). All participants were instructed to ignore the audio stimuli and watch a subtitled movie with muted audio (more details available in Petersen et al., 2020). The duration of the EEG recording was approximately 35 min.
Behavioral Test
In addition to the EEG measurements, all participants were assessed with a 3-AFC task. Similar to the MMN paradigm, this test presented deviants in intensity, pitch, timbre, and rhythm embedded in a four-note Alberti bass pattern, thus making comparisons between the responses from both measures possible. In this test, participants were instructed to choose the odd one out of three melodic patterns. Thus, one of the three melodic patterns in each trial contained a deviant note whereas the two others did not contain a deviant and were the corresponding “standard” version of the deviant pattern. Each of the 16 deviant variants was presented six times (total n trials = 96). The order of the deviant variants as well as the location of the deviant (first, second, or third pattern) were randomized. The 3-AFC task was presented using the MACarena software (Lai & Dillier, 2002). The duration of the test was approximately 15 min.
Data from both measures were stored and handled in compliance with the European general data protection regulations.
EEG Preprocessing
The EEG data were preprocessed by following the same procedures as in Petersen et al. (2020) by applying the FieldTrip Toolbox for MATLAB (Oostenveld et al., 2010). Data were downsampled to 250 Hz and subsequently, a 1 Hz highpass filter was applied followed by a 25 Hz lowpass filter. Bad channels (range: 0–4 channels, showing excessive noise or no signal) were reconstructed by the standard method for weighted interpolation of neighboring channels implemented in FieldTrip. Eye and CI artifacts were suppressed with the infomax independent component analysis method (Delorme et al., 2007; Makeig et al., 1996), where independent components reflecting the artifacts (range: 1–10 components) were identified and subtracted. Subsequently, the continuous EEG was re-referenced to the average across all electrodes and segmented into standard trials (n = 6288) and deviant trials (n = 144 for each of the 16 deviant variants). For the intensity, pitch, and timbre deviants, a baseline correction was applied by subtracting the average signal between −100 and 0 ms prior to the note onset. For the rhythm deviants, a baseline correction was applied by subtracting the average signal between −100 and 0 ms prior to the onset of the preceding note, that is, the non-shortened note occurring before the actual rhythm deviant. Trials exceeding −/+100 μV were automatically rejected (range: 0%–5% trials), and average waveforms across trials were obtained.
Statistical Analyses
The MMN was analyzed at the Fz electrode. Due to the high variance in the MMN latency across the heterogeneous participant groups (spanning from approximately 100–250 ms), the MMN amplitude was measured as the mean amplitude across the entire 100–250 ms time window, which, as already mentioned, reflects the typical latency range for the MMN. This enabled more valid group comparisons than would have been achieved by calculating the MMN amplitude over a narrower time window. The individual MMN latency was automatically estimated as the most negative peak between 100 and 250 ms, and for the few cases where no negative peak could be estimated within 100–250 ms, latency was estimated as the most negative value between 100 and 250 ms (3 observations: 2 CIex and 1 NH, all pertaining to the XL level in the rhythm deviant). For each group, we tested whether each level of each deviant elicited significant MMN responses. As the amplitude data for some contrasts were not normally distributed, we conducted one-sample Wilcoxon signed-rank tests against 0 (see Supplemental Material for full reporting of these tests, including the Shapiro-Wilk tests).
Longitudinal Analysis
We used mixed-effects modeling to statistically assess the potential development in both behavioral performance in the 3-AFC task and the amplitude and latency of MMNs. This was done in the RStudio software (RStudio Team, 2021), an IDE for R (R Core Team, 2021), using the glmer and lmer functions, respectively, from the ‘lme4’ package (Bates et al., 2015). A hierarchical approach was used, and random intercepts for participants were included in all models to account for individual differences. Starting with a null model, independent variables were added incrementally, all as within-subject factors. These comprised deviant features (intensity, pitch, timbre, rhythm), deviant level (S, M, L, XL), and time (T1, T2), and all interactions between these (all three 2-way interactions and the full 3-way interaction). Models were fitted using maximum likelihood. Improvement of model fit was evaluated using likelihood ratio tests. Additionally, R2 values are provided (using the “StatisticalModels” package; Newbold, 2015) as a tentative proxy for the variance explained by the model with the best fit, though we urge the reader to interpret these values with caution as R2 values depend on several factors and not merely goodness of fit. For the MMN data, the window-averaged amplitudes and the peak latencies were used as the dependent variables. For the behavioral data, participants’ correct and incorrect responses were used as the dependent variable, incorporating a binomial response function.
Following any significant interaction effects involving time, pairwise contrasts were used to test whether the result of the time contrast between T1 and T2 differed between either deviant features or levels, depending on the nature of the interaction. Contrasts were carried out using the “emmeans” package (Lenth et al., 2021) in R. Confidence intervals were calculated using the Kenward–Roger approximated degrees of freedom and was used as they serve as both precision indicators and significance tests. For contrasts of the linear models, that is, those with MMN amplitude and latency as the dependent variables, contrasts are based on comparing the beta (β) estimates to 0, with intervals excluding 0 indicating a statistically significant result. For contrasts of the nonlinear models, that is, those concerning the performance of the 3-AFC task, contrasts are based on comparing the odds ratio to 1, with intervals excluding 1 indicating a statistically significant result. These post-hoc analyses were solely intended to explore any relevant significant main or interaction effects. Since we report on relatively subtle effects in this study, not all post-hoc analyses would be useful as explorations of the observed effects if we were to correct for multiple comparisons. Hence, we report uncorrected confidence intervals for these post-hoc tests.
Group Comparisons
In addition to the main analysis, a group analysis was carried out to compare CIre to the CIex and NH groups. As the reference data from CIex and NH did not include a longitudinal contrast (i.e., they were only tested once), we constrained the comparisons with CIre to the last of the two time points, namely T2. The logic behind this choice was that the contrast between CIre and the reference groups for both T1 and T2 would only be relevant if the corresponding contrast was significant between T1 and T2 in the longitudinal analysis for CIre.
The same modeling approach as described above was used for assessing potential group differences. However, the independent variables in these models comprised deviant feature, deviant level, and group (CIre, CIex, NH), and all interactions between these (all three 2-way interactions and the full 3-way interaction). Following any significant main or interaction effects involving group, pairwise contrasts were used to explore what group contrasts between CIre, CIex, and NH drove an effect and for interactions to test whether these group contrasts differed between either deviant features or levels, depending on the nature of the interaction. Hence, any significant interactions between deviant feature and deviant level were not explored any further, as this contrast was not of relevance to our hypotheses, but nonetheless modeled for full hierarchical transparency. The same approach was used to calculate the confidence intervals as in the longitudinal analysis.
For the linear mixed effects analyses (i.e., MMN amplitude and latency for both within- and between-group analyses), plots of all final model residuals were used to inspect whether models violated the assumptions of normality and homoscedasticity. No violations were detected.
For visualization, pirate plots were made using the “yarrr” package (Phillips, 2018) in R. MMN topographies and waveform plots were made with FieldTrip functions.
Results
Only significant results are reported in-text (all post-hoc contrasts in Tables 2–5); alpha level was set to 0.05. For a full list of model evaluation metrics see Supplemental Material. Results for MMN amplitudes are visualized in Figures 2–4. Results for MMN latencies and behavioral performance scores are visualized in Figures 5 and 6, respectively.

Averaged MMN amplitudes within each feature for each group. Note. Averaged MMN amplitudes in μV within each deviant for all groups, including CIre at both T1 (CIre_T1; green) and T2 (CIre_T2; gray), CIex (orange), and NH (red). As the MMN elicits a negative peak, a stronger MMN response is reflected by a more negative μV value. MMN = mismatch negativity; NH = normally hearing; CIre = recently implanted cochlear implant users; CIex = experienced cochlear implant users.

MMN topographies within each feature for each group. Note. Measured across the 100–250 ms measurement time window. MMN = mismatch negativity; NH = normally hearing; CIre = recently implanted cochlear implant users; CIex = experienced cochlear implant users.
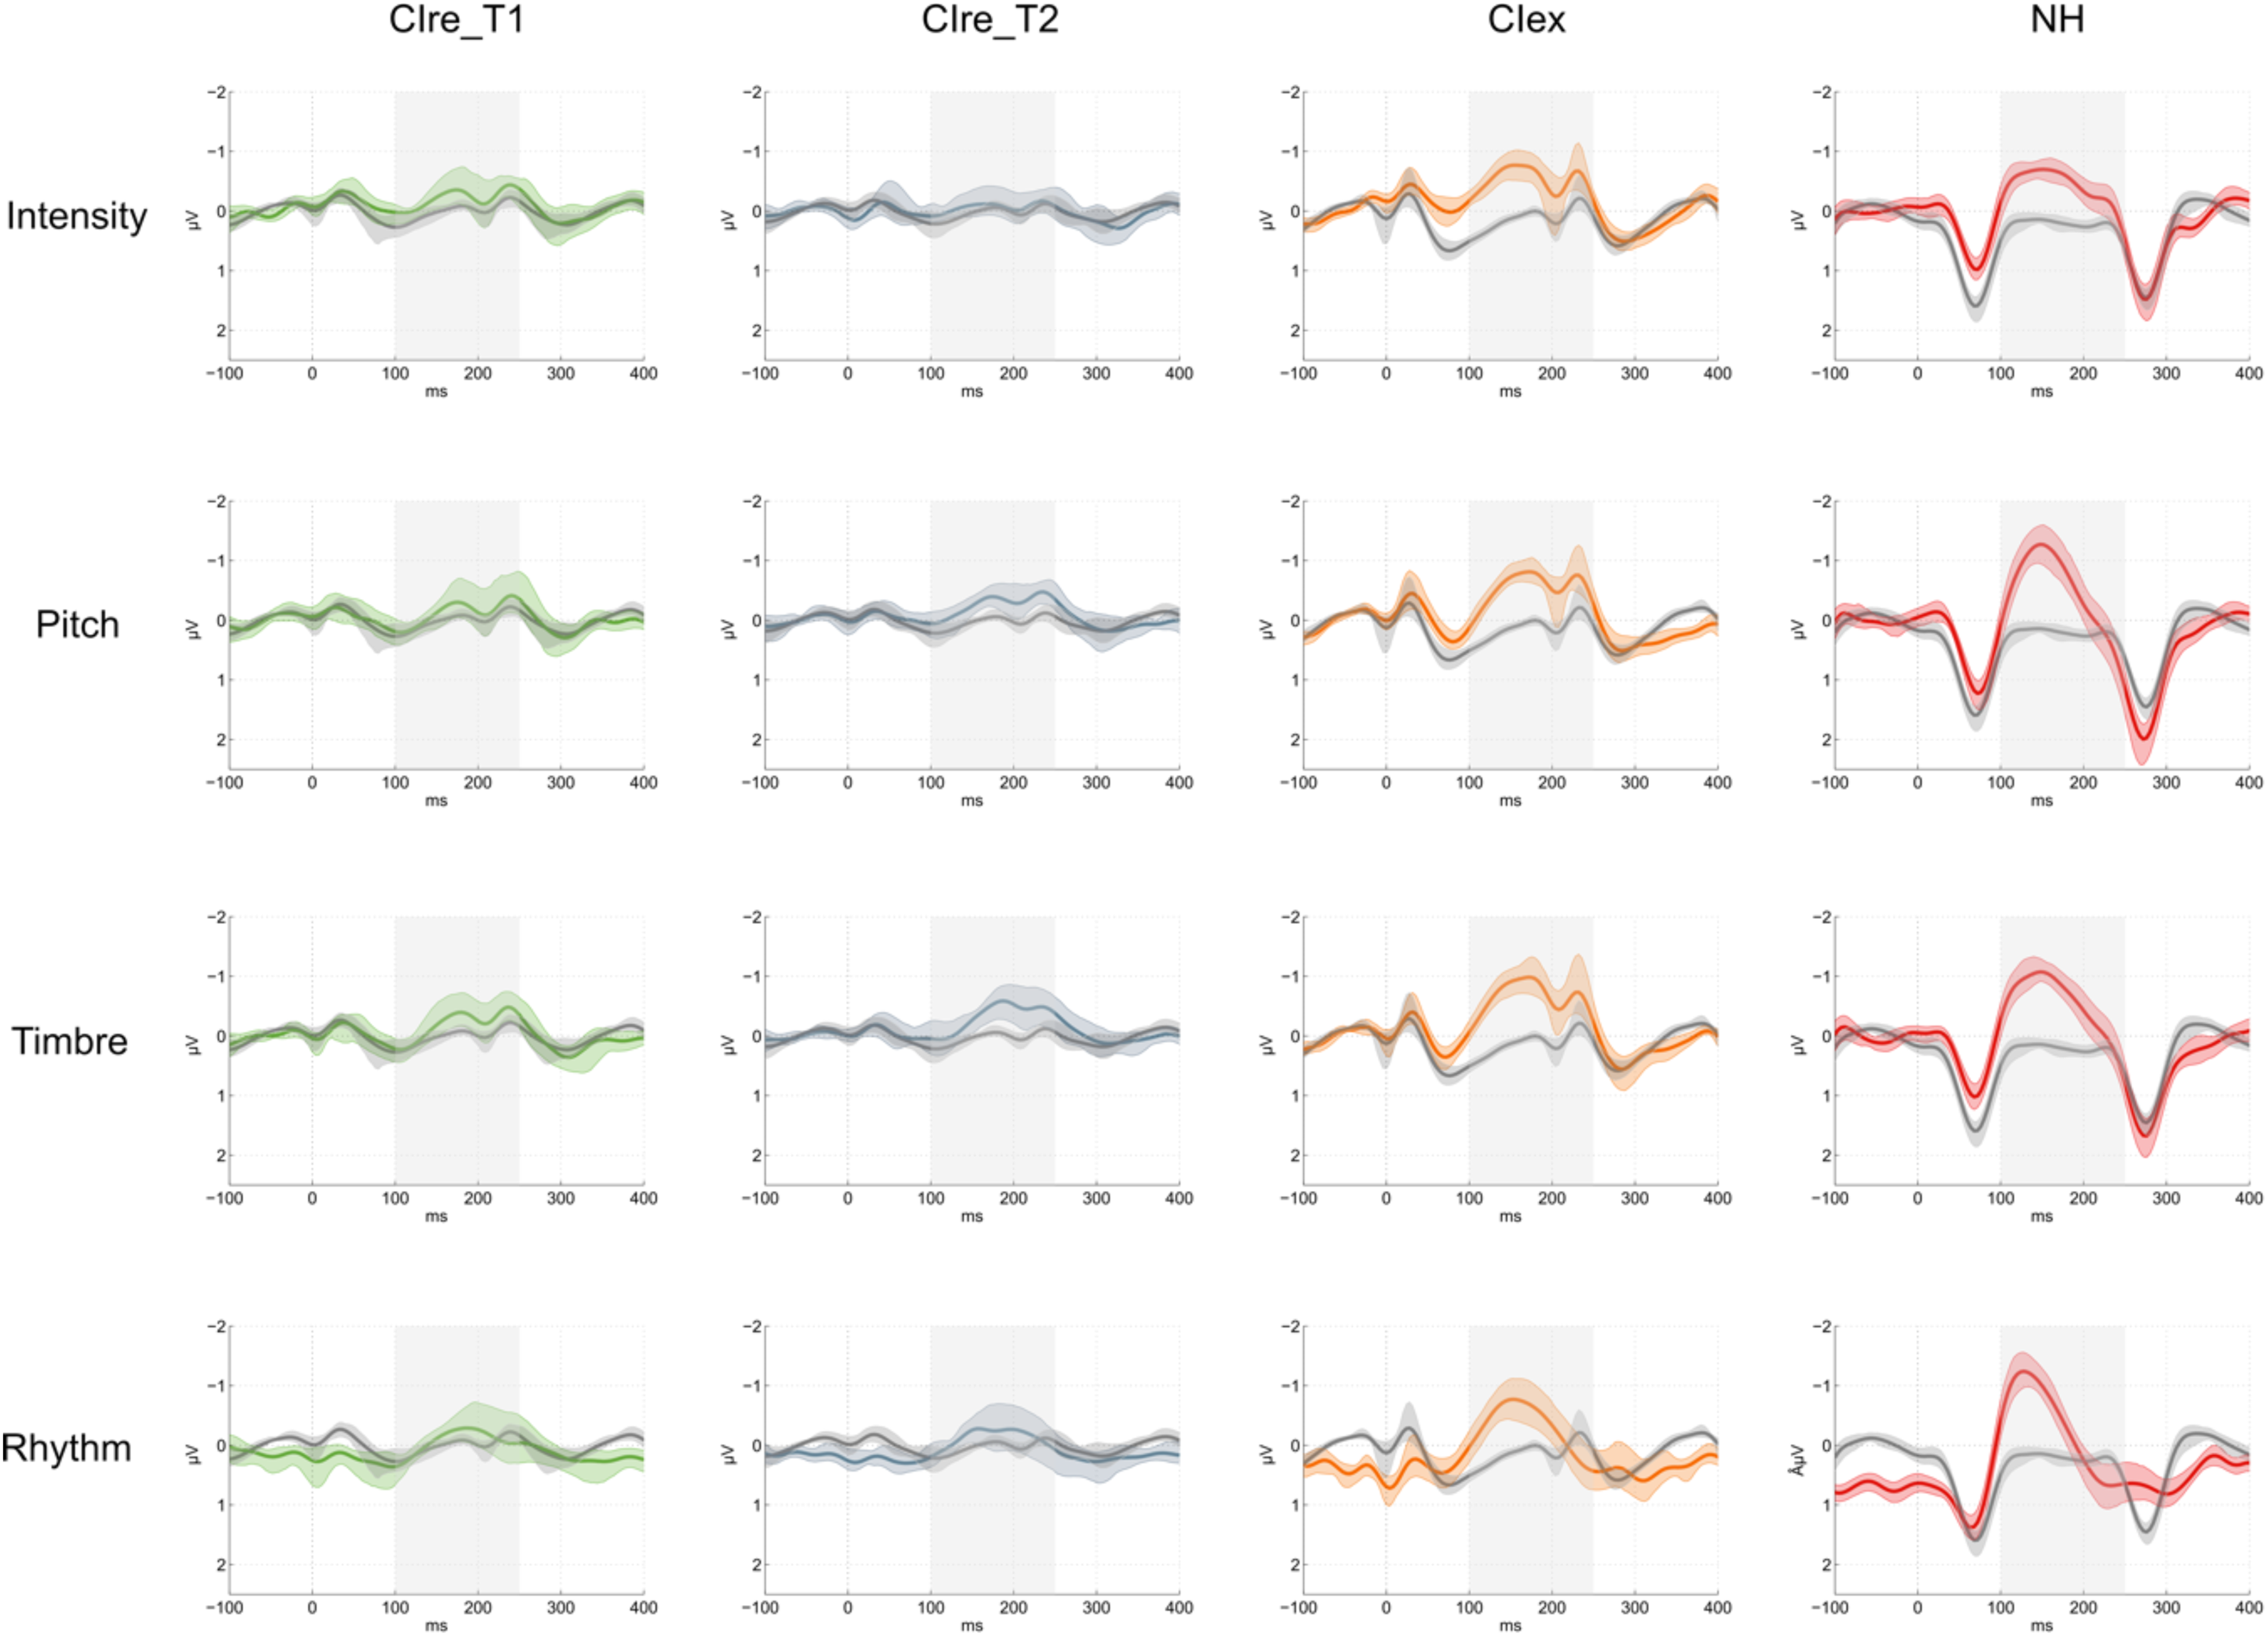
MMN waveforms within each feature for each group. Note. Showing deviant (colored) and standard (gray) waveforms at the Fz electrode. The shaded error bars show bootstrap 95% confidence intervals. The gray box indicates the 100–250 ms measurement time window. CIre_T1: green; CIre_T2: gray; CIex: orange; NH: red; MMN = mismatch negativity; NH = normally hearing; CIre = recently implanted cochlear implant users; CIex = experienced cochlear implant users.

Averaged MMN latencies within each feature for each group. Note. Averaged MMN latencies in ms within each deviant for all groups, including CIre at both T1 (CIre_T1; green) and T2 (CIre_T2; gray), CIex (orange), and NH (red). Shorter latency indicates faster neural processing. MMN = mismatch negativity; NH = normally hearing; CIre = recently implanted cochlear implant users; CIex = experienced cochlear implant users.

Averaged behavioral performance scores within each feature for each group. Note. Averaged correct in percentage within each deviant for all groups, including CIre at both T1 (CIre_T1; green) and T2 (CIre_T2; gray), CIex (orange), and NH (red). Chance level (33.33%) is marked with the dotted line. NH = normally hearing; CIre = recently implanted cochlear implant users; CIex = experienced cochlear implant users.
Longitudinal Analysis — Post-hoc Contrasts for MMN Amplitude.

Note. Post-hoc contrasts for MMN amplitude between T1 and T2 for the CIre group. Significant results are marked with ‘*’. MMN = mismatch negativity.
Group Comparisons – Post-hoc Contrasts for MMN Amplitude.

Note. Post-hoc contrasts for MMN amplitude between CIre, CIex and NH groups. First, the main effect is explored, that is, across deviants. Then, the findings from the longitudinal analysis are explored further, that is, group contrasts within pitch and timbre between CIre at T1, CIex, and NH as well as CIre at T2, CIex, and NH. Significant results are marked with ‘*’. MMN = mismatch negativity; NH = normally hearing; CIre = recently implanted cochlear implant users; CIex = experienced cochlear implant users.
Group Comparisons — Post-hoc Contrasts for MMN Latency.

Note. Post-hoc contrasts for MMN latency between CIre, CIex, and NH groups within each deviant. Significant results are marked with “*.” MMN = mismatch negativity; NH = normally hearing; CIre = recently implanted cochlear implant users; CIex = experienced cochlear implant users.
Group Comparisons — Post-hoc Contrasts for Behavioral Performance Scores.

Note. Post-hoc contrasts for behavioral performance between CIre, CIex, and NH groups within each deviant. As nonlinear models were used, contrasts are reflected through the odds ratio and confidence intervals are asymptotic. Significant results are marked with “*.” NH = normally hearing; CIre = recently implanted cochlear implant users; CIex = experienced cochlear implant users.
Wilcoxon signed-rank tests revealed significant MMN responses for CIre at T2 for pitch (S, M, and L) and timbre (S, M, L, and XL). For CIex and NH, MMN responses were significant for all levels within all deviants (see the Supplemental Material for full reporting of these results).
Longitudinal Analysis
MMN Amplitude
With outset in the null model, the likelihood ratio tests revealed a significant improvement of model fit by adding deviant feature (χ2(3) = 10.3, p = .016) and time (χ2(1) = 3.93, p = .047). The likelihood ratio tests further revealed that the model including the interaction between deviant feature and time was the model that fitted the data the best (χ2(3) = 10.13, p = .018), explaining 50% of the variance (R2 conditional = .501) with the fixed effects explaining 8% of the variance (R2 marginal = .080). Follow-up contrasts of the interaction between deviant feature and time based on the estimated marginal means of the best model projected the MMN amplitude to decrease (i.e., grow larger) by 0.161 µV (SE = 0.074) from T1 to T2 for pitch and by 0.161 µV (SE = 0.074) for timbre (Table 2 and Figure 2).
MMN Latency
None of the models explained the data better than the null model, indicating no significant differences in latencies between the different deviant features, between the different deviant levels, or between the two time points.
Behavioral Performance Scores
With outset in the null model, the likelihood ratio tests revealed a significant improvement of model fit by adding deviant feature (χ2(3) = 160.2, p < .001) and deviant level (χ2(3) = 66.97, p < .001). The model that fitted the data the best, including deviant feature and deviant level, explained 15% of the variance (R2 conditional = .145) with the fixed effects explaining 13% of the variance (R2 marginal = .125). However, no effect of time was identified, indicating no significant development in performance over time in the behavioral 3-AFC task.
Group Comparisons
All group contrasts involving CIre were based on measurements from T2, except for separate follow-up analyses of MMN amplitude for pitch and timbre at both T1 and T2 given the results from the longitudinal analysis. All contrasts for all three dependent variables are reported in Tables 3–5.
MMN Amplitude
With outset in the null model, the likelihood ratio tests revealed a significant improvement of model fit by adding the deviant feature (χ2(3) = 40.72, p = .001), deviant level (χ2(3) = 13.26, p = .004), and group (χ2(2) = 11.90, p = .003). The likelihood ratio tests further revealed that the model including the interaction between deviant feature and deviant level was the model that fitted the data the best (χ2(9) = 37.53, p < .001), explaining 52% of the variance (R2 conditional = .515) with the fixed effects explaining 21% of the variance (R2 marginal = .214). However, as mentioned in the “Methods” section, only interactions involving group were further explored. Follow-up contrasts based on the estimated marginal means of the best model projected the CIex' MMN amplitudes to be 0.413 µV (SE = 0.132) more negative than CIre's and the NH's MMN amplitudes to be 0.429 µV (SE = 0.130) more negative than CIre's; Table 3).
As the longitudinal analysis showed significant development in size of the MMN amplitude to pitch and timbre from T1 to T2, we performed a follow-up analysis to test these two deviant features specifically between CIre and the reference groups (CIex and NH) at both T1 and T2. These follow-up contrasts revealed significant differences between CIre and the reference groups for pitch and timbre at both T1 and T2 (Table 3 and Figure 2).
MMN Latency
With outset in the null model, the likelihood ratio tests revealed a significant improvement of model fit by adding deviant feature (χ2(3) = 9.14, p = .027) and group (χ2(2) = 19.58, p < .001). The likelihood ratio test further revealed a significant improvement in model fit by adding the interaction between the deviant feature and deviant level (χ2(9) = 24.28, p = .004) and the interaction between the deviant feature and group (χ2(6) = 23.65, p < .001). The model that fitted the data the best, including both aforementioned two-way interactions, explained 25% of the variance (R2 conditional = .247) with the fixed effects explaining 17% of the variance (R2 marginal = .173). Since we focused on the interactions involving group, we only report follow-up contrasts for the interaction between deviant feature and group. These follow-up contrasts based on the estimated marginal means of the best model projected the latencies to be significantly longer for CIre compared to CIex in intensity (18.56 ms, SE = 7.96), timbre (19.78 ms, SE = 7.96), and rhythm (18.93 ms, SE = 7.96). Additionally, latencies were projected to be significantly longer for CIre compared to NH in pitch (24.43 ms, SE = 7.85), timbre (23.42 ms, SE = 7.85), and rhythm (44.21 ms, SE = 7.85). Finally, latencies were projected to be significantly longer for CIex compared to NH in pitch (21.04 ms, SE = 7.07) and rhythm (25.27 ms, SE = 7.07; for an overview, see Table 4 and Figure 5)
Behavioral Performance Scores
With the outset in the null model, the likelihood ratio tests revealed a significant improvement of model fit by adding the deviant feature (χ2(3) = 142.50, p<.001), deviant level (χ2(3) = 131.51, p < .001), and group (χ2(2) = 14.30, p < .001). The likelihood ratio test further revealed a significant improvement in model fit by adding the interaction between deviant feature and deviant level (χ2(9) = 30.57, p < .001) and the interaction between deviant feature and group (χ2(6) = 22.71, <.001). The model that fitted the data the best, including both aforementioned two-way interactions, explained 12% of the variance (R2 conditional = .117) with the fixed effects explaining 10% of the variance (R2 marginal = .102). Since we focused on the interactions involving group, we only report follow-up contrasts for the interaction between deviant feature and group. These follow-up contrasts based on the estimated marginal means of the best model projected CIre to be 0.70 (SE = 0.07) times as likely to answer correctly for intensity as CIex and compared to NH 0.57 (SE = 0.06) as likely for intensity, 0.75 (SE = 0.08) as likely for pitch and 0.76 (SE = 0.08) as likely for timbre. Additionally, CIex were projected to be 0.82 (SE = 0.07) times as likely as NH to answer correctly for intensity and 0.74 (SE = 0.07) as likely for pitch (see Table 5 and Figure 6).
Discussion
This study investigated the early development in discrimination of prominent features of music in recently implanted CI users, as measured both neurophysiologically (using the MMN response) and behaviorally. In line with our hypotheses, the neurophysiological results showed a significant improvement in the discrimination of pitch and timbre, as indicated by increased MMN amplitudes. This development was further underpinned by significant MMN responses elicited by these features at the T2 endpoint. Contrary to our hypotheses, the progress was not reflected in the behavioral results. The neurophysiological results align with previous findings suggesting that improvement in postlingually deafened adult CI users’ auditory discrimination ability takes place in the very early stages after switch-on of the implant (Chang et al., 2010; Petersen et al., 2013; Sandmann et al., 2015). Furthermore, it reflects the hearing-deprived brain's ability to “learn” to decode the artificial and novel sounds transmitted by the implant, even when presented in a musically complex context.
As hypothesized, the CIre group showed significantly lower amplitudes in the MMN response across deviants compared to the CIex and NH groups. At a more specific level, amplitudes for CIre were significantly lower than those of CIex and NH for pitch and timbre at both T1 and T2, reflecting that, despite the marked development, the T2 amplitudes still did not match those of the reference groups. Both the CIex and the NH groups exhibited significant MMN responses to all deviants. Furthermore, no significant difference was found in amplitude between CIex and NH, suggesting that the neural adaptation not only occurs in the initial phase after switch-on but is a long-term process.
As expected, CIre performed on par with both CIex and NH in their behavioral discrimination accuracy of the rhythm deviant. By contrast, the CIre group scored significantly lower in intensity compared to CIex and in intensity, pitch and timbre compared to NH. Interestingly, and notwithstanding expectations, no significant differences were found between CIre and CIex in the discrimination of pitch and timbre.
Neural vs Behavioral Responses
The significant change over time in the CIre's neural discrimination of pitch and timbre did not reflect itself in the behavioral results. Already at T1, the mean CIre performance rate was well above the chance level (Figure 6), and at T2 it was not significantly different from the mean performance rate of CIex (Table 5). In other words, the CIre group exhibited a general behavioral discrimination accuracy at the early stage that did not leave much room for improvement. This is quite surprising and evidence of both the efficacy of the present-day speech-processing technology and the speed with which behavioral adaptation to the CI takes place after switch-on.
When considering the apparent inconsistency between MMN responses and behavioral performances, it is important to note that the MMN response constitutes a preattentive and early part of the discrimination process, whereas the behavioral discrimination accuracy constitutes the final product of said discrimination process and involves higher-order processing (Bishop & Hardiman, 2010). Moreover, the 3-AFC task involves a deliberate choice which implies that the participant may be able to detect “a change” when forced to make a decision. Thereby, the level of sensitivity reflected by these two measures may not be directly comparable.
Generally, the MMN has been associated with successful behavioral discrimination in NH listeners and some clinical populations (Näätänen et al., 2007). On a related point, Mathew et al. (2017), found correspondence between behavioral electrode discrimination and objective auditory change complex responses in recently implanted CI users. However, several papers have also reported on MMN and behavioral results that fail to correspond (Dalebout & Fox, 2000; Kurtzberg et al., 1995; Ortmann et al., 2017; Uwer & von Suchodoletz, 2000). Thus, significant MMN responses do not preclude poor behavioral performances, and likewise, nonsignificant MMN responses do not preclude good behavioral performances (Bishop & Hardiman, 2010).
The relative inconsistency between MMN and behavioral results was also reflected in the results of the CIex participants, showing MMN amplitudes that were not significantly different from those of NH, while performing significantly poorer in their behavioral discrimination of intensity and pitch. This finding was also reported in Petersen et al. (2020), which gave rise to the idea of a neural precursor to behavioral discrimination ability. However, findings from the present study do not corroborate this hypothesis. In fact, our results indicate that the ability to behaviorally discriminate between features of music is established at an earlier stage of the CI adaptation process than is the case for neural discrimination.
At a more speculative point, the apparent inconsistency between MMN and behavioral performance might also be a result of the differences in the applied measurements. A person suffering from years of hearing deprivation is trained in making sense of the small amounts of sounds that are available. This demands a huge effort and therefore may create a high degree of “sensory” alertness (e.g., facilitated by attentional gain, Scolari & Serences, 2009). Thus, when faced with the task of being forced to choose which pattern is different from the other two patterns, as required in the behavioral test, this alertness may be advantageous—even when partly guessing. These subtle cues in a degraded sound input that may be detected behaviorally are likely paralleled by relatively weak neuronal signals that are in the process of adapting to the novel sound input and thus hard to detect at the scalp level, potentially leading to the observed discrepancy. However, more studies following larger pools of recently implanted CI users longitudinally is warranted to establish a more refined understanding of the time course and the nature of the development of musical discrimination abilities after implantation.
Adapting to Spectral Complexity
CIre's development was exclusively observed in the neural discrimination of pitch and timbre features. This might imply that the auditory training associated with the adaptation process is exhibited most strongly in the discrimination of spectrally complex characteristics of music. For pitch, the reason could lie in the nature of the paradigm. The MMN indexes an error in the predictive coding of the environment, for example, when a deviation occurs in a regular pattern of standard stimuli (Näätänen et al., 2001). Thus, according to the predictive coding theory (Friston, 2005; Vuust & Witek, 2014; Vuust et al., 2022), if one cannot neurally generate the predictive model, one is unable to neurally detect the deviations from that model. The Alberti bass pattern is based on alternating pitches. Because the sound from the implant has a degraded representation of temporal fine-structure information, the brain may at first be unable to distinguish the spectral signals embedded in the pattern. However, after a short period of acclimatization, the auditory system may have grown so accustomed to the sound from the CI that the changes in pitch are more easily detected. Therefore, the results may be a testimony to the fact that the CIre group is becoming increasingly able to neurally discriminate the pattern and therefore also the deviations (Quiroga-Martinez et al., 2019).
Unexpectedly, T2 MMN responses were significant for the S, M, and L but not for the XL 8- semitone-change. A similar phenomenon was observed in our previous study, in which the experienced CI users showed a large variance in their behavioral identification of the XL deviant, exhibiting floor as well as ceiling effects (Petersen et al., 2020). One explanation for this apparent inconsistency could be a poor representation of the low frequency of the deviant note. In the key of C, the XL deviant is a sounding Ab which corresponds to an F0 of 208 Hz. Apart from the single participant who used a device from Advanced Bionics, which has a low-frequency cut-off at 250 Hz, this tone is not outside of the frequency range of the devices used by the CIre participants. Both the Oticon Medical and the Cochlear devices transmit as low as 188 Hz. Nonetheless, since the tone consists of a range of frequencies, some of which may range lower than the cut-off, this low-frequency energy may not be represented properly. This could lead to the loss of cues that may be important for perception. Also, the standard discrimination tests rarely measure below 250 Hz, indicating that stimulation below this threshold is not commonly adjusted, leading to uncertainty in how well these low frequencies are represented. Taken together, the potential variance in low-frequency representation, as well as the general sensitivity of the MMN response, may have caused the unexpected null result.
Timbre deviants typically show robust MMN responses in experienced CI users (Hahne et al., 2016; Petersen et al., 2015; Timm et al., 2014), indicating that detection of changes in spectral energy is possible with a CI. Hence, the strong progress observed in the recently implanted CI users’ automatic detection of the timbre deviants could be due to a gradual acclimatization to the richer representation of higher frequencies in the activation of electrodes coupled with a gradual normalization of the presumed “frequency mismatch.” The latter phenomenon is caused by the discrepancy between the stimulated frequencies and the location in the cochlea, for example, low frequencies stimulating neurons that were naturally more responsive to higher frequencies before cochlear implantation (Glennon et al., 2020).
Intensity
Contrary to our hypotheses, no significant development was seen in the CIre group's discrimination of the intensity feature. The simple explanation for this may be that they are unable to detect the changes, as indicated by nonsignificant MMNs as well as near chance level behavioral performances (33.3%) at both T1 and T2 (Figure 6). We speculate that heavy automatic gain control at this early stage levels out these changes and thereby impedes possible distinction.
That being said, it is also important to note that across groups, both behavioral and neurophysiological measures indicate that the intensity deviants were more difficult to discriminate as compared to the other deviants. Inspection of the MMN waveforms (Figure 4) reveals that the peak for NH participants is less prominent in the intensity deviant compared to the other deviants. Additionally, the behavioral data show that the mean NH performance score across levels is only around 60% and at near chance level performance for CIre (Figure 6). Increasing the magnitudes of the levels of the intensity feature in a revision of the paradigm may deem more useful, especially when it comes to tracking the early adaptation process following cochlear implantation.
Rhythm
As predicted, we found no development in the discrimination of the rhythm feature. There seems, however, to be some incongruence between the neurophysiological and behavioral results. While CIre performed on par with both CIex and NH in the behavioral discrimination task, their MMN responses were weak in amplitude at both T1 and T2. However, looking at the topographies (Figure 3), the averaged MMN amplitudes for the rhythm deviant are also weaker for the CIex and NH groups in comparison to the other three deviants. This may be explained by the wide window of 100–250 ms used for the detection of negative peaks, adding some noise to the signal, as compared to using a narrower time window. However, because the main focus of the study was on the potential progress between T1 and T2 in the recently implanted CI users, this wide window was necessary in order to capture the peaks from all groups, acknowledging that this might be suboptimal for NH and CIex.
On a more general note, as also discussed in the work of Petersen et al. (2020), the rhythm deviant differs as it contains two deviants in one (i.e., shortening the second note and presenting the third note earlier than expected). Consequently, the P50 response occurs closer to the onset of the third note, contaminating the baseline correction (see Petersen et al., 2020 for a more elaborated discussion). Taking these different shortcomings of the MMN paradigm with regard to the rhythm deviant into account, we might consider testing alternative electrophysiological measures of rhythm perception. In that respect, the frequency tagging approach may provide interesting information (Nozaradan, 2014). To the best of our knowledge, this approach has not yet been applied to CI users.
Latency
We found no significant change over time in the latencies of the MMN responses. Since latency measures for nonsignificant MMNs should be interpreted with caution, we focus on the results pertaining to those deviant features that elicited significant MMNs for CIre at T2. CIre showed significantly longer latencies in MMN responses to timbre compared to CIex and to both pitch and timbre compared to NH. Longer latencies have been coupled to weaker and less precise neural responses (Kujala & Näätänen, 2010), which again supports the notion of a reorganization process in CIre extending beyond the initial phase.
Limitations
Group Size
This study included a relatively small cohort of CI users, which was mainly caused by the difficulty associated with recruitment within a patient population limited in numbers. Moreover, the duration of the experiment (+2 h) may have deterred some from signing up. Finally, CIre participants were required to come in for two rounds of testing, the first being very shortly after switch-on, which for some patients may have been too overwhelming. A larger cohort of CI users would have increased the statistical power and thereby the robustness of our findings.
Maps
Another important consideration is that the programming of the CI users’ speech processor settings is configured at an individual level, making it difficult to account for. Typically, in the period following the initial processor set-up, the patient will have the option to select between programs with increasing levels of loudness, as the patient is accommodating to the novel sound sensations. This, of course, might again influence perception. However, basic psychophysics such as spectral and temporal resolution are relatively stable from the day of activation to later (Drennan et al., 2016), while speech perception continues to improve, as it relies more on central processes. The primary effect it would have would be in intensity, which does not seem to have been affected in the current case. It is, however, important to note that during testing, the sound level was adjusted according to each participant's subjective liking, which again may have evened out some of the differences in loudness imposed by the programming.
To which degree this factor might influence MMN responses is unclear. Yet, Sandmann et al. (2015) found no significant correlation between stimulation levels and N1 amplitude and latency, indicating that the individual mappings did not explain their findings concerning early neural development following cochlear implantation.
Individual Variance
Both the recently implanted and the experienced CI users’ behavioral performances were characterized by a large amount of variation, spanning from 100% correct scores in some cases to near or below chance level performance in others. This high individual variation in performance is often seen in CI-research and may reflect differences in the patients’ history of hearing loss, such as duration and etiology of deafness, age at hearing loss, and residual hearing (Blamey et al., 2013).
Contralateral Hearing Aids
Eight of nine CIre participants used a hearing aid on the contralateral ear, indicating the existence of varying degrees of residual hearing. This could mean that fewer maladaptive changes have taken place prior to receiving the cochlear implant (CI), or at least these would primarily have happened in the auditory cortical area contralateral to the implant. Thus, as opposed to profoundly deaf CI recipients, the involved participants might have benefitted from a reduced requirement of reorganization after implantation.
Direct Audio Input vs. Free Field
In the current investigation, CI users were exposed to sound stimuli via a direct audio input cable rather than loudspeakers. This provides for more control over which sound sources are delivered to participants, as well as the elimination of confounding factors such as residual hearing. Some challenges, however, are associated with this method. Some of the CI users had bilateral CIs and were required to do the tests using their highest functioning ear. Both for them and the bimodal listeners, the monaural stimulation constituted a less satisfying and unfamiliar listening condition, meaning that the brain has not adapted to this specific way of listening. We can only speculate on how much this influenced their performance. We would suggest that, while there is a trade-off in directly presenting the stimuli, it offers the most appropriate base for a fair comparison and standardizes one component in a highly heterogeneous population.
Summary and Conclusion
Our findings confirm and expand the previous reporting on postlingually deafened CI-users’ music discrimination abilities, showing a marked improvement in the neural discrimination of music in the very early stages after switch-on of the implant. Furthermore, the significant differences between the experienced and the recently implanted CI users illustrate the long-term functional cortical changes taking place, following experience and everyday exposure to sounds. The findings also imply that the auditory training associated with the adaptation process is exhibited most strongly in the discrimination of spectrally complex characteristics of music. Finally, the results indicate that ability to behaviorally discriminate changes in pitch, timbre, and rhythm is notable already short after initial processor set-up.
Given the limited research including recently implanted CI users, this study is an original contribution to the area of music perception in CI users. Increasing the body of knowledge in this area is important as improving music perception for CI users can have implications for their quality of life. With the early development of discrimination abilities in CI users measured both behaviorally and using EEG, the study provides insights into just how early the cortical changes occur, which may be of clinical and therapeutic relevance.
Supplemental Material
sj-pdf-1-tia-10.1177_23312165221148035 - Supplemental material for Adapting to the Sound of Music — Development of Music Discrimination Skills in Recently Implanted CI Users
Supplemental material, sj-pdf-1-tia-10.1177_23312165221148035 for Adapting to the Sound of Music — Development of Music Discrimination Skills in Recently Implanted CI Users by Alberte B. Seeberg, Niels T. Haumann, Andreas Højlund, Anne S. F. Andersen, Kathleen F. Faulkner, Elvira Brattico, Peter Vuust and Bjørn Petersen in Trends in Hearing
Supplemental Material
sj-pdf-2-tia-10.1177_23312165221148035 - Supplemental material for Adapting to the Sound of Music — Development of Music Discrimination Skills in Recently Implanted CI Users
Supplemental material, sj-pdf-2-tia-10.1177_23312165221148035 for Adapting to the Sound of Music — Development of Music Discrimination Skills in Recently Implanted CI Users by Alberte B. Seeberg, Niels T. Haumann, Andreas Højlund, Anne S. F. Andersen, Kathleen F. Faulkner, Elvira Brattico, Peter Vuust and Bjørn Petersen in Trends in Hearing
Footnotes
Acknowledgments
The authors wish to thank all the participants for their unrestricted commitment. They also thank Franck Michel for providing the programing of replacement sound processors, Monica Ipsen for her great effort in the recruitment of participants, organizing tests, and collection of data. Special thanks to Dora Grauballe, Center for Functionally Integrative Neuroscience, for invaluable and unconditioned help with bookings and management of laboratory facilities and to Christopher Bailey for technical assistance.
Declaration of Conflicting Interests
The author(s) declared the following potential conflicts of interest with respect to the research, authorship, and/or publication of this article: Kathleen F. Faulkner was employed by company Oticon Medical. The authors declare that this study received funding from Oticon Medical. The funder had the following involvement in the study: idea for and contribution to the design of the study.
Funding
The author(s) disclosed receipt of the following financial support for the research, authorship, and/or publication of this article: Alberte B. Seeberg's, Anne Sofie Friis Andersen's and Niels Trusbak Haumann's contributions to the project were partly funded by Oticon Medical, Denmark, and partly by the Center for Music in the Brain. The Center for Music in the Brain is funded by the Danish National Research Foundation (DNRF117).
Data Availability
Ethical Approval
The study was conducted in accordance with the Helsinki declaration, and it was approved by the Research Ethics Committee of the Central Denmark Region (#55018).
Supplemental Material
Supplemental material for this article is available online.
Notes
References
Supplementary Material
Please find the following supplemental material available below.
For Open Access articles published under a Creative Commons License, all supplemental material carries the same license as the article it is associated with.
For non-Open Access articles published, all supplemental material carries a non-exclusive license, and permission requests for re-use of supplemental material or any part of supplemental material shall be sent directly to the copyright owner as specified in the copyright notice associated with the article.