
Abstract
Sensitivity to interaural time differences (ITDs) in acoustic hearing involves comparison of interaurally frequency-matched inputs. Bilateral cochlear-implant arrays are, however, only approximately aligned in angular insertion depth and scalar location across the cochleae. Interaural place-of-stimulation mismatch therefore has the potential to impact binaural perception. ITD left-right discrimination thresholds were examined in 23 postlingually-deafened adult bilateral cochlear-implant listeners, using low-rate constant-amplitude pulse trains presented via direct stimulation to single electrodes in each ear. Angular insertion depth and scalar location measured from computed-tomography (CT) scans were used to quantify interaural mismatch, and their association with binaural performance was assessed. Number-matched electrodes displayed a median interaural insertion-depth mismatch of 18° and generally yielded best or near-best ITD discrimination thresholds. Two listeners whose discrimination thresholds did not show this pattern were confirmed via CT to have atypical array placement. Listeners with more number-matched electrode pairs located in the scala tympani displayed better thresholds than listeners with fewer such pairs. ITD tuning curves as a function of interaural electrode separation were broad; bandwidths at twice the threshold minimum averaged 10.5 electrodes (equivalent to 5.9 mm for a Cochlear-brand pre-curved array). Larger angular insertion-depth differences were associated with wider bandwidths. Wide ITD tuning curve bandwidths appear to be a product of both monopolar stimulation and angular insertion-depth mismatch. Cases of good ITD sensitivity with very wide bandwidths suggest that precise matching of insertion depth is not critical for discrimination thresholds. Further prioritizing scala tympani location at implantation should, however, benefit ITD sensitivity.
Introduction
The main goal of bilateral cochlear implantation is to provide the binaural benefits of improved sound localization and speech understanding in the presence of competing sounds. Currently, bilateral cochlear implants (BI-CIs) do not convey binaural benefits comparable to those provided by typical acoustic hearing. There are several possible contributors to diminished binaural hearing with BI-CIs, including external and internal device-related, surgical, and biological factors (Litovsky et al., 2012). The purpose of this paper is to examine how electrode location relates to variability in how interaural time differences (ITDs) are perceived by adult BI-CI listeners with post-lingual onsets of severe-to-profound hearing loss.
ITDs arise due to the physical separation of the two ears. For normal-hearing (NH) listeners, changes in ITD can produce the sensation of different sound-source locations in the horizontal plane. In conjunction with interaural level differences, ITDs play a critical role in sound localization (Mills, 1958; Strutt, 1907; Wightman & Kistler, 1992) and speech understanding under noisy listening conditions (Bronkhorst & Plomp, 1988; Glyde et al., 2013; Kidd et al., 2010; Kock, 1950). NH listeners show sensitivity to ITDs as small as 10 μs given “best case” auditory stimuli with frequency components in the range of 500−1000 Hz (Klumpp & Eady, 1956; Thavam & Dietz, 2019).
In acoustic hearing, ITD processing occurs in brainstem neurons that are precise temporal comparators and which receive inputs from matched locations along the two cochleae (Joris et al., 1998). With BI-CIs, listeners are presented with fixed-rate electrical pulses whose amplitudes vary over time according to the smoothed low-pass-filtered envelopes of the signals in the acoustic frequency bands assigned to each electrode. The physical alignment of these frequency channels across the ears is usually only an approximation (Goupell et al., 2022). Furthermore, due to the nature of the signal processing in today's CIs, fine temporal detail is generally unavailable, and BI-CI listeners appear to primarily use interaural level differences rather than ITDs for sound localization when using clinical processors (Aronoff et al., 2010; Seeber & Fastl, 2008; van Hoesel & Tyler, 2003).
Delivery of more precise and synchronized ITD information could, in theory, be prioritized and made available to CI users in their clinical processors (Churchill et al., 2014; Dennison et al., 2021), if it can be demonstrated that this population is able to use such cues. Using research processors that permit high-resolution synchronization between left and right sides with simple electrical stimuli, researchers have established that BI-CI listeners in fact have the ability to use ITD information (e.g., Laback et al., 2007; van Hoesel & Tyler, 2003) albeit with poorer sensitivity than NH listeners. One meta-analysis has reported a median ITD threshold of 144 μs for BI-CI listeners when low pulse rates of 100 pulses per second (pps), which typically yield best sensitivity, are used (Laback et al., 2015). A more recent study also measured median ITD discrimination thresholds on the order of several hundred microseconds for similar stimuli (Thakkar et al., 2020).
Although these values appear large compared to the thresholds obtained from NH listeners under ideal conditions, some of the difference can be attributed to the type of signals that CI listeners receive. NH listeners show sensitivity on the order of the best BI-CI listeners for envelope ITDs applied to high frequency carrier signals (>∼2 kHz) (Henning, 1974; Nuetzel & Hafter, 1981), which somewhat resemble the envelope-based signals coded by CIs. For acoustic pulse trains (with bandlimited clicks like Gabor pulses; Gabor, 1947) designed to mimic CI electrical pulse trains (Mayo et al., 2021), NH listeners are sensitive to ITDs on the order of 50 μs, similar to the best-performing BI-CI listeners (Baumgärtel et al., 2017; Goupell et al., 2013). The average sensitivity shown by BI-CI listeners is therefore more similar to envelope ITD sensitivity in NH listeners for stimuli that resemble electrical stimulation.
Given that some BI-CI listeners can achieve reasonably good binaural sensitivity under ideal conditions, factors beyond the inherent limitations associated with electrical stimulation must be responsible for the intersubject variability and relatively poor ITD sensitivity demonstrated by some individuals. Because the auditory brainstem appears to rely on place-matched binaural input (Blanks et al., 2007; Yin et al., 1984), ITD sensitivity could be influenced by interaural place-of-stimulation mismatch due to differences in electrode placement (i.e., insertion depth or scalar location). On the other hand, the excitation pattern associated with monopolar stimulation is relatively broad (Zhu et al., 2012), which could mitigate negative effects of mismatch. Finally, the absolute tonotopic location of the stimulation (i.e., apical versus basal) might also influence binaural sensitivity (Best et al., 2011; Laback et al., 2015).
Interaural Insertion-Depth Mismatch
Binaural processing in NH is thought to occur mostly for frequency- and place-of-stimulation-matched inputs, provided the interaural stimuli are within the response area of the neuron (Blanks et al., 2007; Yin et al., 1984). BI-CI users, however, may experience interaural mismatch in the place of stimulation (Goupell et al., 2022). For example, asymmetries may arise from differences in angular insertion depth between the arrays (i.e., distance along the cochlea). Surgeons usually attempt full insertions of arrays, but insertion depths can vary greatly across patients (Canfarotta et al., 2020; Landsberger et al., 2015), and surgeons currently lack the tools for precise interaural matching on the scale of a millimeter. Recent research has described such interaural angular insertion-depth differences as averaging approximately 20 to 40 degrees, using computed-tomography (CT) scans or x-rays to image electrode location (Bernstein et al., 2021; Goupell et al., 2022; Sokolov et al., 2020).
Interaural Scalar Location Mismatch
Variability in terms of scalar location is also possible. Although electrode placement in the scala tympani (ST) is considered standard-of-care in order to avoid membrane trauma and possible cross-turn stimulation (Finley et al., 2008; O’Connell et al., 2016), individual cases sometimes preclude this. Full or partial placement in the scala vestibuli (SV) may occur intentionally or otherwise, and while this location is less preferred, the CI is usually still beneficial (Finley et al., 2008; Stock et al., 2021). When different model types are used in the two ears, the electrode arrays may also differ in total length, inter-electrode spacing, or curvature (Goupell et al., 2022). Curvature, in particular, has been identified as associated with higher risk of scalar translocation (Jwair et al., 2021). Pre-curved arrays are nevertheless widely used in order to decrease distance to the modiolus (Jwair et al., 2021; Wanna et al., 2014).
ITD Tuning Curve Bandwidth
Current spread is an important factor that could interact with interaural mismatch in physical electrode location. Clinical CI sound processors use monopolar stimulation (i.e., the stimulating electrode is intra-cochlear, and the ground electrodes are extra-cochlear), resulting in frequency tuning with large “spatial” 1-dB bandwidths (BWs) of approximately 3 to 5 mm around a given electrode location in a single ear (Nelson et al., 2011). These large BWs for monaural listening likely contribute, in part, to the broad binaural tuning patterns observed in interaural mismatch experiments with BI-CIs (Goupell, 2015; Kan et al., 2019; Kan et al., 2015; Kan, Stoelb, et al., 2013; Long et al., 2003; Poon et al., 2009; van Hoesel, 2004).
BI-CI ITD sensitivity appears partially resistant to experimentally introduced interaural place mismatch (Hu & Dietz, 2015; Kan, Stoelb, et al., 2013; Poon et al., 2009). When mismatch has been introduced relative to an alignment associated with some best level of ITD discrimination threshold, performance remains relatively stable until the estimated mismatch exceeds 2 to 3 mm (about 4 electrodes in the case of 0.75-mm electrode spacing) (Kan, Stoelb, et al., 2013). However, these previous studies involved smaller samples than the present study, with respect to both the number of locations examined along the arrays and the number of BI-CI listeners. Furthermore, the degree of physical misalignment was only indirectly estimated, rather than measured. Apart from one case study that incorporated CT scans (Long et al., 2003) and recent work reported in Bernstein et al. (2021), characterization of the ITD discrimination threshold response function with respect to interaural mismatch in place-of-stimulation remains incomplete for BI-CI listeners.
Absolute Electrode Location
By testing electrodes pairs at several locations across each array for a large group of listeners, we expected that previous ambiguities might be resolved regarding whether ITD sensitivity varies predictably by cochlear place. Although NH listeners are most sensitive to acoustic ITDs conveyed via frequencies under 1000 Hz (Klumpp & Eady, 1956; Thavam & Dietz, 2019; Wightman & Kistler, 1992), this relationship is not observed in electrical hearing because the signal encoding is radically different. A handful of studies have instead reported poorer sensitivity in BI-CI listeners for stimulation towards the cochlear apex (Best et al., 2011; Laback et al., 2015) while other studies have shown no tonotopic dependence (Laback et al., 2015; Litovsky et al., 2010; van Hoesel, Jones, & Litovsky, 2009). Thus, the absolute tonotopic location of stimulation also warrants consideration.
Hypotheses
The purpose of this study was to examine variability in binaural sensitivity and tuning in BI-CI listeners using detailed CT-derived information regarding the relative insertion depths and scalar locations of the electrodes in the two ears. First, we hypothesized that the electrode pairs yielding maximum binaural sensitivity (i.e., the smallest ITD discrimination thresholds) would be those matched in insertion depth and located in ST, the typical intended scalar location for a CI array. Second, we hypothesized wide binaural tuning curves from monopolar stimulation, consistent with previous measurements. In addition, we predicted that tuning curves might be even broader in cases of mismatched insertion depth (possibly indicating the presence of some plasticity in the binaural system to compensate for mismatch) and in cases where electrodes in one or both ears were not located in the ST. Third, we hypothesized that ITD sensitivity and tuning might vary within-subject as a function of position along the CI array, with more basal regions showing better sensitivity.
Some aspects of the ITD sensitivity data analyzed here were previously reported in an analysis of interaural frequency mismatch and its relationship to CT data and pitch perception in BI-CI listeners and CI users with single-sided deafness (Bernstein et al., 2021). Although Bernstein et al. (2021) found a low incidence of interaural frequency mismatch large enough (greater than 75 degrees or approximately 3 mm) to negatively impact BI-CI ITD sensitivity according to previous estimates, some data suggest that smaller interaural frequency mismatches could have perceptual consequences (Fitzgerald et al., 2017; Williges et al., 2018; Xu et al., 2020). Bernstein et al. (2021) examined only the relationship between the location of the peak of the ITD tuning curve and CT-scan estimates of electrode insertion depth. The purpose of the present paper was to extend that prior analysis using a more detailed approach to understand how insertion depth and scalar location relate to absolute ITD sensitivity and ITD tuning curve BWs.
Method
Listeners
Twenty-three post-lingually deafened BI-CI users (7 male, 16 female) participated in the behavioral portion of the study. Listener age ranged from 25 to 90 years (M = 65.4 yrs; SD = 12.9 yrs). All were users of Cochlear-brand devices (Sydney, Australia). The “better” ear and “poorer” ear for each listener were determined from unilateral speech understanding scores for IEEE sentences (Rothauser et al., 1969) presented in quiet to each ear, prior to the present study. Each listener completed the MoCA, a brief screening for cognitive impairment (Nasreddine et al., 2005). The group mean score was 26.5 points. Sixteen listeners scored at or above the NH cutoff of 26. Three scores of 25 points and four scores between 21 to 23 points were obtained. All listeners were retained as participants.
Twenty listeners completed the CT-scan portion of the study. Three listeners chose not to take part in the imaging procedure (S02, S14, S15). One listener who completed CT imaging was found upon analysis to have a cochlear malformation that prevented reliable estimation of electrode location (S21). Some of the data from the remaining 19 listeners were reported previously in Bernstein et al. (2021).
Details regarding onset and etiology of severe-to-profound hearing loss are shown in Table 1 for all listeners, together with internal device characteristics. All electrode arrays contained 22 intra-cochlear electrodes and two extra-cochlear electrodes (used as grounds). By manufacturer convention, the intra-cochlear electrodes are numbered from 1 (most basal, higher frequencies) to 22 (most apical, lower frequencies). “Straight” arrays (indicated as “[S]” in Table 1) are intended to be placed near the lateral wall and use uniform spacing of ∼.75 mm or ∼.90 mm between electrodes. “Pre-curved” arrays (“[P]”) are intended to hug the modiolar axis and use non-uniform spacing between electrodes, ranging from .40-.95 mm. Taken in combination with overall array length and curvature, the radial angle assigned to each electrode, regardless of type, is about 15−20°. Most listeners used two pre-curved arrays. Four listeners used a mix of one straight array and one pre-curved array.
Listener Demographics.
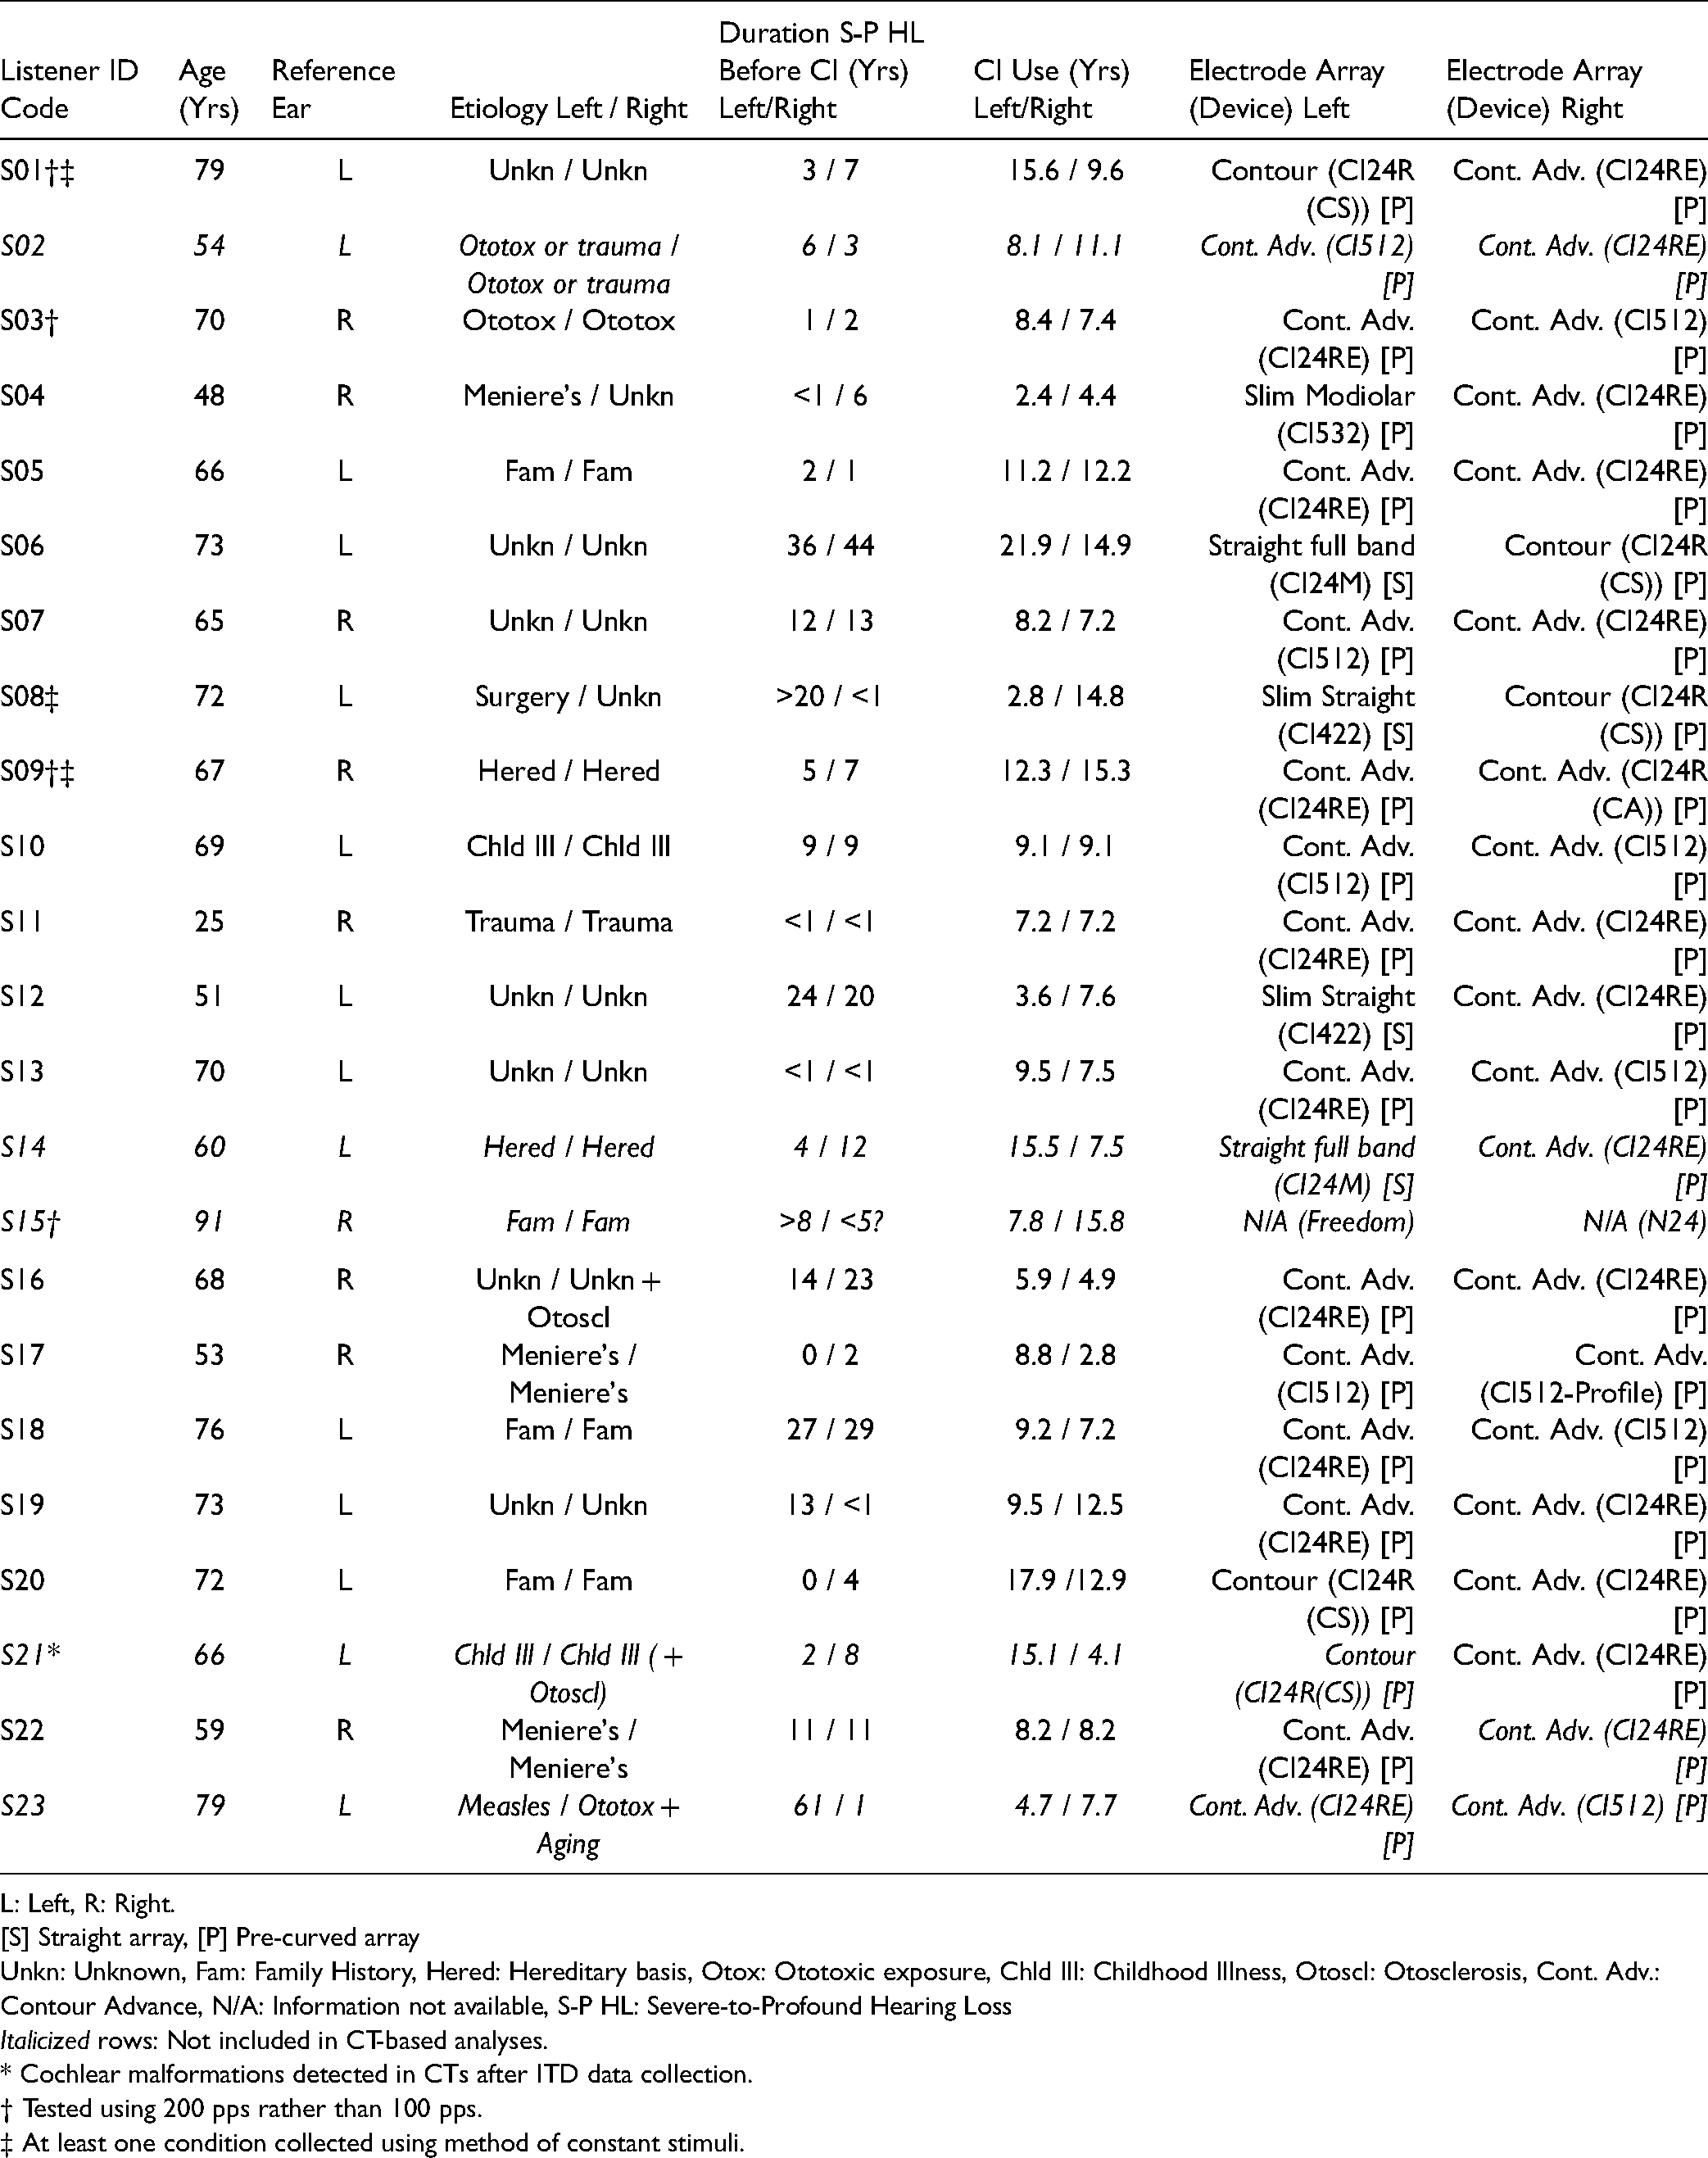
L: Left, R: Right.
[S] Straight array, [P] Pre-curved array
Unkn: Unknown, Fam: Family History, Hered: Hereditary basis, Otox: Ototoxic exposure, Chld Ill: Childhood Illness, Otoscl: Otosclerosis, Cont. Adv.: Contour Advance, N/A: Information not available, S-P HL: Severe-to-Profound Hearing Loss
Italicized rows: Not included in CT-based analyses.
* Cochlear malformations detected in CTs after ITD data collection.
† Tested using 200 pps rather than 100 pps.
‡ At least one condition collected using method of constant stimuli.
Imaging
For the 20 listeners who participated in the imaging portion of the study, CT scans were collected at Georgetown University Medical Center using a multidetector row CT scanner (SOMATOM Force, Siemens, Munich, Germany) with a temporal bone protocol that used extended Hounsfield unit (HU) scaling for increased range. Scan parameters included 0.6-mm collimation, 140-kVp tube voltage, 300-mAs tube current (without modulation), pitch of 0.6, and bone kernel for image reconstruction. Standard temporal bone images (axial and coronal) were supplemented with a 10-cm field-of-view oblique Stenver reformat parallel to the cochlear basal turn to better visualize the electrode array with ultra-high resolution (0.2 × 0.2 mm).
Scalar location (tympani/media/vestibuli) and angular insertion depth were determined for each electrode using the methods described in Noble et al. (2018) and Zhao et al. (2018). Additional details have been reported in part in Bernstein et al. (2021) and Goupell et al. (2022). As per established methods for Cochlear-brand arrays, end electrodes were identified from the scan and the positions of each electrode along the array estimated using electrode model information.
Stimuli
The stimuli for the ITD discrimination task consisted of 300-ms constant-amplitude electrical pulse trains. A pulse rate of 100 pps was used for 19 of the 23 listeners. A pulse rate of 100 pps has been reported to yield optimal ITD discrimination performance for many CI users (van Hoesel, 2007; van Hoesel et al., 2009). Four listeners were tested using a rate of 200 pps (S01, S03, S09, S15) due to facial nerve stimulation at 100 pps or because they were part of an initial protocol discontinued because it was found to be too difficult for most BI-CI listeners. The constant amplitude of each pulse train was individually specified for each listener and electrode using a loudness adjustment procedure as detailed below. Biphasic rectangular (anodic-phase leading) electrical pulses with 25-µs phase durations and an 8-µs phase gap were used, except for four listeners who used other phase durations usually due to device compliance limitations: 50 µs (S01, S15), 35 µs (S23), and 30 µs (S09). Stimuli were presented via monopolar stimulation mode (MP1 + 2).
To measure ITD sensitivity, the interaural delay of the whole waveform across the paired trains (one train in each ear) was varied adaptively as described below. These whole waveform ITDs ranged from a minimum of 0 µs to a maximum of 2500 µs (for 100 pps), or 1250 µs (for 200 pps) —in other words, no larger than a quarter of a cycle— to keep the lateralization cues unambiguous (Majdak et al., 2006).
Procedure
Equipment
All stimuli were presented via direct stimulation using a synchronized pair of L34 research processors (Laura Max 34, Cochlear Ltd., Sydney, Australia) controlled by Nucleus Implant Communicator Version 2 (NIC2) and MATLAB (Mathworks, Natick, Massachusetts) software.
Programming
Prior to the ITD sensitivity measurements, a research audiologist worked with each listener to determine appropriate stimulus levels to be used during testing. Programming generally followed direct-stimulation best practices (Litovsky et al., 2017). Most-comfortable “C” levels were determined for each even numbered electrode in the better ear (2, 4, 6, 8, 10, 12, 14, 16, 18, 20, and 22), and for five reference electrodes in the poorer ear (4, 8, 12, 16, and 20, for most listeners). Levels were loudness-balanced for each ear. The levels for each side were then used together to check whether stimuli played simultaneously to the five number-matched electrode pairs (4-4, 8-8, 12-12, 16-16, and 20-20) were perceived as “centered” within the listener's head. If centered images were not perceived, the levels in the poorer (reference) ear were adjusted to center the image. Variations on this overall procedure have been used with BI-CI users in numerous studies (e.g., Kan, Stoelb, et al., 2013; Thakkar et al., 2020; van Hoesel & Clark, 1997).
Task
In this two-alternative forced-choice task, each experimental trial consisted of two intervals with ITDs of equal magnitude but opposite directions. The listener indicated whether the second stimulus was heard to the right or to the left of the first stimulus (Kan et al., 2015). For example, if the first interval conveyed a 50-µs ITD with the left channel leading in time, the second interval conveyed a 50-µs ITD with the right channel leading. A correct response for this trial would then suggest that the listener can discriminate a 100-µs ITD change between the two intervals (Nuetzel & Hafter, 1981; Thavam & Dietz, 2019). The reported left/right ITD discrimination thresholds reflect this doubled value.
Each interval was 300 ms in duration with an inter-stimulus interval of 300 ms. On each trial, a response to the question “Did the sound move to the left or to the right?” was obtained via a mouse click of one of two on-screen response buttons. Correct answer feedback was provided visually after each trial. The task was self-paced, with the listener pressing a virtual button following feedback to initiate another trial.
Data Acquisition
Data collection initially began using a method of constant stimuli. However, this proved to be overly time-consuming for listeners, and an adaptive testing method was developed. The adaptive method employed the 3-down-1-up staircase procedure described in detail in Zwislocki and Relkin (2001) to find the discrimination threshold, defined as the ITD for which 75% accuracy was reached; in other words, halfway between a chance score of 50% and a perfect score of 100%. Each tracked run started with ITDs of + 2500 µs and − 2500 µs, testing a left/right ITD change of 5000 µs. Three correct responses (not necessarily consecutive) led to a smaller ITD on the next trial (Zwislocki & Relkin, 2001). Any error led to a larger ITD on the next trial. During each adaptively adjusted tracked run, the tested value was adjusted by a factor of 2 until the second reversal, 1.414 until the fourth reversal, and 1.2 thereafter, and rounded to the nearest 20 µs after each adjustment. In the relatively infrequent case where the tested left/right ITD change was smaller than 100 µs, the adjustment step size was fixed at 20 µs due to resolution limitations of the research processors. The adaptive run continued until there were ten reversals in the staircase procedure. Because of the ratio step sizes in the adaptive procedure and the known logarithmic relationship between sensitivity and ITD, the geometric mean of the last six reversals was used to determine the ITD discrimination threshold for that run. (Runs were also halted after hitting a maximum of 100 trials, or if four errors at the maximum value tested were observed. In the latter case, the ITD discrimination threshold was set to the highest value allowed in the run, one-quarter period.)
For each pairing of electrodes, we aimed to collect at least three adaptive runs. More than three runs were collected if the standard deviation for the collected runs was greater than 25% of the geometric mean threshold, up to a maximum of five runs. The primary dependent measure was the geometric mean threshold over all runs collected for a given electrode pair. Across all listeners, 89% of electrode pairs had three or more runs. Fewer than three runs were collected due to time constraints for 11% of electrode pairs (five runs = 44%, four runs = 7%, three runs = 38%, two runs = 6%, one run = 5%).
As mentioned above, our analyses also included a small amount of data (approximately 5% of the total) collected using the method of constant stimuli (listeners S01, S08, S09). Data using this method were gathered using fixed ITD changes ranging from 20 to 4000 µs and a function-fitting algorithm (“Psignifit”: Wichmann & Hill, 2001) was used to find the ITD change associated with a 75% correct response rate. Approximately 36 to 50 trials at each ITD step size were collected for each electrode pair.
For both methods, trials involving a given reference electrode were collected in a block. The order of these blocks was randomized. Within each block for a given reference electrode, the choice of paired comparison electrode was randomized for comparisons up to − 8 and + 8 electrodes distant from the reference (or until the array end was reached). In some cases, additional comparison electrodes were added if it became apparent that performance remained too high even for the most distant comparison electrodes, prohibiting an assessment of binaural tuning BW. Runs using these more difficult pairings were added systematically until performance degraded to chance performance, or until the edge of the electrode array was reached.
Fifteen listeners completed the task for all five reference electrodes (4 “basal” / 8 “mid-basal” / 12 “middle” / 16 “mid-apical” / 20 “apical”). Due to time constraints, three listeners completed only four reference electrodes, four listeners completed three, and one listener was tested with just two reference electrodes (101 datasets total). In some cases, alternate reference or comparison electrodes were tested because of deactivated electrodes in the listener's clinical map (S05: reference electrode 21 instead of 20; S21: reference electrode 11 instead of 12; S20: reference electrodes: 3, 7, 11, 15, 19, and odd-numbered comparison electrodes; S22: comparison electrode 4 omitted in some conditions).
Data were collected over the course of several visits to the research laboratory, in approximately five separate sessions totaling approximately 20 h with numerous breaks. Practice trials at the beginning of each visit consisted of easier number-matched electrode pairs. All procedures were reviewed and approved by the University of Maryland Division of Research Institutional Review Board (project number: 853083). Informed consent was obtained in writing from all listeners.
Statistical Software
Statistical analyses were carried out using a combination of SPSS 24 (IBM, 2016) and R-Studio 1.3 (RStudio Team, 2020). R 4.0.2 (R Core Team, 2020) was used with “lme4” (Bates, Mächler, Bolker, & Walker, 2015) and “MuMIn” (Barton, 2020) packages.
Results
Summary of CT Information
Upon CT examination, one listener (S21) was found to have cochlear malformations such that the automated electrode visualization algorithms, which require normal cochlear anatomy (Chakravorti et al., 2019), could not be used. This listener was excluded from any analyses involving CT-based measures. The remaining CT data reported here are a small subset (N = 19) of a much larger set of measurements reported in Goupell et al. (2022), but that study examined only CT-scan analyses and not perceptual data. The current group of 19 listeners are also the same listeners as in Bernstein et al. (2021) which compared CT and perceptual data, but that study examined only insertion depth and not scalar location or tuning curve BWs.
Angular Insertion Depth Summary.

Note: Data from 19 listeners, 38 arrays. Tip foldover locations 19-22 for listener S10 (left side) were omitted from calculations; no ITD data were collected using these locations for this listener.
The median interaural difference in angular insertion depth for number-matched electrodes was about 18° (Table 2). Insertion-depth differences tended to be somewhat larger for the three most-apical electrodes 20 through 22. From these analyses, listener S23 emerged as an outlier, with the deepest electrode 22 insertion of the group in the better-performing ear (array spanning 150° to 579°), the shallowest electrode 1 insertion of the group in the poorer-performing ear (array spanning 4° to 298°), and consequently, the largest angular differences (z-score for electrode 22 = 3.4, for electrode 1 = 3.7).
Considering all 22 number-matched pairs for the other 18 listeners, 33.6% of pairs displayed >25° of mismatch, 7.1% displayed >50° of mismatch, and 1.8% displayed >75° of mismatch. Considering all 19 listeners with CT measurements, the average unsigned difference across all number-matched electrode pairs was >25° for 6/19 listeners, >50° for 2/19 listeners, and >75° for 1/19 listeners (S23). For listener S23, all number-matched pairs showed at least 143° of mismatch and the three most-apical number-matched pairs had >270° of mismatch. This case was identified as generally non-standard (Goupell et al., 2022; Landsberger et al., 2015). The remaining BI-CI listeners were judged to have generally standard insertion depths.
Across all 418 number-matched electrode pairs, in only 47.6% of cases were both electrodes located in the ST, the location associated with maximal CI benefit (see also Goupell et al., 2022). Pairs with at least one non-ST electrode were common (52.4% of pairs), and there was considerable variability in the distribution of non-ST-ST pairs: SV-SV = 11%, SM-SM = 1%, ST-SV = 29%, ST-SM = 9%, SV-SM = 2%. Some of these sub-categories had relatively few occurrences. The structures separating the three scalae were not visualized by the CT and due to the relatively small size of SM, the specific type of trauma associated with a given SM designation could not be determined. For these reasons, all pairs with at least one non-ST electrode were grouped together as “non-ST-ST” for further statistical analyses.
ITD Tuning Curves
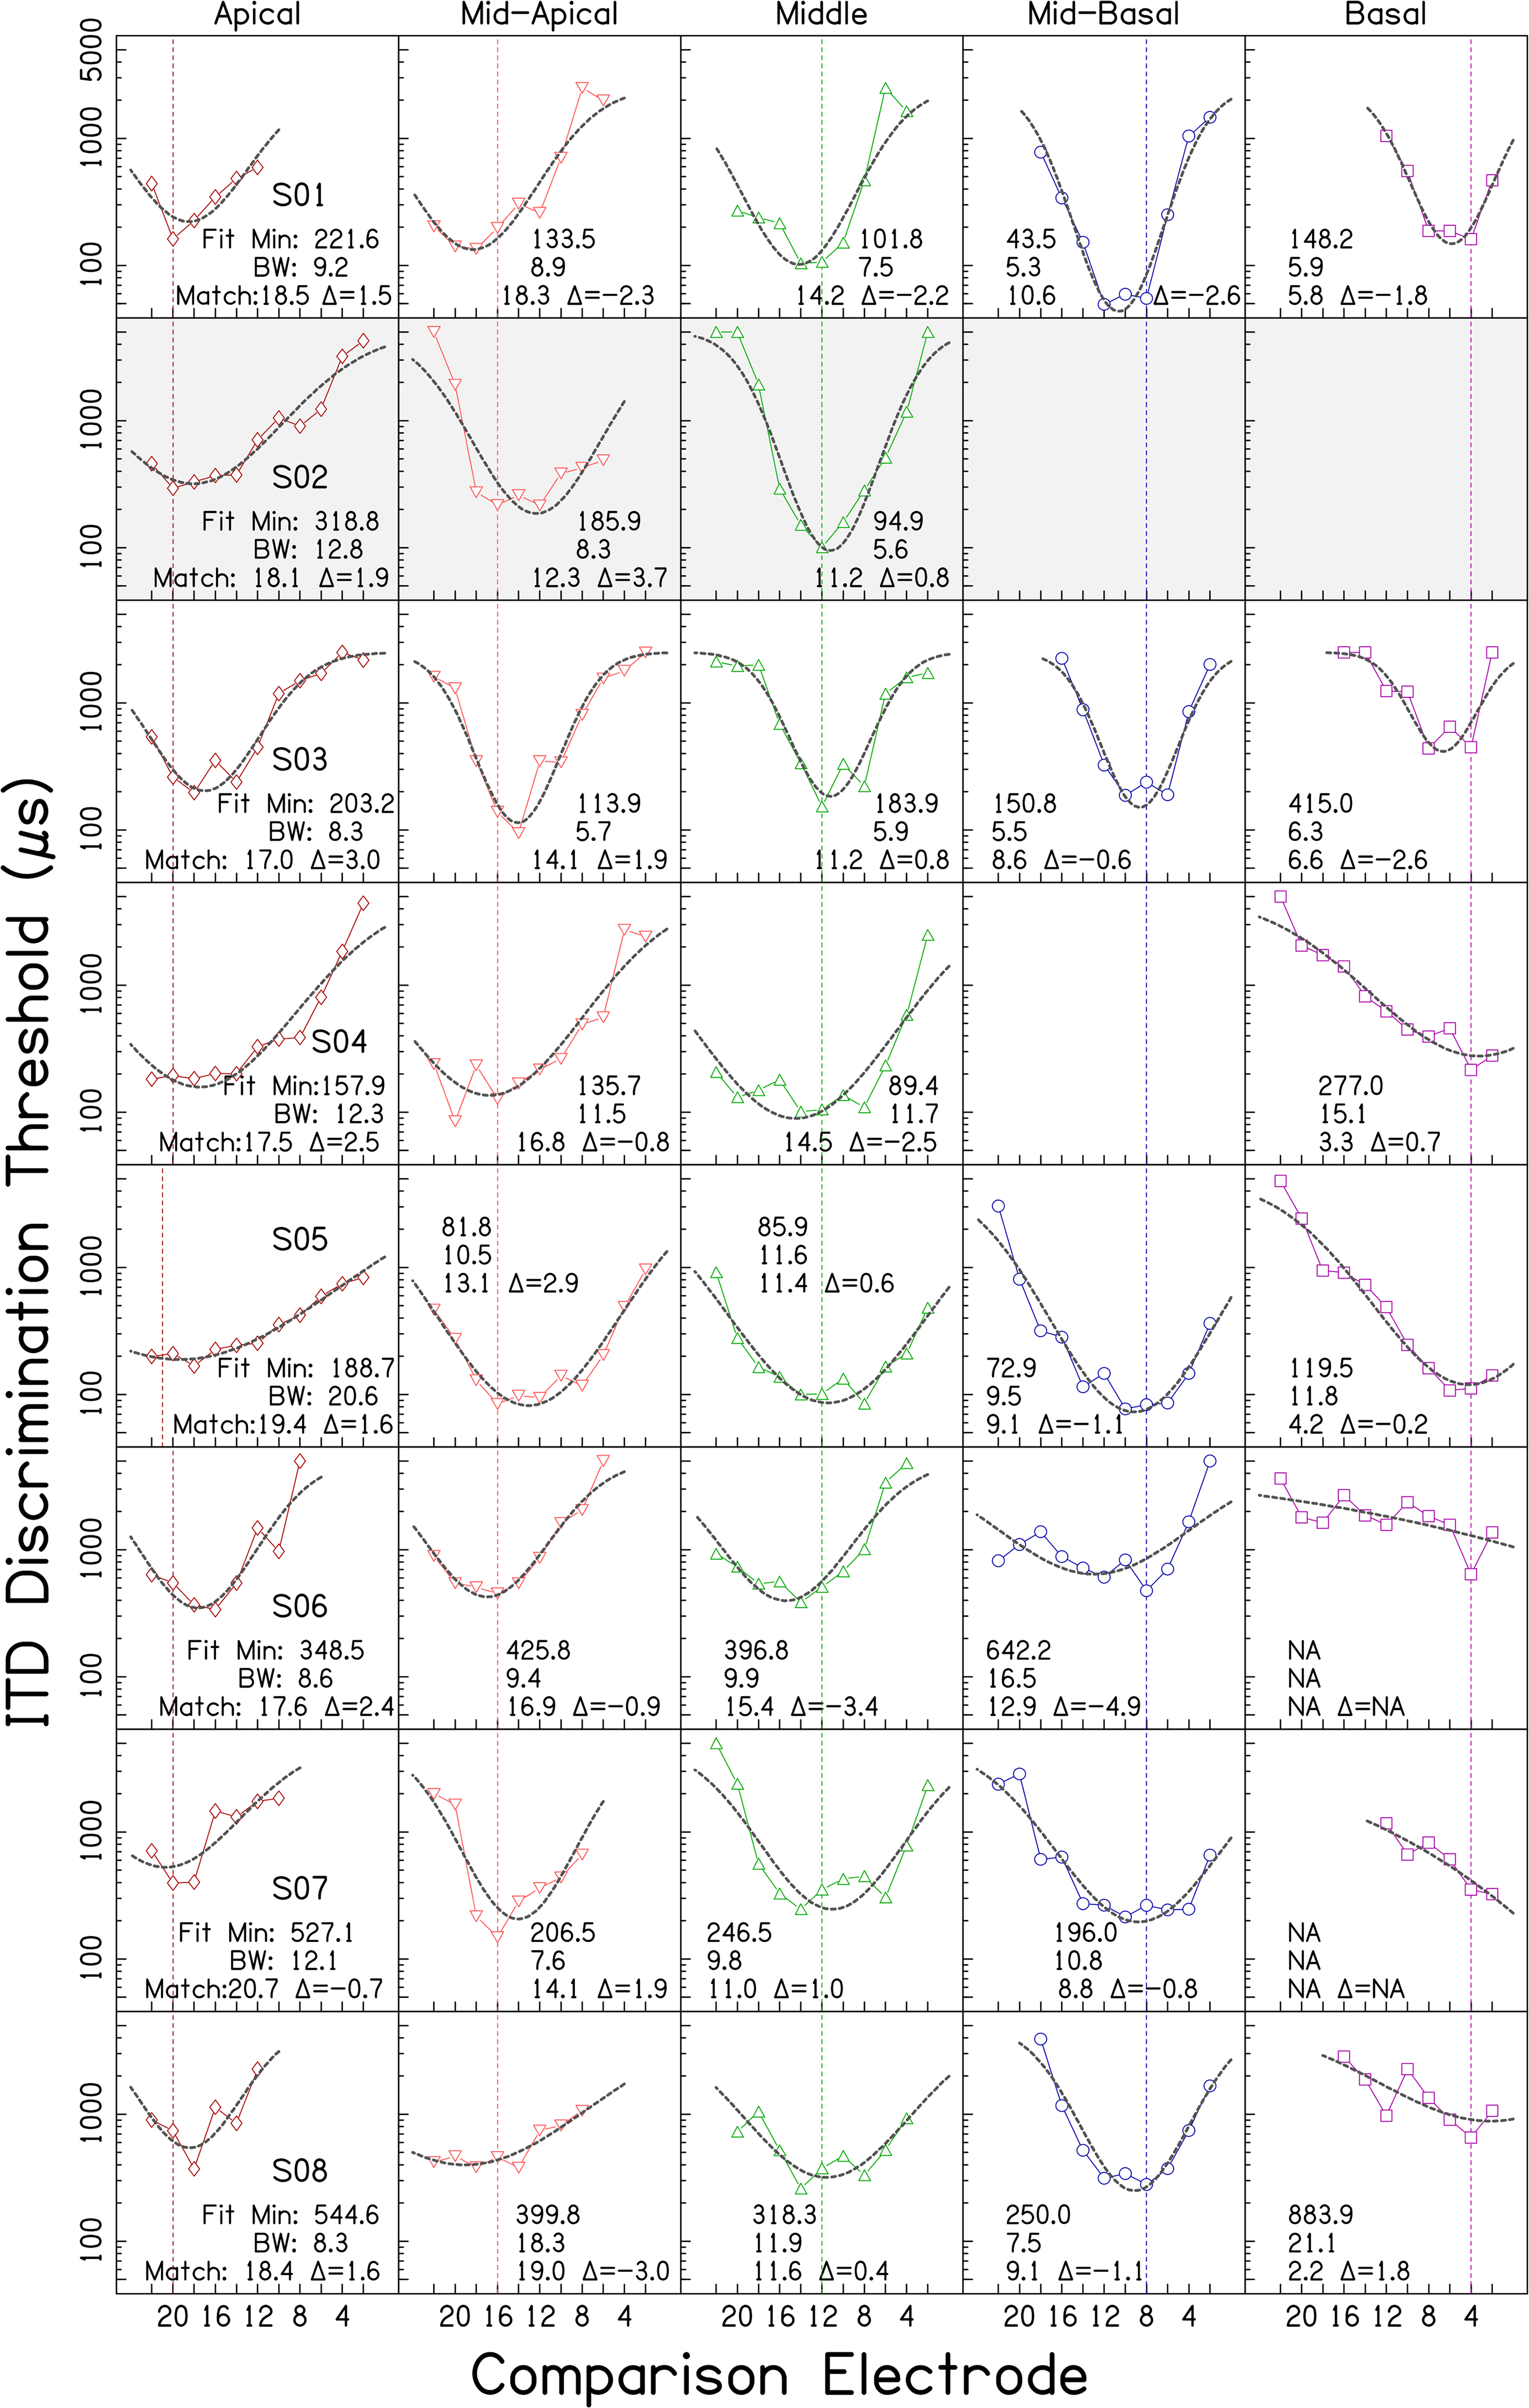
Individual ITD tuning curves. Each row shows data from an individual listener. Columns correspond to the five reference electrode locations. ITD discrimination threshold (µs) is plotted in each panel as a function of comparison electrode number. Lower frequency (more apical) electrodes are plotted to the left of higher frequency (more basal) electrodes. Vertical lines mark the location of each reference electrode. Dashed curves indicate fitted skewed-Gaussian functions. Values in each panel indicate: the fitted minimum ITD discrimination threshold in µs (Fit Min), the estimated bandwidth in electrodes at twice the minimum discrimination threshold (BW), the comparison electrode number associated with the fitted minimum (Match), and the difference between the reference electrode and the comparison electrode associated with the fitted minimum (Δ). * indicates that although BW was calculable by the rule employed, the value was an extreme outlier and deemed a poor summary statistic. Cases fit with a function with a minimum falling outside the comparison electrode array are identified by NA. Empty panels indicate reference electrodes for which data were not collected due to time constraints. Shaded panels indicate lack of a CT report (3 cases) or outlier CT results (2 cases, see text).

(Continued)

(Continued)
Figure 1 shows wide variability in performance and tuning. Some BI-CI users could discriminate ITDs smaller than 100 µs (e.g., S01), whereas others could only discriminate ITDs larger than 1000 µs (e.g., S19). Some listeners displayed good sensitivity for some reference electrodes and poor sensitivity for others (e.g., S20).
Many of the response functions were approximately U- or V-shaped. The geometric mean of the minimum discrimination threshold averaged across all listeners and reference electrodes was 439 µs (geometric SD factor = 2.56). For 32/101 functions, their minimum value occurred at the number-matched electrode location, indicative of well-matched binaural place-of-stimulation inputs and consistent with the small median interaural insertion-depth difference of 18° present in the sample. An additional 43/101 functions had a minimum within ± 2 electrodes of the reference. The remaining 26 functions displayed a minimum more than ± 2 electrodes away from the reference. Two listeners who generated minimums at separations of more than 2 electrodes in 4 out of 5 reference electrode conditions, S21 and S23, were identified from the CT analyses as special cases (see above: S21: malformation, S23: atypical angular insertion-depth mismatch). A third listener, S22, also did not show minima at number-matched locations, but this listener had a typical CT report. For each of these three listeners, their function minima fell at about the same comparison electrode location, regardless of reference electrode place.

ITD tuning curves, shown in black, averaged across listeners, as a function of comparison electrode number up to ± 8 electrodes from the reference electrode. Each line in color corresponds to an individual listener. Vertical lines mark reference electrode location. The black dashed horizontal line shows the group geometric mean for the reference electrode with the best average discrimination threshold (Mid-Basal), for comparison purposes. Response curves for S20 (who used a different set of reference and comparison electrodes) were shifted to the left by one electrode before inclusion in the average in order to align them with the remaining data. The small subset of data that needed to be omitted from this figure are described in the main text.
A linear mixed-effects model (LMEM) analysis showed that the addition of reference electrode place information significantly improved the prediction of ITD discrimination threshold for number-matched electrodes, as compared to prediction from subject alone (treated as a random effect, only intercept permitted to vary), χ2 = 9.86, df = 4, p = .04. Subject accounted for 68.6% of variability, and the categorical fixed effect of place accounted for an additional 3.9%; this highlights that the effect of place was relatively small. Examination of coefficients with an apical reference level revealed that mid-basal pairs were associated with smaller ITD discrimination thresholds than apical pairs, t(63.75) = −3.181, p < .01; difference in geometric means = 361 µs. Reanalysis with mid-basal as the reference level showed marginal differences between mid-basal and mid-apical (p = .04, difference = 151 µs) and mid-basal and middle (p = .04, difference = 155 µs). In summary, there was a small but significant effect of place on ITD discrimination thresholds for number-matched electrodes, the largest difference being apical worse than mid-basal.

Illustration of bandwidth (BW) and ITD-based mismatch metric Δ as calculated from a sample ITD tuning curve (listener S07, reference electrode 8). ITD discrimination threshold (µs) is plotted as a function of comparison electrode number. The blue dashed vertical line marks the location of the reference electrode. The dashed curve indicates the fitted skewed-Gaussian function. The gray long-dashed vertical line shows the fitted minimum value and its corresponding position along the comparison electrode array (ITD-Matched Electrode Position). The gray dashed horizontal line indicates the BW as measured across the fitted curve at twice the fitted minimum threshold. The difference between the reference electrode and the comparison electrode associated with the fitted minimum is the ITD-based mismatch, Δ. Crosses show the ITD thresholds for individual adaptive runs (3 to 5 runs per electrode pair). Circles indicate the geometric mean across runs. The minimum from the raw data is shown by the filled circle (comparison electrode 10), which in this case was slightly shifted from the fitted curve minimum (comparison electrode 8.8).
Note that while a minimum ITD discrimination threshold was produced by the fitting process, most of the analyses described below did not use this statistic. Instead, absolute sensitivity was defined in terms of the raw ITD discrimination threshold measured for number-matched electrode pairs. The reason for this was to include any possible influence of array-placement-related mismatch, as defined at number-matched electrodes, on ITD discrimination thresholds at each reference location.
Ninety-four of the 101 datasets shown in Figure 1 could be fit with a skewed-Gaussian function with an upward concavity and a minimum located on the array. The remaining 7 cases showed no relative fitted minimum between electrodes 1 and 22 (e.g., S07 basal reference in Figure 1). The fitted curves are shown by the black dashed lines in Figures 1 and 3. The geometric mean of the fitted ITD discrimination threshold minima was 456.3 µs (geometric SD factor = 2.54), slightly larger than the minimum of 439 µs obtained across all listeners from the raw data, and somewhat smaller than the value of 512.7 µs for exactly-number-matched electrode pairs in the 81 fitted datasets from listeners with standard CTs available. However, for most listeners, in most conditions, the difference between actual and predicted best electrode pairing (Δ in Figure 1), was relatively small, about 1 to 3 electrodes, on average (see Bernstein et al., 2021). The exceptions to this general finding were listeners S21, S22, and S23, cases that have already been highlighted and described above.
For visual presentation purposes, the individual listeners in Figure 1 are ordered along a dimension defined by multiplying their average absolute ITD-based-mismatch estimate, Δ, by the z-score of their average fitted ITD discrimination threshold (collapsed across reference-electrode location). Listeners towards the top of Figure 1 displayed less ITD-based mismatch and better discrimination thresholds while those in subsequent rows showed more mismatch and poorer discrimination thresholds. This visualization highlights a range of performance, from good sensitivity at number-matched electrode locations, to low sensitivity that was indifferent to reference electrode. Note, however, that sensitivity and ITD-based-mismatch were relatively independent; averaged across reference electrode, the fitted ITD discrimination threshold minimum was not significantly correlated with the ITD-based measure of mismatch Δ, r = + .34, n = 23, p = .12. This was also the case when rank-order correlations were applied, r = .00, p = .99, and when only listeners with standard insertions were included r = + .05, n = 18, p = .85.
Mean BWs for each reference-electrode location are shown in Table 3. The upper row displays mean BWs averaged across all listeners. Means for the listener subgroup (N = 8) that completed the ITD discrimination task for all five reference electrodes and had CT-verified standard insertions appear in the lower row. Average BWs were approximately 10.5 electrodes. A LMEM analysis of the 73 BWs for those listeners having CT data and standard insertions, indicated that adding reference electrode location as a fixed effect did not account for a significantly larger proportion of the variability in log BW, than a model using subject alone as a random effect, χ2 = 7.51, df = 4, p = .11.
Mean ITD Tuning Curve Bandwidth in Electrodes, Estimated 95% Confidence Interval, and Approximate Array-Based Distance Equivalents in mm.

*Array details not available for S15. Overall N for array-based mm measure = 87.
To characterize the tuning curves relative to cochlear length, BWs in electrodes were converted into physical distances based on inter-electrode spacing data provided by the manufacturer. All listeners with verifiable model information used pre-curved arrays in the comparison ear (1 Slim Modiolar, 21 Contour Advance or Contour). Distances for the Slim Modiolar array were estimated using a uniform 0.6-mm inter-electrode distance. The Contour Advance and Contour both vary the distance between electrodes depending on location with wider spacing toward the base. For BW edges falling beyond electrodes 1 or 22, the edge-most electrode distance was used. Viewed this way (Table 3, third row in each cell), BWs were quite uniform across all locations, averaging about 6 mm. We also characterized physical BW in terms of the comparison-electrode insertion angle (in degrees) derived from CT-scan data for those listeners for whom data was available [n = 19; see Bernstein et al. (2021)]. By this measure, the average BW across listeners and reference electrodes was 159.2°.
BW and sensitivity (ITD discrimination-threshold minimum) were not strongly associated. There were listeners with good sensitivity and very wide BWs (S04) and listeners with poor sensitivity and narrow BWs (e.g., S09). Contrasting cases of good sensitivity with narrow BWs (S01, S03) and poor sensitivity with wide BWs were also observed. The overall simple Spearman rank-order correlation between fitted ITD discrimination threshold and BW in electrodes was rs = + .28, p = .20 across the 23 listeners, collapsed over reference electrode place.
In summary, ITD tuning curve BW was not found to be significantly dependent on reference-electrode place or on ITD discrimination threshold minimum.
Relationship Between CT Mismatch Measures and ITD Performance
The following sections describe the relationships between CT-scan-based measures of electrode position (insertion depth and scalar location) and the two primary ITD performance parameters (ITD discrimination thresholds for number-matched pairs and tuning curve BW). The CT analyses from the two listeners with non-standard insertions were excluded from the analysis, leaving a total N = 18. ITD discrimination thresholds (expressed in microseconds) and BWs (expressed in electrodes) were log-transformed for all analyses to normalize their skewed distributions. For better visualization, angular insertion-depth difference was subjected to a square-root transform.
Interaural Insertion-Depth Differences
ITD Discrimination Threshold
Our first analysis tested the hypothesis that number-matched electrodes with larger insertion-depth differences might be associated with poorer ITD discrimination thresholds. A LMEM analysis was conducted with log ITD discrimination threshold as the dependent variable, subject as a random effect with only intercept permitted to vary, and reference-electrode location (categorical) and the square root of angular insertion-depth difference (continuous) as fixed effect predictors. Angular insertion-depth difference did
ITD Bandwidth
We hypothesized that pairs of number-matched electrodes with larger insertion-depth differences might be associated with larger BWs. As shown in Figure 4, the observed data were consistent with this prediction. BWs were wider when larger angular differences existed between number-matched electrodes.

Bandwidth in electrodes, as a function of angular insertion-depth difference between number-matched electrodes, at five locations along the cochlea. Each dot within a panel represents one BI-CI listener (N = 18, total points = 73). Fitted lines reflect the coefficients shown in Table 4. (x-axis: square root scale, y-axis: log scale).
LMEM of Log ITD Bandwidth as a Function of Angular Insertion-Depth Difference (AID Δ), Reference Electrode Location, and Subject. Bolded Rows Indicate Statistically Significant Fixed Terms (α = .05).
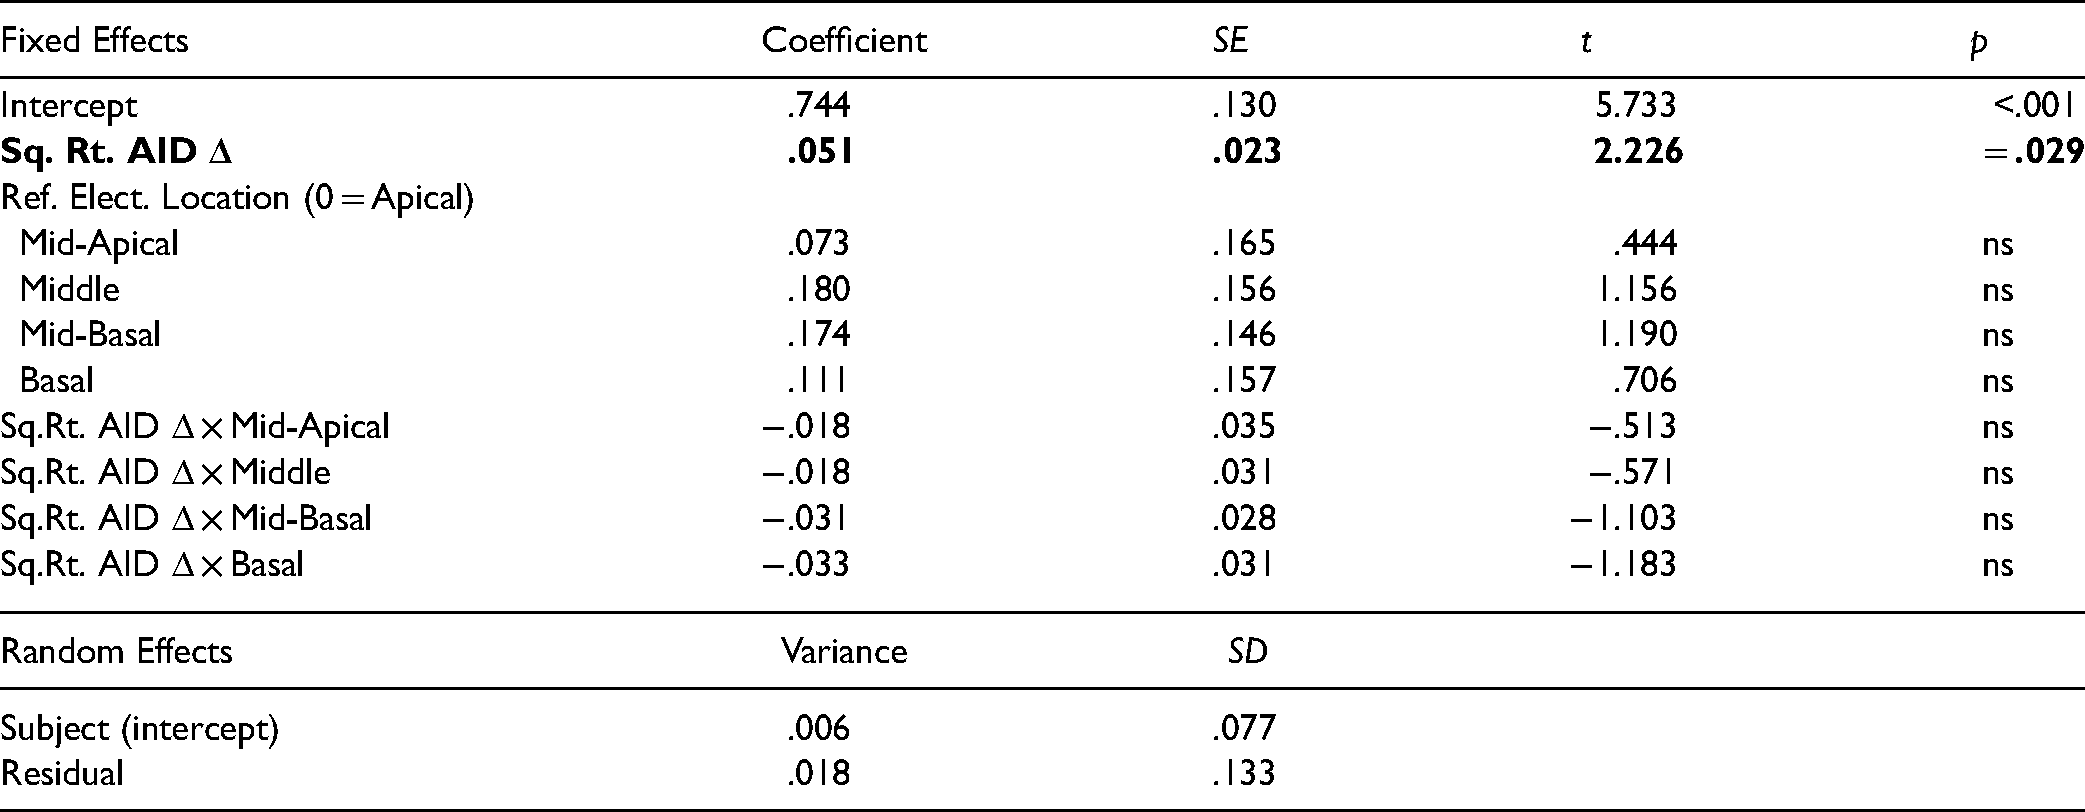
A LMEM was used to model log BW from the random effect of subject (varying intercept only), the categorical fixed effect of reference-electrode location, and the continuous fixed effect of the square root of angular insertion-depth difference. (Reference-electrode location was retained as a predictor to examine possible interactive effects with angular-insertion depth difference.) Insertion-depth mismatch and reference-electrode location together accounted for an additional 18.5% of variability in log BW beyond that linked to subject variance alone (20.5%, total = 39.0%). Larger angular insertion differences for number-matched electrodes were associated with wider BWs. The coefficient associated with angular insertion depth difference reflected a positive slope significantly different from zero, t(65.4) = 2.23, p = .029. For every 1 unit of square root angular insertion difference, BWs increased by 0.051 log electrode BW units (see Table 4). Converting back to linear units, this corresponds to an estimated BW of 5.5 electrodes at an angular difference of 0° (across all locations), 8.9 electrodes at an angular difference of 16°, 11.2 electrodes at an angular difference of 36°, and 14.2 electrodes at an angular difference of 64° (Figure 4). No statistically significant effect of reference-electrode location or significant interactions were found. Although ITD discrimination threshold could account for an additional 5% of variance in BW if it was treated as an additional fixed-effects predictor, its addition did not erase the observed relationship between angular insertion depth difference and BW, or alter the non-effect of reference-electrode location (statistical results not shown). In summary, ITD BWs were significantly related to interaural insertion-depth differences.
Scalar Location
ITD Discrimination Threshold
We hypothesized that ST-ST pairings would generate smaller ITD-discrimination thresholds than other types of pairs. A LMEM analysis of log ITD discrimination thresholds was conducted with pair type (ST-ST vs. non-ST-ST) and reference-electrode place as categorical fixed effects, and subject as a random effect (varying intercept only). Inclusion of ST-ST vs. non-ST-ST pair type just failed to significantly improve the model fit compared to using subject and location alone, χ2 = 10.14, df = 5, p = .07. Observed differences were, however, in the predicted direction with a trend toward poorer performance for non-ST-ST pairs at every location examined (Figure 5). Further examination of the data revealed that the obtained distribution of scalar pair-type for number-matched electrodes was not sufficiently varied within-subject to have sufficient power for this particular LMEM analysis; only eight of the 18 listeners demonstrated both ST-ST and non-ST-ST pair types.
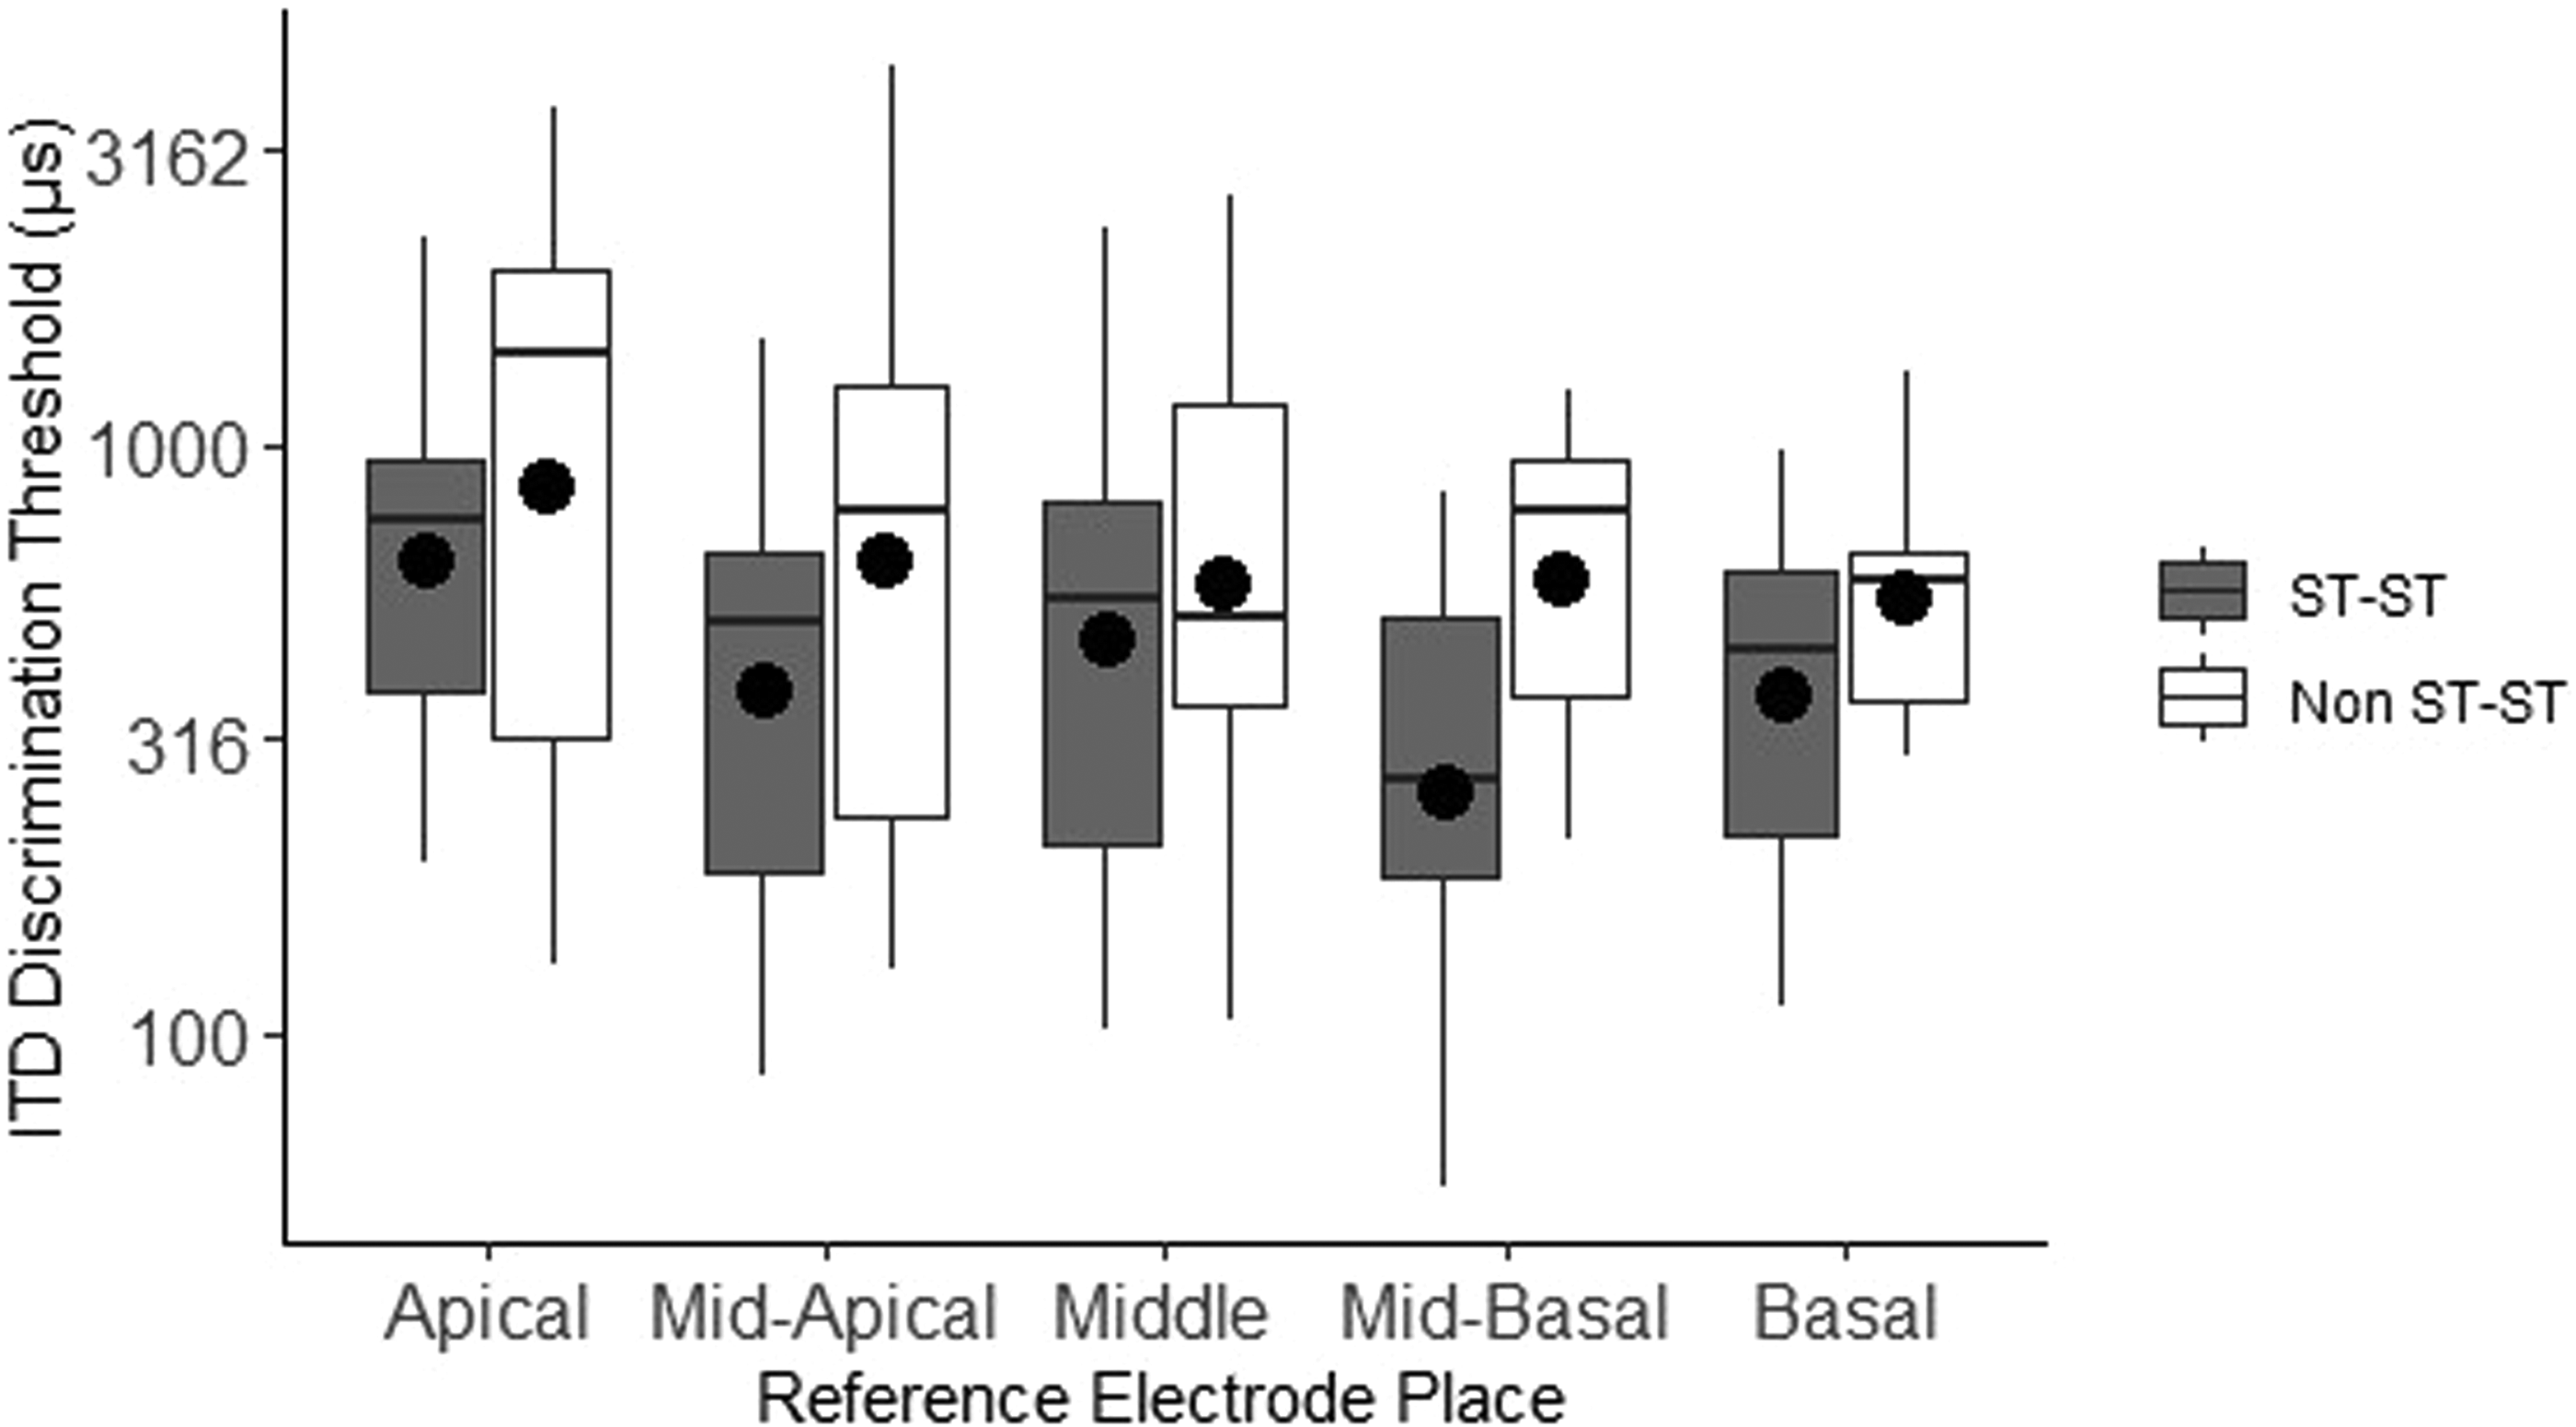
ITD discrimination threshold as a function of scalar pair-type of number-matched electrode pairs at each general cochlear location. Filled symbols indicate means. The boxplot shows the median (line), the first and third quartiles (edges of box), and the min and max values (endpoint of lower and upper whiskers). The y-axis is plotted with a logarithmic scale.
Given this statistical limitation in the observed data, an alternative analysis was adopted. To examine whether scalar location more globally across the array might be more important than the specific location of the tested pair, we calculated the proportion of all 22 number-matched electrode pairs that were ST-ST for each listener. A linear mixed-effects analysis was used to test the association between log ITD discrimination threshold (for number-matched pairs, averaged across all reference electrodes) and ST-ST proportion (Figure 6). The fixed effect of ST-ST proportion was found to be associated with 19.7% of the observed variability in ITD discrimination threshold. (Total variance accounted for via subject and ST-ST proportion = 68.1%.) ST-ST proportion was predictive in the expected direction, t(17.9) = −2.52, p = .022, with larger proportions of ST-ST pairs associated with smaller ITD discrimination thresholds.

ITD discrimination threshold (averaged over reference electrode) as a function of scalar pair-type proportion (number-matched electrode pairs classified as ST-ST over entire array length). Each dot represents one BI-CI listener as indicated by listener code (N = 18).
ITD Bandwidth
To test the hypothesis that a larger proportion of ST-ST pairs would be associated with narrower BWs, a linear mixed-effects model was specified with log BW in electrodes as the dependent variable, subject as a random effect variable (only varying intercept), and proportion of ST-ST pairs as a fixed-effects predictor. ST-ST proportion was not found to be predictive of BW, t(18.3) = .45, p = .66. In neither this model, nor alternative models which included reference-electrode place, or included only the pair-type of the number-matched electrode pair, was significant variance in BW accounted for by ST-ST location.
Modiolar Distance
ITD Bandwidth
The distance between CI electrodes and the modiolus was not part of our initial hypothesis; however, the CT analyses included an estimate of modiolar distance for each electrode, measured from electrode center to the closest point on the modiolar wall (Davis et al., 2016). This allowed a preliminary examination of the relationship between modiolar distance and ITD BWs. In particular, previous work suggests that larger modiolar distances might be associated with wider ITD BWs, because wider current spread across a larger distance might allow for sensitivity to be present for a given reference electrode over a wider range of paired comparison electrodes (broad tuning) (Nelson et al., 2011). For pre-curved Cochlear-brand arrays, greater modiolar distances are also weakly but reliably associated with larger prescribed clinical current levels in order to reach satisfactory threshold and comfort levels (Davis et al., 2016). Higher current levels may in turn translate into wider current spread.
Because each ITD BW was measured using a single reference electrode and multiple comparison electrodes, a metric of modiolar distance was computed by averaging the distances of all tested comparison electrodes that fell within that BW, and then averaging that value with the distance of the reference electrode. Given that we were trying to relate BW to a specific set of variable measurements along the cochlea, only BWs that fell entirely on the array were considered (n = 55). A LMEM analysis was carried out with subject as a random effect (varying intercept only), and average modiolar distance and angular insertion-depth difference as fixed effect predictors (Table 5). There was a significant main effect of average modiolar distance in addition to the previously observed main effect of angular insertion-depth difference. There was also a significant negative interaction between modiolar distance and angular insertion-depth difference. The finding of a negative interaction term indicates that the effect of each CT-derived variable was weaker for large values of the other variable. In other words, BW was larger with either a larger average modiolar distance or larger insertion-depth difference, but only to a limited extent such that the two effects were not additive.
LMEM of Log ITD Bandwidth as a Function of Average Modiolar Distance (mm), Angular Insertion-Depth Difference (AID Δ), and Subject. Bolded Rows Indicate Statistically Significant Fixed Terms (α = .05).

Further examination of the data suggested that the observed effect of modiolar distance might be driven by three listeners (S06, S08, S12) who each had one lateral wall array, typically associated with larger modiolar distances. When these three listeners were excluded from the LMEM, the relationships involving modiolar distance were no longer statistically significant (number of BWs = 47, listener n = 15, main effect of modiolar distance: p = .13, interaction between modiolar distance and angular insertion depth: p = .63). In summary, while there was some indication of a dependence of ITD BW on modiolar distance, this relationship depended on three listeners who each had one lateral-wall array.
Relationship Between Listener Characteristics and ITD Performance
Large across-listener variability in ITD discrimination thresholds and BWs remained even after CT-based-variability was taken into account. Duration of severe-to-profound hearing loss and duration of CI use are known to contribute to ITD perception in BI-CI listeners (Litovsky et al., 2012; Thakkar et al., 2020). Shorter periods of auditory deprivation from binaural input prior to implantation and greater experience with BI-CIs might reasonably be hypothesized to yield better ITD discrimination, and possibly narrower BWs. Additionally, given that older age at testing is associated with poorer ITD sensitivity for clinically NH adult listeners (Strouse et al., 1998), similar effects might be present in our listener sample which ranged widely in age. Our final analysis therefore attempted to account for individual differences in ITD discrimination threshold and BW by adding duration of severe-to-profound hearing loss of the longer-deprived ear, duration of BI-CI use, and age as fixed-effect predictors to the two LMEMs that showed significant relationships between CT-based mismatch measures and ITD outcomes.
None of the demographic variables of duration of hearing loss, duration of BI-CI use, or chronological age, explained significant additional variance in ITD discrimination threshold or showed any simple or interactive effects when added either alone or as a group to the LMEM described above (Figure 6) relating ITD discrimination threshold to proportion of ST-ST pairs.
For the model relating ITD BWs to angular insertion-depth difference (Figure 4), a slightly different picture emerged. Adding duration of BI-CI use or chronological age did not improve the model significantly (p = .11 and p = .08, respectively). However, adding duration of hearing loss did significantly improve the model fit, χ2 = 11.19, df = 2, p <.01. Longer duration of hearing loss was associated with wider BWs (Table 6). A significant interaction was also observed between duration of hearing loss and angular insertion-depth difference indicating that each effect differed in strength depending on the level of the other variable. With larger insertion-depth differences, the association between duration of hearing loss and BW became weaker. Alternatively, with longer durations of hearing loss, the association between angular insertion-depth difference and BW became less evident.
LMEM of Log Bandwidth as a Function of Duration of Severe-to-Profound Hearing Loss in the Longer-Deprived Ear, Angular Insertion-Depth Difference (AID Δ), and Subject. Bolded Rows Indicate Statistically Significant Fixed Terms (α = .05).

General Discussion
Overview
Previous studies have shown variable ITD sensitivity and broad ITD tuning for BI-CI users. The primary question addressed here was how angular insertion-depth and scalar location as determined from CT scans could be used to assess the effect of interaural place-of-stimulation mismatch on ITD tuning curves. Because some past BI-CI research has suggested that ITD sensitivity might be better at particular locations along the cochlea, we also included this factor in our statistical models. CT scan analyses showed relatively small amounts of interaural angular insertion-depth mismatch together with a relatively high occurrence of scalar mismatch in our sample. Examined in combination with behavioral data, three main findings emerged. First, ITD sensitivity for number-matched electrode pairs was dependent on the proportion of number-matched electrodes both located in the ST, but not dependent on the angular insertion-depth mismatch of the electrode pair. Second, ITD tuning curve BW was significantly related to interaural insertion-depth mismatch, but not to scalar location. Third, there was a small but significant effect of absolute place-of-stimulation on ITD sensitivity, with poorer performance toward the apex.
Each of these results warrants further discussion. Figure 6 shows that listeners with more number-matched pairs located in the ST tended to display better sensitivity. ST location has previously been reported to be associated with better speech perception scores in CI listeners when compared to SV location (Holden et al., 2013; Skinner et al., 2007; Wanna et al., 2014; but see also Long et al., 2014; Wanna et al., 2011). The present data extend this finding by reporting a relationship between scalar location and ITD sensitivity for BI-CI listeners. Poorer sensitivity for non-ST-ST pairs is consistent with non-ST positioning being associated with a higher likelihood of undesirable cross-turn stimulation and trauma caused by scala perforation within a given ear (O’Connell et al., 2016). More effective binaural stimulation of the ITD processing pathway may be possible when corresponding electrodes are both located in the ST. There was not, however, any evidence of a relationship between interaural insertion-depth mismatch and ITD sensitivity for number-matched pairs.
Scalar mismatch was not found to be related to ITD BW. However, there was a significant relationship between interaural insertion depth difference and ITD BW; listeners with larger angular insertion-depth differences for number-matched pairs tended to display significantly wider BWs (Figure 4). This relationship was observed despite the fact that the interaural angular insertion-depth differences were relatively small in the analyzed sample of listeners with standard insertions. The association between BWs and interaural insertion depth mismatch suggests that the already broad tuning associated with CI stimulation might be broadened even further by habitually misaligned binaural electrical inputs. One possible explanation for this is that binaural brainstem neurons may exhibit some plasticity to overcome interaural insertion-depth mismatch, broadening the tuning curve over time to provide better ITD sensitivity for number-matched pairs. However, listeners with longer durations of hearing loss were also found to have wider tuning curves. The fact that longer periods of deprivation from binaural input are traditionally associated with less plasticity could account for the moderating interactive effects of duration of hearing loss and angular insertion-depth difference on BW.
Clear effects of reference electrode place of stimulation on ITD sensitivity have been elusive in past research (Litovsky et al., 2010; Thakkar et al., 2020; van Hoesel et al., 2009). A few studies have reported poorer ITD discrimination thresholds towards the apex in BI-CI users (Best et al., 2011; Kan, Jones, & Litovsky, 2013), and a similar pattern was observed in the present study (Figure 2). The best sensitivity, on average, was observed for mid-basal reference electrodes, and the poorest for apical, but the reasons for this remain unclear. While these effects were significant, they were relatively small, even with this relatively large data set. There was no significant effect of reference electrode place on ITD tuning curve BW. The BWs were quite similar across place of stimulation, on average, and were even more similar after accounting for the variable electrode spacing of the pre-curved array that was predominant in our sample (Table 3).
While this study was mainly concerned with questions related to interaural mismatch in insertion depth and scalar location, information regarding the lateral position of each electrode was available as an output of the CT analysis. We reasoned that variations in modiolar distance might also contribute to BW variability by increasing the spatial extent of peripheral stimulation (Cohen, 2009; DeVries et al., 2016). We therefore calculated the average modiolar distances of all electrodes contributing to a given BW, and found that larger average modiolar distances were associated with somewhat wider BWs even after angular insertion-depth difference was taken into account. However, the large modiolar distances for three lateral wall arrays in the sample appeared to drive much of this effect. Thus it is unclear whether modiolar distance, independent of array type, contributes to the observed variability in tuning curve BW.
Comparison to Previous Literature: Broad Binaural Tuning
Accurately characterizing the shape of the ITD tuning curve for each listener at each reference electrode location was a key element of this study. A crucial advantage of the approach employed here was measurement of ITD discrimination across a large range of electrodes to ascertain the full extent of the binaural tuning curve. Previous research has typically examined only a small number of pitched-matched pairs per listener (e.g., Kan, Stoelb, et al., 2013; Thakkar et al., 2020; van Hoesel et al., 2009). The present study tested up to five reference locations, and numerous pairings per reference for each listener. Between 16 and 55 different paired locations were tested per listener, with an average of 38 paired locations per listener. Whenever possible, if performance was better than chance levels, we continued to add additional test pairs with increased electrode number separation until sensitivity degraded to a chance level of responding. Most electrode pairings were re-measured three or more times to obtain a stable and reliable measure of perception. By not limiting data collection to pitch-matched pairs and by obtaining multiple measurements, a better understanding of how ITD sensitivity degrades with place of stimulation mismatch, and a more well-defined ITD tuning curve were obtained.
The resulting ITD tuning curves revealed that many BI-CI listeners maintained sensitivity over a large range of interaural separation. On average, a separation of more than five electrodes from the electrode yielding best performance was required to double the ITD discrimination threshold. The finding that several listeners exhibited a combination of wide tuning curves together with good sensitivity (Figure 1) was somewhat surprising and clearly indicated that their responses did not rely on finely tuned frequency-specific matching across ears. For example, thresholds from listeners S04 and S05 remained remarkably good even when reference and comparison electrodes were separated by two to four electrodes (wide, nearly flat troughs within deep tuning curves). These listeners continued to show measurable sensitivity (better than chance) when interaural electrode pairs differed by as much as eight to ten electrodes. S05's ITD thresholds were substantially better than chance even when the apical reference electrode (21) was separated by 19 electrodes from comparison electrode 2 (i.e., there was ITD sensitivity across the whole length of the array). Such cases highlight the fact that BW was nearly independent of sensitivity.
We observed wide BWs of approximately 10.5 electrodes, on average, measured at twice the ITD discrimination threshold minimum. This corresponds to a distance along the cochlea of about 5.9 mm, or about half the ∼12.5 mm distance spanned by the entire set of intra-cochlear electrodes in a Cochlear-brand Contour Advance array. The value obtained agrees well with previous reports of mismatch of ± 3 mm being tolerable for ITD discrimination threshold sensitivity (Kan et al., 2015; Poon et al., 2009) and interaural correlation change discrimination (Goupell, 2015). This value is also consistent with the fairly constant distance associated with physical current spread around a single electrode for a low-rate constant amplitude pulse train (see Goupell et al., 2013).
The broad ITD tuning we observed is likely related to the stimulation mode (MP1 + 2) that was used by all listeners in this study. Monopolar stimulation is the default stimulation mode in most modern commercially available CIs, and is known to generate relatively wide electrical fields (Wolfe, 2020; Zhu et al., 2012). Forward-masking paradigms for testing frequency selectivity within a single ear using monopolar stimulation have estimated the BWs (measured along the response curve, 1 dB above the best sensitivity) for a given stimulation rate to be approximately 4.4 to 4.6 mm for unilateral Advanced Bionics users with the early Clarion C-I device, and 2.9 mm with later C-II devices (Nelson, Donaldson, & Kreft, 2008; Nelson et al., 2011).
Assuming that ITD processing is best for frequency-matched binaural inputs, one might expect that monaural frequency tuning curves for individual CI ears (e.g., as measured via forward-masking) would predict the binaural ITD discrimination threshold response curve widths derived in the present study. Indeed, some early studies of ITD discrimination threshold in BI-CI users reported BWs similar in size to those reported for unilateral frequency selectivity, that is, slightly narrower than what we report here. Poon et al. (2009) estimated the average ITD discrimination threshold BW to be about 3.7 mm using a metric similar to that used in the present study (twice the minimum discrimination threshold), based on data from four bilateral Advanced Bionics CII listeners using monopolar stimulation.
Subsequent studies with slightly larger sample sizes have shown larger BWs. Kan, Stoelb, et al. (2013) and Kan et al. (2015) reported on ITD sensitivity in nine Cochlear BI-CI listeners under monopolar stimulation conditions similar to those in the present report. ITD sensitivity was shown to degrade with increased mismatch from a pitch-matched reference point, with average response curves displaying a width of approximately 8 to 10 electrodes at twice the minimum discrimination threshold. This suggested that BI-CI users exhibited a tolerance for mismatch of ± 4 electrodes, or using their estimate of .75 mm per electrode, ± 3 mm, in their ITD sensitivity.
Some of the variation in reported BI-CI ITD tuning curve BWs across studies is likely due to the small sample sizes, both in terms of listeners and electrodes. Nearly all past studies, however, agree with the general pattern of broad tuning found in our detailed investigation. As reviewed above, there is a general consensus that sharp, narrow tuning is not observed in BI-CI users.
In one exception to the broad ITD tuning reported in the literature, Staisloff and Aronoff (2021) presented data interpreted as showing narrow tuning on the order of 1-2 electrodes for seven subjects using Cochlear-brand devices. These narrow tuning estimates might reflect a combination of two methodological factors. First, the ITD discrimination thresholds (provided in their Supplementary data) appeared noisy relative to the current data set, with considerable jagged variation between adjacent comparison electrodes, which could be a result of the relatively small number of measurements made for each electrode pair (59% of pairs tested had only one threshold measurement). This approach might not be sufficient to assess tuning-curve shape. Second, the group-mean tuning curve that provided the basis for the report of sharp tuning was derived by horizontally aligning the individual response curves based on where the minimum was observed, before averaging. Such a process will tend to exaggerate the narrowness of the composite curve because of the jagged nature of the noisy threshold measurements. In fact, the subset of individual ITD tuning functions from Staisloff and Aronoff that were relatively smooth and U- or V-shaped (and therefore less likely to reflect measurement noise), showed broad tuning similar to that reported elsewhere in the literature.
Limitations and Future Directions
In assessing the impact of our main variables of interest, we faced the limitations imposed by the inherently non-experimentally manipulable nature of electrode placement. For example, the range of angular insertion-depth differences at number-matched pairs was not large in this sample of listeners; our listeners mostly had symmetric insertion depths (Bernstein et al., 2021). However, some variation was observed, and this variation patterned in an interpretable manner with ITD BW. Sample characteristics also limited the conclusions we could draw regarding the impact of specific scalar locations on ITD performance.
Outlier cases presented some challenges in assessing the relationships between behavioral and anatomical measurements. The two listeners with non-standard electrode placement provided useful illustrations of cases with some ITD sensitivity, but only for limited configurations of bilateral stimulation. Yet these cases were so different from the rest of the group that it was not sensible to include them in correlational analyses. In addition, compared to data from a much larger clinical database of BI-CI listeners (Goupell et al., 2022), the group of volunteer listeners in this study (other than the two outliers) tended to show less interaural mismatch, as estimated by CT measurements, than average. It could be that behavioral results for a larger and more heterogeneous population of BI-CI subjects would reveal greater influence of mismatch in interaural insertion-depth and scalar location on binaural perception.
Characteristics of our listener sample also limited the conclusions we could draw about modiolar distance, an additional variable related to electrode position that logically might impact binaural perception. Future directions for this work include examining modiolar-distance asymmetry and whether this variable, in combination with characteristics of the electrically evoked compound action potential, may account for additional variability in ITD discrimination thresholds and BWs.
Clinical Implications
Although large insertion-depth mismatches were uncommon, our results showed effects on binaural processing when large mismatches were found. In two outlier cases as defined via CT, sensitivity was only observed when particular regions in the better ear were stimulated (e.g., around electrode 4 in the comparison ear for S23, or electrode 18 for S21), regardless of the position of the reference electrode. In the case of S23, for whom detailed CT information was available, the sensitivity at more basal regions of the better ear corresponded to the only region of electrode coverage overlap—due to large angular insertion-depth mismatch, electrodes at more apical regions had no corresponding electrodes present at similar depths in the poorer ear.
Our findings support the value of intraoperative imaging during CI surgery to determine the location of each array (e.g., Labadie et al., 2020). Post-operative CT scans might be useful for guiding expectations regarding binaural hearing in cases where insertion into a scala other than the ST occurs either incidentally or by necessity (for example, due to ossification; see Stock et al., 2021; Trudel et al., 2018). It is possible that clinical fitting could be refined in the future to compensate for scalar or large angular mismatch between the ears, using revised frequency allocation parameters or novel stimulation options to improve binaural processing performance. For example, by adjusting frequency allocations to interaurally frequency-match the two arrays near time of activation, plasticity-related changes could perhaps be avoided, and ITD BWs might be limited only by monopolar stimulation, rather than widened further by interaural insertion-depth differences.
To the extent that post-implantation CT scans provide utility for programming or setting outcome expectations, it is important to point out that CT analyses of the type reported here are not typically available to CI audiologists (Vaerenberg et al., 2014; Wolfe, 2020). Bernstein et al. (2021) found that CT scans and ITD discrimination yield similar interaural mismatch information for unilateral single-sided-deafness CI users with large interaural mismatch in place-of-stimulation as well as for BI-CI users with smaller amounts of interaural insertion-depth mismatch. This suggests that behavioral ITD sensitivity measures could theoretically be used in lieu of CT-scan information to estimate interaural electrode position and place-of-stimulation mismatch. These perceptual measurements are, however, more time-consuming than CT scans. It is also the case though, that while the amount of radiation involved in a temporal-bone CT scan, such as used in this study (1.7 millisievert) (Bernstein et al., 2021), is considered safe for adults (Mettler et al., 2020), it is non-negligible. Therefore, we suggest that perhaps these measures can be used in tandem: a failure to find the typical pattern of best ITD performance with roughly number-matched electrodes might be an indicator to look more carefully at array positioning via additional imaging, and imaging results that show large interaural mismatch may indicate that ITDs will not be processed in the expected manner.
Finally, the research sound processors used in this study differ from currently available clinical processors, in that the research devices allow for precise interaural synchronization. Although this technology exists, whether it is worth implementing in commercially available devices is an open question. The data here corroborate previous studies in showing that most BI-CI users demonstrate at least some ITD sensitivity at a wide range of cochlear locations, and thus might be able to make use of such information if it were encoded properly by the CI (Churchill et al., 2014; Dennison et al., 2021).
Summary and Conclusions
This study examined how interaural insertion-depth difference and scalar location mismatch, as determined via CT scans, relate to ITD sensitivity and tuning in BI-CI listeners.
Consistent with previous studies, we found large across-listener variability with an average ITD discrimination threshold minimum of 439 µs (geometric SD factor = 2.56) and an average tuning curve BW of 10.5 electrodes, corresponding to mismatch of approximately ± 3 mm required for sensitivity to drop by half. Sensitivity and tuning curve BW were not strongly associated. A small effect of electrode place was observed, with somewhat poorer sensitivity for apical electrodes. Larger interaural angular insertion-depth mismatch was associated with wider ITD tuning curve BWs. Having more electrode pairs located in the ST was associated with better ITD sensitivity. Listeners with longer durations of severe-to-profound hearing loss in the longer-deprived ear showed wider ITD tuning curve BWs even after angular insertion-depth mismatch was taken into account.
We also found that variability in ITD sensitivity and tuning was related to estimates of electrode position in the following manner:
The generally wide ITD tuning-curve BWs observed for BI-CI listeners are likely mostly a product of monopolar stimulation but may also be affected by interaural insertion-depth mismatch and modiolar distance. Precise matching of insertion depth appears not to be critical for ITD sensitivity, though mismatch may further broaden tuning. Further prioritizing ST location at implantation might have the potential to improve ITD discrimination thresholds. Overall, the results suggest that although the impact of interaural mismatch on binaural sensitivity is limited by broad tuning, binaural perception in BI-CI users with adult-onset of hearing loss might nevertheless be influenced more than previously recognized by the positioning of the electrode arrays.
Footnotes
Acknowledgements
We would like to thank Cochlear Ltd. for providing the testing equipment and technical support. We thank Kelly Johnson, Danielle Addington, Taylor Bakal, Rebecca Kelly, and Ginny Alexander for help in data collection and analysis. Portions of this work were presented at the 175th Meeting of the Acoustical Society of America (May 2018), 176th Meeting of the Acoustical Society of America (November 2018), 42nd Annual Midwinter Meeting of the Association for Research in Otolaryngology (February 2019), and 19th Conference on Implantable Auditory Prostheses (July 2019) and portions of the data were previously published in ![]() .
.
The content is solely the responsibility of the authors and does not necessarily represent the official views of the National Institutes of Health. The identification of specific products or scientific instrumentation is considered an integral part of the scientific endeavor and does not constitute endorsement or implied endorsement on the part of the authors, Department of Defense, or any component agency. The views expressed in this article are those of the authors and do not reflect the official policy of the Department of Army/Navy/Air Force, Department of Defense, or U.S. Government.
Declaration of Conflicting Interests
The authors declared no potential conflicts of interest with respect to the research, authorship, and/or publication of this article.
Funding
The authors disclosed receipt of the following financial support for the research, authorship, and/or publication of this article: This work was supported by the National Institute on Deafness and Other Communication Disorders under R01DC015798 (M.J.G. and J.G.W.B.), R01DC014037 (J.H.N.), and R01DC014462 (J.H.N.).