
Abstract
Motivation influences the amount of listening effort (LE) exerted or experienced under challenging conditions, such as in high-noise environments. This systematic review and meta-analysis is the first to quantify the effects of motivation on LE. The review was pre-registered in PROSPERO, and performed in accordance with PRISMA guidelines. Eligible studies examined the influence of motivation or individual traits (related to motivation) on LE in adults. Motivational factors, coded as independent variables, included financial reward, evaluative threat, perceived competence, feedback, and individual traits. LE outcomes were categorized as subjective, behavioral, or physiological. The quality of evidence was assessed using an adaptation of the Cochrane Collaboration Risk of Bias Tool. Nested random-effects meta-analyses were performed to quantify and compare the influence of motivational factors across LE outcomes. After assessing 3,532 records, 48 studies met the inclusion criteria and 43 were included in the meta-analyses. Risk of bias was high, for example, many studies lacked sample size justification. Motivational factors had a small-to-medium effect (mean Cohen's d = 0.34, range: 0.11–0.72) on LE. When LE outcomes were considered collectively, an external manipulation of motivation (perceived competence) produced a larger mean effect size compared with individual traits. Some combinations of motivational factors and LE outcomes produced more robust effects than others, for example, evaluative threat and subjective LE outcomes. Although wide prediction intervals and high risk of bias mean that significant positive effects cannot be guaranteed, these findings provide useful guidance on the selection of motivational factors and LE outcomes for future research.
Introduction
Listening can be effortful in adverse conditions (see Mattys et al., 2012 for a review), especially if the listener has a hearing impairment (Alhanbali et al., 2017, 2018; Hornsby, 2013; Petersen et al., 2015), and this can lead to disengagement from listening and social withdrawal (Herrmann & Johnsrude, 2020). However, some individuals are motivated to exert listening effort (LE) under challenging conditions if the benefits outweigh the cost (Matthen, 2016). To date, the influence of motivation on LE has not been systematically reviewed and quantified.
The Framework for Understanding Effortful Listening (FUEL; Pichora-Fuller et al., 2016) defines LE as the deliberate allocation of mental resources to overcome obstacles in goal pursuit when carrying out a [listening] task. According to FUEL, the allocation of limited-capacity mental resources is influenced by a listener's motivation as well as other factors such as working memory capacity and fatigue. FUEL applies a general theory of motivation, Motivation Intensity Theory (Brehm & Self, 1989) to listening effort. Within MIT, effort investment is predicted to increase in line with task demands, provided there is motivation to succeed at the task and the goal is attainable. Resources are only allocated to achievable goals for which the importance of success justifies the required effort expenditure. In the context of listening tasks, MIT (Brehm & Self, 1989) predicts an interactive effect between task (listening) demands and motivation: maximal effort is invested when the listener is sufficiently motivated and listening is demanding enough to require effort but not so demanding that the effort is perceived as being wasted.
An alternative (but not mutually exclusive) model, the Cognitive Energetics Theory (CET) (Kruglanski et al., 2012), considers how an individual's ability level and personality traits influence effort. The CET is intended to apply to all instances of goal-directed thinking, not only deliberate resource allocation (cf. FUEL) and proposes that goal-directed activity results from a dynamic interaction of two forces: for goal-directed activity to occur, a “driving force” must overcome a “restraining force”. The driving force consists of two main components: the individual's pool of available resources and goal importance, which is determined by the value and likelihood of attaining the goal. The magnitude of the restraining force is defined in reference to three constraining components (a) the task demands—as perceived by the individual, (b) alternative goals—which compete with the target activity for resources, and (c) resource conservation—which varies as a function of how likely the individual is to seek to withhold resources. According to CET, individual differences in personality traits affect resource conservation and hence influence effort investment. Here we review different motivational factors and different methods of measuring LE.
Categorization of Motivational Factors
Motivation refers to the energization and direction of behavior (Elliot, 2006), that is, motivation underlies why people decide to behave in a certain way and how intensely they conduct that behavior. The five factors below represent different categories of motivation in experimental LE research. Four factors (financial reward, evaluative threat, perceived competence and feedback) rely on extrinsic manipulations of motivation, whereas individual traits are inherent to a person. How different motivational factors influence effect sizes when measuring the experience or expenditure of LE is currently unknown.
Financial Reward
Consistent with predictions of cost-benefit analysis when allocating effort, previous work suggests that financial reward can motivate participants to increase LE (e.g., Carolan et al., 2021; Koelewijn et al., 2018; Mirkovic et al., 2019; Plain et al., 2020; Richter, 2016). Some studies support MIT predictions of a greater effect of motivation at higher compared to lower levels of listening demands, (e.g., Mirkovic et al., 2019; Richter, 2016), whereas other studies did not find a significant listening demand/motivation interaction (e.g., Carolan et al., 2021; Koelewijn et al., 2021; Plain et al., 2020). Furthermore, it is difficult to determine the range of difficulty levels within which the proportional relationship between task difficulty and effort holds, according to MIT predictions. For example, in Plain et al. (2020), high levels of LE (measured using cardiac reactivity) and low self-rated giving up were measured in the most demanding listening condition, suggesting that participants continued to engage despite high levels of task difficulty, at least in the absence of performance feedback (see also Zhang et al., 2019).
Evaluative Threat
Arousal is posited to increase the amount of resources an individual is able to allocate towards a listening task (Kahneman, 1973; Pichora-Fuller et al., 2016). Manipulations which increase arousal include evaluative threat (sometimes understood as “evaluative stress”), for example, informing participants of an upcoming performance assessment. These manipulations often include an element of social pressure, for example, in Zekveld et al. (2019) participants were informed that their data would be unusable if they failed to perform the task at a particular level. Evaluative threat may motivate greater effort investment in order to protect self-esteem from potential negative evaluations (Gendolla & Richter, 2010). Evaluative threat has been shown to increase LE (e.g., Carrillo-de-la-Pena and Cadaveira, 2000; Picou and Ricketts, 2014; Zekveld et al., 2019). Picou and Ricketts (2014) carried out a sentence recognition task using evaluative threat as a motivating factor and found differential effects depending upon the type of stimuli (audio-only vs. audio-visual) and the type of self-rated outcome measure. For audio-only stimuli, a significant increase in self-rated effort was observed in the hard SNR condition only and evaluative threat had a non-significant effect on self-rated avoidance and control (i.e., willingness to improve the situation). For audio-visual stimuli, evaluative threat increased self-rated effort and control in both SNR conditions and the likelihood of giving up decreased significantly only in the easy SNR condition. Self-rated fatigue increased significantly with evaluative threat in both the easy and hard SNR conditions for both audio-only and audio-visual stimuli.
Perceived Competence
Competence refers to the basic need to build skills for acting in or on the world (Dweck, 2017). Individuals may seek to maximize their performance through greater effort investment in order to demonstrate competence (Nicholls, 1984). Increasing perceived competence experimentally may increase LE, for example, informing self-identified musicians that they should perform well on a novel auditory task because of their musical skills (McAuley et al., 2012) or that they have been specifically selected due to their qualifications (Petrie & Carrel, 1976). Perceived competence may also be manipulated by informing participants that a listening task will be easy or hard (Hodgetts et al., 2018).
Feedback
Participants who receive feedback are posited to increase effort to improve their performance (Kluger & DeNisi, 1996); negative feedback highlights the gap between current behavior and the desired goal (Burgers et al., 2015; Kluger & DeNisi, 1996) and positive feedback enhances feelings of competence (Cusella, 1982; Henderlong & Lepper, 2002). Generally, feedback encourages participants to set higher goals (Krenn et al., 2013; Mumm & Mutlu, 2011) and acts as a verbal reward (Deci et al., 1999), although negative feedback may prompt participants to give up if they perceive the task as too difficult (Brehm & Self, 1989). Performance feedback may influence an individual's motivation to exert LE (Gilzenrat et al., 2010).
Individual Traits
Individual traits are potentially important factors in influencing effort and performance level as they give rise to distinctive, recurrent patterns of goal selection and pursuit (Dweck, 2017; McCabe & Fleeson, 2012, 2016). Extraversion and neuroticism may be relevant to effort regulation (Eysenck, 1990; Eysenck & Derakshan, 2011) as these traits relate to psychological needs for affiliation and social recognition, respectively (Costa & McCrae, 1988; John et al., 2008). Extraversion is associated with physiological differences that may affect effort regulation, for example lower levels of cortico-reticular arousal compared to introverts (Doucet & Stelmack, 2000; Eysenck, 1967, 1990), which may lead to greater levels of effort to compensate for suboptimal arousal conditions (Brocke et al., 1996). Neuroticism may also disrupt effort regulation (Smillie et al., 2006; van Doorn & Lang, 2010; Wallace & Newman, 1997) by directing effort to mental processes associated with negative thoughts at the expense of task-relevant activity (Wallace & Newman, 1997, 1998). Conscientiousness refers to the willingness to complete a task to the best of one's ability (Lee & Ashton, 2012) and this trait has been associated with electrophysiological measures of effortful processing, for example, the P3 component. Enge et al. (2008) found a significant effect of conscientiousness on P3 amplitude during an auditory oddball task, which may indicate increased LE (see Measures of LE below). Francis et al. (2021) included self-rated conscientiousness in a PCA dimension (along with neuroticism and openness) and found this dimension to be a significant predictor of heart rate. CET (Kruglanski et al., 2012) proposes that individual traits influence the tendency to conserve resources, for example, individuals who find mental activity enjoyable and appealing (i.e., a strong “need for cognition”) are more likely to choose resource-heavy, though potentially more successful, strategies towards goal achievement (Cacioppo & Petty, 1982; Kruglanski et al., 2012). Previous studies suggest that extraversion (Bakan, 1959; Beauducel et al., 2006; Brocke et al., 1996; Daruna et al., 1985; Ortiz & Maojo, 1993), neuroticism (Tune et al., 2018) and the need for cognition (Enge et al., 2008; Zhang, 2017) influence LE regulation.
Measures of LE
LE may be measured using a variety of outcomes. These can be categorized as subjective (e.g., self-rated questionnaires), behavioral [e.g., performance accuracy and reaction times (RTs)] and physiological outcomes [e.g., pupillometry, cardiac reactivity, electroencephalography (EEG) and functional magnetic resonance imaging (fMRI)].
Pupil size has been shown to be sensitive to changes in arousal and cognitive load (Kahneman & Beatty, 1966; Koenig et al., 2017; Siegle et al., 2003) and thus has been proposed to be an indirect measure of LE when listening to speech under demanding listening conditions (see Winn et al. (2018) and Zekveld et al. (2018) for further details on the physiological mechanisms controlling pupil size). Another potential physiological measure of listening effort is EEG. At least one event-related potential (ERP), the P3, has been suggested to reflect effortful processing. Both the amplitude and latency of the P3 have been shown to be sensitive to the amount of attentional and memory resources required in listening tasks (Kok, 2001; Okusa et al., 1999; Polich, 2007). In addition, changes in EEG alpha band power have also been suggested to index LE (McMahon et al., 2016; Obleser & Weisz, 2012; Petersen et al., 2015; Wisniewski et al., 2017). Specifically, greater alpha activity may indicate suppression of irrelevant background noise during effortful listening tasks (Sauseng & Klimesch, 2008) or index working memory load (Petersen et al., 2015). Pupillometry and EEG are proposed to index changes in the autonomic and central nervous system related to LE, respectively (Pichora-Fuller et al., 2016).
Behavioral measures, such as RTs, may also indicate when an individual's resource capacity is under strain or exceeded, allowing inferences to be made about LE (Pichora-Fuller et al., 2016). Increased effort may manifest as slower RTs due to increased processing time (Marslen-Wilson & Tyler, 1980; Pisoni & Tash, 1974). However, how RTs respond to changes in LE may depend upon the experimental context. For instance, in a rapid judgement task, an increase in effort may result in faster RTs due to increased arousal (Carrillo-de-la-Pena & Cadaveira, 2000; Hackley & Valle-Inclán, 1998).
When multiple LE outcomes are measured simultaneously in a within-participants design, only weak correlations are found between measures, suggesting that the measures are either unreliable, or that LE is a multidimensional concept (Alhanbali et al., 2019; Herrmann & Johnsrude, 2020; McMahon et al., 2016; Miles et al., 2017; Pichora-Fuller et al., 2016; Strand et al., 2018), or both. Moreover, even if LE outcomes are within the same category, they may not relate to the same underlying processes. For instance, results from two physiological LE outcomes (pupillometry and EEG) showed differential loading in a Factor Analysis (Alhanbali et al., 2019). FUEL recommends categorizing LE measures according to whether they are more responsive to listening demands, motivation or are responsive to both. Cardiac reactivity is proposed to be most sensitive to motivation, since it indexes the sympathetic nervous system (Brehm & Self, 1989). The FUEL suggests that behavioral measures are most responsive to listening demands, while pupillometry is hypothesized to be responsive to both listening demands and motivation (Pichora-Fuller et al., 2016).
Aims of the Review
This review aims to evaluate all existing studies investigating motivation and LE. Within a nested analysis, we will compare effect sizes for various motivational factors on different LE outcomes. We will also compare effect sizes within categories of LE outcomes, for example, accuracy versus RTs for behavioral outcomes, and EEG versus pupillometry for physiological outcomes. It is unclear whether some combinations of LE outcomes and motivational factors produce more robust effects than others, for example, physiological outcomes may measure larger effects of individual traits on LE due to the proposed biological differences underlying traits such as extraversion (Doucet & Stelmack, 2000; Eysenck, 1967, 1990). This approach to systematically reviewing the existing literature will clarify the influence of motivational factors within a multidimensional construct of LE (Alhanbali et al., 2019; Herrmann & Johnsrude, 2020; McMahon et al., 2016; Miles et al., 2017; Pichora-Fuller et al., 2016; Strand et al., 2018).
The review aims to answer the following research questions (RQs):
RQ1: What differences in effect sizes exist between different motivational factors? RQ2: What differences in effect sizes exist between different types of LE outcomes? RQ3: Which motivational factor/LE outcome combinations measure the largest/smallest effects?
Methods
Review Guidelines
The procedure and reporting of this systematic review and meta-analyses was informed by guidelines for conducting systematic reviews in healthcare, including guidance issued by the Centre for Research and Dissemination (2009), the Cochrane Handbook for Systematic Reviews (Higgins et al., 2019) and the Preferred Reporting Items for Systematic Reviews and Meta-Analyses (PRISMA) checklist (Moher et al., 2009). The protocol was registered with PROSPERO (record number: CRD42019160953)
https://www.crd.york.ac.uk/prospero/display_record.php?RecordID=160953.
PICOS Screening Criteria
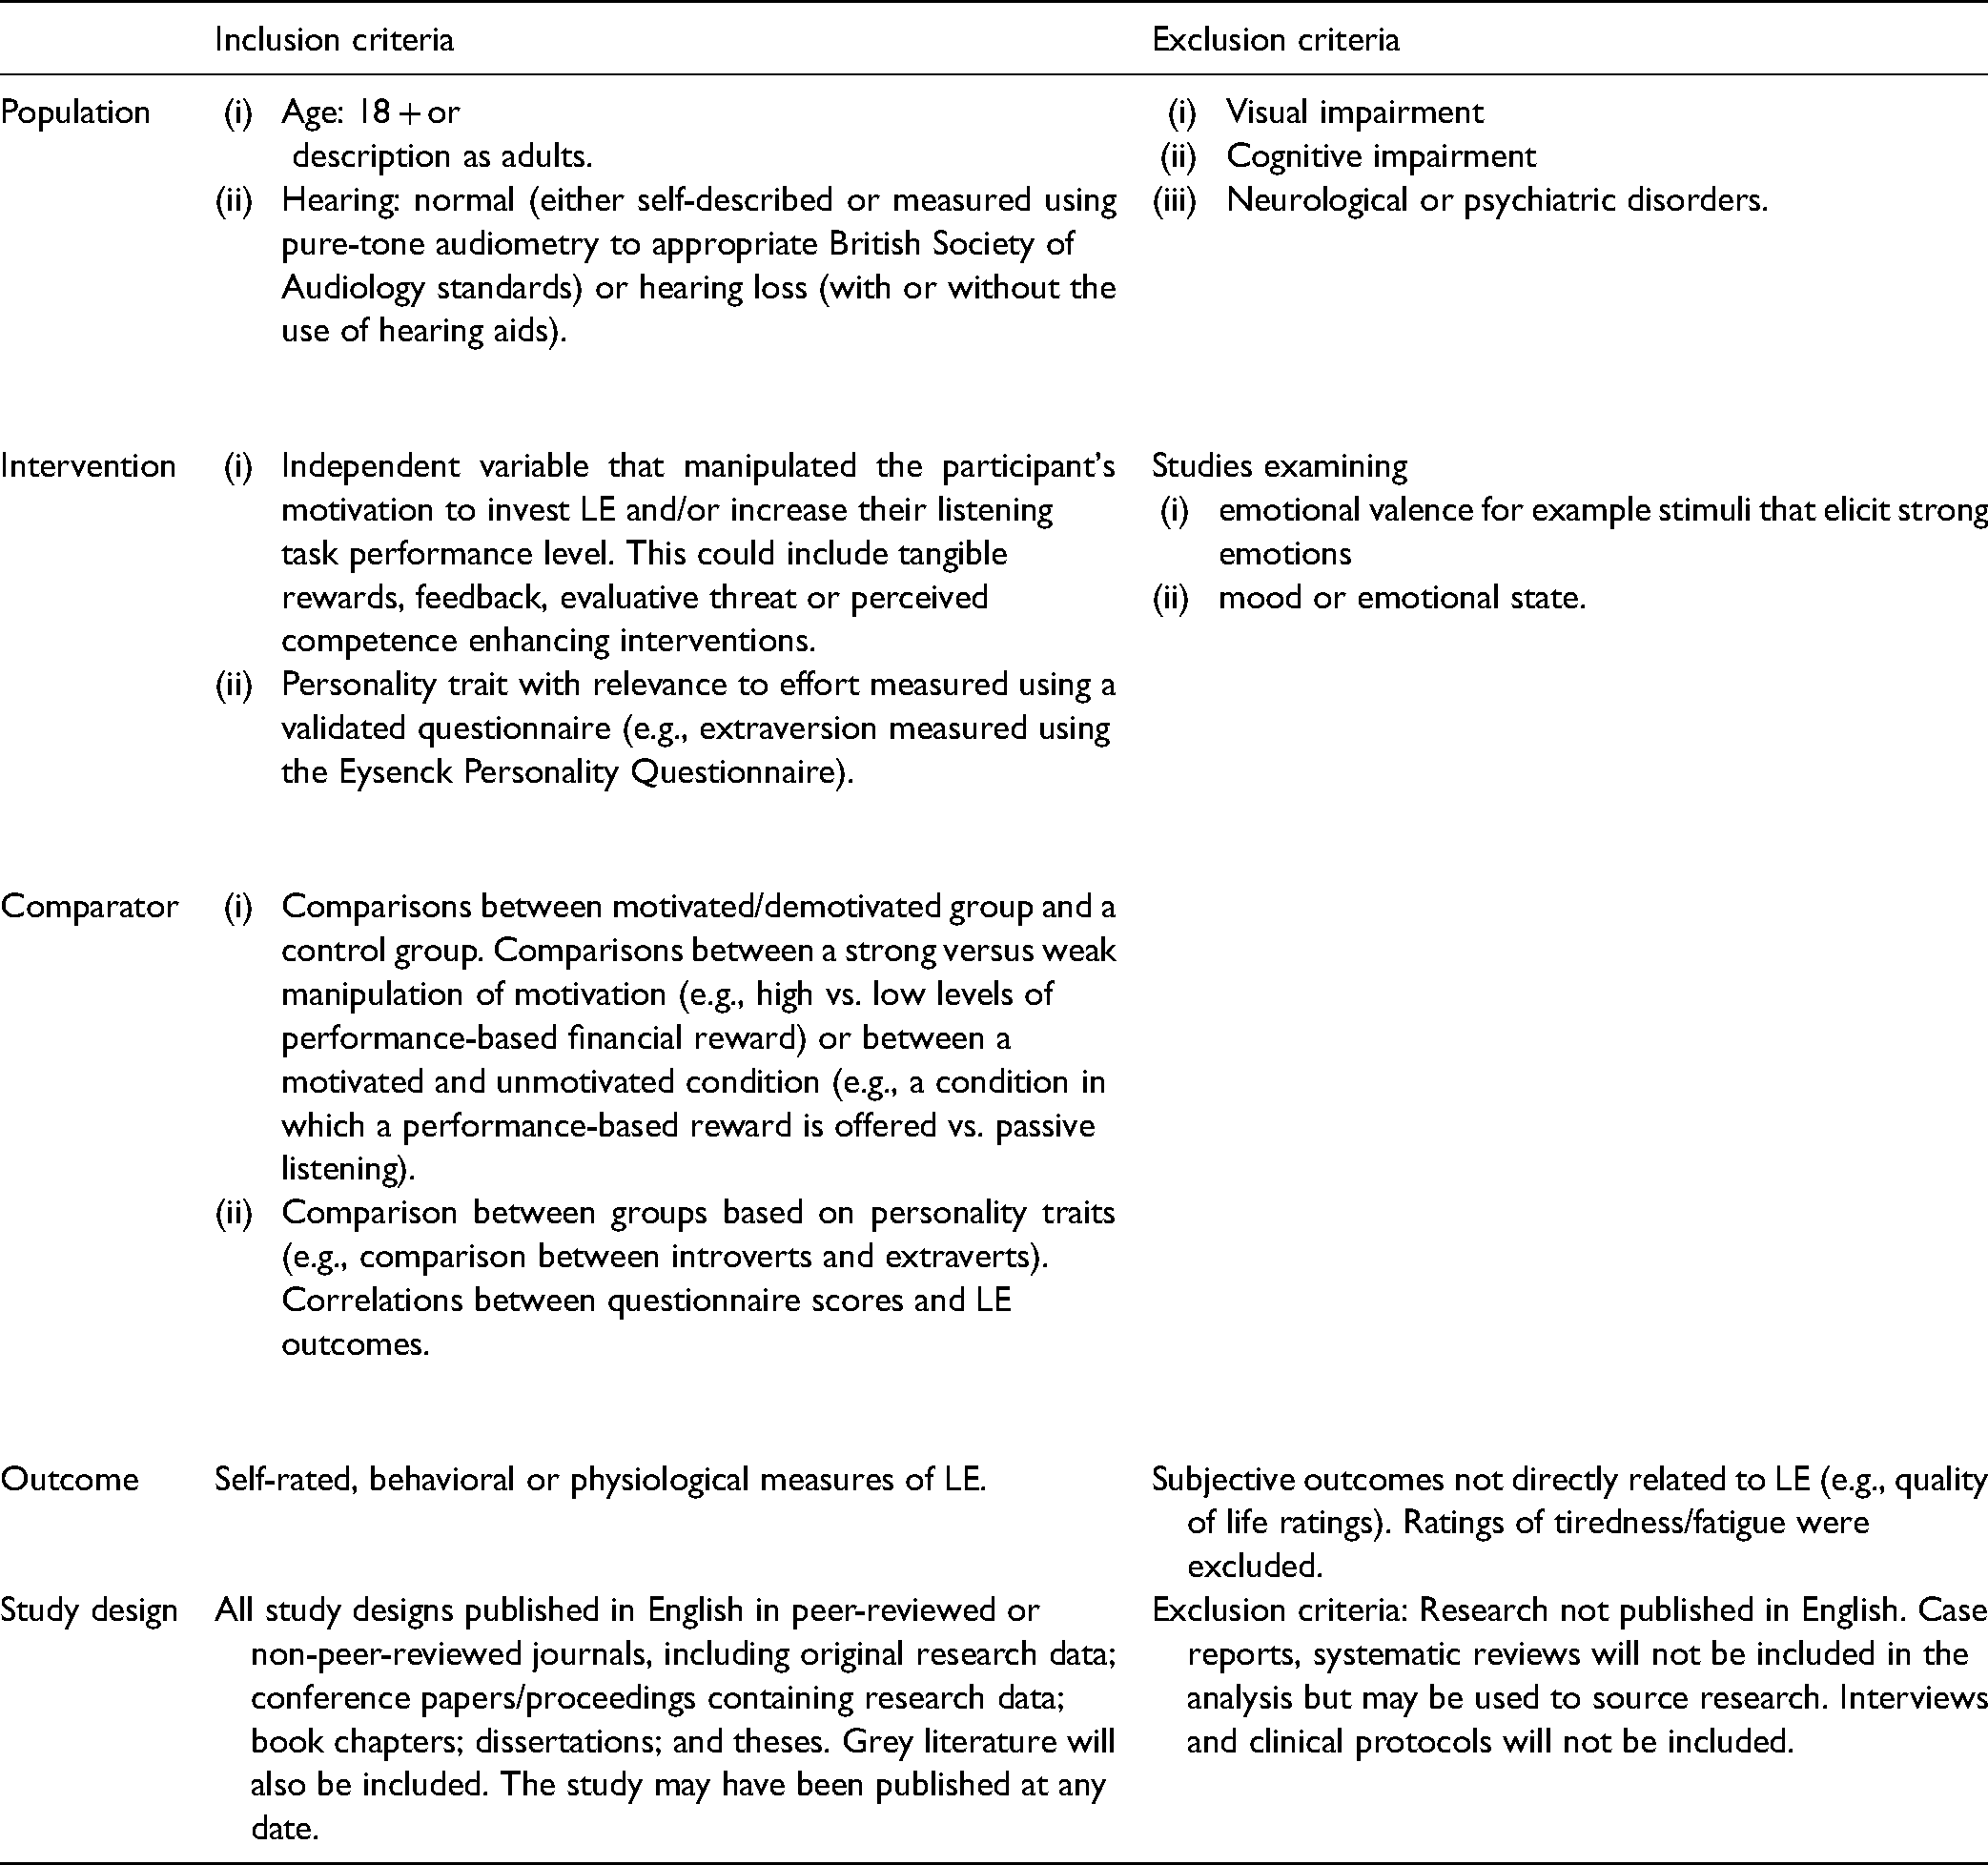
The pre-registered PICOS (Population, Intervention, Comparator, Outcome, Study design) criteria (Table 1) were used to screen all studies. Studies were initially assessed for inclusion based on their titles. P. C. carried this out independently. R. M. independently assessed 10% of study titles and there was full agreement on suitability for inclusion. 155 studies were taken forward for screening of abstracts, which was carried out by P. C. Studies for which a decision on inclusion could not be made based on the title and abstract were screened by reading the full text. This was carried out independently by P. C. and R. M. In one case there was a discrepancy, which was resolved through discussion between P. C., R. M. and A. H.
PICOS Screening Inclusion and Exclusion Criteria for the Literature Search.
Assessment of Risk of Study Bias
Risk of bias was assessed using the scoring system developed by Dryden et al. (2017). This scoring system was developed based upon risk of bias assessment for clinical trials (Higgins et al., 2011) but includes only generic criteria as reporting requirements for experimental research are generally not as rigorous as those for clinical trials. Nevertheless, it is important to highlight quality issues as these reduce the reliability of effect size estimates in meta-analyses, for example, studies with low power may measure inaccurate or inconsistent effect sizes (see Caveats section). Supplementary Table S1 shows the four risk of bias questions and the score key. These questions relate to (i) sample size justification, (ii) exclusion of participant data, (iii) outcome reporting, and (iv) conflict of interest. For (i) a study was deemed high risk when no power analysis was included, unclear when complete information was not provided or low risk when a full power analysis was included. For (ii) studies at high risk excluded participants without providing details, posed an unclear risk when reporting exclusions were incomplete or low risk when details for excluding participants were fully reported. If no participants were excluded, the study was given a “not applicable” rating. For (iii) studies were deemed to be high risk when outcomes listed in the methods were not reported in the results, or unclear risk when reporting was incomplete (e.g., not including behavioral results, full statistical results or unjustified selection of a subset of parameters for a physiological outcome). Note that the research question(s) for some studies were not aligned with the aims of the present meta-analysis, which may account for bias in outcome reporting. For (iv) studies with a stated conflict of interest were high risk, unclear risk where conflicts of interest were uncertain or low risk if there were no reported conflicts of interest. All studies included in the systematic review were independently assessed for risk of bias by P. C. and R. M. In all cases, it was possible to reach agreement without the need to involve an additional author. To assess risk of publication bias, a funnel plot was generated using the dmetar package (Harrer et al., 2019) in R (R Core Team, 2018).
Search Strategy
This review considered all relevant literature published in English to February 23, 2021. This included research published in peer-reviewed journals, conference papers/proceedings containing research data, book chapters, dissertations and theses. A systematic search of the databases PubMed, Web of Science, Scopus, PsycINFO and Google Scholar was carried out. Search terms related to “listening effort”, “motivation” and “personality” were entered into the title, abstract and keyword fields (see Supplementary Table S2 for detailed search criteria). The search criteria were modified after registering with PROSPERO to exclude studies containing “children” in the title. After performing the search, records were transferred to Endnote and then Microsoft Excel for screening.
Meta-Analysis Strategy
Cohen's d was used as an effect size metric, which represents the standardized mean difference score in LE between high and low motivation conditions (either repeated-measures or between-groups comparisons). A positive Cohen's d represents an increase in LE in response to motivation. Effect sizes were calculated directly using means, standard deviations and the sample size, where this information was provided by the author(s). Where this was not possible F ratios, t tests or correlation coefficients were used. For seven studies (Asbjörnsen et al., 1992; Bijleveld et al., 2009; DeWall et al., 2011; Ditraglia & Polich, 1991; Hodgetts et al., 2018; Mirkovic et al., 2019; Picou & Ricketts, 2014), means and standard deviations were estimated from figures using WebPlotDigitizer (Rohatgi, 2020). Where insufficient information was included in published articles, attempts were made to contact the author(s) for further information. Where studies had “easy” and “hard” listening demands (or other task difficulty manipulations), the effect size was based on the interactive effect between listening demands and motivation. If this information was not provided by the author(s), the effect size for the most demanding listening condition was used. This approach was necessary as (i) there may be null results for low-demand conditions due to low LE requirements and (ii) the effect of motivation on LE is posited to be greater for higher listening demands (Brehm & Self, 1989). Signs of effect sizes were reversed for the individual trait neuroticism as higher neuroticism was expected to lower LE (see Categorization of motivational factors: Individual traits). As RTs may feasibly accelerate or decelerate with greater effort (see Measures of LE), the absolute value of the effect size was taken for RTs.
The Measure of the Effect (MOTE) package (Buchanan et al., 2017) in R (R Core Team, 2018) was used to calculate effect sizes and 95% confidence intervals (CI) for each study. For repeated-measures studies, the following equation (adapted from Lakens, 2013) was used to calculate Cohen's d:


If F and t were not provided, an alternate equation (Cumming & Calin-Jageman, 2017), which does not require the correlation coefficient, was used to calculate Cohen's d (where Mdiff is the difference in the means between motivation conditions):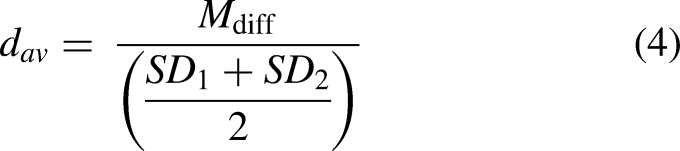
The following formula (Rosenthal, 1991) was used to calculate Cohen's d from t where means were unavailable for repeated-measures studies (where n is the sample size):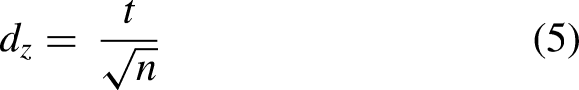
For between-groups studies, Cohen's d was calculated as follows (Cumming, 2012) (where 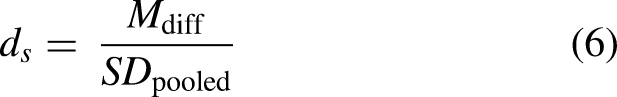
Where means were not available, the formula adapted from Lakens (2013) was used (where N is the sample size):
For studies involving correlations, the 95% CI for Pearson's correlation coefficients were calculated using the Meta-Essentials workbook (Suurmond et al., 2017). To aid comparison with other studies, these values were converted to Cohen's d using a web-based effect size calculator (Lenhard & Lenhard, 2016).
A random-effects meta-analysis was carried out using the Meta package (Schwarzer, 2007) in R (R Core Team, 2018). Due to potential covariates not considered here (e.g., participants hearing level), a random-effects rather than a fixed-effects meta-analysis model was applied (Thompson & Higgins, 2002). A summary effect size (Cohen's d), 95% CI around this effect size, Z-statistic and p-value were calculated to provide a test of whether the summary effect size differed significantly from zero. The inconsistency measure, I2, and its 95% CI was calculated as a measure of heterogeneity, expressed as a percentage (Higgins et al., 2019). Prediction intervals (PIs) were calculated using the Hartung-Knapp-Sidik-Jonkman method (Hartung & Knapp, 2001; Sidik & Jonkman, 2003) within the Meta package (Schwarzer, 2007).
In order to address the individual research questions, a nested approach to data analysis was taken: Subgroup analyses using random-effects models were performed using the Meta package (Schwarzer, 2007) and effect sizes, 95% CIs, Z-statistics, p-values, I2, and PIs for subgroups were calculated. Apart from subgroup analysis E, which explored the effect of financial reward on LE (discussed below), all analyses included at least 10 observations, which is considered the minimum for performing this type of analysis (Higgins et al., 2019).
Motivational factors were grouped into five categories: financial reward, perceived competence, feedback, evaluative threat, and individual traits (see Categorization of motivational factors). Outcomes of LE studies were categorized as subjective, behavioral, or physiological (see Measures of LE).
Seven sets of meta-analyses were conducted:
First, a meta-analysis of all studies was carried out to determine the overall effects of motivational factors on LE outcomes. To address RQ1, which asked whether there are differences in LE dependent upon the type of motivational factor, we conducted subgroup analysis A (Table 3) to compare effect sizes of motivational factors on all LE outcomes. RQ2 asked whether effect sizes differ depending upon the type of LE outcome measure (i.e., subjective, behavioral, or physiological) and whether certain exemplars of LE outcome measurement categories capture larger effects than others. Subgroup analysis B (Table 5) compared the effect sizes captured using different types of LE outcomes. Subgroup analyses C and D (Table 5) compared effect sizes for specific behavioral and physiological measures. An insufficient number of outcomes (i.e., fewer than 10 observations) precluded a subgroup analysis of subjective measures. Finally, to address RQ3, which asked which combinations of motivational factors/LE outcomes produced the largest/smallest effects, a series of subgroup analyses were carried out (subgroup analyses E to G) (Table 6), comparing effect sizes for different types of LE outcomes for specific motivational factors.
Meta-Analysis of the Effects of Motivational Factors on all LE Outcome Measurements.

Bold and *p < .05, **p < .001. Note that some studies contribute outcomes to multiple groups. Feedback is not included in this analysis because of insufficient number of outcomes in the included studies.
Subgroup Analyses Investigating the Influence of LE Outcome Measurement on the Relationship Between Motivational Factors and LE.

Bold and *p < .05, ** p < .001. Note that some studies contribute outcomes to multiple groups.
Meta-Analysis of Effects of Combining Different Motivational Factors with Different Types of LE Outcome Measurements.
Bold and *p < .05, **p < .001. Note that some studies contribute outcomes to multiple groups.
An alpha level of .05 was used throughout, except for post hoc analyses where a Bonferroni adjustment was made for the number of comparisons. For post hoc analyses, the dmetar package (Harrer et al., 2019) in R (R Core Team, 2018) was used to test for differences in effect sizes between subgroups in a random-effects model, following the procedure of Borenstein and Higgins (2013) to calculate a Q statistic and its associated p-value. These analyses included only two categories of interest (e.g., individual traits and perceived competence to compare effect sizes for specific motivational factors).
Results
Screening Results
Figure 1 shows the PRISMA flowchart for the literature search. The search returned 4,639 studies. After removing duplicates, 3,504 studies remained. After screening titles and abstracts, the full text of 64 studies were assessed for eligibility. An additional 28 studies were sourced by checking the reference list of studies selected for full-text screening and checking citations to these studies. After screening the full text of the total 92 studies, 44 studies were excluded: 19 were excluded because studies did not include an LE outcome, 19 did not manipulate motivation or measure personality traits, 3 did not manipulate motivation or measure LE, 1 was a qualitative study, 1 study used visual rather than auditory stimuli and 1 study combined results for an auditory task with results from a visual task. Forty-eight studies were eligible for inclusion in the review. A summary of the 48 included studies is provided in Table 2. This summary includes sample size, demographic information (ages, hearing status), details of the stimuli used, motivation manipulation/personality trait considered, listening demand manipulations and main findings for each LE outcome.

PRISMA flowchart showing the identification, screening, eligibility, and inclusion phases of the literature search.
Summary of Included Studies. This Summary Includes Sample Size, Demographic Information (Age, Hearing status). Where Available, Details of the Stimuli Used, Motivation Manipulation/Personality Trait Considered, Listening/Task Demand Manipulations, and Main Findings for Each LE Outcome. Effect Sizes (Cohen's d), and 95% Confidence Intervals are Included for Results Included in the Meta-Analysis.

Notes:– not stated, 16PFQ = Sixteen Personality Factor Questionnaire, ALI = alpha lateralization index, AMI = attentional modulation index, BA = Brodmann area, BOLD response = blood oxygenation level dependent response, BPD = baseline pupil diameter, CSCT = Cognitive Spare Capacity Test, DBP = diastolic blood pressure, EEG = electroencephalogram, EMG = electromyography, EPQ = Eysenck Personality Questionnaire, ERPs = event related potentials, fMRI = functional magnetic resonance imaging, HA = participants with hearing aids, HI = participants with hearing impairment, HR = heart rate, ITPC = intertribal phase coherence, MBTI = Myers-Briggs Type Indicator, MPD = mean pupil diameter, N1 = negative ERP component (peak between 80 and 120 ms after stimulus onset), N2 = negative ERP component (peak between 200 and 300 ms after stimulus onset), NASA-TLX = NASA Task Load Index, NS = non-significant, NFCog = Need for Cognition, NH = normal hearing participants, P3 = positive ERP component (peak between 250 and 500 ms after stimulus onset), PEP = pre-ejection period, PPD = peak pupil diameter, Pz = midline parietal electrode, RT = reaction time, SBP = systolic blood pressure, Sig = significant, SNR = signal-to-noise ratio, SR = self-rated, SRT = Speech reception threshold, wpm = words per minute.
Of the 48 included studies, only 43 of these studies were suitable for inclusion in the meta-analysis (see Meta-analysis strategy). Four articles (Cahill & Polich, 1992; Cox et al., 1999; Pritchard, 1989; Sewell, 1985) did not provide relevant data to be included with the meta-analysis. A further study (Beatty et al., 1980) was not included in the meta-analysis as this study involved the use of course credit for students as a performance-based reward, rather than financial reward. Included studies often contained multiple outcome measures, leading to a total of 187 outcomes from 43 studies that were included in the meta-analysis.
Risk of Bias Assessment
The results of the overall risk of bias assessment are displayed in Figure 2. A breakdown of scores for individual studies is included in the supplemental materials (see Supplementary Table S3). The vast majority of the studies did not include a sample size justification, presenting a high risk of bias. The majority of studies either did not exclude any participants or gave adequate justification for exclusion, presenting a low risk of bias. Reporting of outcomes presented a high risk of bias for ∼20% of the studies, and there were some concerns for ∼50%. Bias related to outcome reporting may have been present for the following reasons: statistical analyses were not reported for some outcomes, behavioral data were missing from the results, or physiological data were not fully reported. Some studies did not justify conducting analyses on subgroups of participants only. No studies reported conflicts of interest (Q4). The funnel plot of effect sizes (see Supplementary Figure S1) is roughly symmetrical, suggesting no publication bias.
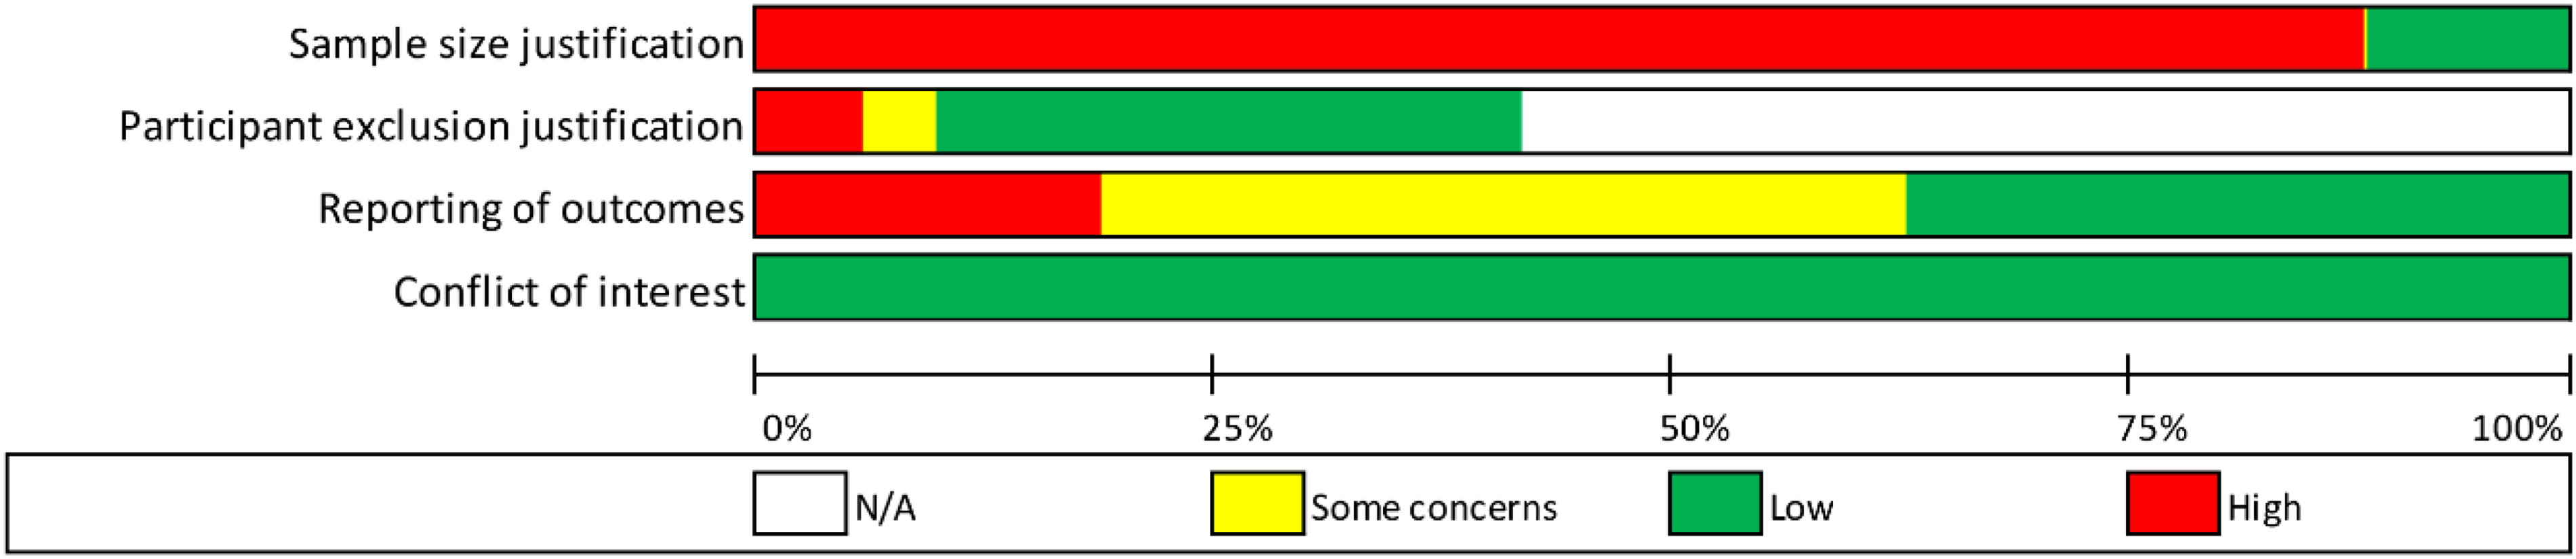
Summary of risk of bias scores for all included studies. Full details of the scoring questions and descriptions of the response categories are shown in Supplementary Table S1. Q1: Did the authors include a sample size justification? Q2: If any participant data is excluded from the analysis is a clear justification given? Q3: Were all the outcome measures in the methods included in the results? Q4: Were there any conflicts of interest? Overall percentage scores were calculated for each level of bias, with green indicating low bias, yellow some concerns, red high and white not-applicable.
Qualitative Synthesis
Five studies were not included in the meta-analyses (see Screening results for details). The influence of motivation on LE in these studies was mixed.
Beatty et al. (1980) compared comprehension of a lecture about computer music in students who were, or were not, offered performance-based course credit as a reward. They found significantly greater comprehension for students in the reward compared to no reward group but no significant listening demand/reward group interaction. Sewell (1985) compared listening comprehension of a “scholarly speech” between students who were told the speech would be similar to other classroom lectures (“boring”) or that the speech was on an interesting and relevant topic (“interesting”). Some participants in the interesting group were also offered a financial reward for achieving high levels of listening comprehension (>90%). The effect of group and financial reward was not statistically significant.
Cahill and Polich (1992) compared event-related potential (ERP) components of “extreme groups” of introverts and extraverts during an auditory discrimination task (tones). The listening task contained four difficulty conditions, based upon the probability of the presentation of the target stimulus. The P3 amplitude showed a significant effect of the interaction between personality, probability and gender. No effects were observed for P3 latency. Using a similar auditory discrimination task, Pritchard (1989) found (i) a significant correlation between P3 amplitude and scores on the Lie scale of the Eysenck Personality Questionnaire and (ii) a significant negative correlation between P3 latency and the Neuroticism scale of the Eysenck Personality Questionnaire. These effects were seen in male but not female participants; combined results were not reported.
Cox et al. (1999) investigated personality traits and self-reported ease of communication in adult hearing aid users. Extraversion-introversion and locus of control did not predict ease of communication when participants were aided or unaided. Extraversion-introversion predicted the change scores (i.e., difference between unaided and aided ratings), accounting for 9.5% of the variance.
Meta-Analyses
Meta-Analysis of Motivational Factors on all LE Outcome Measurements
A meta-analysis of all studies was conducted to determine the effect of motivational factors (collectively) on all LE outcomes. The results revealed an overall positive effect (i.e., LE increased with greater motivation). The random-effects model predicted a small-to-moderate effect size of d = .34 (95% CI = [.28, .40], Z = 17.75, PI = [−.30, .99] p < .001). Note that heterogeneity was in the moderate-to-high range for the majority of nested analyses (Tables 3–6).
The Influence of Motivational Factors
Table 3 shows the results of subgroup analysis A, which compared the effects of motivational factors on each LE outcome. The type of motivational factor significantly influenced LE (Q(3) = 11.91; p = .008, PI = [−.33, 1.00]). To investigate the significant effect of motivational factor type, post hoc analyses were carried out (see Table 4 and Figure 3). A significantly smaller effect size for individual traits was found when compared to perceived competence (Q(1) = 8.81, p = .003). No other post hoc comparisons were significant.

Effect sizes (Cohen's d) for the influence of specific motivational factors on listening effort. Error bars represent 95% confidence intervals for the effect size. Perceived competence had a significantly larger effect compared to individual traits (p = .003).
Post Hoc Tests for Subgroup Analysis A, Averaged Over all Types of LE Outcome Measurements.
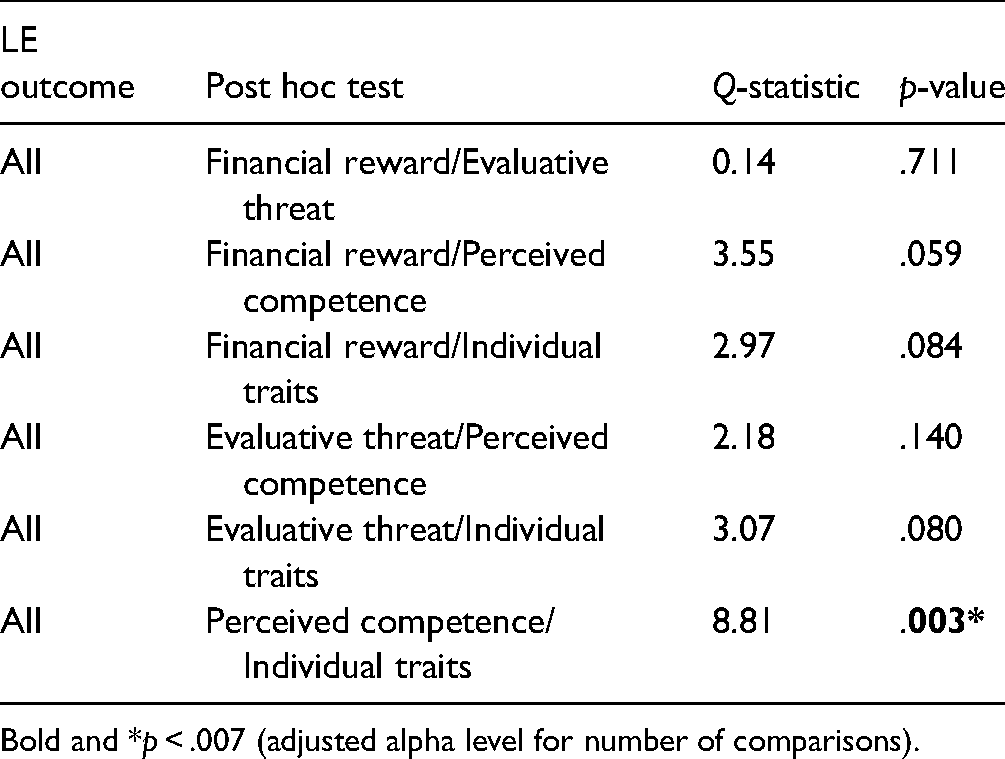
Bold and *p < .007 (adjusted alpha level for number of comparisons).
The Influence of LE Outcome Measurement
Table 5 shows the results of subgroup analysis B, which investigated the influence of LE outcome type. While a positive effect of motivation on LE was found for every LE outcome, the size of the effect did not differ between outcomes (Q(2) = 1.92; p = .383, PI = [−.33, .99]). The results of subgroup analysis C, which compared effect sizes for specific behavioral measures, are reported in Table 5. Motivation had a similar-sized small effect, regardless of whether studies measured LE as performance accuracy or RTs (Q(1) = .01, p = .911, PI = [−.38, .97]). Table 5 also shows the results of subgroup analysis D, which compared effect sizes for specific physiological outcomes. Again, motivation had a similar-sized small positive effect when LE was measured using EEG or pupillometry (Q(1) = .11, p = .743, PI = [−.24, .92]).
Nested Analyses for Specific Motivational Factors Comparing Types of LE Outcomes
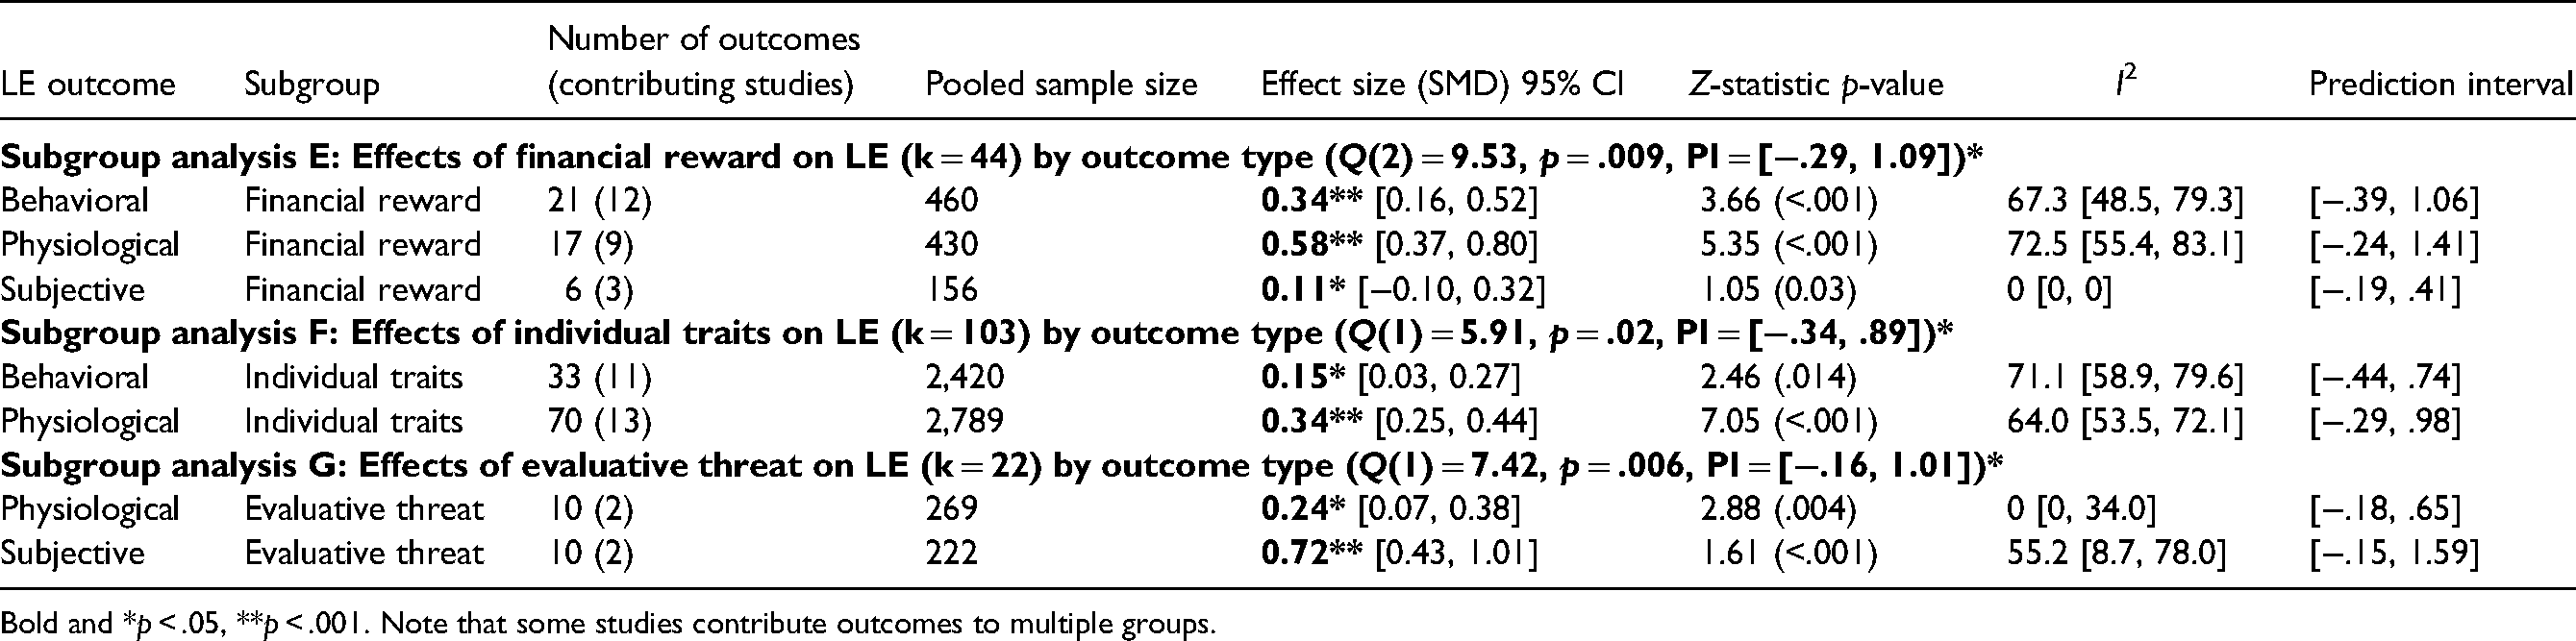
Table 6 shows the results of subgroup analyses used to address RQ3, which asked whether there are differences in effect sizes for different combinations of motivational factors and LE outcomes. Subgroup analysis E (Table 6) compared effect sizes measured with different types of LE outcomes when studies operationalized motivation as financial reward. This analysis showed significant positive effect sizes for studies using behavioral (d = .34, 95% CI = [.16, .52], Z = 3.66, p < .001, PI = [−.39, 1.06]), physiological (d = .58, 95% CI = [.37, .80], Z = 5.35, p < .001, PI = [−.24, 1.41]) and subjective measures (d = .11, 95% CI = [−.10, .32], Z = 1.05, p = .03, PI = [−.19, .41]). When motivation was operationalized as financial reward, there was a significant difference in effect sizes depending upon the type of LE outcome (Q(2) = 9.53, p = .009, PI = [−.29, 1.09]). To investigate the source of this difference, post hoc analyses were carried out to compare effect sizes measured by each type of LE outcome (Table 7 and Figure 4). A significantly larger effect of financial reward was found for physiological measures of LE when compared to subjective measures (Q(1) = 9.53, p = .002).
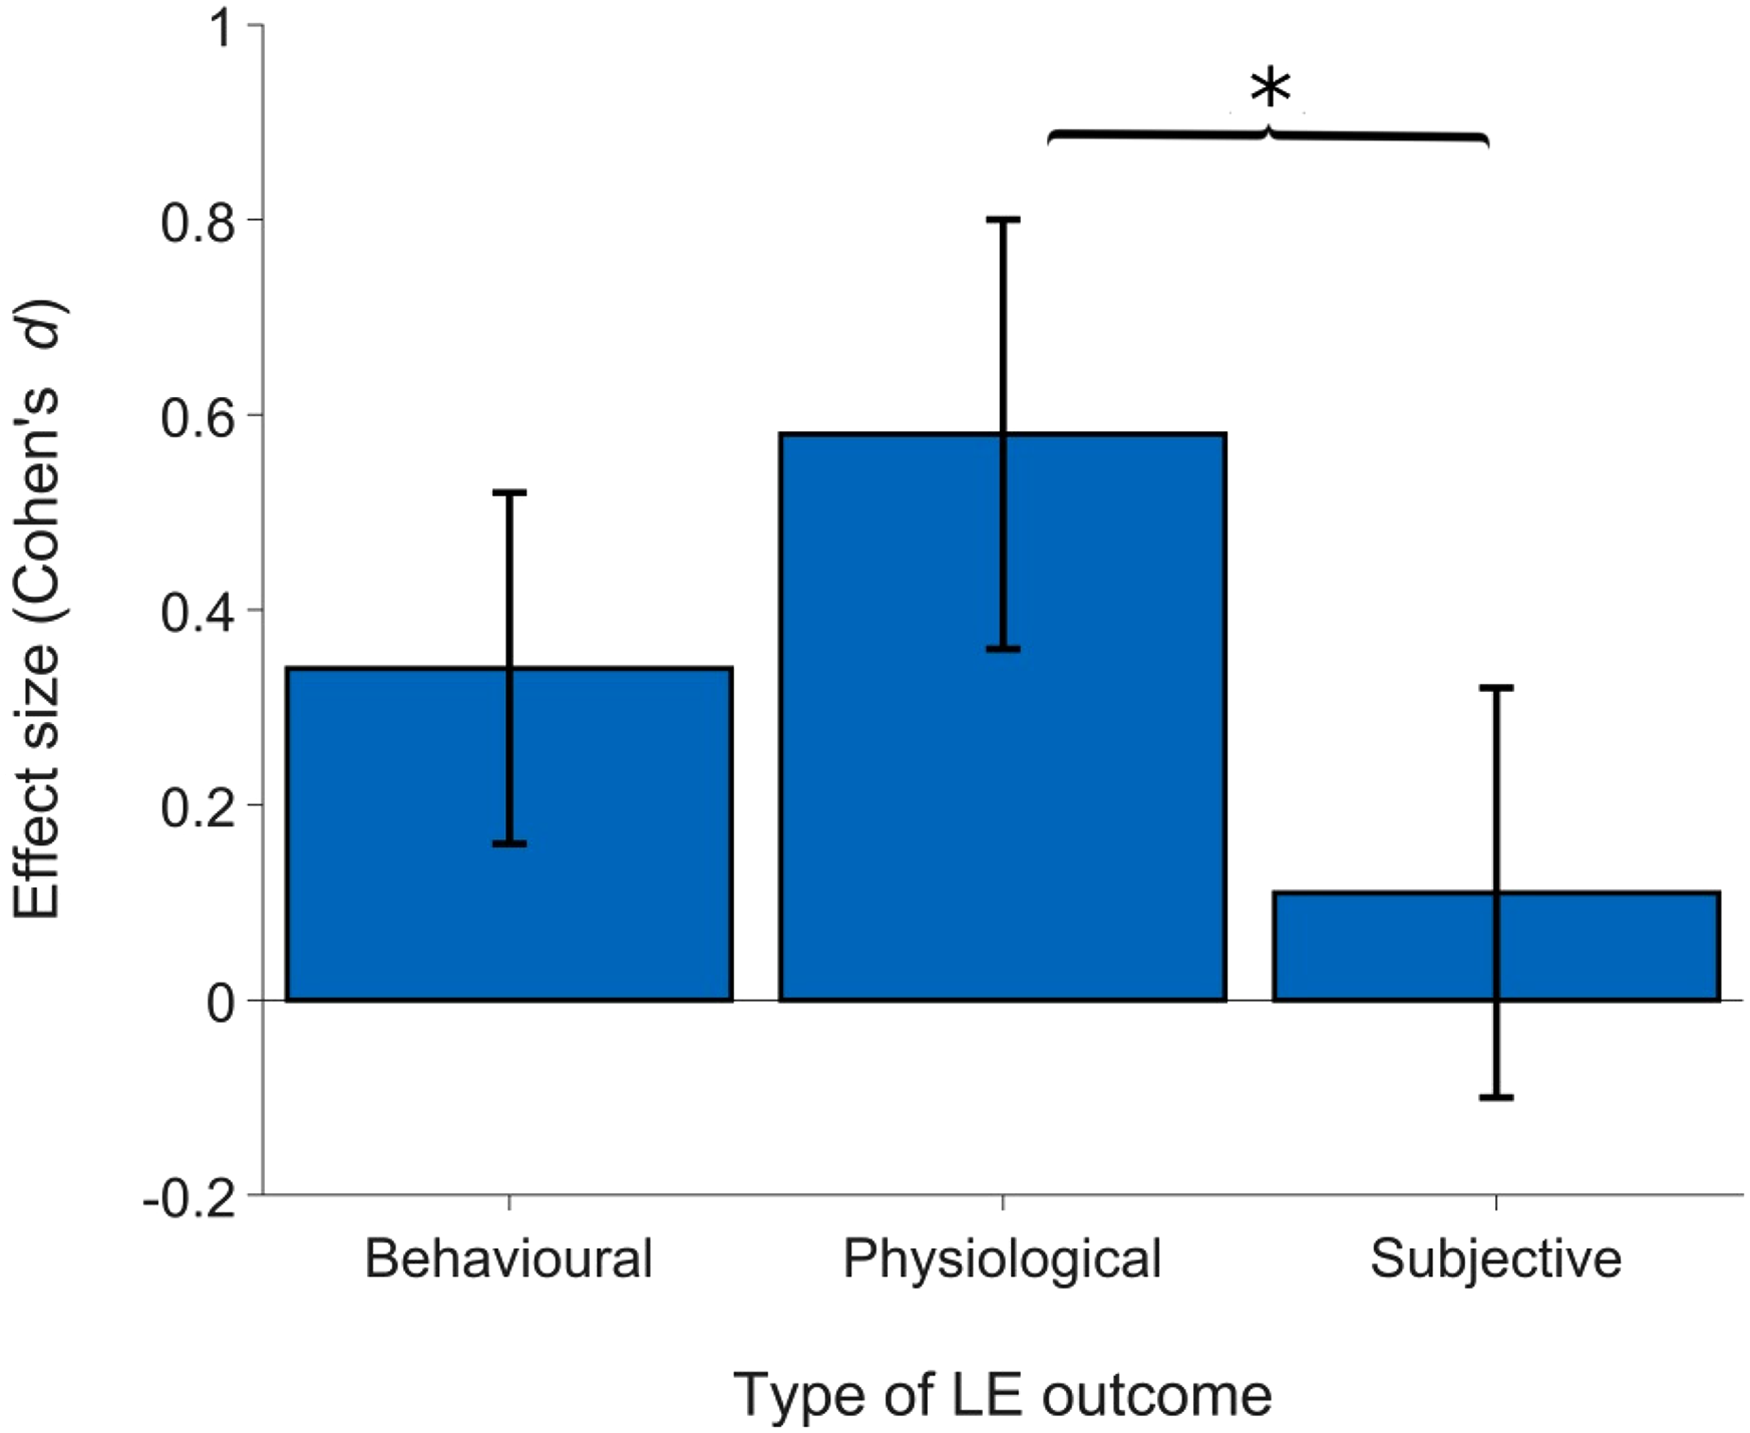
Effect sizes (Cohen's d) measured using different types of LE outcome measurements when motivation is operationalized as financial reward. Error bars represent 95% confidence intervals for the effect size. Physiological measures indexed significantly larger effects compared to subjective measures of LE (p = .002).
Post Hoc Tests for Subgroup Analysis E.

Bold and *p < .017 (adjusted alpha level for number of comparisons).
Subgroup analysis F (Table 6) compared effect sizes measured with different types of LE outcomes for studies investigating individual traits. Subjective outcomes were not included in this analysis due to limited numbers of eligible studies. All types of LE outcomes captured positive effects, but the size of the effect depended upon the type of LE outcome (Q (1) = 5.91, p = .020, PI = [−.34, .89]): a significantly greater effect was seen for physiological (d = .34, 95% CI = [.25, .44], Z = 7.05, p < .001, PI = [−.29, .98]) compared to behavioral (d = .15, 95% CI = [.03, .27], Z = 2.46, p = .014, PI = [−.44, .74]) outcomes.
Finally, subgroup analysis G (Table 6) considered studies operationalizing motivation as evaluative threat. Due to limited numbers of eligible studies, behavioral outcomes were omitted from this analysis. Again, positive effects were captured using all types of LE outcomes, but the type of LE outcome influenced the size of the effect (Q(1) = 7.42, p = .006, PI = [−.16, 1.01]): a significantly greater positive effect was seen for subjective (d = .72, 95% CI = [.43, 1.01], Z = 1.61, p < .001, PI = [−.15, 1.59]) compared to physiological outcomes (d = .24, 95% CI = [.07, .38], Z = 2.88, p = .004, PI = [−.18, .65]).
Discussion
A systematic review and meta-analysis was carried out to quantify the relationship between motivational factors and types of LE outcomes for the first time. We used random-effects meta-analyses with subgroups to investigate differences in effect sizes for different motivational factors and types of LE outcomes on the expenditure or experience of LE. When LE outcomes were considered collectively, nested analyses showed differences in effect sizes for motivational factors (perceived competence cf. individual traits). When all motivational factors were combined, similar effect sizes were measured using subjective, behavioral and physiological LE outcomes. Comparisons of specific exemplars of LE outcome measurements (where permitted due to study numbers) revealed similar effect sizes. However, for certain motivational factors (financial reward, individual traits and evaluative threat), the type of LE outcome influenced the size of the measured effect.
Quality of Evidence
The risk of bias was generally high due to lack of sample size justification. Concerns were also raised about missing or incomplete outcome reporting. These quality issues reduce confidence in the effect sizes presented here.
The Influence of Motivational Factors on LE
The primary meta-analysis (which considered all motivational factors and all LE outcomes) suggested that listeners expended or experienced greater effort if motivation was high. This supports a role of motivation in the allocation of resources to listening tasks, as outlined by several models and frameworks for example FUEL (Pichora-Fuller et al., 2016), MIT (Brehm & Self, 1989), CET (Kruglanski et al., 2012), and the Model of Listening Engagement (Herrmann & Johnsrude, 2020).
In our meta-analysis, all motivational factors showed positive effects on LE outcomes. This result may have occurred because these motivational factors increase LE investment by appealing to basic psychological needs (Dweck, 2017). Need-press theory (Murray, 1938) predicts that environmental factors, or “presses”, influence how psychological needs regulate behavior. The motivational factors considered in this review may activate different underlying needs, for example financial reward and perceived competence may “press” upon needs in the domains of materialism and human power, respectively, leading to increased LE. Individual traits are also posited to be related to underlying psychological needs, which give rise to characteristic styles of goal pursuit (Dweck, 2017).
Studies operationalizing motivation as individual traits captured significantly smaller effect sizes compared to extrinsic manipulations of motivation, that is, perceived competence. As variability in individual traits within participant samples can be low, some of the studies (Beauducel et al., 2006; Brocke et al., 1996; Cahill & Polich, 1992; Daruna et al., 1985; Ditraglia & Polich, 1991; Enge et al., 2008; Ortiz & Maojo, 1993; Rammsayer & Stahl, 2004; Schmidt et al., 2004; Tune, 1966) compared participants at the extreme ends of the distribution (usually those scoring in the upper and upper lower quartiles). This procedure is commonly used within personality research to increase statistical power (see Preacher et al., 2005 for discussion of the strengths and limitations of this approach). For researchers interested in the connection between motivational trait differences and LE, an extreme group procedure is worth considering to increase the likelihood of producing robust results.
The Influence of Outcome Selection on LE
An overall positive effect of motivational factors was detected using subjective, behavioral and physiological LE outcome measurements, with no significant differences in effect sizes between outcome types. However, there may be differences in sensitivity to motivation for the different types of LE outcomes which are not apparent in the subgroup analyses presented here due to the broad categorization of subjective, behavioral, or physiological LE outcomes. The inclusion of different measures within the same LE outcome domain may contribute to the high heterogeneity in the subgroup analyses (see Caveats).
Finer-grained comparison was limited due to the small numbers of studies, however, we were able to compare effects measured using two behavioral (RT and performance accuracy) and two physiological LE outcomes (pupillometry and EEG). Motivation produced a similar-sized small increase in LE when measured by either performance accuracy or RTs. The FUEL posits that when an individual's resource capacity is under strain or exceeded, performance errors and a reduction in processing speed may occur, which can allow inferences about LE. The FUEL also notes that RTs are not a process pure measure (Pichora-Fuller et al., 2016) as they may also index other aspects of cognition such as memory. Improved speech recognition accuracy may be interpreted as an increase in LE (e.g., DeWall et al., 2011; Plain et al., 2020; Zhang et al., 2019), However, performance accuracy may also be considered as a measure of achievement, rather than effort (Gendolla & Richter, 2010). Some studies found that performance accuracy remained stable while other measures of LE changed, for example an increase in RTs but no change in task accuracy in response to greater listening demands (Sarampalis et al., 2009; Strand et al., 2020). The divergence between task accuracy and RTs in these studies supports a theoretical distinction between performance effectiveness (i.e., quality of task performance) and processing efficiency (effectiveness in relation to effort) (Eysenck & Calvo, 1992). In the present meta-analysis, similar sized positive effects were measured with both performance accuracy and RTs, but these outcomes may not necessarily index the same LE construct.
Similar positive effect sizes were also measured using pupillometry and EEG. Studies which contributed towards the overall positive effect for EEG outcomes (e.g., Brocke et al., 1996; Carrillo-de-la-Pena and Cadaveira, 2000; Enge et al., 2008; Ortiz and Maojo, 1993) found an increased P3 amplitude with motivation or motivational traits. For pupillometry, the overall positive effect reflects results showing increased pupil dilation in high compared to low motivation conditions (e.g., Bijleveld et al., 2009; Koelewijn et al., 2018; Zekveld et al., 2019; Zhang et al., 2019). P3 amplitude and pupil dilation may both index activity in the locus coeruleus noradrenergic system, which is associated with regulation of task engagement (Murphy et al., 2011). Due to a limited number of outcomes in the included studies, only these two specific physiological measures could be compared in the present study. Notably, a few studies found physiological effects of motivation (change in pupil size or cardiac response) in the absence of behavioral and/or subjective effects (Koelewijn et al., 2018; Richter, 2016). Increased physiological arousal may reflect the “cost” required to maintain performance under increased task demands (Kahneman, 1973). However, concurrent changes in behavioral and/or subjective measures would increase confidence that the physiological changes reflect the influence of motivation on LE as physiological measures of LE may index multiple processes. For example, Zekveld et al. (2018) discuss the sensitivity of the pupil dilation response to various task manipulations and intra-individual differences.
Combinations of Motivational Factors and Types of LE Outcomes Influence LE Effect Sizes
Subgroup analyses investigated combinations of motivational factors and types of LE outcomes. These analyses revealed significant differences in effect sizes for financial reward, evaluative threat and individual traits, depending upon the type of LE outcome. These differential effects may help inform research planning decisions when investigating motivation and LE. For instance, if researchers are interested in the effect of evaluative threat on LE, using subjective rather than physiological measures would be advisable, based on the results of the meta-analyses presented here. When investigating individual traits or financial reward, physiological measures may be optimal compared with behavioral and subjective measures, respectively. However, note that the effect size associated with subjective measures was based on only six outcomes. At least 10 observations are recommended for subgroup analyses (Higgins et al., 2019). However, 10 observations would be insufficient if covariates are distributed unevenly across studies and, in general, subgroup analyses should be interpreted cautiously where the number of observations is low (Higgins et al., 2019). Although certain combinations of motivational traits/LE outcomes may produce bigger effect sizes than others, it is important to note that PIs encompassed zero for all factor/outcome type combinations and therefore null or negative effects may be observed in future studies.
Differences in effect sizes are consistent with the notion that LE is a multi-factorial construct (Alhanbali et al., 2019; Herrmann & Johnsrude, 2020; Hughes et al., 2018; McMahon et al., 2016; Pichora-Fuller et al., 2016; Strand et al., 2018; Strauss & Francis, 2017). However, here we quantified differences between types of LE outcomes only when considering specific motivational factors. Particular types of LE outcomes may be sensitive to certain motivational factors for several reasons. For example, biological differences may underlie trait behaviors, for example relative to introverts, extraverts are suggested to have lower levels of cortical arousal (Eysenck, 1967) and this may explain why larger effect sizes were measured for individual traits using physiological outcomes. The finding of larger effect sizes for subjective compared to physiological LE outcomes, when motivation is operationalized as evaluative threat, may be due to the small number of studies that used cardiac reactivity to measure LE: cardiac reactivity is posited to be particularly sensitive to increases in effort due to fear of social evaluation (Gendolla & Richter, 2010). The large effect size for subjective LE outcomes suggests that evaluative threat elicits a range of effort-related listening experiences, as the studies included in the meta-analysis used questions gauging effort, likelihood of quitting and desire to control the situation (Picou & Ricketts, 2014; Zekveld et al., 2019). However, evaluative threats may increase anxious thoughts which can occupy working memory (Eysenck et al., 2007; Putwain et al., 2014) and effortful listening may rely on working memory capacity (Rönnberg et al., 2019). High levels of anxiety may lead to reduced processing capacity for the task at hand and result in poorer performance (Eysenck et al., 2007; Eysenck & Calvo, 1992).
Caveats
Heterogeneity was in the moderate-to-high range for the subgroup analyses included in this systematic review. Inconsistency measures of 25%, 50%, and 75% are usually interpreted as low, moderate and high levels of heterogeneity, respectively (Higgins & Thompson, 2002). The high levels of heterogeneity in the meta-analyses presented here are comparable with other systematic reviews of experimental psychology research (e.g., Hirst et al., 2018; Rung and Madden, 2018). Within audiology research, a meta-analysis of experimental studies investigating whether probe-tube verification of real-ear hearing aid amplification characteristics improves outcomes in adults identified high heterogeneity (I2 : 61–100%) for a number of subgroup analyses (Almufarrij et al., 2021). Heterogeneity in the present analysis may have arisen due to between-study differences in participant characteristics (age, gender, hearing level, etc.), variation in the operationalization of listening demands (e.g., single or dual tasks, vocoded speech or speech presented in a noise background) and stimulus complexity (e.g., tones, digits, or spoken sentences). There is also variation in how motivational factors were operationalized within each category. For instance, studies using financial reward to motivate participants offered different amounts of financial reward, for example in the high motivation condition Bijleveld et al. (2009) offered 50 Euros, Koelewijn et al. (2018) offered 5 Euros. Some studies compared effects of “high” and “low” levels of financial reward (Asbjörnsen et al., 1992; Bijleveld et al., 2009; Carolan et al., 2021; Kahneman et al., 1968; Kahneman & Peavler, 1969), other designs compared a financial reward condition to a no financial reward condition (Kang et al., 2017; Snyder & Snyder, 1956) or required strategic allocation of LE to maximize reward (Gilzenrat et al., 2010; Zhang, 2017; Zhang et al., 2019).
As the practical implications of the observed heterogeneity, expressed as I2, are not always clear, we also calculated PIs, which show the range of effect sizes that researchers can expect when planning future studies using similar paradigms to those included in the meta-analysis. Where there is substantial heterogeneity in a meta-analysis, the prediction interval has a wider range than the 95% CI of the standardized mean difference; thus it may be misleading to only present the standardized mean difference and its CI, since the PIs may reveal potential values on both sides of the null (IntHout et al., 2016). All the PIs in the present meta-analysis contained values on both sides of the null, thus inconsistent results are possible using the same motivational factor/LE outcome. For example, this could explain why Richter (2016) found a significant increase in LE measured using cardiac reactivity (pre-ejection period, PEP) when participants were offered performance-based financial reward, while Plain et al. (2020), found null results for the effects of financial reward on PEP reactivity.
As discussed above, the majority of studies in this review did not include a power analysis. Regardless of the size of a statistical effect, the occurrence of both type S and type M errors is substantially inflated when statistical power is low (Gelman & Carlin, 2014). A type S error is the probability that the estimated effect has the wrong sign, that is that the estimate indicates a positive effect when in fact the true effect is negative or vice versa (Kirby & Sonderegger, 2018). Type S errors may explain inconsistencies within the literature for some measures, for example these errors may account for the differential effects of motivation on RTs reported in the included studies (Carolan et al., 2021; Carrillo-de-la-Pena & Cadaveira, 2000; Kang et al., 2017; Strand et al., 2018; Weis et al., 2013). A type M error is the extent to which the magnitude of an effect of interest is exaggerated, based on the estimated effect size of the study. It is possible that type M errors may account for outliers in the meta-analyses (see Supplementary Figure S1). We therefore urge researchers in the field to ensure that future studies of the effects of motivation on LE are adequately powered and that the results of power calculations are fully reported.
The effect of motivation is proposed to be greatest when tasks are demanding (Brehm & Self, 1989). If listening is perceived to be too difficult then participants may decide to disengage, which may have impacted upon the results of the meta-analyses presented here: we decided to include either an effect size for the interaction, or if not available, the effect size from the most demanding conditions, when studies utilized multiple listening demand conditions (see Methods: Meta-analysis strategy).
Conclusion
All motivational factors considered here, in the first meta-analysis of motivation and LE, increased the experience and/or exertion of LE. Therefore it is important to consider motivational context when designing and interpreting LE studies. External manipulations of motivation (e.g., perceived competence) elicited more robust effect sizes compared to individual traits. For certain motivational factors (individual traits, evaluative threat, financial rewards), effect sizes were dependent upon LE outcome measurement. Further research into the relationship between motivation and LE should be guided by this review, which, for the first time, highlights combinations of LE outcomes and motivational factors that are likely to produce the most robust effects on LE.
Supplemental Material
sj-docx-1-tia-10.1177_23312165211059982 - Supplemental material for Quantifying the Effects of Motivation on Listening Effort: A Systematic Review and Meta-Analysis
Supplemental material, sj-docx-1-tia-10.1177_23312165211059982 for Quantifying the Effects of Motivation on Listening Effort: A Systematic Review and Meta-Analysis by Peter J Carolan, Antje Heinrich and Kevin J Munro, Rebecca E Millman in Trends in Hearing
Supplemental Material
sj-docx-2-tia-10.1177_23312165211059982 - Supplemental material for Quantifying the Effects of Motivation on Listening Effort: A Systematic Review and Meta-Analysis
Supplemental material, sj-docx-2-tia-10.1177_23312165211059982 for Quantifying the Effects of Motivation on Listening Effort: A Systematic Review and Meta-Analysis by Peter J Carolan, Antje Heinrich and Kevin J Munro, Rebecca E Millman in Trends in Hearing
Supplemental Material
sj-docx-3-tia-10.1177_23312165211059982 - Supplemental material for Quantifying the Effects of Motivation on Listening Effort: A Systematic Review and Meta-Analysis
Supplemental material, sj-docx-3-tia-10.1177_23312165211059982 for Quantifying the Effects of Motivation on Listening Effort: A Systematic Review and Meta-Analysis by Peter J Carolan, Antje Heinrich and Kevin J Munro, Rebecca E Millman in Trends in Hearing
Supplemental Material
sj-docx-4-tia-10.1177_23312165211059982 - Supplemental material for Quantifying the Effects of Motivation on Listening Effort: A Systematic Review and Meta-Analysis
Supplemental material, sj-docx-4-tia-10.1177_23312165211059982 for Quantifying the Effects of Motivation on Listening Effort: A Systematic Review and Meta-Analysis by Peter J Carolan, Antje Heinrich and Kevin J Munro, Rebecca E Millman in Trends in Hearing
Supplemental Material
sj-png-5-tia-10.1177_23312165211059982 - Supplemental material for Quantifying the Effects of Motivation on Listening Effort: A Systematic Review and Meta-Analysis
Supplemental material, sj-png-5-tia-10.1177_23312165211059982 for Quantifying the Effects of Motivation on Listening Effort: A Systematic Review and Meta-Analysis by Peter J Carolan, Antje Heinrich and Kevin J Munro, Rebecca E Millman in Trends in Hearing
Supplemental Material
sj-png-6-tia-10.1177_23312165211059982 - Supplemental material for Quantifying the Effects of Motivation on Listening Effort: A Systematic Review and Meta-Analysis
Supplemental material, sj-png-6-tia-10.1177_23312165211059982 for Quantifying the Effects of Motivation on Listening Effort: A Systematic Review and Meta-Analysis by Peter J Carolan, Antje Heinrich and Kevin J Munro, Rebecca E Millman in Trends in Hearing
Supplemental Material
sj-png-7-tia-10.1177_23312165211059982 - Supplemental material for Quantifying the Effects of Motivation on Listening Effort: A Systematic Review and Meta-Analysis
Supplemental material, sj-png-7-tia-10.1177_23312165211059982 for Quantifying the Effects of Motivation on Listening Effort: A Systematic Review and Meta-Analysis by Peter J Carolan, Antje Heinrich and Kevin J Munro, Rebecca E Millman in Trends in Hearing
Supplemental Material
sj-png-8-tia-10.1177_23312165211059982 - Supplemental material for Quantifying the Effects of Motivation on Listening Effort: A Systematic Review and Meta-Analysis
Supplemental material, sj-png-8-tia-10.1177_23312165211059982 for Quantifying the Effects of Motivation on Listening Effort: A Systematic Review and Meta-Analysis by Peter J Carolan, Antje Heinrich and Kevin J Munro, Rebecca E Millman in Trends in Hearing
Supplemental Material
sj-png-9-tia-10.1177_23312165211059982 - Supplemental material for Quantifying the Effects of Motivation on Listening Effort: A Systematic Review and Meta-Analysis
Supplemental material, sj-png-9-tia-10.1177_23312165211059982 for Quantifying the Effects of Motivation on Listening Effort: A Systematic Review and Meta-Analysis by Peter J Carolan, Antje Heinrich and Kevin J Munro, Rebecca E Millman in Trends in Hearing
Supplemental Material
sj-png-10-tia-10.1177_23312165211059982 - Supplemental material for Quantifying the Effects of Motivation on Listening Effort: A Systematic Review and Meta-Analysis
Supplemental material, sj-png-10-tia-10.1177_23312165211059982 for Quantifying the Effects of Motivation on Listening Effort: A Systematic Review and Meta-Analysis by Peter J Carolan, Antje Heinrich and Kevin J Munro, Rebecca E Millman in Trends in Hearing
Supplemental Material
sj-png-11-tia-10.1177_23312165211059982 - Supplemental material for Quantifying the Effects of Motivation on Listening Effort: A Systematic Review and Meta-Analysis
Supplemental material, sj-png-11-tia-10.1177_23312165211059982 for Quantifying the Effects of Motivation on Listening Effort: A Systematic Review and Meta-Analysis by Peter J Carolan, Antje Heinrich and Kevin J Munro, Rebecca E Millman in Trends in Hearing
Supplemental Material
sj-png-12-tia-10.1177_23312165211059982 - Supplemental material for Quantifying the Effects of Motivation on Listening Effort: A Systematic Review and Meta-Analysis
Supplemental material, sj-png-12-tia-10.1177_23312165211059982 for Quantifying the Effects of Motivation on Listening Effort: A Systematic Review and Meta-Analysis by Peter J Carolan, Antje Heinrich and Kevin J Munro, Rebecca E Millman in Trends in Hearing
Footnotes
Acknowledgments
This work was supported by the NIHR Manchester Biomedical Research Centre (BRC-1215-20007). The authors thank the corresponding authors of the studies for sharing data not reported in the publications and for responding to our queries.
Declaration of Conflicting Interests
The authors declared no potential conflicts of interest with respect to the research, authorship, and/or publication of this article.
Funding
This work was funded by the NIHR Manchester Biomedical Research Centre (BRC-1215-20007).
Supplemental Material
Supplemental material for this article is available online.
References
Supplementary Material
Please find the following supplemental material available below.
For Open Access articles published under a Creative Commons License, all supplemental material carries the same license as the article it is associated with.
For non-Open Access articles published, all supplemental material carries a non-exclusive license, and permission requests for re-use of supplemental material or any part of supplemental material shall be sent directly to the copyright owner as specified in the copyright notice associated with the article.