
Abstract
Stimulus-frequency otoacoustic emissions (SFOAEs) can be useful tools for assessing cochlear function noninvasively. However, there is a lack of reports describing their utility in predicting hearing capabilities. Data for model training were collected from 245 and 839 ears with normal hearing and sensorineural hearing loss, respectively. Based on SFOAEs, this study developed an objective assessment system consisting of three mutually independent modules, with the routine test module and the fast test module used for threshold prediction and the hearing screening module for identifying hearing loss. Results evaluated via cross-validation show that the routine test module and the fast test module predict hearing thresholds with similar performance from 0.5 to 8 kHz, with mean absolute errors of 7.06–11.61 dB for the routine module and of 7.40–12.60 dB for the fast module. However, the fast module involves less test time than is needed in the routine module. The hearing screening module identifies hearing status with a large area under the receiver operating characteristic curve (0.912–0.985), high accuracy (88.4–95.9%), and low false negative rate (2.9–7.0%) at 0.5–8 kHz. The three modules are further validated on unknown data, and the results are similar to those obtained through cross-validation, indicating these modules can be well generalized to new data. Both the routine module and fast module are potential tools for predicting hearing thresholds. However, their prediction performance in ears with hearing loss requires further improvement to facilitate their clinical utility. The hearing screening module shows promise as a clinical tool for identifying hearing loss.
Keywords
Introduction
Audiometric thresholds are the current gold standard for quantitatively evaluating the degree of hearing loss. Pure tone audiometry (PTA) requires subjective responses from individuals and is susceptible to confounding factors such as attention and mental state, making it challenging to apply to certain populations who cannot provide reliable responses to sounds. Electrophysiological measures, such as auditory brainstem response (ABR), can objectively estimate hearing thresholds (Gorga et al., 2006). However, accurate estimates of hearing thresholds from ABR generally rely on skilled human interpretation of recorded responses, making ABR testing expensive and time-consuming (Mertes & Goodman, 2013). It is therefore worthwhile to investigate the accuracy of predicting hearing thresholds from other potentially available objective measures.
Generated as a by-product of the normal function of outer hair cells (OHCs) within the cochlea (Brownell, 1990; Kemp, 1978; Shera & Guinan, 1999), otoacoustic emissions (OAEs) can be useful tools for the non-invasive assessment of cochlear function (for review see (Robinette & Glattke, 2007)). When cochlear damage that affects the OHCs exists, elevated hearing thresholds, as well as reduced or absent OAEs, are measured. These observations lead to the application of OAE measurements in identifying hearing loss. OAEs are appealing as they can obtain information about the health and integrity of the cochlea and sensory cells. Moreover, OAE testing is performed by placing a small probe in the ear canal, which is non-invasive, affordable and easy to perform (Mertes & Goodman, 2013). Distortion-product OAEs (DPOAEs) and transient-evoked OAEs (TEOAEs) have been routinely measured in clinical settings and are widely used in universal newborn hearing screening and differential diagnostics. A large number of studies indicate that DPOAEs and TEOAEs can identify hearing status (normal hearing vs. hearing loss) (Go et al., 2019; Gorga et al., 1993a; b; Hurley & Musiek, 1994; Mertes & Goodman, 2013; Prieve et al., 1993; Stover et al., 1996). In addition to this simple dichotomous decision, other studies (Gorga et al., 2003; Johnson et al., 2007) proposed an approach that permits individual threshold prediction from DPOAE input/output (I/O) functions. However, large standard errors between the predicted and measured hearing thresholds are still present in these studies. Improved quantitative predictions of hearing thresholds from OAEs are of continued interest in clinical applications.
Stimulus-frequency OAEs (SFOAEs) are sound signals evoked by tonal probes and originate at the same place as the probe in the cochlea (Kemp & Chum, 1980). They are thought to provide most place-specific responses among OAEs (Charaziak et al., 2013; Shera & Guinan, 1999). Moreover, SFOAEs predominantly arise as reflections from a localized region near the peak of the traveling wave (Zweig & Shera, 1995), which are easier to interpret than DPOAEs at the cubic difference frequency,
Machine learning approaches such as support vector machine (SVM), k-nearest neighbor (KNN), back-propagation neural network (BPNN), decision tree, and random forest excel at developing models from large, complex, and information-rich data sets, and are highly effective in solving many complex nonlinear problems. They can automatically learn rules from the input data and then predict the unknown data. Until recently, machine learning techniques have been widely applied to predict sudden sensorineural hearing loss (Bing et al., 2018), noise-induced hearing impairment (Zhao et al., 2019), and sensorineural hearing loss (SNHL) in different inner ear pathologies (Shew et al., 2019). They have been demonstrated to be powerful tools for predicting various types of hearing loss. A preliminary study from our laboratory used BPNN to investigate the ability of SFOAEs to predict hearing thresholds and status for the first time (Gong et al., 2020). The outcomes for different machine learning algorithms were further compared to maximize the potential of SFOAEs in predicting hearing capabilities (Liu et al., 2020), and we found that BPNN, KNN, and SVM algorithms performed well in such hearing prediction tasks. On the basis of these prior studies, BPNN, KNN, and SVM algorithms were selected as the candidates in this study, and we aimed to directly develop an objective system for the prediction of hearing capabilities and validate it on new unknown data.
In this study, a hardware platform consisting of the main control computer, external sound card, power amplifier, miniature speaker and miniature microphone was constructed. Based on this platform, a system for SFOAE recording was developed. Then, we trained machine learning-based models using a large data set of SFOAEs and behavioral thresholds measured in the same ears, and developed an assessment system that allowed the prediction of hearing thresholds and screening for SNHL at several conventional PTA test frequencies (0.5, 1, 2, 4, and 8 kHz). The SFOAE-based assessment system contained three mutually independent test modules, two of which played the same role, that is, providing a quantitative estimate of hearing threshold, but differed from each other in time efficiency, while the other was designed to make dichotomous decisions in identifying the presence or absence of hearing loss. Finally, all of modules were validated on an extra unknown data set.
Materials and Methods
Instrumental Design
Figure 1 shows a diagram of the system connection (Figure 1A) and the actual hardware (Figure 1B). The system hardware consists of the main control computer, external sound card, power amplifier, miniature speaker and miniature microphone. A computer-generated digital signal was converted to an analog electrical signal using a 24-bit sound card (Fireface UC, RME, Haimhausen, Germany) with a sampling rate of 48 kHz. This signal was amplified by a custom power amplifier designed and developed by ourselves, whose output was transduced to an acoustic signal through the loudspeakers (ER-2, Etymotic Research, Elk Grove Village, IL, USA) and presented to the ear via tubes. A probe containing miniature loudspeakers and a microphone was inserted into the ear. In the signal acquisition pathway, acoustic signals recorded in the ear canal were transduced into an electrical signal by a low-noise miniature microphone (ER-10B + , Etymotic Research, Elk Grove Village, IL, USA) with an amplification of 20 dB, which was then converted to a digital signal via the sound card, and sent back to the computer. The assessment system was developed using C sharp programming language (Microsoft Inc., Redmond, WA, USA) and MATLAB (MathWorks Inc., Natick, MA, USA). Calibration was conducted with reference to the sound pressure level (SPL) at half octave frequencies from 0.125 to 8 kHz. The probe was inserted into a Brüel & Kjær coupler (IEC 711 standard, Type 4157, Nærum, Denmark) and the SPL was measured by the coupler microphone. With this method, we assumed that the voltage that produces the desired SPL in the coupler would produce the same SPL in the ear canal. The probe microphone was calibrated using the coupler microphone as the reference. Following the calibration procedure, multiple probe tones with different SPLs were presented to the earphone to ensure that the SPLs presented equaled the SPLs recorded by the coupler microphone and the total ear canal SPLs at the microphone of ER-10B + (error
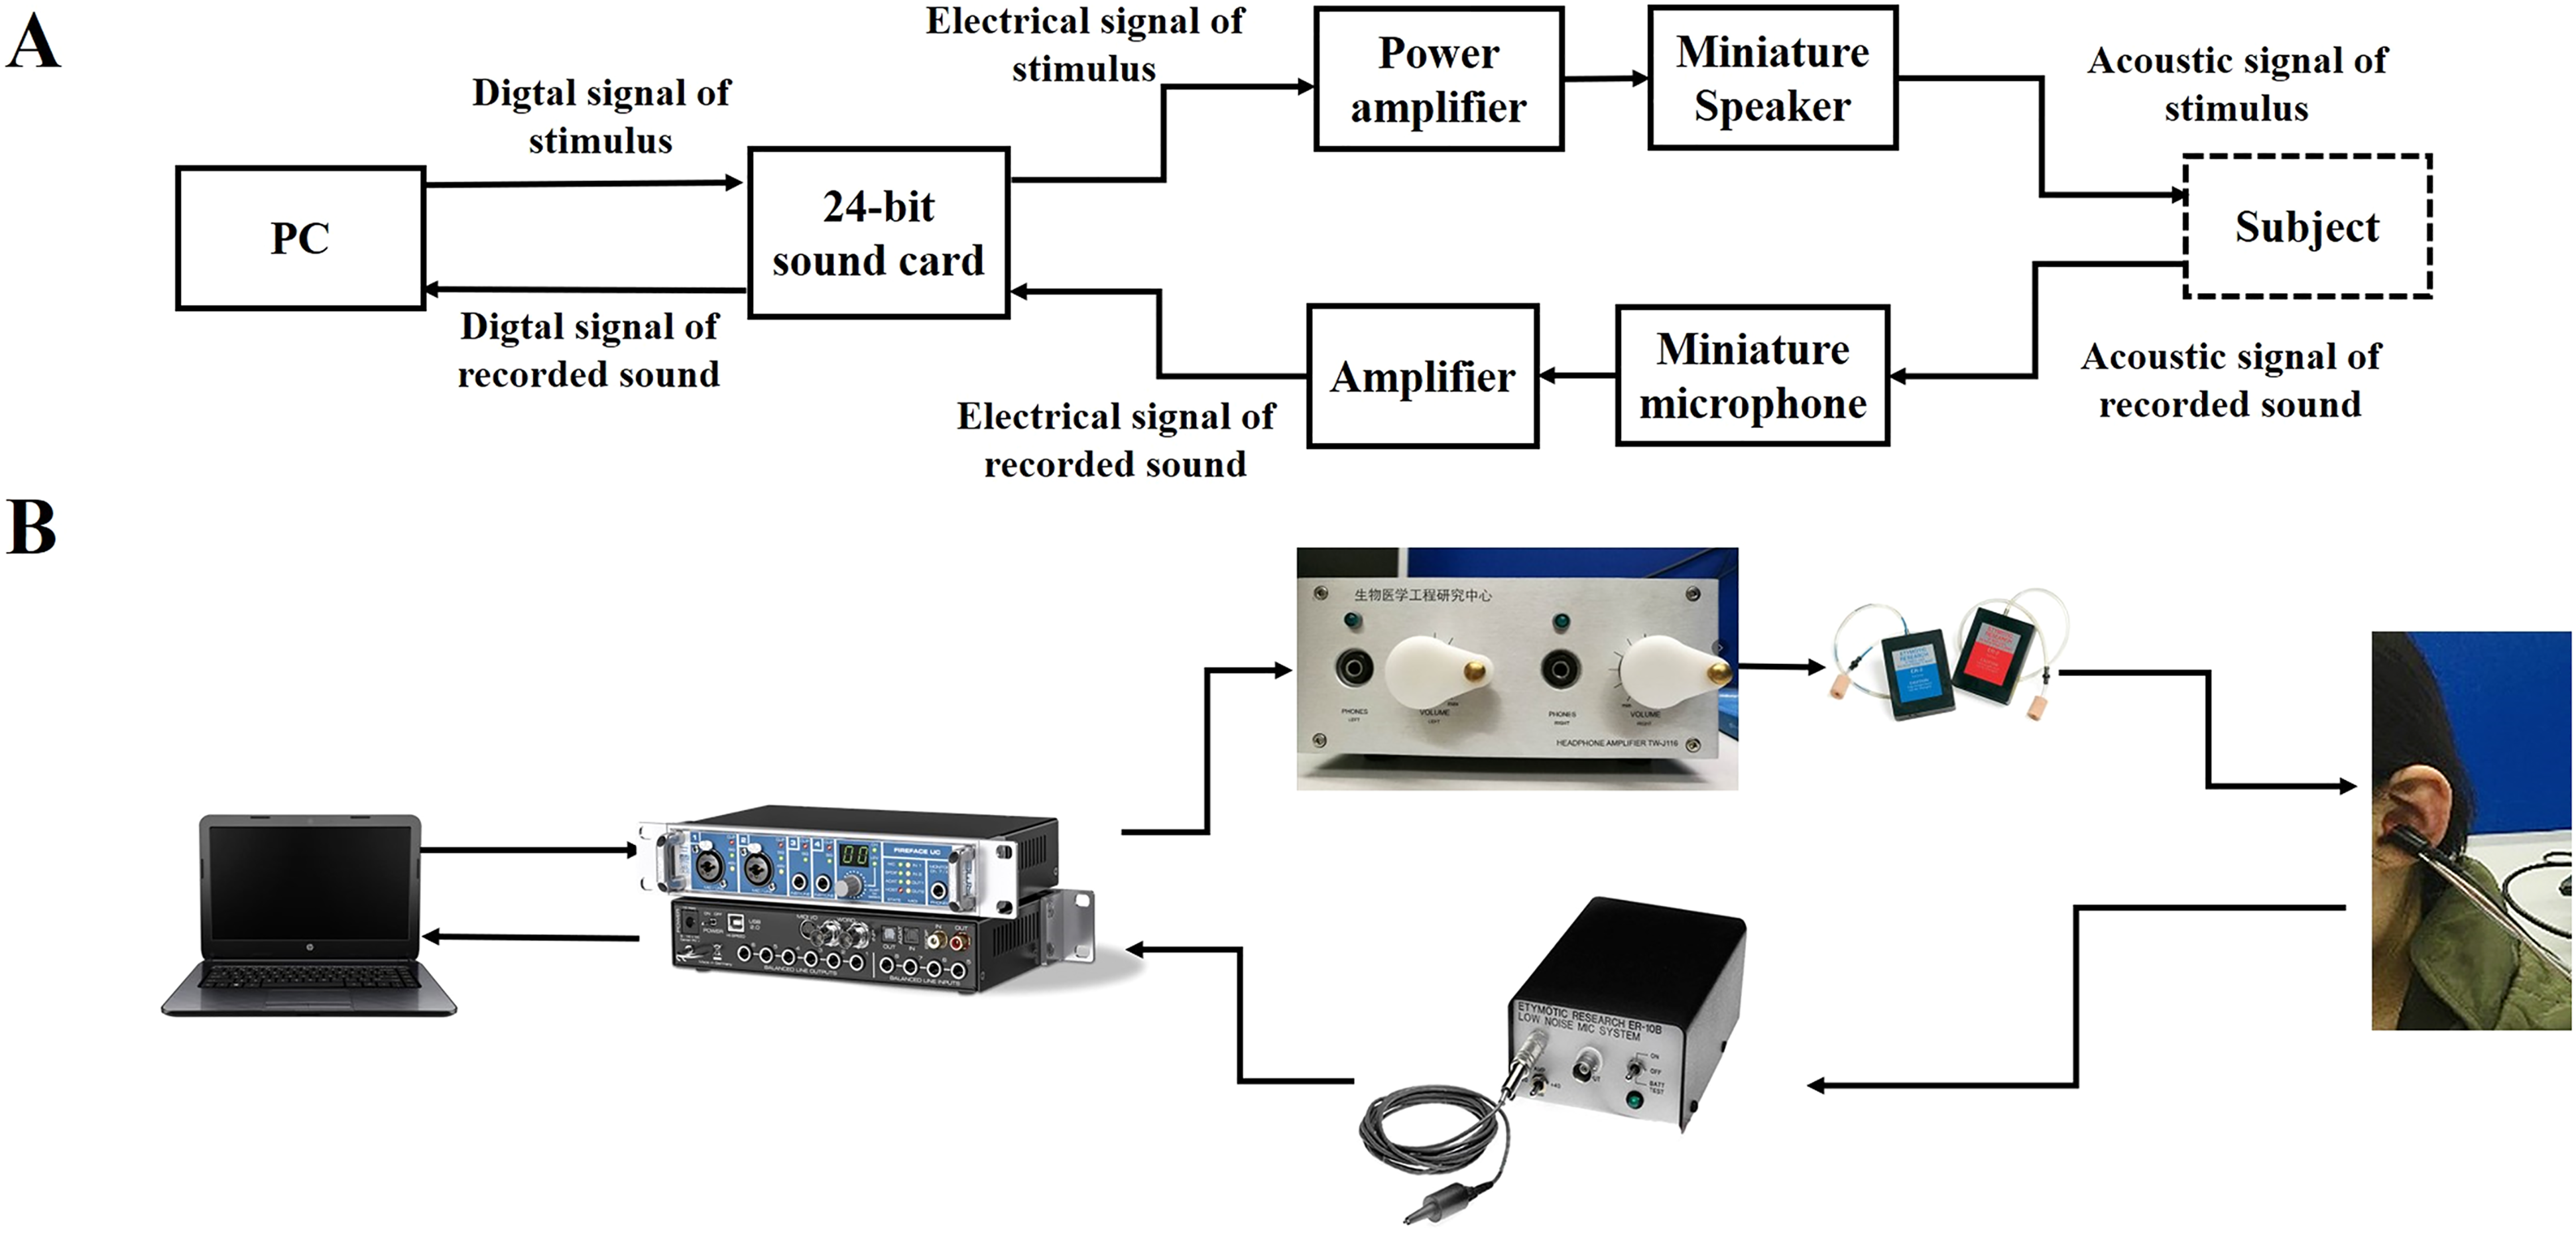
A, schematic connection diagram of the stimulus-frequency otoacoustic emission (SFOAE)-based assessment system. B, The hardware connections.
SFOAE Recording
Stimuli
SFOAEs were recorded based on the two-tone suppression method. The arrangement of probe and suppressor tones for the acquisition of a single SFOAE is illustrated in Figure 2. The stimuli consisted of six intervals (except for the last 5 ms), with intervals M and N added to the traditional four-interval paradigm to eliminate the effects of system and SFOAE delays. There was one interval of 2Td followed by five intervals of Tw (50 ms) in duration. Td is the pre-measured system delay with a duration of 14.5 ms. The probe and suppressor tones were delivered by two separate speakers. The probe was a continuous pure tone and had the same polarity at intervals A, B, C, D, and N. The suppressor was a tone burst, with the rise and decay time windowed by a 5-ms cosine window. Each of the two stimuli within each interval was a sinusoidal tone with an integral number of periods. Between the rise and decay time of the suppressor tone, the plateau intensity was kept constant. The suppressor at interval D was inverted relative to interval C.
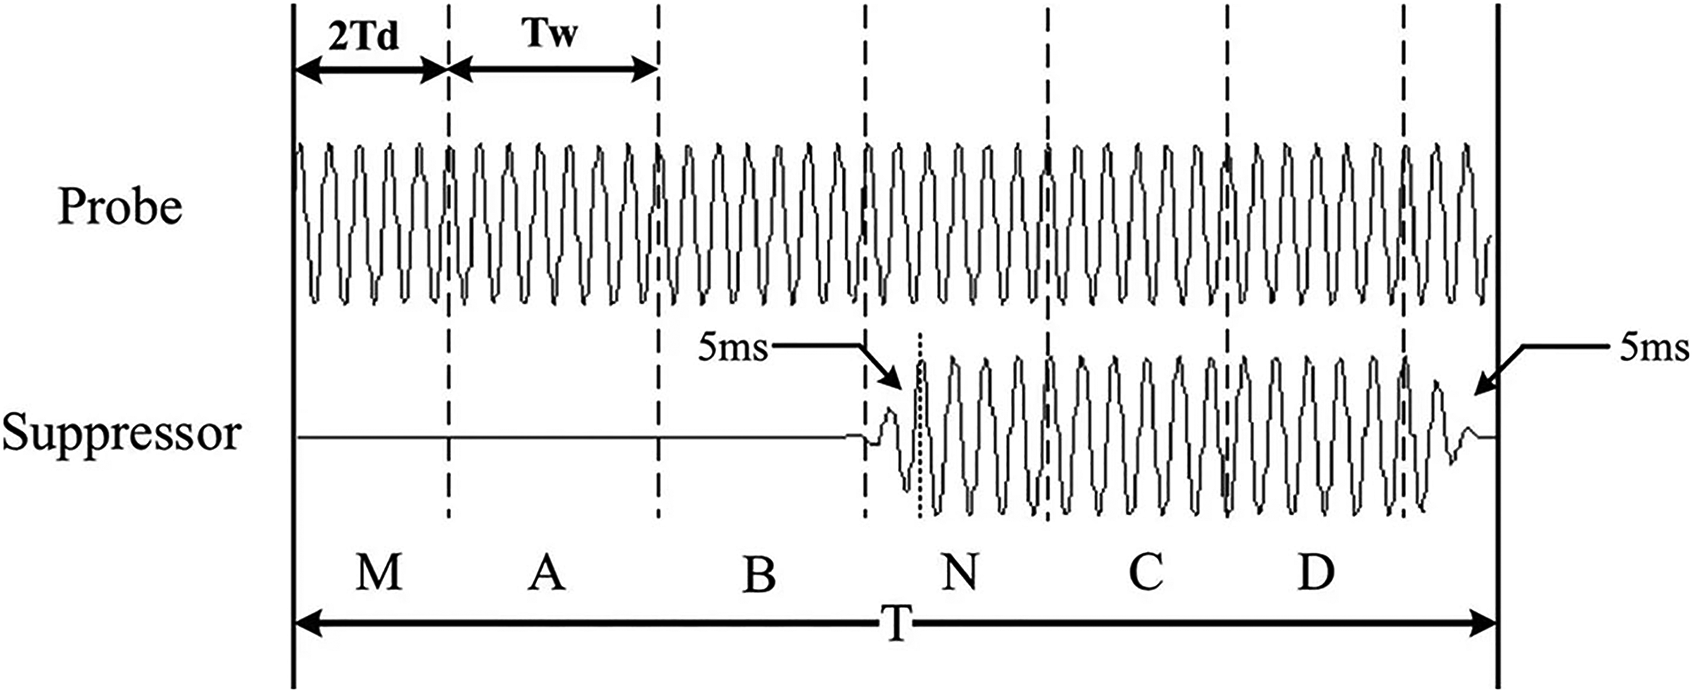
Stimulus synthesis for the acquisition of a single stimulus-frequency otoacoustic emission (SFOAE). The stimuli comprise six intervals. The first interval of 2Td in duration is followed by five intervals of Tw in duration (Gong et al., 2014).
SFOAE Detection
The pressure responses recorded at intervals A to D were stored in four separate buffers, A to D, respectively. Except for the background noise, the recorded responses in the ear canal consisted of the probe stimulus,

An example of the extracted power spectrum of stimulus-frequency otoacoustic emission (SFOAE) residual (black) and noise floor (gray). The probe frequency is 2 kHz. The black dashed box indicates the presence of the evoked SFOAE.
SFOAE-Based Assessment System for Threshold Prediction and Hearing Screening
Figure 4A shows the framework of the SFOAE-based assessment system consisting of three test modules. The routine test module provides an objective estimate of hearing threshold from the entire SFOAE I/O function via a machine learning-based regression model, Predictor 1. The fast test module omits SFOAE measurements at low probe levels and terminates when a signal-to-noise ratio (SNR)-based criterion is met, thus completing threshold determination in a relatively short period. It implements threshold prediction by running one of the two regression models, Predictor 2 or Predictor 3, according to whether the SNR-based criterion is met. The purpose of the hearing screening module is to identify hearing status (i.e., to discriminate between normal and impaired ears) from SFOAEs measured at three fixed probe levels (40, 50, and 60 dB SPL) using a trained classifier.

A, The framework of stimulus-frequency otoacoustic emission (SFOAE)-based objective assessment system for hearing prediction, which is composed of the routine test module, the fast test module and hearing screening module. B, The flow chart of a machine-learning model training.
Methods for Model Training
The predictors and classifiers involved in each module are developed based on machine learning algorithms. The steps of model training are shown in Figure 4B. Data used for model training were collected first. Then feature extraction, described in more detail in an upcoming section, was performed over the large data set, aiming to capture useful information regarding the pure-tone thresholds. Machine learning models must be configured prior to training. These critical configuration variables are called hyperparameters, which typically have a significant impact on the performance of machine learning algorithms. For each candidate machine learning algorithm, hyperparameters are learned through leave-one-out cross-validation (LOOCV) (for the regression models) or k-fold cross-validation (for the classification models), and we selected the optimal combination of model algorithms and hyperparameters for each model. Finally, the trained models were obtained by training on all the collected data for the determined algorithms and hyperparameters.
1) Data Collection
A Summary of the Number of Ears in Each Category for Each Test Frequency.

Note: NH = normal hearing; SNHL = sensorineural hearing loss.
2) Feature Extraction
Following data collection, feature extraction was performed to capture adequate information regarding hearing thresholds. Table 2 lists the input variables for each predictor and classifier. The input variables for Predictor 1 (Input variables 1) are SFOAE amplitudes, SFOAE SNRs, and
The Input Variables for Each Model.

Note: SFOAE = stimulus-frequency otoacoustic emission; SNRs = signal-to-noise ratios;
Step 1: The probe level is raised in 5-dB increments from

The process of determining
Step 2: The lowest probe level that yields SFOAE SNR
Step 3: If the lowest probe level meeting SFOAE SNR
Conceptually similar to the DPOAE thresholds reported previously (Boege & Janssen, 2002; Gorga et al., 2003; Johnson et al., 2007), we considered
3) Algorithm/Hyperparameter Selection
A LOOCV (for Predictor 1 in the routine test module and Predictor 2–3 in the fast test module) or k-fold cross-validation (for Classifier in the hearing screening module, k = 5) was conducted for model training and validation to select the optimal combination of machine learning algorithms and hyperparameters. In k-fold cross-validation, the dataset is divided into k approximately equal-sized disjoint folds, where a fold is in turn omitted for validating the model trained by other k-1 folds. LOOCV is a special case of k-fold cross-validation with k equal to the number of observations in the dataset, n (Cheng et al., 2017). In one of the k runs for LOOCV, each instance is, in turn, a single-item test set only once to validate the model trained by all other instances. For the three predictors (Predictor 1–3), LOOCV is appealing as the size of the training set is maximized in such a way that the trained models achieve better performance. The test performance was evaluated as the mean accuracy or error of all n observations when individually treated as a single-item test set. It is worth noting that the analysis was based on frequency; therefore, there was a separate model for each frequency.
Two widely used machine learning algorithms, BPNN and KNN, are alternatives to develop the predictors for threshold prediction (Predictor 1–3) and the classifier for hearing screening (Classifier). Another machine learning approach, SVM, is also a candidate for building the classifier in the hearing screening module. Figures 6A-C show the structures of BPNN, KNN, and SVM algorithms, respectively. As shown in Figure 6A, the BPNN model consists of an input layer, a hidden layer and an output layer. The number of nodes in the input layer equals the number of input variables. One node representing the predicted hearing threshold is used in the output layer of the BPNN-based regression models for threshold prediction, while two nodes indicating NH vs. hearing loss are employed in the output layer of the BPNN-based classification models for hearing screening. BPNN training involves forward propagation of the operating signal and back propagation of the error signal. The continuous adjustment of the weights is applied to make the actual output closer to the expected one, until the error is reduced to a set minimum value or the training steps are reached, and then the weights are fixed. In this study, the number of nodes in the hidden layer must be optimized as the hyperparameter for BPNN models. The KNN classifier uses the labels (i.e., normal or impaired) of the k nearest neighbors of the predicted sample (open circle) vote to determine its category (see Figure 6B). The predicted sample is classified into the category of the majority of the k nearest neighbors. Similarly, the mean hearing threshold of the k nearest neighbors is assigned to the predicted sample as the predicted value of the KNN regression models for threshold prediction. Euclidean distance metric is employed to determine the k nearest neighbors of the predicted sample. The k nearest neighbors play a vital role in prediction accuracy; thus, the hyperparameter of the KNN model to be optimized is the number of neighbors k. As shown in Figure 6C, the basic idea for the SVM-based classifier is to find the optimal hyperplane that has the maximum distance from the closest sample points. These hyperparameters in SVMs must be carefully chosen to obtain good performance. One is the penalty coefficient of the target function, c, which determines the tradeoff between minimizing the training error and minimizing the model complexity, and the other is the coefficient of the kernel function, gamma, which implicitly defines the nonlinear mapping from the input space to some high-dimensional feature space (in this study, we focus entirely on the Gaussian kernel).
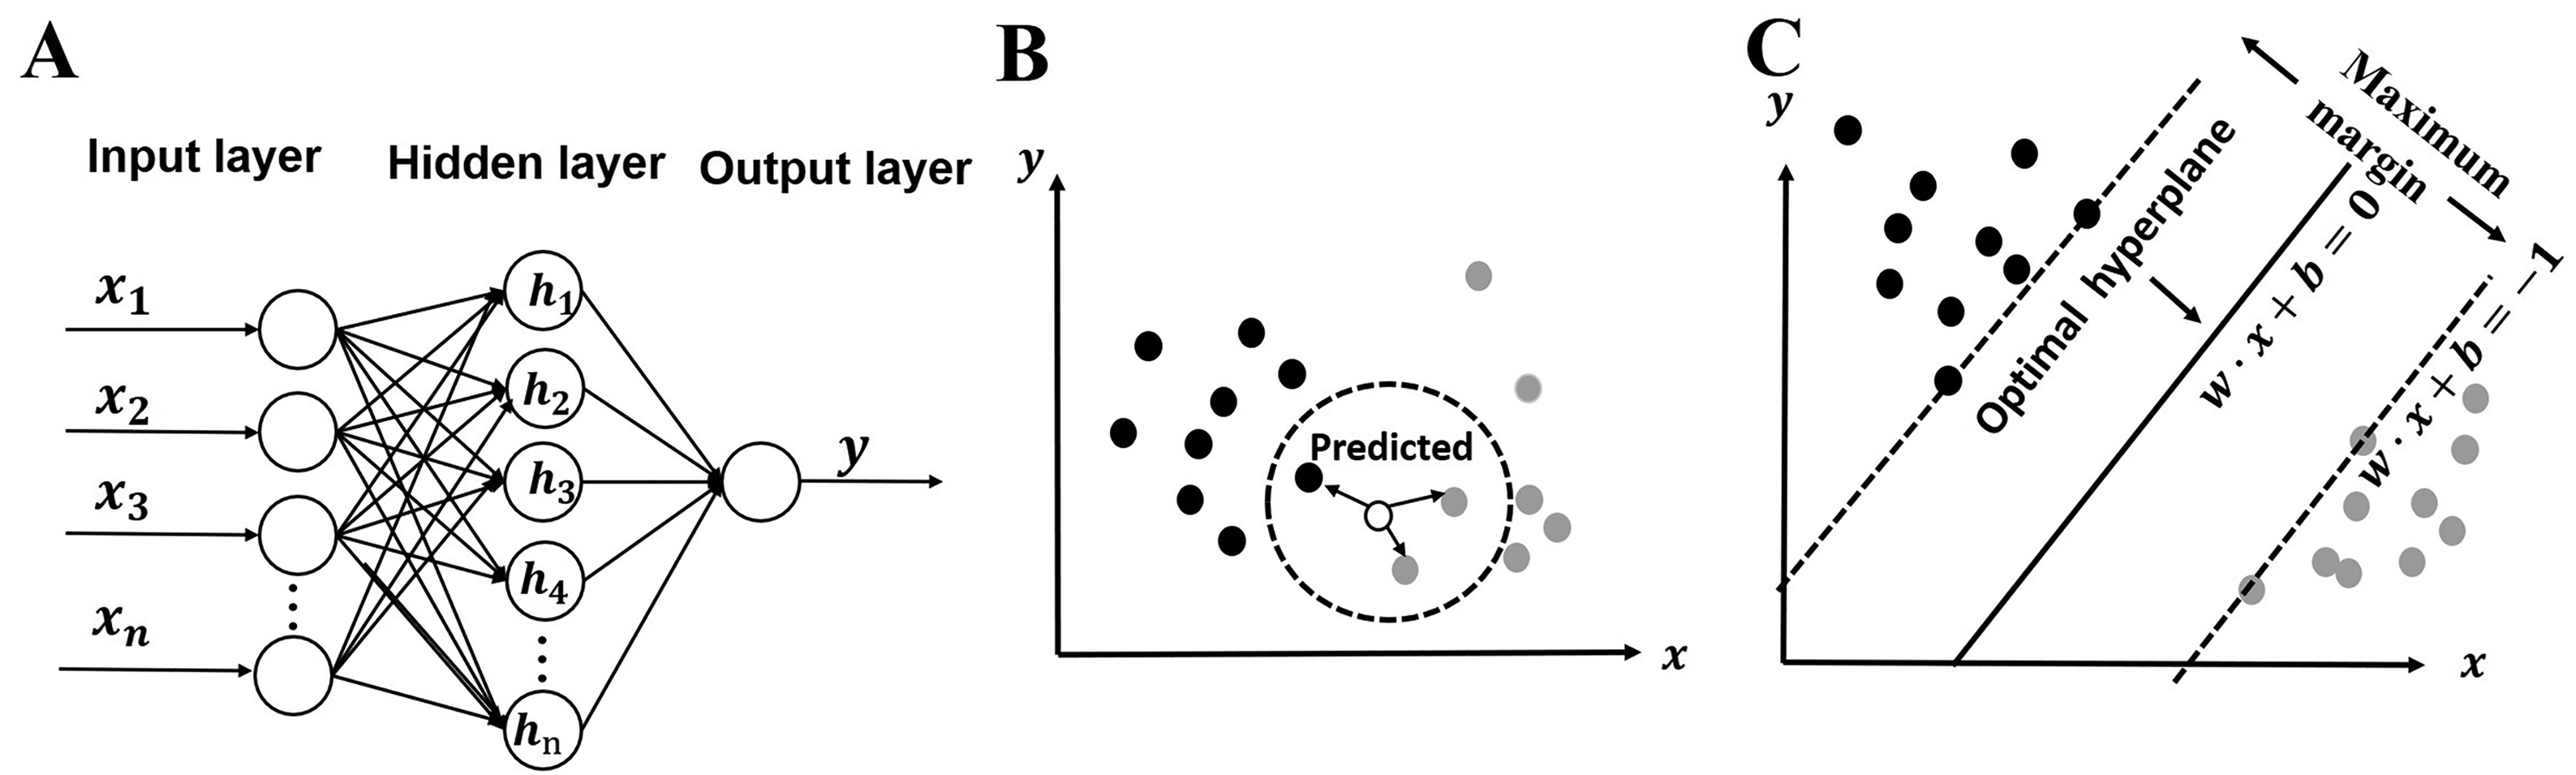
A. The structure of the back-propagation (BP) neural network algorithm. B. The schematic of the k nearest neighbor (KNN) algorithm. C. The schematic of the support vector machine (SVM) algorithm.
For each of the KNN, BPNN, and SVM algorithms, we tuned these hyperparameters by minimizing the estimated generalization error such as the k-fold cross-validation error or the leave-one-out error. The procedure for tuning hyperparameters for all models was implemented based on the Scikit-learn library (Pedregosa et al., 2011), a well-developed machine-learning library. The optimal combination of hyperparameters and algorithm was finally determined as those for which the model produced the lowest error and did not overfit (we ensured that during cross-validation, the difference in mean absolute error (MAE) between the training and test sets for Predictor 1–3 was limited to < 0.1 dB, or the difference in accuracy between the training and test sets for the classifier was limited to < 0.5%). Table 3 lists the optimal algorithm and hyperparameters for each model.
The Combination of Algorithm and Hyperparameters for Each Predictor or Classifier at all Test Frequencies.

Note: BPNN = back-propagation neural network; KNN = k-nearest neighbor; SVM = support vector machine.
4) Model Training
After acquiring the optimal combination of algorithm and hyperparameters, the final models (i.e., the trained Predictor 1 in the routine test module, Predictor 2 and Predictor 3 in the fast test module, and the classifier in the hearing screening module) were trained over all training data with the determined model algorithm and hyperparameters. It is noteworthy that the training data for Predictor 2 were limited to those frequencies that met the SNR-based criterion.
5) Model Validation
To further validate the test performance of the proposed three modules, we directly computed it on an unknown data set containing 44 ears of 23 subjects with NH (age: 23.7
The Number of Ears in Each Category Contained in the Unknown Data set for Each Test Frequency.

Note: NH = normal hearing; SNHL = sensorineural hearing loss.
Indices for Performance Evaluation on the System
Model performance was evaluated via cross-validation and by testing on the unknown dataset. Test performance computed on all test samples in all k runs of LOOCV or k-fold cross-validation (Given that all cases can be in turn a single-item test set without repeating in each run), referred to as “cross-validation performance” in this study, was predominantly discussed. The three modules were further validated by computing the test performance on all samples in the unknown data set. MAE, defined as the mean of the absolute differences between the predicted and measured hearing thresholds, was computed to quantify the prediction performance for both the routine test module and the fast test module. In addition, the percentage of cases that were predicted within
The Test Procedure for Each Module
The Routine Test Module
The flow diagram and test interface for the routine test module are shown in Figures 7A-B respectively. After the operator enters the subject information (e.g., name, gender, age and test ear, see Figure 7B), probe frequency (

The routine test module. A, Flow diagram B, Test interface and an example of test results.
The Fast Test Module
Figures 8A and 8B show the flow diagram and test interface of the fast test module, respectively. The minimum probe level
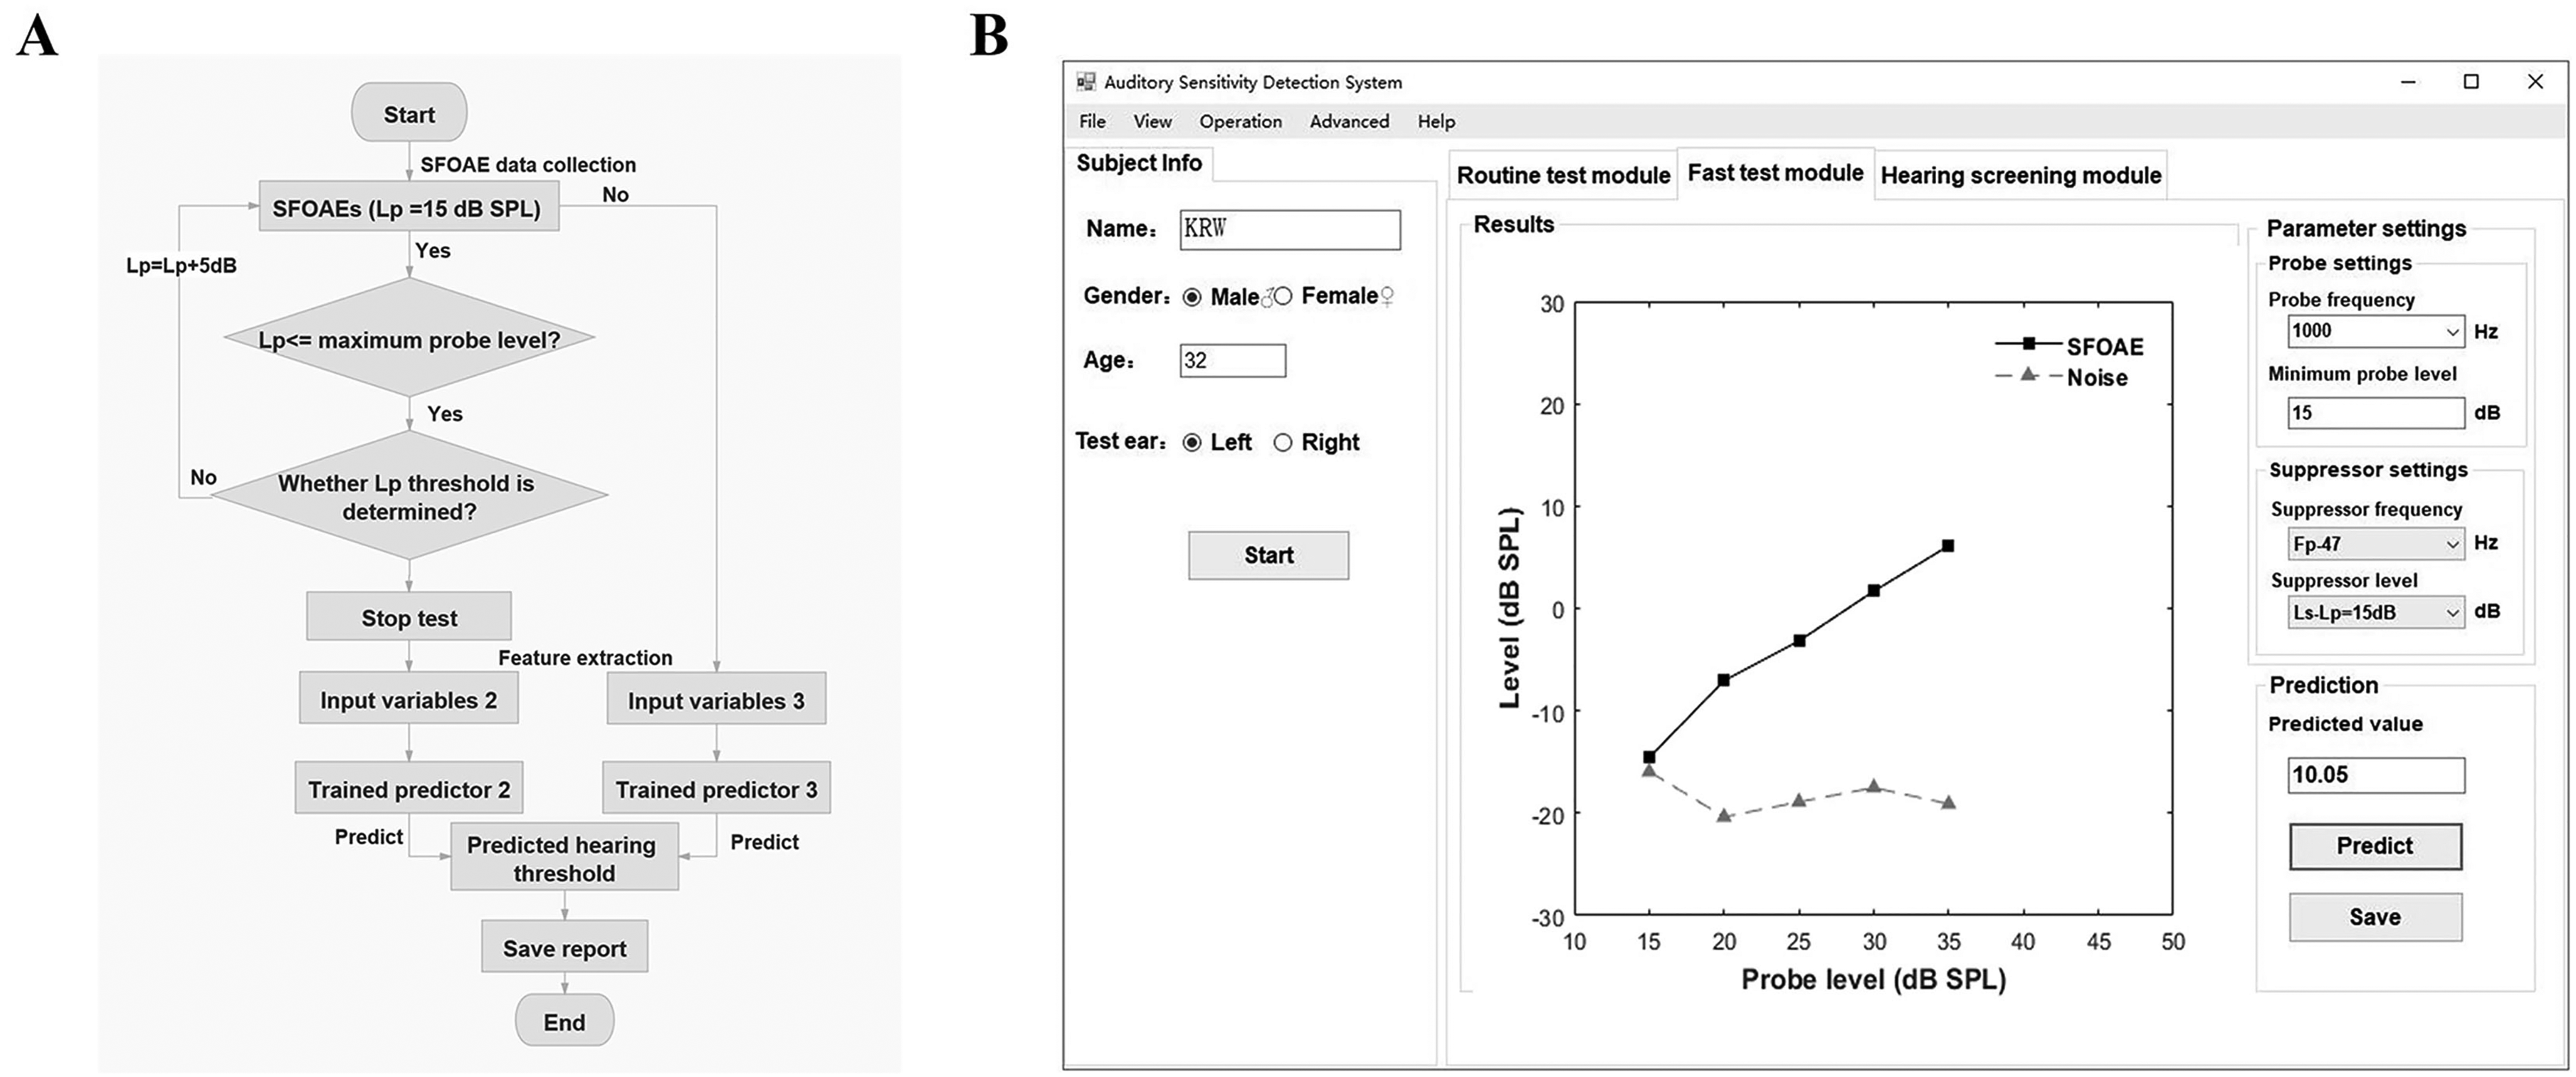
The fast test module. A, Flow diagram. B, Test interface and an example of test results.
Hearing Screening Module
Figure 9 shows the flow diagram (A) and test interface (B) of the hearing screening module. After clicking the “Start” button, SFOAEs are measured at three specific probe levels (40, 50, 60 dB SPL) (see Figure 9B). After clicking the “Predict” button, the system automatically extracts SFOAE levels, SFOAE SNRs and

Hearing screening module. A, Flow diagram. B, Test interface and an example of test results.
RESULTS
Cross-Validation Prediction Performance
The Routine Test Module and the Fast Test Module
The MAEs of the routine test module at 0.5–8 kHz computed over the predictions of the test samples are shown in Table 5. The MAEs ranged from 7.06 (1 kHz) to 11.61 dB (8 kHz). Overall, the MAEs were lower in the normal-hearing group than in the subjects with hearing loss (i.e., HL
Cross-Validation Performance of the Routine Test Module in Predicting Hearing Thresholds.

Note: NH = normal hearing; SNHL = sensorineural hearing loss; MAE = mean absolute error; 10-dB accuracy = the percentage of ears that were predicted within
Table 6 indicates the percentage of ears that met the SNR-based inclusion criterion for determining Lp threshold (“SFOAE evoked rate”) for the fast test module at 0.5–8 kHz, along with the 10-dB accuracy (between 57.26% and 81.22%) and MAEs, ranging from 7.40 (1 kHz) to 12.60 dB (8 kHz). At all test frequencies, over 93% of normal-hearing ears met the SNR-based inclusion criterion, meaning that hearing thresholds were predicted without measuring the entire SFOAE I/O function. However, only 34.06–53.28% of ears with SNHL met the SNR-based inclusion criterion; thus, more time was needed to measure SFOAEs in response to higher probe levels. Despite this, in the SNHL group, the 10-dB accuracy was larger than the SFOAE evoked rate, indicating that in many impaired ears hearing thresholds could be predicted even in the absence of Lp threshold. In agreement with the predictions of the routine test module, the prediction performance in regions of NH was superior to that in regions of hearing loss at all test frequencies (but less evident at 8 kHz), and the prediction performance was poorer at 0.5 and 8 kHz relative to 1–4 kHz.
Summary of the Threshold Prediction Results for the Fast Test Module: SFOAE Evoke Rate (%) and Cross-Validation Performance in Predicting Hearing Thresholds.

Note: NH = normal hearing; SNHL = sensorineural hearing loss; MAE = mean absolute error; SFOAE evoked rate = the percentage of ears that met the SNR-based criterion; 10-dB accuracy = the percentage of ears that were predicted within
Histograms of prediction error (i.e., the difference between the predicted and measured hearing thresholds) for the routine test module (black bars) and the fast test module (white bars) are shown in Figure 10A. Each panel from left to right shows data for different frequencies from 0.5 to 8 kHz. Both modules yielded predictions with similar error distributions. A majority of predictions based on the routine test module and the fast test module presented low errors (

A, histogram of the prediction error (i.e., the difference between the predicted and measured hearing thresholds) for the routine test module (black bars) and fast test module (white bars). B, Cumulative percentage of ears that are predicted within an accuracy band (
Overall performance was improved notably when tests were restricted to hearing levels ≤ 60 dB HL, which is typically used in previous studies (Go et al., 2019; Gorga et al., 2003; Mertes & Goodman, 2013). As shown in Table 7, these restrictions resulted in MAE decreases of 0.66–1.34 dB for the routine test module and 0.6–1.25 dB for the fast test module. Indeed, the generation of SFOAEs relies on the normal function of OHCs. It is not surprising that there is an absence of OAEs in the cochlea in ears with HL> 60 dB due to a severe or complete loss of OHCs, and naturally no detectable SFOAEs is present in the ear canal (we ensured that all ears had normal middle ear function), which might account for the large prediction errors at high hearing levels.
Comparisons of the Mean Absolute Errors (MAEs, dB) Obtained From all Ears and Those From Ears Restricted to ≤ 60 dB HL. The Difference Represents the Decrease in MAEs (dB) From Ears Restricted to ≤ 60 dB HL Relative to Those From all Ears.

Note: MAE = mean absolute error.
The Hearing Screening Module
The prediction performance of the hearing screening module for frequencies 0.5–8 kHz is shown in Table 8. Five-fold cross-validation was conducted on performance evaluation so that the test accuracy was computed as the average of five individual runs. For ease of comparison with other studies, the performance of the hearing screening module was also quantified using the area under the receiver operating characteristic curve (AUC). Over 90.82% of ears were identified correctly at 0.5–4 kHz, with the test accuracy ranging from 90.82% (0.5 kHz) to 95.93% (1 kHz). The test accuracy was lowest at 8 kHz, with 88.38% of cases correctly classified. The hearing screening module yielded large AUCs at all test frequencies, with over 0.96 at 0.5–4 kHz and 0.91 at 8 kHz. Also provided in Table 8 are the false negative rate and false positive rate. Overall, the hearing screening module resulted in a low false negative rate at 0.5–8 kHz (2.87–7.02%) but a slightly higher false positive rate at 0.5 and 8 kHz. About 0.95 min was needed in the hearing screening module for identifying hearing status.
The Cross-Validation Prediction Performance for the Hearing Screening Module at 0.5–8 kHz.

Note: AUC = area under the receiver operating characteristic curve.
Performance Evaluated on an Unknown Data set
Table 9 shows the test performance evaluated on this unknown data set for each module, with the same indicators as the cross-validation. Since the cross-validation performance showed that the hearing thresholds of ears with severe hearing loss almost could not be accurately predicted (Table 7), the hearing thresholds were restricted to
Test Performance for the Routine Test Module, Fast Test Module, and Hearing Screening Module That was Evaluated on an Unknown Data set.

Note: 10-dB accuracy = percentage of ears that were predicted within
Performance Comparison
Comparisons Between the Routine Test Module and the Fast Test Module
The cross-validation performance of the routine test module and the fast test module were compared in terms of MAE and mean test time. The MAEs and mean test time (minutes) for both hearing categories (normal: HL

For two hearing categories (normal and sensorineural hearing loss [SNHL]) and across all ears (overall), the mean absolute error (MAE) (left panel) and mean test time (right panel) for the routine test module are compared to those for the fast test module. The gray bars indicate the results for the routine test module, and the open bars indicate the results for the fast test module. n.s. indicates no significance. ** p < 0.01. The error bars represent the standard errors of the mean.
Comparison Between the Cross-Validation Performance and Performance Evaluated on the Unknown Data set
As shown in Figure 12, the cross-validation performance was compared to the test performance evaluated on the unknown data set for the routine test module (left panel), the fast test module (middle panel) and the hearing screening module (right panel). In the left and middle panels, the gray bars indicate the MAEs for the cross-validation performance, and the open bars represent the MAEs computed on the unknown data set. The open squares indicate the 10-dB accuracy for the cross-validation performance and the open circles indicate the 10-dB accuracy computed on the unknown data set. Regardless of the routine test module and the fast test module, the MAEs computed on the unknown data set were similar to those evaluated on all test samples of cross-validation (when hearing levels were restricted to

The cross-validation performance (when hearing levels were restricted to ≤ 60 dB HL) is compared to the test performance evaluated on the unknown data set for the routine test module (left), fast test module (middle) and hearing screening module (right). In the left and middle panels, the gray bars indicate the mean absolute errors (MAEs) for the cross-validation performance, and the open bars indicate the MAEs calculated on the unknown data set. n.s. indicates no significance. The error bars represent the standard errors of the mean. The open squares indicate the 10-dB accuracy for the cross-validation performance, and the open circles indicate that computed on the unknown data set.
A repeated-measures (rm) analysis of variance (ANOVA) on MAEs was conducted separately for each frequency, with performance type (i.e., cross-validation performance vs. test performance evaluated on the unknown data set) set to the between-subjects factor, and module type (i.e., the routine test module vs. the fast test module) set to the within-subjects factor. No significant interaction between the performance type and the module type was found at all test frequencies (0.5 kHz:
Discussion
In this study, a routine test module and a fast test module based on SFOAEs were developed, offering a potential audiometric tool in a frequency-specific manner. Performance in threshold prediction was good in normal-hearing ears; however, worse in ears with hearing loss, which deserves continued efforts to be improved for clinical utility. Standard errors were also calculated to facilitate comparisons between the performance of the present SFOAEs and those of tests based on DPOAEs (Gorga et al., 2003; Johnson et al., 2007), as listed in Table 10. Both the routine test module and the fast test module in the present SFOAE study could make predictions for all ears tested. However, the DPOAE studies of Gorga et al., and Johnson et al., excluded a large percentage of ears originally tested due to a failure to meet their inclusion criteria. Also, the standard errors for both modules were typically equal to or lower than those observed in the DPOAE studies except for 0.5 kHz (For that frequency, the result for the DPOAE study of Gorga et al., may be unreliable given the paucity of data [of 158 ears tested, only 27 ears were predicted]). For these reasons, both the routine test module and the fast test module resulted in better performance in threshold prediction than the previous DPOAE studies (Gorga et al., 2003; Johnson et al., 2007). However, it should be clear that the superior performance in threshold prediction observed in both the routine test module and the fast test module compared to the previous DPOAE studies is a consequence of the machine learning algorithms and multiple combined variables rather than the stimulus type itself.
Performance Comparison in Threshold Prediction Between Both Modules in the Present SFOAE Study and the DPOAE Studies of Gorga et al. (2003) and Johnson et al. (2007). n/N indicates the ratio of the number of ears predicted (n) and tested (N). Dashes indicated that predictions were not reported at that frequency.
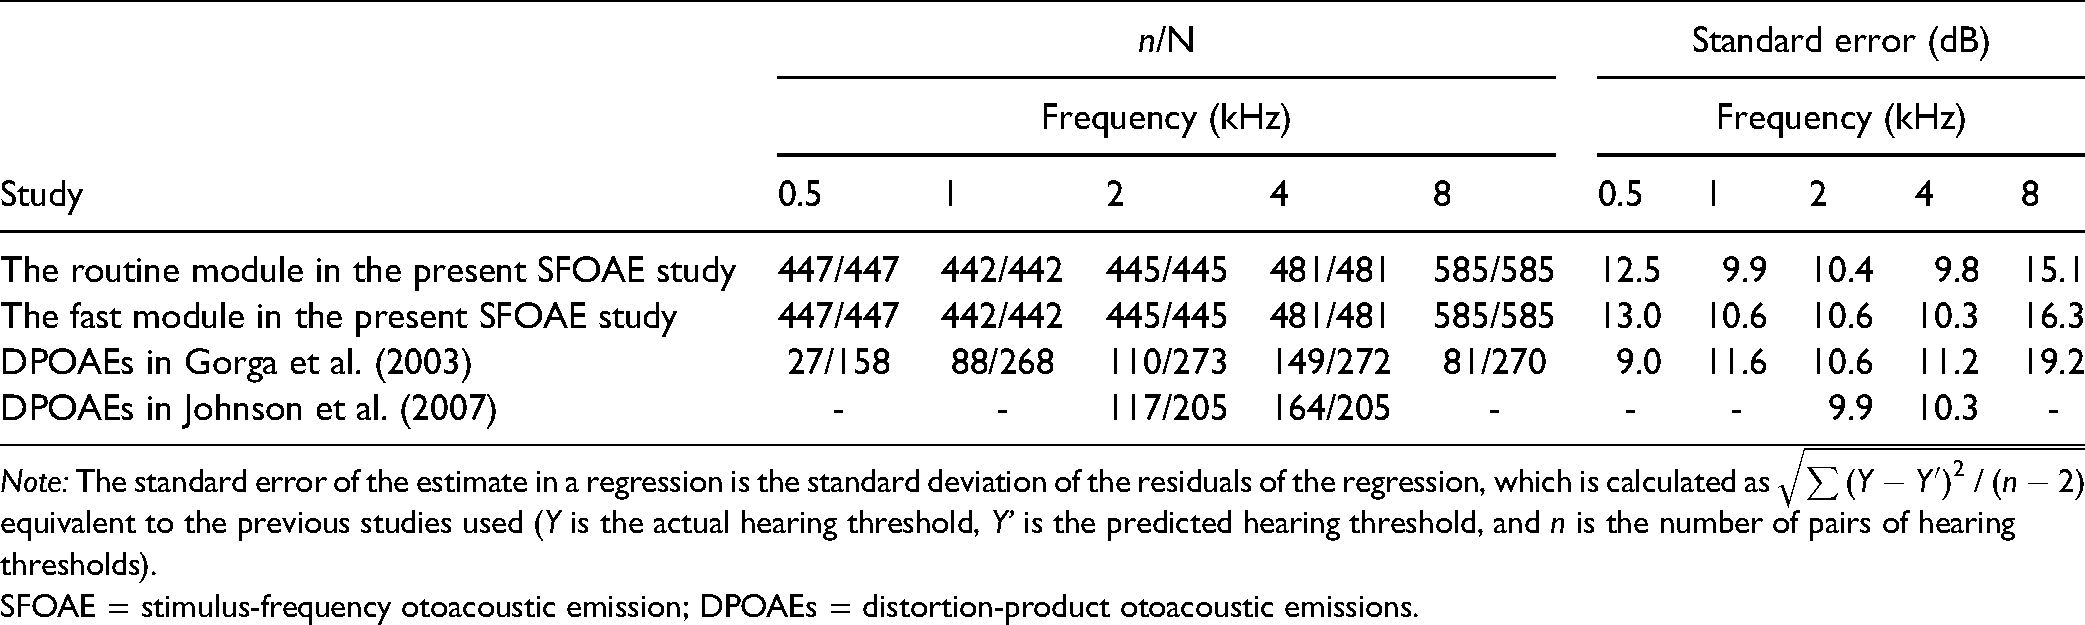
Note: The standard error of the estimate in a regression is the standard deviation of the residuals of the regression, which is calculated as
SFOAE = stimulus-frequency otoacoustic emission; DPOAEs = distortion-product otoacoustic emissions.
Regardless of hearing loss, both the routine test module and the fast test module predicted hearing thresholds with comparable performance (no statistically significant difference in MAEs between both modules); however, the test time involved in the fast module was significantly shorter than that in the routine module. Therefore, we suggest that the fast module is better suited than the routine module for clinical utility. In contrast to the single-predictor (Predictor 1) routine test module based on the entire SFOAE I/O function, the fast test module shortened the test time by training two other predictors (Predictor 2 and Predictor 3). Conceptually similar to the OAE thresholds previously reported (Boege & Janssen, 2002; Gorga et al., 2003; Johnson et al., 2007), the Lp threshold containing useful information regarding hearing threshold was determined for the fast routine module based on the SNR-based inclusion criterion. Once the Lp threshold was found, the fast test module stopped the SFOAE test and omitted the SFOAE measurements at higher probe levels. This stopping rule was necessary to avoid prolonged test times, as relatively sufficient information regarding hearing thresholds was captured. The reduced test time for the fast test module relative to the routine test module might depend on the degree of hearing loss. Compared to ears with NH, the mean test time for ears with hearing loss tended to be longer when using the fast test module, for which greater probe levels were needed to yield SFOAE response (i.e., meeting the SNR-based inclusion criterion).
The hearing screening module of the SFOAE-based system identified hearing status with great accuracy at all test frequencies in less than one minute for a single frequency, which was useful for objective SNHL screening. We compared the performance of the present SFOAE-based study to the best results of DPOAEs (Gorga et al., 2000), in which the AUCs were separately approximated as 0.96, 0.975, 0.98, 0.975, 0.98 from 0.5–8 kHz. The performance of our models in predicting hearing status was generally similar to that of DPOAE-based tests at 0.5–4 kHz; however, slightly poorer than DPOAEs at 8 kHz (Gorga et al., 2000). Compared to the SFOAE study of Ellison and Keefe (2005), in which the best AUC obtained at 0.5–8kHz was between 0.83 and 0.93, the performance in identifying hearing loss for the hearing screening module was improved remarkably. Given its good performance, we suggest that the hearing screening module is promising for clinical applications.
It is possible that the prediction errors partly result from the measurement errors from the coupler calibration, especially for higher frequencies. For stimulus calibration, coupler calibration may be preferable to in-the-ear SPL calibration (Neely & Gorga, 1998), but it is also problematic as the pressure measured in the coupler can differ greatly from that presented to the eardrum if the coupler impedance is much different from the ear-canal impedance. For microphone calibration, there is a concern that such coupler calibration would not mitigate standing waves in the ear canal for higher frequencies, where ear canal resonances and probe fitting would result in changes in relative stimulus intensity at the cochlea between subjects. In future studies, the system is expected to be calibrated with more advanced calibration techniques such as the forward pressure level/emitted pressure level approach (Maxim et al., 2019) and “in-situ” calibration (Chen et al., 2014). Another possible factor that affects the accuracy of hearing prediction is the use of high stimulus levels for the probe and suppressor given that they could elicit efferent reflex feedback and potentially even middle ear muscle reflex (Guinan et al., 2003). While this risk for SFOAEs is lower than that for DPOAEs, it should be noted that the recorded SFOAEs at higher stimulus levels involve a modulation by these two reflexes.
One preliminary study from our laboratory (Gong et al., 2020) have investigated the ability of SFOAEs to predict capabilities using BPNN algorithm, and another (Liu et al., 2020) further maximized the test performance by comparing multiple machine learning algorithms. The current study advanced beyond our previous work in three ways. First, the present study proposed a fast test module that reduced a large amount of test time without a significant decrease in threshold prediction performance. Similarly, the developed hearing screening module could identify hearing status with comparable performance to the studies of Gong et al. (2020) and Liu et al. (2020); however, its test duration was reduced by approximately 80%. Second, more data were collected in this study, particularly at 4 and 8 kHz. Moreover, the hearing thresholds of all ears involved in the SFOAE tests could be predicted via the present routine test module and the fast test module, while the BPNN predictors in Gong et al. (2020) were built based solely on those data meeting the inclusion criterion. Given that many ears failing the inclusion criterion were excluded from our previous study (Gong et al., 2020), it is not surprising that larger MAEs were observed in the current study than in the previous study. Finally, we generated machine learning models using optimized hyperparameters and algorithms that can be directly used for unknown data. Furthermore, the proposed modules in this study have been validated on a new unknown data set, while the test performance in the two preliminary studies from our laboratory was just assessed via cross-validation due to it only being used to investigate or maximize the ability of SFOAEs in predicting hearing capabilities.
One of the limitations is the clinical utility of the routine test module and the fast test module, which may be limited by a large amount of required measurement time, even for the hearing screening module. A significant reduction in the time effort is needed to improve the clinical utility of SFOAEs, for example, a fast approach to measure SFOAE I/O functions could be the use of chirp stimuli. Second, the large variability of the predicted thresholds for both the routine test module and the fast test module requires further reduction. In particular, hearing thresholds of
In conclusion, the present SFOAE-based assessment system consisting of the routine test module, the fast test module and the hearing screening module provides a potential tool for objectively assessing hearing loss. The fast test module can predict hearing thresholds in an ear within
Supplemental Material
sj-docx-1-tia-10.1177_23312165211059628 - Supplemental material for Objective Assessment System for Hearing Prediction Based on Stimulus-Frequency Otoacoustic Emissions
Supplemental material, sj-docx-1-tia-10.1177_23312165211059628 for Objective Assessment System for Hearing Prediction Based on Stimulus-Frequency Otoacoustic Emissions by Qin Gong, Yin Liu, Runyi Xu, Dong Liang and Zewen Peng, Honghao Yang in Trends in Hearing
Footnotes
Acknowledgments
We thank Professor Mario Ruggero (Northwestern University) for help with text editing and Fei Ji (The General Hospital of the People's Liberation Army) for help with data collection.
Declaration of Conflicting Interests
The author(s) declared no potential conflicts of interest with respect to the research, authorship, and/or publication of this article.
Funding
The author(s) disclosed receipt of the following financial support for the research, authorship, and/or publication of this article: This work was supported by the National Natural Science Foundation of China (grant number 61871252) and the Foundation of Jiangsu Province Science and Technology (grant number BE2020635).
Supplemental Material
Supplemental material for this article is available online.
References
Supplementary Material
Please find the following supplemental material available below.
For Open Access articles published under a Creative Commons License, all supplemental material carries the same license as the article it is associated with.
For non-Open Access articles published, all supplemental material carries a non-exclusive license, and permission requests for re-use of supplemental material or any part of supplemental material shall be sent directly to the copyright owner as specified in the copyright notice associated with the article.