
Abstract
A language-independent automated self-test on tablet based on masked recognition of ecological sounds, the Sound Ear Check (SEC), was developed. In this test, 24 trials of eight different sounds are randomly presented in a noise that was spectrally shaped according to the average frequency spectra of the stimulus sounds, using a 1-up 2-down adaptive procedure. The test was evaluated in adults with normal hearing and hearing loss, and its feasibility was investigated in young children, who are the target population of this test. Following equalization of perceptual difficulty across sounds by applying level adjustments to the individual tokens, a reference curve with a steep slope of 18%/dB was obtained, resulting in a test with a high test–retest reliability of 1 dB. The SEC sound reception threshold was significantly associated with the averaged pure tone threshold (r = .70), as well as with the speech reception threshold for the Digit Triplet Test (r = .79), indicating that the SEC is susceptible to both audibility and signal-to-noise ratio loss. Sensitivity and specificity values on the order of magnitude of ∼70% and ∼80% to detect individuals with mild and moderate hearing loss, respectively, and ∼80% to detect individuals with slight speech-in-noise recognition difficulties were obtained. Homogeneity among sounds was verified in children. Psychometric functions fitted to the data indicated a steep slope of 16%/dB, and test–retest reliability of sound reception threshold estimates was 1.3 dB. A reference value of −9 dB signal-to-noise ratio was obtained. Test duration was around 6 minutes, including training and acclimatization.
Introduction
In their expert consensus article, the European Federation of Audiology Societies recommends the implementation of preschool- and school-age hearing screening, targeting mainly children between 4 and 7 years of age, in addition to the systematic hearing screening of newborns (Piotrowska & Skarzynski, 2012). The importance of having a safety net to capture children with hearing loss that has a delayed onset or that is acquired later in life (for a review, see Smith, Bale, & White, 2005) has been widely recognized. This is especially important because hearing loss negatively impacts on various development domains (Bess, Dodd-Murphy & Parker, 1998; Porter, Sladen, & Ampah, 2013), and its prevalence is expected to rise with age (Fortnum, Summerfield, Marshall, Davis, & Bamford, 2001).
Selecting the most appropriate screening test for a given population is crucial. Preschool- and school-age hearing screening are commonly based on pure tone audiometry or otoacoustic emission testing, but applied procedures are not universal. More important, performing such tests in screening environments can be quite problematic, given the absence of a sound-proof booth or quiet room and the susceptibility of both tests to excessive external noise (Prieve, Schooling, Venediktov, & Franceschini, 2015). As such, these methods have variable reliability as well as variable sensitivity and specificity to detect mild hearing loss. Furthermore, examiner experience level and training might influence accuracy.
A growing trend has been the use of automated suprathreshold self-tests based on speech perception in noise for adult hearing screening (De Sousa, Swanepoel, Moore, & Smits, 2018; Folmer, Vachhani, Mcmillan, Kidd, & Feeney, 2017; Jansen et al., 2010; Jansen, Luts, Dejonckere, van Wieringen, & Wouters, 2014; Koole et al., 2016; Potgieter, Swanepoel, Myburgh, & Smits, 2018a; Smits & Houtgast, 2005; Smits, Merkus, & Houtgast, 2006; Vercammen, Goossens, Wouters, & van Wieringen, 2017; Vlaming, MacKinnon, Jansen, & Moore, 2014; Watson, Kidd, Miller, Smits, & Humes, 2012), for example, for online hearing screening and screening via mobile devices (Stenfelt, Janssen, Schirkonyer, & Grandori, 2011). One commonly used test is the Digit Triplet Test (DTT), in which combinations of three digits are presented in speech-shaped noise at different signal-to-noise ratios (SNRs) using an adaptive test procedure. The test has been translated to several languages (Potgieter, Swanepoel, Myburgh, Hopper, & Smits, 2015; Willberg et al., 2016; Zokoll et al., 2012, 2013), its development principles have been consolidated (Akeroyd et al., 2015), and the test can now be considered an efficient reference for speech-in-noise screening. It has high measurement reliability and accurately distinguishes between adults with normal hearing (NH) and (mild) hearing loss, based on pure tone audiometry, with reported sensitivity and specificity values of >80%. Because of its suprathreshold nature, the impact of ambient noise and calibration is significantly reduced. The use of this test for school-age hearing screening in Flanders has also been explored and has led to the implementation of the DTT for the systematic hearing screening of fifth grade (since school year 2018–2019 moved to sixth grade) elementary and third grade secondary school children by school health services since the school year 2016–2017 (Denys et al., 2018; Guérin, Van Hoeck, Denys, Wouters, & Hoppenbrouwers, 2017).
However, whereas reliable SRTs can be measured in adults and children from higher grades, its feasibility in younger children at school entry is not trivial (Witton, Talcott, & Henning, 2017). For instance, the test requires the ability to direct and maintain attention as well as to remember digit combinations and knowledge of their written representations. Altogether, the DTT might be too challenging for young children at school-entry age.
An adaptive self-test that uses nonspeech sounds with easily recognizable pictures might offer a solution and potentially pave ways for international usage, given its complete language independence and uniformity. The idea of using ecological sound stimuli is not new and has already been suggested many years ago as a promising alternative to pure tones when the aim is to screen young children (Myers, Letowski, Abouchacra, Kalb, & Haas, 1996). More recently, such a test—the Frequency-specific Animal Sound Test—was described and validated in young children by Nolte et al. (2016). It is an adaptive self-test that randomly presents four filtered animal sounds (two low frequency and two high frequency sounds) to the right and left ear consecutively and allows determination of hearing thresholds for the low and high frequency range. However, as it is a threshold test in quiet, it remains challenging to deal with ambient noise levels and calibration aspects. To our knowledge, no previous studies have investigated the use of a suprathreshold test using ecological sounds.
Such a test, the Sound Ear Check (SEC) was developed. Should this test have acceptable reliability, discriminate accurately between individuals with and without hearing loss, and proves itself feasible in young children, it might hold potential to be a useful common reference across many countries in the future given its language independence. Consequently, it might allow for efficient estimation of childhood hearing loss incidence worldwide and, as such, an evidence base for the need of (pre)school-age hearing screening programs.
In what follows, the development, evaluation, and validation of the SEC in adults and its feasibility in children are described. All experiments conducted were approved by the Ethics Committee of the University Hospitals of Leuven and Amsterdam.
Part I. Development of the SEC
The first part of this article concerns the development of the SEC in adults.
From a database of 31 sounds, eight were selected based on international recognizability and imageability, that is, the sounds had to be able to be depicted with a simple drawing and thought to be recognizable for children. 1 Also, the spectral content of the selected sounds needed to cover a wide frequency range. To characterize the spectrotemporal content of the sounds, an analysis of their spectrotemporal properties, including an exploratory factor analysis, was conducted. The results of these analyses are given in Appendix. A spectrally matched masker was generated using MATLAB, by filtering a white noise with the average sound spectrum. The sounds were rescaled to the average root mean square (RMS) of the noise, using commercially available sound editing software.
In a first group of participants, psychometric curves were measured for all sounds by presenting them at a number of fixed SNRs, and level adjustments were carried out to the individual sound tokens to obtain a homogeneous material in terms of equal perceptual difficulty among items. Reducing the spread of sound-specific sound reception thresholds (SRTs) is necessary to obtain a reference curve with a steep slope, which is important to achieve the highest possible test reliability.
In a second group of NH participants, homogeneity was verified, and a reference curve was obtained. Also, two adaptive test versions were evaluated with respect to their convergence and test–retest reliability.
Methods
Participants
Group 1 consisted of 11 young female students, aged between 18 and 22 years. Group 2 consisted of ten participants (4 males, 6 females), aged between 22 and 53 years. With air conduction hearing thresholds for octave frequencies between 250 and 8000 Hz ≤25 dB HL, all participants had NH.
Materials and procedures
All measurements were conducted in a sound-proof room. First, pure tone air conduction thresholds were measured using standard clinical procedures, using a Madsen Orbiter 922 or Madsen Midimate 622 audiometer connected to a TDH-39 headphone, calibrated yearly according to ISO-389 standards.
Second, the sounds were presented in noise at fixed SNRs. Stimuli were played back via a PC, using APEX 3.1 software (Francart et al., 2017; Francart, van Wieringen, & Wouters, 2008) and were routed to an external soundcard (Fireface UCX RME) connected to a HDA-200 headphone, calibrated to the sound masker at 80 dB sound pressure level (SPL) with a Brüel & Kjaer sound level meter 2260 and a Brüel & Kjaer artificial ear 4153, using the flat plate.
Participants were seated in front of a computer screen and were instructed to identify the sounds from a closed set of response alternatives, that is, a matrix with line images of the sounds in black and white (see Figure 1). Guessing was encouraged at challenging SNRs. Testing was conducted monaurally (the sounds-in-noise were presented to the right ear) and was preceded by a training phase. Obligatory breaks were included to avoid fatigue. In the training phase, every sound was presented three times at 0 dB SNR with random presentation order, and participants received feedback on their performance.
Screenshot of the Sound Ear Check. The final set of pictures is shown, as some of the original pictures were revised after evaluation in young children.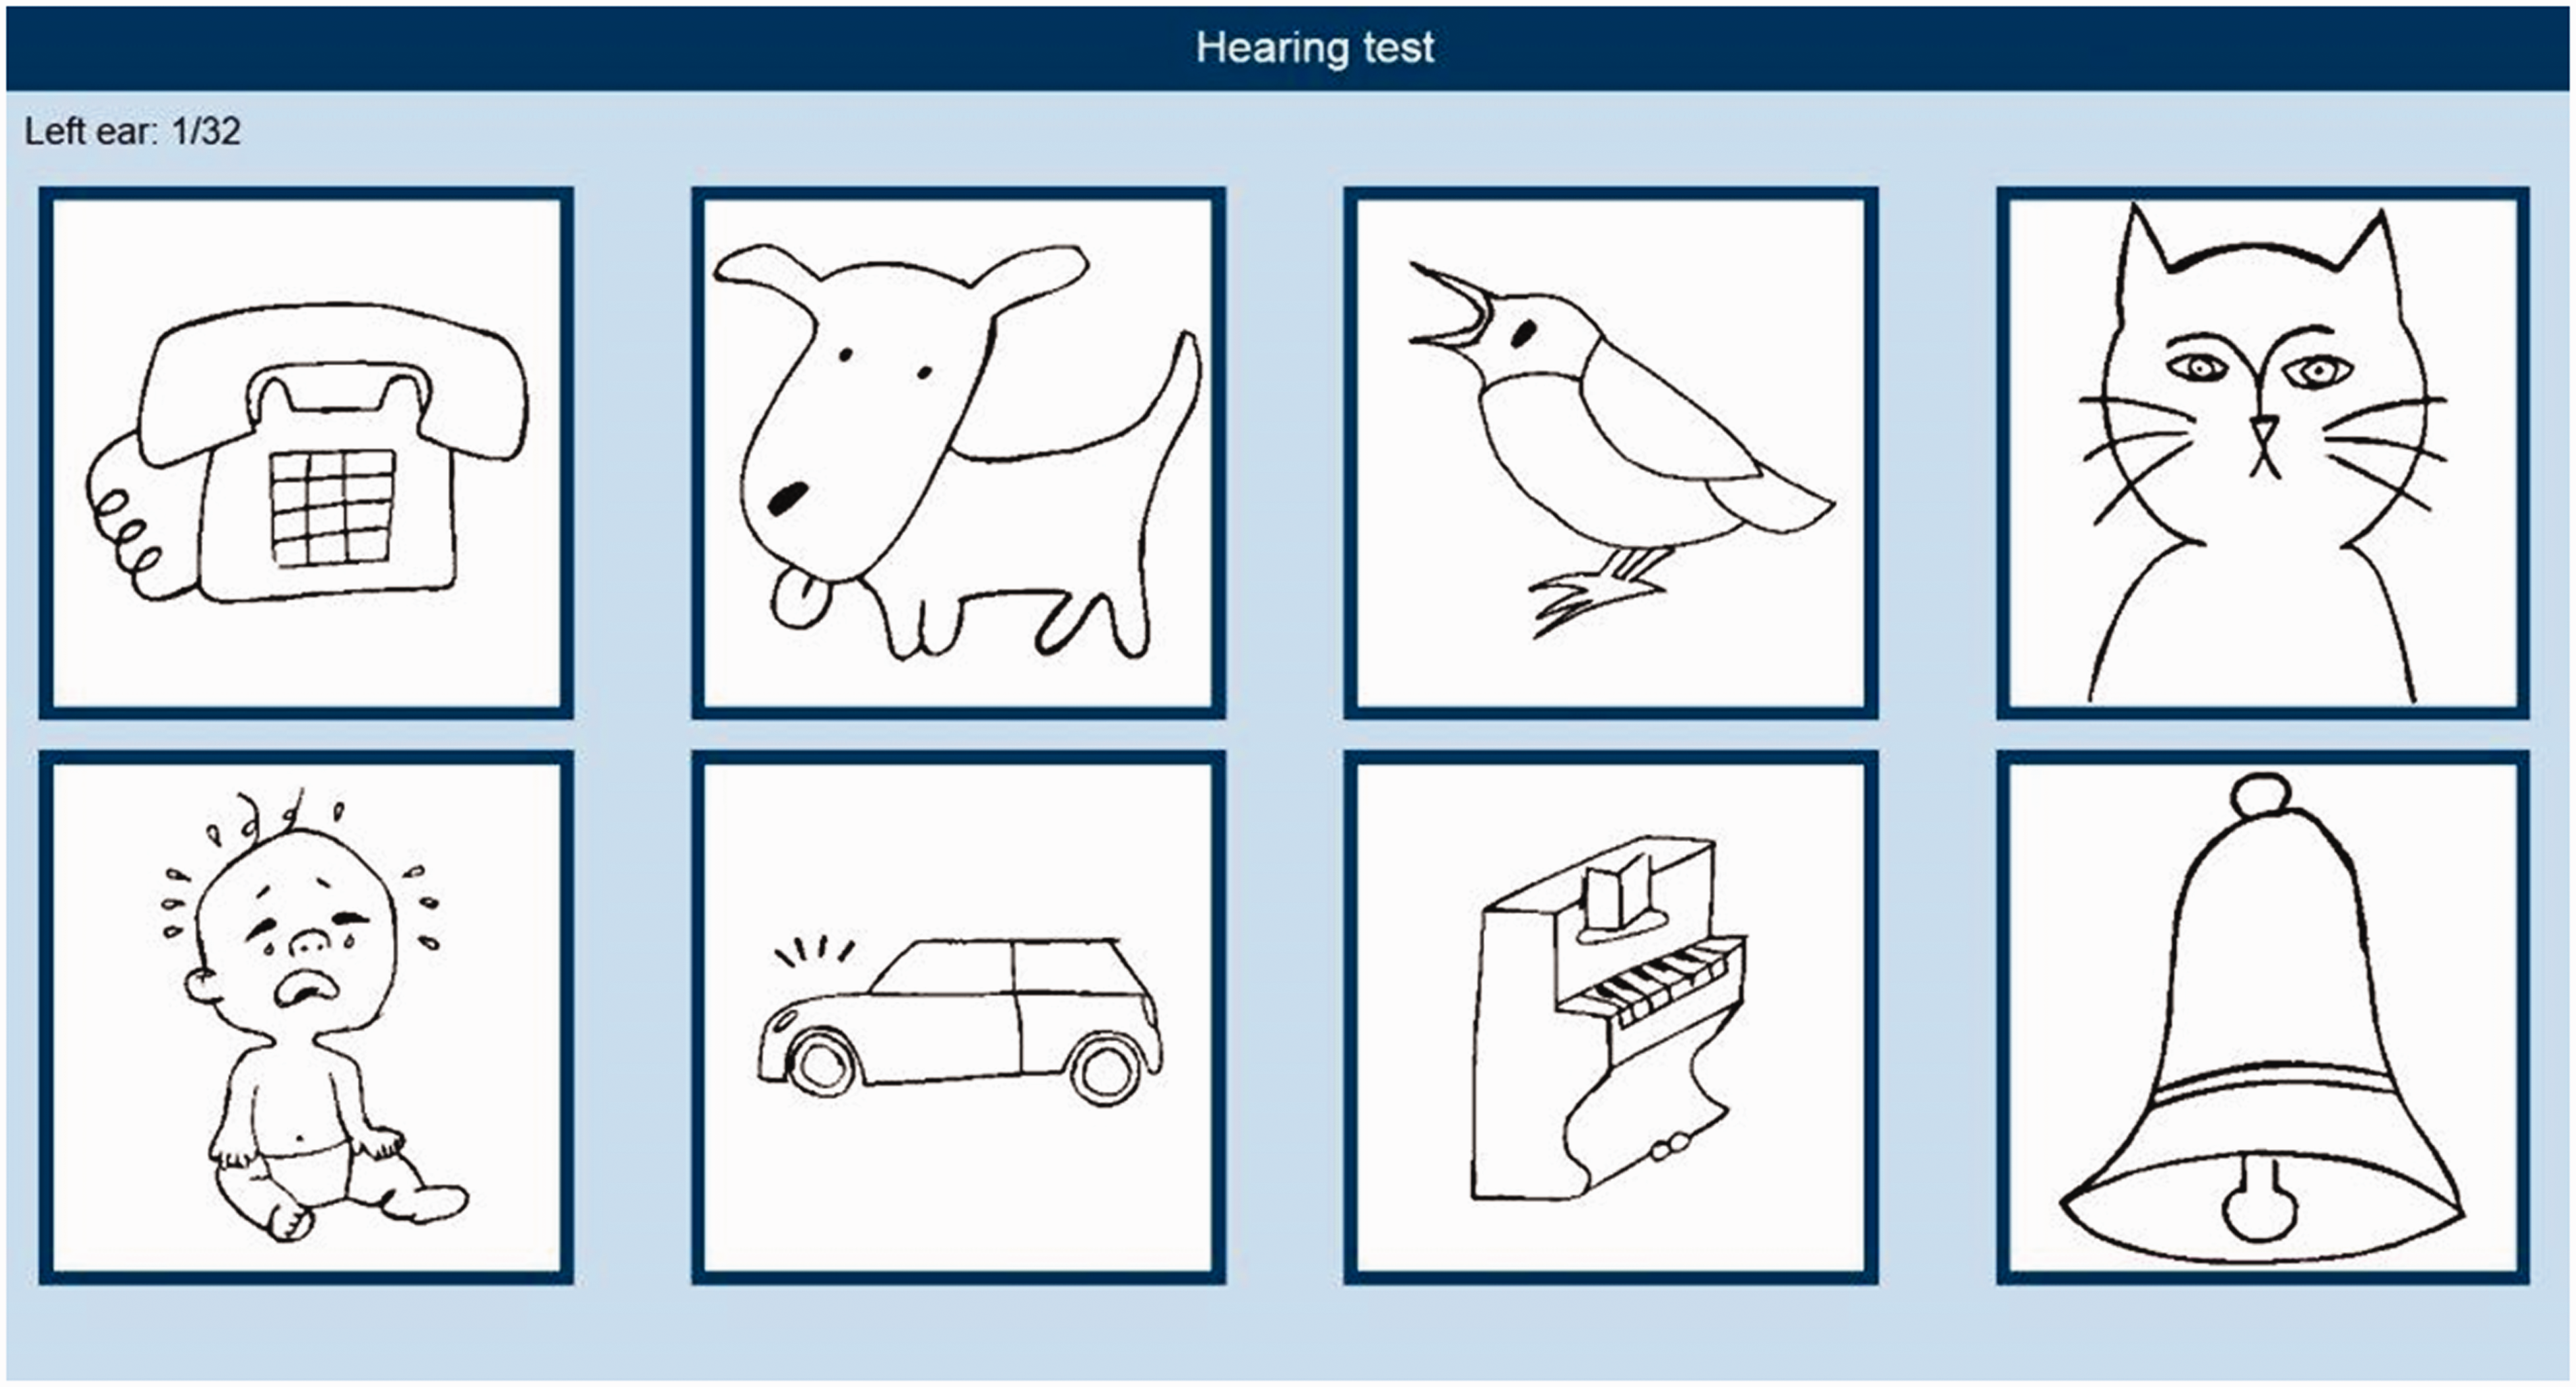
During the test phase, no feedback was given. The sounds were presented at SNRs of −9, −11, −13, −15, and −17 dB. Per SNR, every sound was presented six times with random presentation order, and each SNR was tested twice, resulting in 12 presentations per participant at each SNR. The order of SNRs tested was counterbalanced across participants. The noise started 500 ms before the target stimulus and ended 500 ms after each presentation and was a randomly selected segment from the noise file (1 min). Its level was fixed at 65 dB SPL.
The same measurement protocol was followed by Group 2 participants. After the assessment at fixed SNRs, Group 2 participants also performed two tests in which the sounds were presented adaptively: one using a 1-up 1-down procedure (targeting the SNR at which there is a probability of ≈50% for correct identification, i.e., SRT50) and one using a 1-up 2-down procedure (targeting the SNR at which there is a probability of ≈ 71% for correct identification, i.e., SRT71). The level of the sounds was varied in steps of 2 dB against a fixed background noise level of 65 dB SPL, with SNR = 0 dB as starting value. Every sound was presented four times randomly, leading to a test of 32 trials. Each test was conducted twice (test–retest). Half of the participants started with the 1-up 1-down procedure, and the other half started with the 1-up 2-down procedure.
Results and Discussion
Level adjustments (Group 1)

SRT50s and Slopes Per Sound Before and After the Application of Level Adjustments.

Note. SRTs and slopes result from nonlinear regression fits per sound. SRT = sound reception threshold; SE = standard error; SNR = signal-to-noise ratio.
Based on the data of Group 1 participants, the level of each sound was adjusted to the mean SRT across all sounds. Level adjustments were applied to the majority of sounds but were rather small (−1.2 to 0.3 dB).
Originally, the SEC was homogenized with nine stimuli and included also the sound of a trumpet, which was removed because of confusions with “piano” that were above chance level (acoustically, both sounded quite alike), and a relatively shallow slope of its psychometric function in comparison with the other stimuli. Level adjustments applied in these previous homogenization stages can explain why adjustments applied were rather small.
Reference curve, convergence to the SRT, and test–retest reliability 2 (Group 2)
For Group 2 participants, a psychometric function per participant was also fitted to obtain a reference curve. Precise psychometric fits could be obtained based on the measurements with fixed SNRs, with SEs below 0.5 dB for SRT estimates, and below 7%/dB for slope estimates (data not shown). Across Group 2 participants, a fitted SRT of −12.5 dB SNR (SE = 0.004 dB) and a steep slope of 18%/dB (SE = 0.001) were obtained. The reference psychometric curve is shown in Figure 2.
Reference psychometric curve for normal-hearing adults (N = 10) for the Sound Ear Check. Dots indicate predicted participant scores at fixed SNRs. The black line results from a nonlinear regression fit across all participants. The dotted line represents the chance level.
Per participant a psychometric curve was also fitted based on the pooled data of the adaptive measurements to estimate the SNRs for a 50% and 71% probability of correct identification. For each adaptive procedure, we investigated SNR convergence to these fitted SRTs, to determine the number of initial trials to exclude when computing the SRT. These adaptively determined SRTs (averaged across test and retest per participant) were then compared with the fitted SRTs, using Wilcoxon signed-rank tests. SRT convergence was reached at Trial 8 for the 1-up 1-down procedure (Mdn = −0.4 dB, W = 7, p = .89) and at Trial 9 for the 1-up 2-down procedure (Mdn = −0.8 dB, W = 7, p = .89). As such, the SRT50 and SRT71 can be determined as the SNR average from Trials 8 and 9 to Trial (?) 33, respectively, when the SRT needs to be estimated from an adaptive procedure. Trial 33 is an imaginary trial: It is not presented as an actual trial, but its SNR can be determined based on the response for Trial 32 (the final trial). SRTs determined as such were −14.5 dB SNR (SD = 1.0 dB) and −12.6 dB SNR (SD = 1.1 dB), on average, for the 1-up 1-down and 1-up 2-down procedure, respectively. A significant difference (Mdn of difference = −0.7 dB, W = −41, p < .05) with respect to the fitted SRT50 (M = −13.7 dB SNR, SD = 1.1 dB), but not (Mdn of difference = 0.3 dB, W = 21, p = .24) with respect to the fitted SRT71 (M = −12.8 dB SNR, SD = 1.0 dB), was found compared with SRTs calculated from the adaptive procedures.
Per procedure, the test–retest reliability was calculated as the standard deviation (SD) of the differences between test- and retest-SRTs,
3
divided by
Part II. Evaluation and Validation of the SEC
The second part of this article concerns the evaluation and validation of the SEC in adults with NH and hearing loss and involves a comparison with the DTT. For both tests, test–retest reliability was investigated, and the relation between the SRT and pure tone thresholds was studied. The sensitivity and specificity of both tests for detecting mild and moderate degrees of hearing loss were examined. SEC-SRTs were also related to DTT-SRTs, and the sensitivity and specificity of the SEC to detect individuals with impaired speech perception, based on different pass/fail-criteria for the DTT, were explored.
Although homogenization was aimed at maximizing the slope of the sound material at 50%, a 1-up 2-down adaptive procedure was chosen for further evaluation because it seemed to result in more precise adaptive SRT estimates and more accurate convergence to the SRT (see Part I). Also, targeting higher recognition probabilities (a 1-up 2-down procedure converges to a recognition probability of ≈ 71%) agrees more with the DTT’s convergence point of 79%, which makes the comparison between DTT and SEC outcomes, as presented in this article, more theoretically sound. Furthermore, targeting higher recognition probabilities is more appropriate for testing younger children (Witton et al., 2017). As shortening the test did not significantly reduce its test–retest reliability, a test with 24 trials was used.
Methods
Participants
In total, 135 participants were recruited from existing lab databases and via word of mouth. Participants with NH, defined as hearing thresholds ≤25 dB HL for all octave frequencies between 250 and 8000 Hz and for interoctave frequencies of 3000 and 6000 Hz, were considered as the reference NH group. Other participants (one or more hearing threshold(s) >25 dB HL) were classified as having hearing loss and formed the hearing-impaired (HI) group. Hearing loss etiologies varied and included genetic as well as age-related and noise-related causes, but all participants included had a sensorineural hearing loss, as we used an air bone gap averaged over the frequencies 500–4000 Hz ≤15 dB HL as an inclusion criterion. Two (out of 135) participants were excluded because of a larger air bone gap in the test ear. One participant with a known diagnosis of auditory neuropathy was also excluded.
In total, 132 participants were tested, of which 44 had NH, and 88 had hearing loss. The distribution of their hearing thresholds is shown in Figure 3. Reference-group participant’s ages ranged between 18 and 69 years (M = 40 years, SD = 14 years). With only 10 males, this group consisted primarily of female participants. Ages of HI participants ranged between 18 and 76 years (M = 60 years, SD = 14 years). In this group, 45 participants were female and 43 were male.
Distribution of the pure tone thresholds (in dB HL) per frequency (in Hz) for participants with hearing loss. Each black line represents a different percentile. Note. Only data of the test-ear are shown.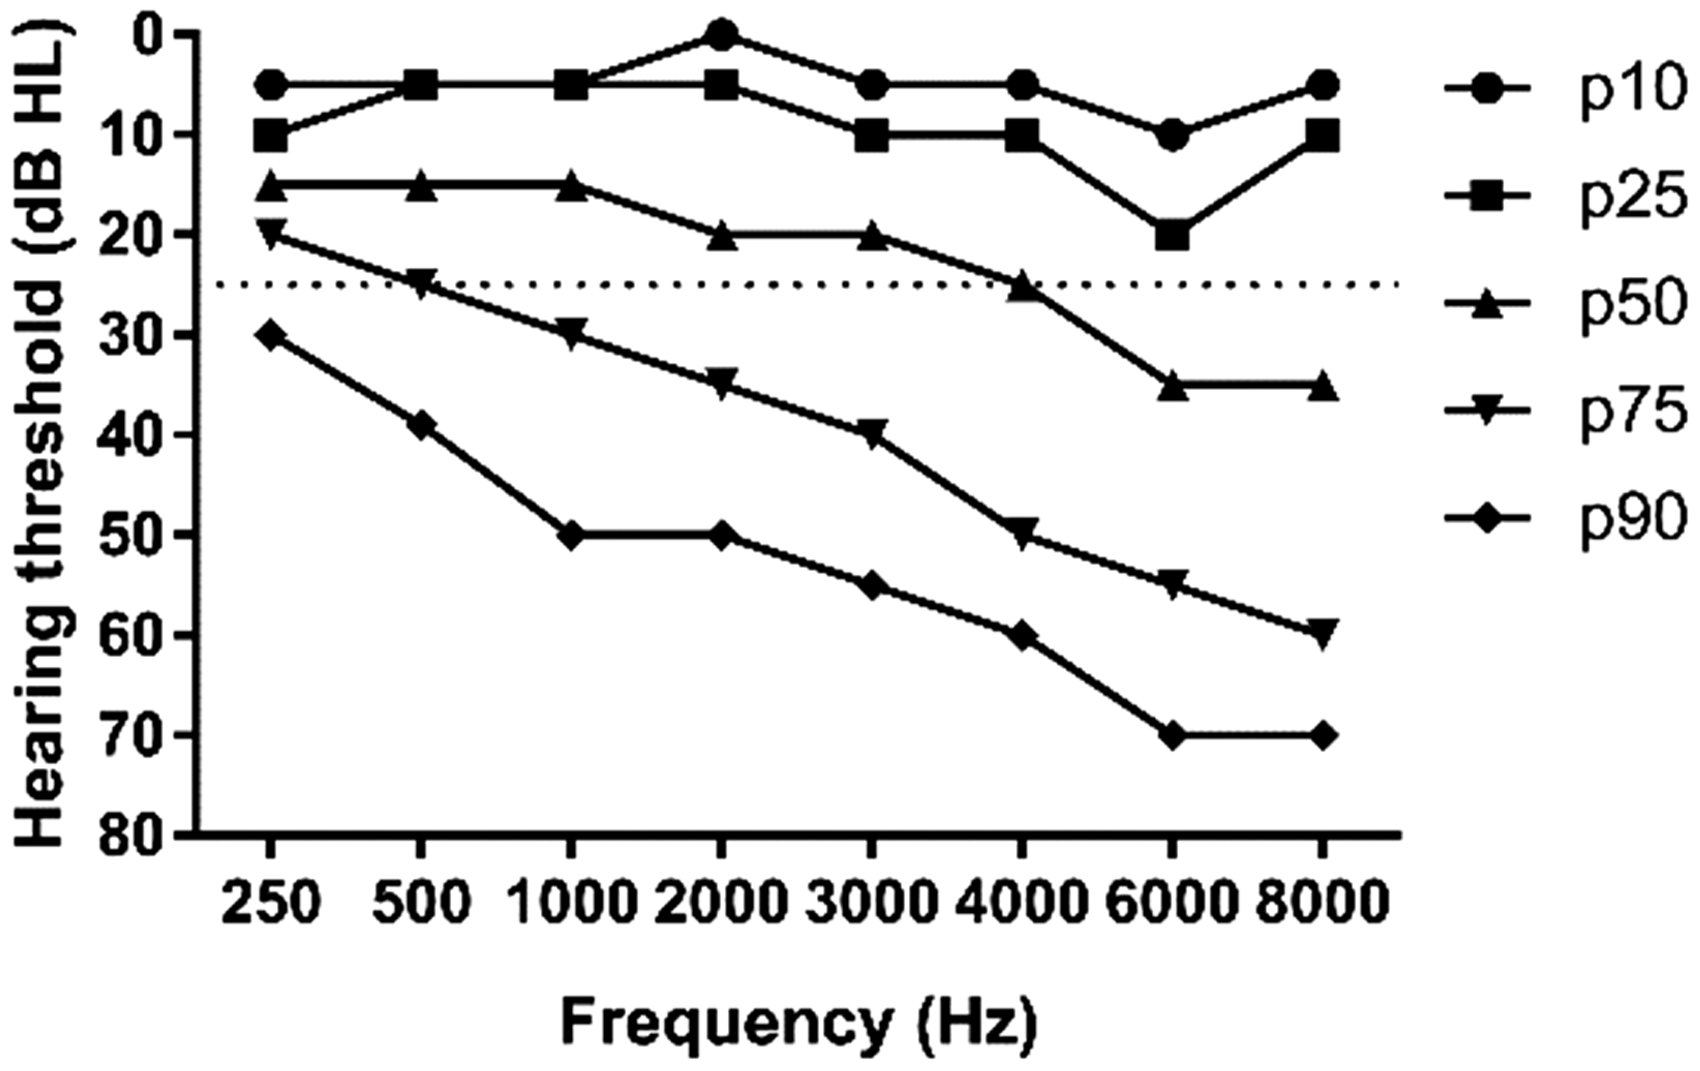
Materials and procedures
Measurements were conducted in a sound-proof booth for the majority of participants. NH participants were occasionally tested in their home environment in a quiet room. First, bilateral pure tone audiometry was conducted. Thresholds were measured using the Hughson Westlake method (Carhart & Jerger, 1959). If needed, masking was applied using the method of Hood (1960). Pure tone audiometry was performed, using a Madsen Orbiter 922 or Madsen Midimate 622 audiometer connected to a TDH-39 headphone for the measurement of air conduction thresholds, and a B71 bone vibrator for bone conduction, calibrated yearly according to ISO-389 standards.
Second, the Flemish DTT and SEC screening tests were administered. The test platform used consisted of a 7-inch Samsung Galaxy Tab 4 tablet, connected to DD45 transducers embedded in Peltor caps. The test setup was calibrated to the noises of the test materials at 80 dB SPL with a Bruël & Kjaer Sound level meter 2260 and a Brüel & Kjaer artificial ear 4153 using the flat plate.
Half of the participants started with the SEC, and the other half started with the DTT to prevent order effects. The tests were administered monaurally, that is, the right ear for NH participants (all thresholds ≤ 25 dB HL) and the better ear (based on the average hearing threshold for the frequencies 500, 1000, and 2000 Hz) for HI participants. Each test was conducted twice (test–retest) and was preceded by a short training test with the exact same test procedure, but consisting of only 12 trials. No feedback was given during training. For the SEC, an additional acclimatization phase was implemented which allowed the participant to learn the set (i.e., link the sounds to the images), presenting the sounds in noise at an easy SNR of + 10 dB SNR. During this phase, whenever a sound was correctly linked to its image, the image disappeared. Whenever a sound was incorrectly linked to an image, the sound was repeated until correctly linked with its image. Both training and acclimatization (for the SEC only) stimuli were presented bilaterally. Prior to the tests, participants were orally instructed and informed that they had to guess at challenging SNRs.
The Flemish DTT (Akeroyd et al., 2015; Jansen, Luts, Dejonckere, van Wieringen, & Wouters, 2013) consisted of 27 triplets (combinations of three monosyllabic digits: one [e:n], two [twe:], three [dri:], four [vi:r], five [vɛif], six [zɛs], and eight [ɑxt], uttered by a Female native Flemish speaker), which were randomly chosen from one of ten equivalent test lists and were presented at variable SNRs in a spectrally matched speech-shaped noise fixed at 65 dB SPL, which was interrupted in between triplet presentations. Starting at an SNR of −2 dB, the first 5 trials were scored using a triplet scoring procedure (i.e., all three digits had to be identified correctly), with a fixed SNR step size of 2 dB, ensuring a rapid descent to the SRT. From the sixth triplet onward, the SNR step size varied depending on the number of digits identified correctly, using the equation:
The SEC consisted of eight sounds that were randomly presented (each sound was presented three times) in a spectrally matched sound-shaped noise fixed at 65 dB SPL, which was interrupted in between trials. The first sound was presented at an SNR of 0 dB. The SNR on subsequent trials was varied in fixed steps of 2 dB using a 1-up 1-down procedure for the first 7 trials and a 1-up 2-down procedure from Trial 8 onward (Levitt, 1971). A matrix with stimulus illustrations (Figure 1) was shown on the tablet, and a response was given by tapping the image corresponding to the identified sound.
Results and Discussion
A pure tone average (PTA) based on the thresholds for frequencies ranging between 250–8000 Hz, including 3000 and 6000 Hz (in dB HL), was calculated from the audiogram of the test ear and was used for most of the analyses. The main outcome measure of the suprathreshold tests is the SRT (in dB SNR). This was calculated as the averaged SNR of the last 22 (DTT) and 17 (SEC) trials, including a nonpresented (imaginary) trial for which the SNR could be calculated based on the response of the last presented item. Test results were automatically transferred to a database server over a secure connection using Wi-Fi. The age of the participant was also recorded and included in the analyses.
Prior to the analyses, four participants were excluded from the reference group because of deviant performances on the SEC (N = 4) or the DTT (N = 1) compared with their peers, based on SRTs deviating ≥ 2 SDs from the mean (Ramus et al., 2003).
Exploratory results and learning effect
In an exploratory data analysis, we investigated a potential effect of session (test or retest) on the SEC-SRT and DTT-SRT by conducting a repeated measures analysis of variance (ANOVA).
Per test, a repeated measures ANOVA was conducted on the SRT data with session (test or retest) as a within-subject variable and group (NH or HI) as a between-subject factor. Despite training (and acclimatization for the SEC), a significant session effect was found both for the SEC, F(1, 126) = 73.73, p < .01, and the DTT, F(1, 126) = 5.54, p < .05, with retest-SRTs being significantly different (better) with values of 1.2 (SEC) and 0.3 (DTT) dB, presumably due to learning. This effect was independent of group, as shown by nonsignificant interaction effects between session and group, both for the SEC, F(1, 126) = 0.00, p = .95, and for the DTT, F(1, 126) = 0.04, p = .83.
Although an SRT improvement of 0.3 dB for the DTT can be considered negligible, given that it is much smaller than the measurement error, an improvement of 1.2 dB, as seen for the SEC, could be clinically relevant. Such an effect was not observed in the development phase, where test- and retest-SRTs for the adaptive 1-up 2-down procedure differed only by 0.2 dB. It is likely that participants from the development phase were trained by the assessment at fixed SNRs, which always preceded the adaptive measurements.
The more pronounced learning effect found for the SEC compared with the DTT suggests that participants needed more training to become familiar with the nonspeech sounds presented in the test as compared with the digits. Indeed, people are highly familiar with digits. Presumably, it requires more training to familiarize with the spectrotemporal properties of the sounds, which can be considered content learning. This has implications for test duration. However, with 2 min 33 s (SD = 26 s), the average test duration was significantly lower with 1 min 17 s, t(39) = −17.99, p < .01, as compared with test duration for the DTT (3 min 50 s, with SD = 30 s) in NH participants.
To gain more insight into the learning effect, four monaural (right ear) SEC tests were consecutively performed by ten naïve NH participants (aged between 28 and 57 years old) who did not participate in this study. A Friedman ANOVA indicated a significant main effect of test iteration (χ2 = 18.09, p < .01). Nonparametric post hoc pairwise comparisons indicated a significant difference between the first and second test iteration (p < .05), but not between further test assessments. SRTs were on average −9.2 (SD = 1.3), −11.1 (SD = 0.8), −11.5 (SD = 1.2), and −11.7 (SD = 1.1) dB SNR for the first up to the fourth test iteration. The mean improvement of 1.9 dB after the first test is larger than the learning effect of 1.3 dB that was found in our reference group. Presumably, the acclimatization and training tests did partly counter the learning effect, but this testing was not long enough (only 12 trials) to fully eliminate it.
All subsequent analyses, in which SRTs were involved, were done on retest data, but the same pattern of results was obtained when those analyses were repeated for test data.
Reference values and test–retest reliability
Reference values were determined in NH participants (N = 40). A reference SRT (±2 SD) of −11.3 dB SNR (±2 dB) for the SEC was obtained. This reference approached the expected value, based on the reference curve obtained in the development phase (−11.5 dB SNR) for a recognition probability of ≈71%.
For the DTT, the reference value of−11.1 (±1.6) dB SNR obtained in this study agrees with previously reported values of−11.5 and−11.1 dB SNR for young (20–30 years) and middle-aged (40–60 years) adults (Vercammen et al., 2017), respectively, and the original reference value of −11.7 dB SNR found by Jansen et al. (2013) in young adults. Although the DTT version used in this study applied a digit scoring procedure, comparisons to formerly used versions with triplet scoring can be made as both scoring methods target the same probability of recognizing three digits (79%). As such, SRTs resulting from these adaptive procedures with different scoring methods are comparable.
The test–retest reliability of SRT measurements was calculated using a method that balances out learning effects (Smits et al., 2004). As such, reliability was calculated as the SD of the differences between test- and retest-SRTs, divided by
The more favorable reliability values obtained with the DTT in NH participants are likely due to the larger number of trials used for the calculation of the DTT-SRT (22 vs. 17 for the SEC). With DTT-SRTs recalculated as the average SNR of trials 7 to 23 (i.e., 17 trials), test–retest reliability slightly decreased from 0.5 to 0.7 dB (95% CI [0.5, 0.9]) in reference-group participants.
Taking also HI participants into account, test–retest reliability for both tests decreased, but did not differ significantly, and was 1.0 (95% CI [0.9, 1.1 dB]) for the SEC, and 0.9 (95% CI [0.7, 1.0 dB]) for the DTT. A similar test–retest reliability of 0.5 dB for the DTT with digit scoring in NH participants was reported by Denys et al. (2019), which decreased to 0.8 dB when taking HI adults into account, who had a similar age distribution, and also with the value of 0.8 dB found by Jansen in their adult noise-exposed study sample (Jansen et al., 2013), with slightly younger participants (22–59 years). The shallower slopes of the psychometric functions of HI participants can explain this drop in test reliability. Also, as they were on average somewhat older, concentration fluctuations from test to retest might further explain the lower test reliability when including HI participants.
Predicting PTA from SEC- and DTT-SRTs
Pearson correlations between all variables in both NH and HI participants were explored to choose relevant predictors for subsequent regression models.
These were conducted to investigate the SRT-PTA relation for SEC and DTT (this section) and the mutual relations between SEC-results and DTT-results (next section) in the HI group. Data were evaluated with respect to the assumptions of regression analysis (no multicollinearity, homoscedasticity, linearity, independence, and normal distribution (Kolmogorov–Smirnov test of residuals).
The SRT-PTA relation is shown in Figure 4 for SEC and DTT. Strong and significant correlations between SRT and PTA were found, with r = .70 (p < .01) for the SEC, and r = .86 (p < .01) for the DTT.
Exploratory Correlational Analysis of Outcome Variables.

Note. Pearson correlations above the diagonal were obtained in normal-hearing participants (N = 40). Values below the diagonal were obtained in hearing-impaired participants (N = 88). PTA = pure tone average; SEC-SRT = sound reception threshold of Sound Ear Check; DTT-SRT = speech reception threshold for Digit Triplet Test.
Significant correlations are indicated by an asterisk (*), with *p < .05 and **p < .01.
The strong correlation of r = .86 between the DTT-SRT and the averaged hearing threshold agrees with findings previously reported for the Flemish DTT with triplet or digit scoring, for which correlations between the DTT-SRT and the PTA2,3,4,6kHz (Jansen et al., 2013) or PTA1,2,4kHz (Denys et al., 2019) of r = .86 have been found.
Although the correlation of r = .70 between the SEC-SRT and the PTA found in this study is in line with correlations between r = .60 and r = .75 reported in literature for sentence tests or CVC tests (Jansen et al., 2014), it is lower compared with the correlation value of r = .86 found for the DTT. One factor limiting the correlation obtained for the SEC might stem from the narrower spectral content of the SEC sounds, which only included frequencies up to 5000 Hz. Another explanation could be that the SEC and DTT measure spectrotemporal processing abilities with a different weighting. Indeed, correlational and post hoc regression analyses showed that the DTT explained variance in SEC-SRTs in addition to variance explained by the PTA alone. Although both the DTT and the PTA have an overlap in the spectral domain, temporal information (i.e., amplitude modulation) is absent in pure tones but is an important factor for speech discrimination. It is possible that the SEC is more sensitive to temporal aspects of hearing, whereas the DTT loads more heavily on spectral resolution. Some studies have shown that—when accounting for audibility—better amplitude modulation thresholds are obtained by HI participants when compared with NH participants, a phenomenon that has been linked to the loss of fast-acting cochlear compression and loudness recruitment, resulting in a perceptual magnification of amplitude fluctuations (Schlittenlacher & Moore, 2016; Wallaert, Moore, Ewert, & Lorenzi, 2017). It is possible that the sounds of the SEC are recognized mainly based on their temporal content and that HI persons are quite proficient in discriminating between the different sounds because of their increased sensitivity to amplitude modulation. This might explain why the variation in SEC-SRTs is rather small over the wide range of hearing loss degrees, resulting in a lower correlation between the SEC-SRT and the PTA.
Predicting DTT-SRT from PTA, age, and SEC-SRT
The relation between the SEC-SRT and DTT-SRT is shown in Figure 5. A strong and significant positive correlation of r = .79 (p < .01) was found between the SEC-SRT and the DTT-SRT.
Scatter plot of the SRT versus the PTA0.25–8kHz for the SEC (black dots) and the DTT (gray dots). Open circles represent data from normal-hearing adults (N = 40), and filled circles represent data from adults with hearing loss (N = 88). The lines result from simple linear regression fits to the data obtained from participants with hearing loss. The dotted lines represent the 95% CI of the fits. Only retest-SRTs are shown.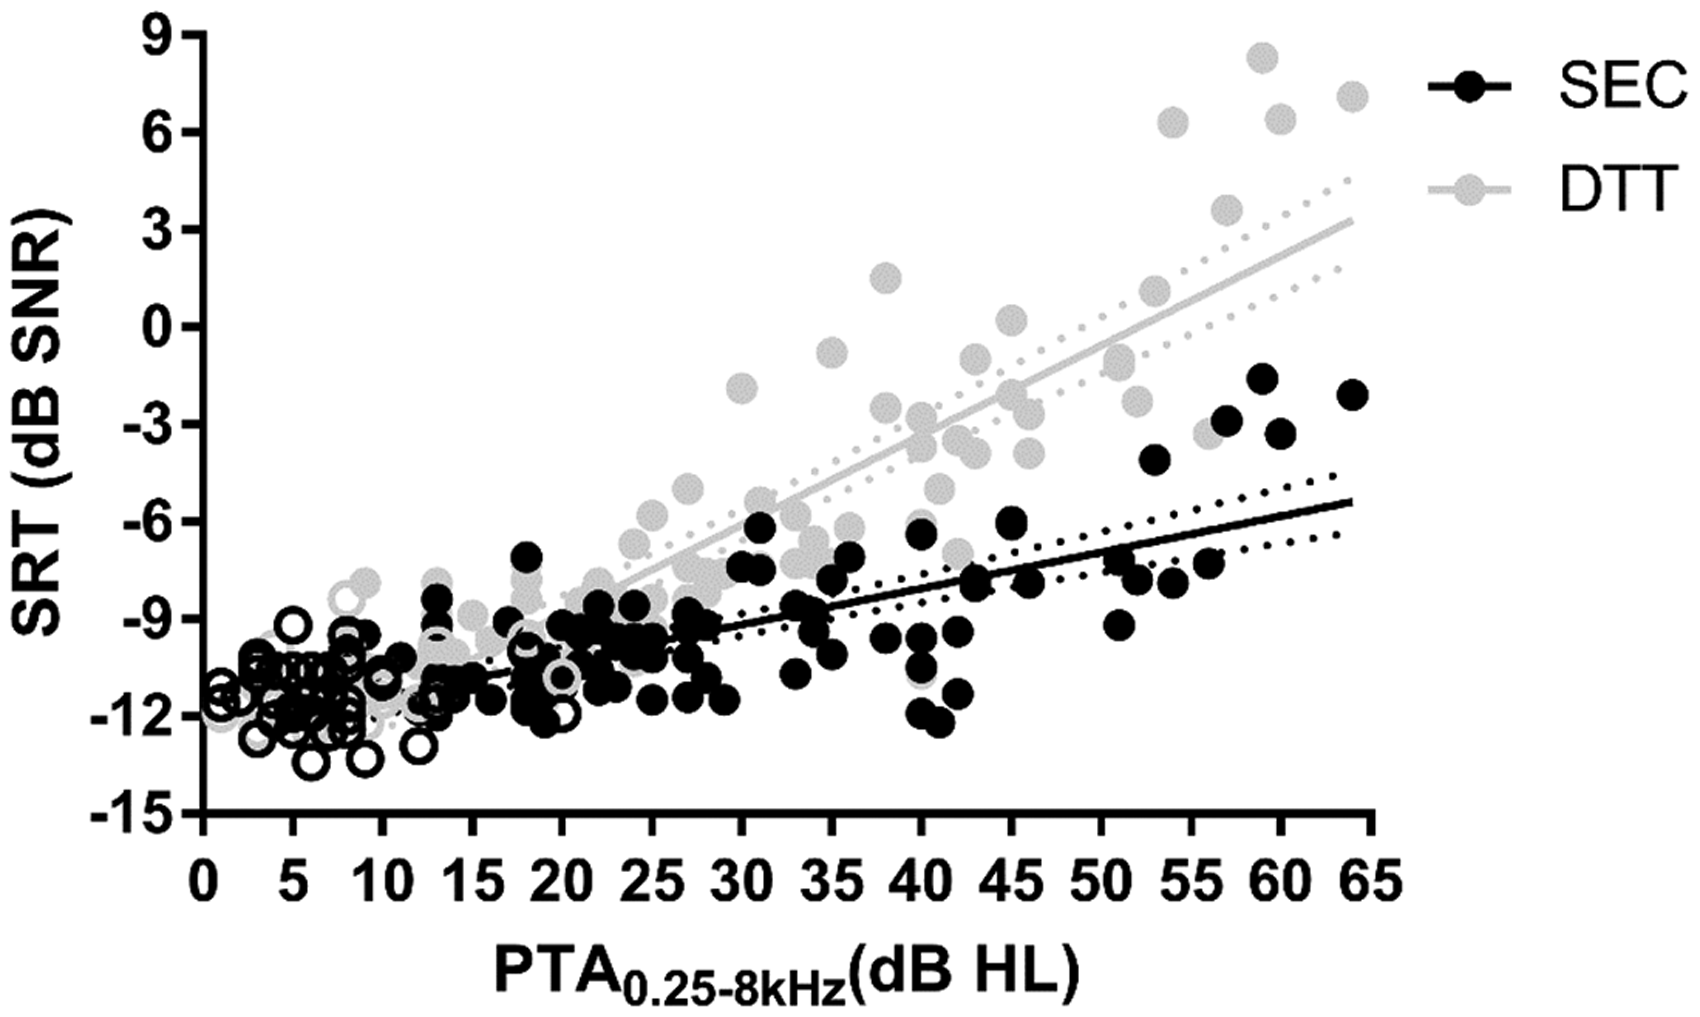
A significant multiple linear regression model was obtained, predicting the DTT-SRT from the SEC-SRT, PTA0.25–8kHz and age, F(3, 84) = 124.08, p < .01, with an R2 of .82 in HI participants. PTA0.25–8kHz and age were added to the model, based on the results from our univariate exploratory correlational analysis. All predictors contributed significantly to the model independently (SEC-SRT: β = .41, p < .01; PTA0.25–8 kHz: β = .54, p < .01; age: β = −.15, p < .01), with PTA0.25–8kHz being the most important predictor.
Sensitivity and specificity
Diagnostic Accuracy of the Sound Ear Check (SEC) and Digit Triplet Test (DTT).

Note. Values between square brackets indicate 95% confidence intervals. AUC = area under curve; PTA = pure tone average; DTT-SRT = speech reception threshold for the DTT; SNR = signal-to-noise ratio.
Asterisks (**) indicate significance, with p < .01.
Large and significant (p < .01) AUCs were obtained for both tests, with CIs far from chance level (0.50). A significantly better diagnostic accuracy was found for the DTT, as indicated by the nonoverlapping 95% CIs, to detect a mild hearing loss. For moderate hearing loss, both tests have equal diagnostic accuracy, given overlapping error bars.
With appropriate cutoff values, sensitivity and specificity values ≈ 70% for the SEC were obtained to detect a mild hearing loss. The test demonstrated higher sensitivity and specificity values ≈ 80% to detect moderate hearing loss or (slightly) impaired speech understanding in noise. A pass/fail criterion of −10.6 dB SNR appears to discriminate best between listeners with NH and mild hearing problems, both with respect to audibility and SNR loss.
For the DTT, high sensitivity and specificity values of ≈85% to 90% and ≈ 95% were obtained to detect individuals with a mild (PTA > 20 dB HL) and moderate (PTA > 40 dB HL) hearing loss, respectively. To detect a mild hearing loss, optimal pass/fail-criteria were −9.8 (PTA0.5–2 kHz) and −9.4 (PTA1–4 kHz) dB SNR. To detect a moderate hearing loss, optimal criteria were −3.6 (PTA0.5–2 kHz) and −7.2 (PTA1–4 kHz) dB SNR. Similar pass/fail-criteria of −10 and −7.1 dB SNR resulted in comparable sensitivity and specificity values ≈90% to detect individuals with a mild and moderate high frequency hearing loss, defined as a PTA2,3,4,6 > 10 dB HL and PTA2,3,4,6 > 40 dB HL, respectively, in Jansen et al. (2013). Similarly, Vercammen et al. (2017) demonstrated a high diagnostic accuracy of the test to detect middle-aged individuals with hearing loss, defined as a PTA1,2,4,8 > 25 dB HL with a pass/fail-criterion of −9.2 dB SNR. In sum, the diagnostic accuracy of the DTT with digit scoring is comparable with literature published previously, with only small differences in pass/fail-criteria resulting in similar sensitivity and specificity values to detect hearing loss, quasi irrespective of hearing loss definition and in various study samples (Folmer et al., 2017; Koole et al., 2016; Potgieter, Swanepoel, & Smits, 2018b; Potgieter et al., 2018a; Qi, Zhang, Fu, & Li, 2018).
Part III. Feasibility of the SEC in Children
The third part of this article concerns an evaluation of the SEC in children with school-entry ages. In a first group of children, the images and sounds used were evaluated with respect to their recognizability. In a second group of children, the test was evaluated in terms of its test–retest reliability and procedural performance (stability, convergence, and test duration). Also, perceptual homogeneity among sounds was verified.
Methods
Participants
For the evaluation of sounds and images used, 21 third grade kindergarten school children were recruited (children aged 5–6 years, Group 1). Because we did not want development problems, such as problems in the domains of language development and learning, confounding the results, seven children were excluded based on a fail on one or more skill domains assessed by the Screening Instrument For Targeting Educational Risk questionnaire (Anderson, 1989), 4 filled in by the teacher, or based on concerns expressed by the parents. In addition, one child with a documented hearing loss, reported by the parents, was excluded. The remaining 13 children (eight boys, five girls) all passed a pure tone audiometry screening. Their ages ranged from 64 to 80 months (M = 74 months, SD = 4 months). Four children were recruited from an international school and had a non-Belgian origin (Indian, Danish, Italian, and American).
The feasibility of the SEC test as an automated self-test was investigated in second group of third grade kindergarten and first grade elementary school children (children aged 5–7 years, Group 2). For this purpose, 32 children were recruited of whom two were excluded because they failed a pure tone audiometry screening. For two children, the data could not be retrieved. The remaining 28 children (11 boys, 17 girls) passed a pure tone hearing screening and had ages ranging between 65 and 87 months (M = 77 months, SD = 6 months). All were of Belgian origin.
Materials and procedures
All children were tested at their schools in a quiet room. A pure tone screening was conducted using the protocol currently used by Flemish school health services for the systematic hearing screening of first grade elementary school children. Pure tone stimuli were either presented via a Madsen Midimate 622 portable audiometer connected to calibrated TDH-39 headphones or via APEX 3.1 software (Francart et al., 2008, 2017) installed on a laptop through an external soundcard connected to calibrated HDA-200 headphones. For both ears, a pure tone of 30 dB HL at 1000 and 4000 Hz must be detected to pass the screening.
The evaluation of SEC sounds and images (Group 1) was done as follows: First, the sounds were played back at a comfortable level via the loudspeaker of a laptop using VLC media player in random order, and the child was asked to associate the sound with any referent (free association task). Second, we randomly showed images of the sounds and asked to name them (picture naming task). Third, we again played back the sounds at random and asked the child to link it to one of the pictures (linking task). Finally, the child was asked to make a drawing of the different sounds (drawing task). No feedback was given on their responses during any of the earlier tasks. Based on the data obtained in these children, the original images for the SEC test were fine-tuned and resulted in the final selection as shown in Figure 1.
Following oral instructions, a test–retest of the SEC test was conducted by the second group of children (Group 2). Materials and procedures used were identical to those described in Part II, but now both the left and right ear were tested, and the bilateral training test, following acclimatization, consisted of 24 trials (instead of 12) to counter the learning effect (cf. Part II). The start-ear was randomized across participants, and the ear order was reversed for the retest. Also, at retest, training and acclimatization phases were skipped. Test and retest assessments were conducted at separate days, with about one week between sessions.
Results and Discussion
Evaluation of sounds and images
Number of Children (out of 13) Correctly Associating, Naming, and Linking Sound Ear Check Sounds and Pictures.

Evaluation of the SEC
Prior to analysis, the results from five children with one or more unreliable staircases were excluded, that is, staircases in which the ceiling-SNR of + 10 dB was reached (two measurements) or staircases that lead to a positive SRT (three measurements).
To investigate the feasibility of the test in young children, first, SRTs, test–retest reliability, test stability, and test duration were investigated. A repeated measures ANOVA was conducted to investigate effects of session and ear on the SRT. Because counterbalancing start-ears could have obscured a possible improvement of the SRT due to learning or a decrease of the SRT due to attention loss, a repeated measures ANOVA was also conducted with test order as a within-subject factor. Also, we examined the within-subject SDs across the SNRs used for the calculation of the SRT, which indicates the stability of individual measurements, and investigated effects of ear, session, and test order by means of repeated measures ANOVAs. When the assumption of sphericity was violated, degrees of freedom were Greenhouse-Geisser corrected. With respect to test duration, a paired-samples t test was conducted to investigate differences from test to retest, thereby discarding training and acclimatization phases.
SRTs and SDs are shown in Figure 6. A repeated measures ANOVA indicated a significant main effect of ear, F(1, 22) = 7.18, p < .05, but not session, F(1, 22) = 2.41, p = .14, nor a significant session x ear interaction, F(1, 22) = 0.12, p = .74. The difference between ears was 0.7 dB, with better SRTs for the left ear (−9.4 vs. −8.7 dB SNR, on average). Albeit a small left–right difference, this finding is surprising given the study design with counterbalanced start-ears, which would balance out learning or attention effects. A repeated measures ANOVA indicated no significant effect of test order, F(3, 66) = 0.81, p = .49, indicating that the full-length training list eliminated the learning effect observed in adults (Part II). Hence, the SRTs of repeated tests were averaged per participant and yielded a reference SRT (±2 SD) of −9 (±2.8) dB SNR. This value differs from the reference of ≈−11 dB SNR obtained in NH adults by ≈2 dB, which is in line with child–adult differences reported in the literature for speech-in-noise tests (Leibold, 2017).
Scatterplot of the SEC-SRT versus the DTT-SRT. Open circles represent NH adults (N = 40), and filled circles represent HI participants (N = 88). The black line results from a simple linear regression fit to the data of HI participants. Dotted lines represent the 95% CI of the fit. Only retest-SRTs are shown.
Within-subject SDs were on average 1.9 dB, with a SD of 0.3 dB, which is on the order of the step size used in the adaptive procedure. No significant effects of session, F(1, 22) = 2.54, p = .12;, ear, F(1, 22) = 0.59, p = .45; session x ear, F(1, 22) = 0.12, p = .74; or test order, F(2.1, 46.17) = 1.53, p = .23, were found. Test–retest reliability was quantified by taking the RMS of the SDs of the SRT across test repetitions per participant. A measurement error of 1.3 dB was found. This value is higher than the 0.8 dB found in adults, but still acceptable.
Test durations recorded were on average 3 min 4 s and 3 min 15 s for test and retest, respectively, with SDs of 22 and 24 s. The small difference of 11 s was statistically significant according to a paired-samples t test, t(22) = −2.55, p < .05. Acclimatization and training took on average 2 min 33 s (SD = 43 s). Hence, total test duration would be 5 min 42 s (SD = 53 s), that is, about 6 min.
Based on pooled data across sessions and ears, a stimulus-response matrix was constructed, as well as an approximation of the overall and item-specific psychometric curves to investigate confusions and verify the convergence of the adaptive procedure and homogeneity of tokens used. Psychometric curves were fitted using Formula (1), but with SNRs normalized to the participants’ SRT.
A confusion matrix with prominent diagonal scores ranging between 60% (for “bell”) and 83% (for “bird”) was obtained. Except for “baby,” which was often confused with “cat” (17%), all confusions were well below chance level (12.5%), with the majority (85%) below 5%.
Psychometric curve fitting yielded an SRT71 of 0 dB SNR, indicating that the adaptive procedure adequately converged to the threshold (SNRs were normalized to the SRT). A slope of 15.9%/dB was obtained, which is close to the slope of 18%/dB obtained in adults and which is in accordance to the measurement reliability of 1.3 dB. This points to a highly balanced material in terms of perceptual equity. Indeed, the SD across SRT fits for the individual tokens was only 0.4 dB and fitted SRTs for the individual tokens ranged over 1.4 dB. Except for “bell,” SRT fits for the individual tokens deviated by ≤ 0.5 dB from the average SRT across sound tokens. These findings validate the level adjustments applied in the homogenization experiment (Part I).
Conclusions and Future Research Perspectives
A language-independent hearing screening test based on masked recognition of ecological sounds, the SEC, was developed. Following perceptual equation of difficulty across stimuli, a psychometric curve with a steep slope was obtained, resulting in a highly precise test. SEC outcomes obtained from adults were significantly associated with the averaged hearing threshold and moderately high sensitivity and specificity values to detect mild hearing loss were found. However, the DTT outperformed the SEC, with respect to its association with the audiogram and diagnostic accuracy to detect mild hearing loss. Higher sensitivity and specificity values were found to detect individuals with (slightly) impaired speech understanding in noise.
The main advantage of the SEC is its language independence. The test can potentially be applied to participants who are not native speakers or not fluent in the local language. This advantage suggests that the SEC could be used as an international standard hearing screening test and is possibly applicable in countries that have no validated speech-in-noise test available. Another extremely relevant application is the framework of school-age hearing screening for which universal standards are nonexistent and the current methods lack precision. This study showed that the SEC might be feasible for this purpose, given its high reliability and stability. Although one training test is required to eliminate the learning effect, test durations are appropriate for school-age hearing screening.
Nevertheless, the high proportion of children (5/28) aged 5 to 7 years performing the SEC unreliably is still a barrier for wide application. It might be that instructions are not sufficiently clear, that the current test takes too long or is not sufficiently engaging, or that the use of eight sounds is too taxing for some children. Furthermore, whereas the use of ecological sounds makes the test language independent, it does not automatically bypass potential cultural effects on their recognition. Therefore, the sound material used could be revised. Currently, not all stimuli are of equal length (zero-padded noise-stimulus-noise blocks are used). Also, problematic stimuli could be removed or replaced, preferably taking into account familiarity across cultures/countries. Most important, the relatively poor sensitivity and specificity values obtained in adults for the detection of mild hearing loss hinder broad adoption of the current test format, especially because children with mild hearing losses are also being missed by currently implemented school-age hearing screening programs.
Validation of the test in young children with different degrees and types of hearing loss is currently ongoing in a multicenter study steered by the European Federation of Audiology Societies Working Group on School-Age Hearing Screening and is a collaborative effort between partners from different European countries. The results of that study will allow a revision of the test and fuel follow-up research comparing the SEC test with the locally used school-entry hearing screening methods across multiple countries. Ultimately, a uniform screen, for example, the SEC, at school entry may provide the opportunity of linking the results of the school-age screen with newborn hearing screening outcomes. This provides the potential of an accurate quantification of the incidences of acquired and late-onset childhood hearing loss and, as such, form an evidence base for the need of school-age hearing screening.
Footnotes
Acknowledgments
The authors thank Maud Lobel, Toon Van Hemelen, Davinia De Vuyst, and Jo Goossens (master students of the Speech-Language Pathology and Audiology program, KU Leuven) for their help with participant recruitment and data collection. Laura Sels is acknowledged for her help with the spectrotemporal analyses. Marya Sheik Rashid is acknowledged for her help during the pilot studies preceding this study.
Authors’ Note
Portions of this article were presented at the European Federation of Audiology conference (Interlaken, Switzerland, June 7–10, 2017), the European Union for School and University Health and Medicine conference (Leuven, Belgium, September 6–8, 2017), and the Hearing Across the Lifespan conference (Cernobbio/Lake Como, Italy, June 7–9, 2018).
Declaration of Conflicting Interests
The authors declared no potential conflicts of interest with respect to the research, authorship, and/or publication of this article.
Funding
The authors disclosed receipt of the following financial support for the research, authorship, and/or publication of this article: This work was supported by a TBM-FWO grant from the Research Foundation Flanders (grant number T002216N).