
Abstract
An aided sound-field auditory steady-state response (ASSR) has the potential to be used to objectively validate hearing-aid (HA) fittings in clinics. Each aided ear should ideally be tested independently, but it is suspected that binaural testing may be used by clinics to reduce test time. This study simulates dichotic ASSR sound-field conditions to examine the risk of making false judgments due to unchecked binaural effects. Unaided ASSRs were recorded with a clinical two-channel electroencephalography (EEG) system for 15 normal hearing subjects using a three-band CE-Chirp® stimulus. It was found that the noise corrected power of a response harmonic can be suppressed by up to 10 dB by introducing large interaural time differences equal to half the time period of the stimulus envelope, which may occur in unilateral HA users. These large interaural time differences also changed the expression of ASSR power across the scalp, resulting in dramatically altered topographies. This would lead to considerably lower measured response power and possibly nondetections, evidencing that even well fit HAs are fit poorly (false referral), whereas monaural ASSR tests would pass. No effect was found for simulated lateralizations of the stimulus, which is beneficial for a proposed aided ASSR approach. Full-scalp ASSR recordings match previously found 40 Hz topographies but demonstrate suppression of cortical ASSR sources when using stimuli in interaural envelope antiphase.
Introduction
Auditory steady-state responses (ASSRs) can be used as a method for validating the quality-of-fit of a hearing aid (HA) to a nonresponsive subject such as an infant. ASSR thresholds are higher than behavioral thresholds (Michel & Jørgensen, 2017). An ASSR which is detected (passing some kind of statistical significance test) at a particular sound pressure level (SPL) infers that the patient can perceive the stimuli at that SPL, with the strength of the inference relying on the strictness of the statistical test. The large intersubject variation in ASSR signal-to-noise ratios (SNRs) complicates estimating precise behavioral thresholds from the ASSR (Michel & Jørgensen, 2017; Rodrigues & Lewis, 2013). However, if a HA reduces ASSR thresholds in hearing impaired persons down to acceptable levels, it can be understood that the HA is well fit to the patient and that their aided absolute hearing thresholds are likely also improved (Zenker-Castro & Barajas de Prat, 2008). Several methods for ASSR detection exist (Cebulla et al., 2006). An ASSR can objectively be determined as being present if it evokes a response which is greater than the noise floor by a predetermined F-test ratio, assessed in the frequency domain (Dobie & Wilson, 1996). This analysis mainly addresses ASSR response power, as a proxy measure for the broader concept of detectability. Sound-field ASSR is proposed to be employed for HA fit verification to place the HA in the signal pathway in a plausible listening condition. While separate monaural ASSR threshold testing of each ear is preferable, the reduction in test time (Gransier et al., 2017; Lins et al., 1995) or the increase in test transparency to parents (Mehta et al., 2019) of diotic stimulation may be attractive to clinics. Otherwise, binaural testing might be considered more holistic and akin to real world use.
Caution must be taken, however, to ensure that nominally diotic stimulation is not perturbed by environmental factors to produce a dichotic stimulus, as some forms of dichoticism are known to reduce ASSR level. These publications, however, mainly consider presentation of multiple different simultaneous frequency bands and rates to each ear in an effort to increase the overall time efficiency of ASSR to make it practicable. This effort has remained relevant for many years, with particular examples being John et al. (1998), Armstrong and Stapells (2007), Hatton and Stapells (2010, 2013), Gransier et al. (2017), and Mühler et al. (2018). Relatively few papers, however, to the authors’ knowledge, consider conditions which relate to the present papers concern; that of other dichotic perturbations to a stimulus with the same stimulation frequencies and rates presented to each ear, particularly those which may unintentionally arise in a clinical aided sound-field ASSR measurement (Maki et al., 2009; Vercammen et al., 2017; Zhang & Boettcher, 2008).
The main goal of this study was to probe whether nominally diotic aided sound-field ASSR is reliable and robust against likely clinical situations which incidentally cause dichotic stimulation. Such situations considered included are (a) sound-field rendered dichotic by the interaural time differences (ITDs) imposed by a unilateral HA fitting or (b) ITD and interaural level differences (ILDs) caused by incidence of the sound on the head from either side. “Plausible” dichotic stimuli were used which may accidentally arise as a result of nominally diotic stimuli being perturbed by sound-field presentation (e.g., head movements) or HA processing (e.g., delay), to verify the use of aided sound-field ASSR HA validation.
The vertical montage usually used in clinical studies provides relevant information in the absence of interaural disparities in the stimulus. For stimuli with interaural disparities, however, this assumption needs to be verified. Hence, in the first experiment, the ASSR to a diotic condition was compared with that of several dichotic conditions designed to simulate realistic perturbation by sound-field presentation or HA processing. These dichotic conditions either had a large ITD as might be caused by the processing delay in a unilateral digital HA (
We hypothesized that during an aided sound-field measurement, plausible clinical conditions exist which may reduce the ASSR detectability during nominally diotic stimulation, compared with successive monaural stimulation. We propose conditions which produce dichotic stimulation, such as interaural delay or level differences caused by a unilateral HA or the head shadow from sound nonfrontally incident. Furthermore, we hypothesize that binaural interaction includes additional brain regions compared with monaural stimulation and hence alters ASSR topography relative to the complex sum of two equivalent monaural responses.
Methods
All participants provided informed consent, and all experiments were approved by the Science-Ethics Committee for the Capital Region of Denmark (ref. H-16036391).
Two-Channel EEG
Fifteen (seven females) normally hearing (symmetric <20 dB HL 250 Hz–4 kHz) young (mean 23.2 years, ± 2.20) listeners participated in the two-channel EEG measurements. The stimulus was presented in a soundproof booth, unaided, over Etymotic ER-1 insert phones. It consisted of three simultaneously presented modified CE-Chirp® chirp trains: a double octave width chirp centered at 707 Hz presented at a near 40 Hz repetition rate (38.0859 Hz) and two single octave width chirps centered at 2 kHz and 4 kHz presented at two near 90 Hz repetition rates (94.7266 Hz, 95.7031 Hz). Repetition rates are chosen to coincide with frequency domain analysis bins and well-spaced from each other and potential noise sources. Stimuli were presented at a nominal broadband free-field level of 65 dB SPL. Each chirp train was scaled to match the equivalent band power of the international speech test signal (Holube et al., 2010), except in the case of the ITD + ILD lateralized stimuli where frequency band step filters derived from behind-the-hear aided head-related impulse responses (HRIRs) were applied (Denk et al., 2018), shown in Figure 2.
The stimulus conditions consisted of a reference diotic condition and seven dichotic conditions. The dichotic stimuli were of three types: (a) a large ITD resulting in envelope antiphase of either the 40 Hz rate band (“Inv 40,” see Figure 1) or the 90 Hz rate bands (“Inv 90”), (b) interaural inverse polarities with no effect on the envelopes (“Inv Pol”), and (c) lateralized with realistic combinations of ITDs and ILDs (Figure 2) to simulate incidence of the stimulus from ±45° (ITD: 354 µS) and ± 90° (ITD: 688 µS) on the azimuthal plane. These values are derived from HRIRs from a B&K head and torso simulator (HATS) Type 4128 C model wearing “behind-the-ear” style HAs (Denk et al., 2018), with sound incident at the aforementioned azimuthal angles. ITDs were calculated by cross correlating the left and right channels of the HRIRs and taking the lag at which correlation was maximal. Frequency band ILDs were computed as the mean of the absolute values in the frequency domain across each band’s limits. ±45° and ±90° were chosen as they produce the intermediate and maximal ITDs which may arise from a HRIR. The Inv 40 and Inv 90 conditions are so named as the applied ITDs intent is to cause a π interaural phase difference in the envelopes of the frequency bands which have a repetition rate in the 40 Hz and 90 Hz regions. Due to the precise rates used, the Inv 40 condition has the effect of setting the 90 Hz region bands also into near antiphase (

Stimulus Waveforms for Left and Right Channels in the Inv 40 Condition. An ITD of

Frequency Band-Channel-Specific Filters, Derived From Behind-the-Hear head-related transfer functions (HRTFs), Used to Simulate Head Shadow and Baffle Effects for Stimuli Incident From the Left; 45° and 90°.
Positive ITDs Refer to a Leading Right Channel Signal.
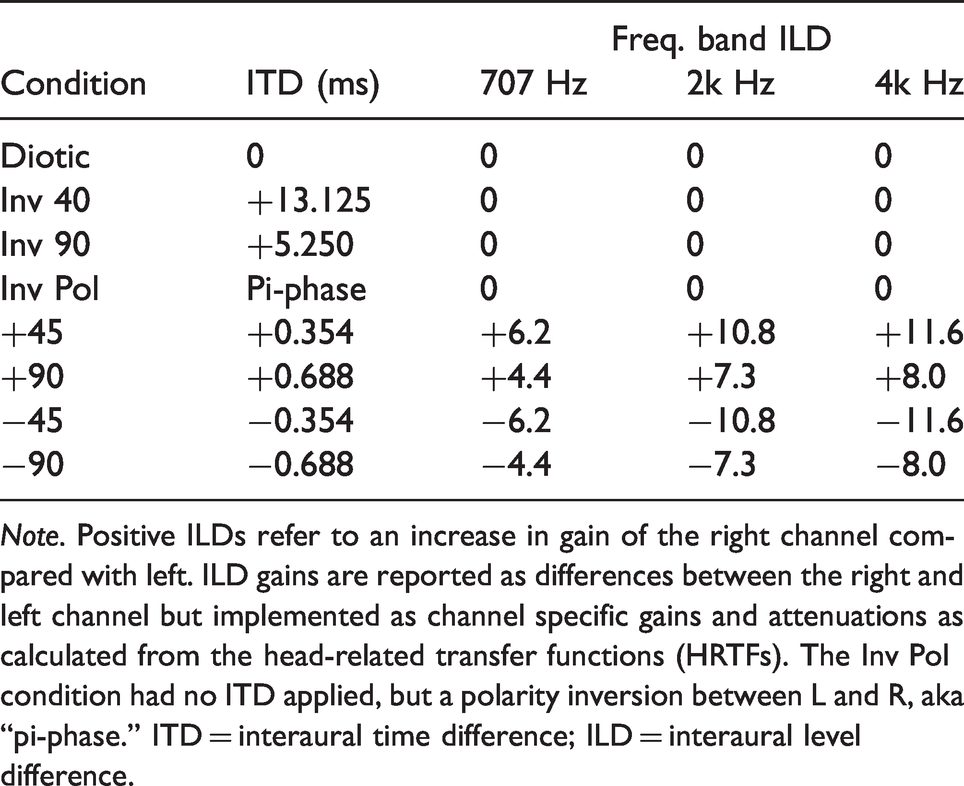
Note. Positive ILDs refer to an increase in gain of the right channel compared with left. ILD gains are reported as differences between the right and left channel but implemented as channel specific gains and attenuations as calculated from the head-related transfer functions (HRTFs). The Inv Pol condition had no ITD applied, but a polarity inversion between L and R, aka “pi-phase.” ITD = interaural time difference; ILD = interaural level difference.
An adapted clinical two-channel EEG system (Interacoustics Eclipse), at a sampling rate of 48 kHz, using a vertex-mastoid montage, was used as a front end to collect EEG data. It was connected to an RME Fireface UC soundcard from which data were recorded and then processed both live and also later offline in custom software using MATLAB, in epochs of 98,304 samples (2.048 s, fast Fourier transform (FFT) resolution 0.488 Hz [3.s.f]).
To minimize measurement time for the listeners, data collection for each condition continued until a Bonferroni-corrected F-test threshold (corresponding to a p value of 0.01/n, where n is number of epochs) was reached for all three response bands in both channels, or until 459 epochs (
The live preview processing and offline processing differed only in that the live processing used the Bonferroni correction to control for the multiple comparison of continuous live SNR F-test testing. Offline processing employed noise weighted averaging (John et al., 2001). This disadvantaged the response detection power of the live SNR estimate to ensure that responses would be likely to be clearly significant, if present, in offline processing. A per epoch amplitude threshold of 40 µV was used to remove noisy epochs. This was found effective in combination with the noise weighted averaging to suppress noise dominant epochs (John et al., 2001), including those contaminated with muscle artifacts. The first two harmonics of the corresponding repetition rate in the averaged frequency domain representation were considered in the analysis. Reported ASSR levels were noise corrected (NC) by subtracting the mean power of the surrounding ±10 frequency bins of each respective response bin, avoiding other response bins or known particularly contaminated bins (e.g., line noise, Global System for Mobile Communications (GSM)). Only ASSRs which passed the F-test threshold of 7.1420 dB were used in analysis. NC allows estimation of the “true” ASSR power captured within the relevant FFT frequency bin (Dobie & Wilson, 1996). We assume linear addition of the noise power and ASSR power, and hence by subtraction of the estimated noise contribution we are able to isolate an approximation of the ASSR only. This allows valid comparisons across EEG recordings, particularly across those with differing noise floors local to the response frequency (e.g., differing recording lengths).
The resulting ASSR powers were compared by fitting mixed linear models, implemented in R using the ‘lme4’ (Bates et al., 2015) package, followed by planned pairwise analysis of variance comparisons between each condition and the corresponding diotic reference with ‘lmerTest’ (Kuznetsova et al., 2015).
64-Channel Scalp Topography
A subset of six subjects (three females) participated in an extension study using a 64-channel (BioSemi Active Two) full-scalp montage at a sampling rate of 8192 Hz. Five conditions were tested using the same base stimulus as in the two-channel EEG. This included two monaural conditions (left and right), diotic, a repeat of the Inv 40 condition, and an “Inv 40+d” condition with an ITD of
Results
ASSR power is presented logarithmically as we wish to focus on the relative differences between conditions, rather than absolute linear change. A factor change in any particular person’s ASSR level between conditions is expected, which for some will be a large linear amplitude amount if they present overall strong responses, or a small linear amount for those who present weak responses. These factor changes are expressed fairly in the dB scale between such subjects. This is particularly important for the statistical analysis and subsequently the results are graphed in kind.
Two-Channel EEG
Figure 3 shows the NC ASSR levels for the two-channel recording divided by harmonic and stimulus frequency band. Harmonic 1 and Harmonic 2 refer to a response at the stimulus rate and twice the stimulus rate. First harmonic responses are generally greater than second harmonic, and 707 Hz band responses are generally greater than the other two bands. There is a significant main effect of Condition, seemingly driven by the Inv 40 response. This is supported by the significant factors Condition, Harmonic, and Stimulus Frequency in Table 2. Of a possible 1,440 observations (15 subjects, 3 bands, 2 harmonics, 2 channels, 8 conditions), 1,320 were recorded. The missing 120 observations are due to five subjects not having measurements for both spatial stimuli “directions” (+ and −). Of the observations made, 154 did not meet the SNR detection threshold when the whole recording was considered; 99 of the rejected observations (64.3%) were from second harmonic responses. Only detected ASSRs are used for analysis in the two-channel EEG data.

Noise Corrected Power of the ASSR for Each Stimulus Condition, Shown Separately for Each Stimulus Frequency Band and Response Harmonic. Means were taken across subjects and both channels. Error bars represent 95% confidence intervals. The red horizontal lines correspond to the mean level of the relevant reference diotic condition.
ASSR NC Level Statistics Derived From Separate Mixed Linear Models Fit to Each Harmonic of Left Channel Processed Data From the Two-Channel EEG Measurements.

Note. Random effects tested using LRTs and fixed effects using F test. Type III analysis of variance with Satterthwaite’s method. Significance codes: 0—***, 0.001—**, 0.01—*. ITD = interaural time difference; NC = noise corrected; LRT = likelihood ratio test.
Noise levels per recording (15 Subjects × 8 Conditions) were compared against their length (see Supplementary Figure 1). Results indicate no strong bias toward longer recordings having systematically lower noise but highlight the large variability in recording noise levels even for separate recordings of similar length. This emphasizes the utility of NC when comparing across discrete recordings.
Table 2 summarizes the F-test statistics from the model fit to the left channel ASSR NC level data; however, highly similar results and identical synthesis could be made addressing the right channel data. The strong random effect of subject indicates significant variation among subjects, as expected (Laugesen et al., 2018). The significant factor Condition and two-way interaction in both harmonics indicates that the Inv 40 condition has a varied effect depending on the response stimulus frequency band.
Planned pairwise comparisons to the left channel confirms that the NC ASSR levels were significantly lower in the Inv 40 condition in the first harmonic 707 Hz band (−10 dB, p < .001) than the corresponding diotic condition response. Furthermore, powers were also significantly reduced in the Inv 40 condition in the second harmonic, 2 kHz and 4 kHz bands, (–6.5 dB, p = .0098 and –5.7 dB, p = .0101), compared with the corresponding Diotic condition response. No other modifications of the diotic stimulus led to a significant change in the ASSR.
64-Channel Scalp Topography
The data shown here are the NC power level response to the 707 Hz carrier, 40 Hz repetition rate band, shown in dB relative to 1 nV2. Topography is interpolated between electrode points with a cubic function, limited to the montage boundaries. Electrode locations are marked with
Figure 4 shows that the responses to left and right monaural stimulation are similar, with a lateralization toward the contralateral side. The main topological pattern consists of a large area of greatest ASSR level across the central frontal cortex, with reduced activity across the temporal and parietal lobes, and minima located over the occipital lobe. Topographical patterns match those previously found (Saupe et al., 2009).

Measured Response Topographies to the Monaural Left and Right Conditions. NC = noise corrected.
In Figure 5, the complex summation (R + L) of the monaural responses produces a 6 dB increase, indicating in-phase summation as expected, and no change in the topography pattern. The response to the diotic condition shows a near identical pattern but at a reduced total power level. The difference plot confirms this showing a near uniform −2 dB difference across the scalp between the diotic condition and monaural summation.

Topographies of the Summed Left and Right Monaural Condition Responses, the Measured Response to the Diotic Condition, and the Point-Wise dB Difference Between the Two. NC = noise corrected.
In Figure 6, the complex difference (R − L) of the monaural responses results in a reduction in total power of 8 dB compared with a single monaural response. The topography shows more complete cancelation across the frontal cortex and left cortex scalp regions, with less cancelation occurring across the temporal lobes and especially above the right frontal cortex which forms the main maximum. The minima are now more diffuse, but with the main minimum still occurring above the occipital lobe. The measured Inv 40 condition shows a smaller reduction, 5 dB less than the monaural and 9 dB less than the diotic condition. The topology is fairly laterally symmetric, with equal level maxima above the lateral areas of the frontal cortex, extending more frontally and above the temporal lobe in the right hemisphere. The minimum remains above the occipital lobe but at a reduced level. The difference plot highlights particularly the absence of a left hemisphere maximum in the simulated R − L plot, and that the Inv 40 right hemisphere maximum extends much more posteriorly than in the simulated R − L plot.

Topographies of the Left Monaural Condition Response Subtracted From the Right, The Measured Response to the Inv 40 Condition, and the Point-Wise dB Difference Between the Two. NC = noise corrected.
In Figure 7, the R + circL has very similar total power to the R − L condition in Figure 6. The topography is similar to that of the R − L condition but with a marginally greater right frontal cortex maximum. The Inv 40 + d condition shows a maximum covering most of the right frontal cortex but with substantial power spreading also across into the left frontal cortex. The difference plot also indicates that the Inv 40 + d plot is overall higher in level than the simulated R + circL, and that the maximum does spread more into the left hemisphere and posteriorly.

Topographies of the Left Monaural Condition Responses Circularly Shifted and Added to the Right, the Measured Response to the Inv 40-d Condition, and the Point-Wise dB Difference Between the Two. NC = noise corrected.
Point-wise difference plots highlight disparities between the topography color maps which may be otherwise subtle. Simple dB differences allow this easily and avoid the compound consequences of performing several additions and subtractions of complex responses may have on a result. As complex amplitudes still contain uncorrelated noise components (as in this methodology NC is performed after conversion to absolute power), each addition or subtraction of the complex amplitudes would add an uncontrolled noise component (of 3 dB on average) to the noise floor per operation. The data do not allow for a more detailed statistical analysis due t the small sample size.
It should be noted that nonsignificant ASSRs were not rejected as part of the topography processing. Under ideal conditions, one would record each 64-channel condition for long enough that all electrodes showed a statistically significant NC response, but ultimately of different levels, to allow plotting of the “true” ASSR power topography. It was infeasible to do so using this 64-channel montage as, inevitably, there are electrode positions which receive little response power and therefore rarely receive a statistically significant ratio of response power to estimated noise power. If we were to eliminate from the data set all recordings at a per-electrode level which did not achieve statistical significance, first the number of recordings averaged together at each electrode position would vary between electrodes. This would lead to some topographical areas being based on very few observations, or even a single observation, in what would be presented as a subject-average topography. Second, removing nonsignificant, low SNR, recordings would compress the dynamic range of the topography considerably, eliminating all low SNR responses, especially in those conditions (such as the Inv 40) where particularly low power responses are measured. Where on the scalp a low response power was received is itself an interesting and key piece of information the topography displays, even if not directly telling about the response. This remains true for the topographies created through response addition and subtraction, whereby we may visualize how the high power response areas interact relative to those areas which receive low response power.
Discussion
Nominally diotic aided sound-field ASSR appears reliable and robust in the most common clinical situation which would result in incidental dichotic stimulation, with the head turned away from the sound source. This is particularly beneficial in the case of testing infants or young children whose movement cannot be easily controlled. Large targeted ITDs which placed the stimuli into presentation rate-specific interaural antiphase had no effect on 90 Hz ASSR power but showed a significant reduction on 40 Hz ASSR power. This Inv 40 condition had a weaker secondary effect of reducing the ASSR second harmonic of the 90 Hz responses which were also in interaural antiphase as a result of this condition. Such a condition might occur in a clinic should binaural aided sound-field ASSR be used on a patient with a unilateral HA fitting. While possible (Kates, 2008), it is not known how likely it is a HA would produce the required delay to cause it. Topographies of the 40 Hz ASSR to the 707 Hz response band indicate some complex interaction, with both the Inv 40 and Inv 40 + d condition producing different ASSR power contours across the scalp in addition to reduced overall power. Finally, simulation of dichotic topographies through the complex sums and differences of monaural responses showed some agreement to the authentic dichotic ASSR topographies; however, real ASSR showed consistently less interaural interaction than simulations predicted, under the assumption of complex addition of monaural responses.
Two-Channel EEG
Monaural conditions using the two-channel EEG setup were included in a prestudy in preparation for the present one. The results (not shown) demonstrated a simple increase from monotic to diotic of +3 to +5 dB depending on which band response was considered.
No significant difference between the diotic condition and any of the ±45° and ±90° ILD + ITD conditions was found. This may be because lateralization of stimuli has no consequence for ASSR production. Alternatively, the binaural interaction components in response to ILD and ITD may be opposite or very small (Zhang & Boettcher, 2008), resulting in no observable net effect.
The Inv 40 condition had the effect of reducing the 707 Hz band response in the first harmonic. It also resulted in the reduction of the 2 kHz and 4 kHz bands second harmonic responses. This consistent effect across the targeted response bands evidences a model of separate neural responses to each ear which then destructively interfere neurally at a higher processing level or electrically at the scalp far-field. In contrast, if neurons were responding collectively to the simple sum of the stimulation channels, a “boosted” strong response at twice the repetition (Harmonic 2) rate might be expected, with no response at the true rate (Harmonic 1). Furthermore, this result infers that the “Harmonic 2” response is mostly composed of a direct response to the second harmonic in the stimulus, as a distortion component of the neural activity would be expected to show a common attenuation with the fundamental (Harmonic 1) during the Inv 40 condition. The significant factor subject in Table 2 suggests that even during diotic stimulation there is a large intersubject variation in the response level received at the scalp. This intersubject variability is the main reason why precise ASSR thresholds are difficult to map directly to behavioral thresholds, as the exact point at which a particular response level is no longer statistically detected is sensitive to the parameters of the test. This highlights the issue that it is vital for responses not to be artificially suppressed by the stimulation paradigm, as even a small systematic reduction in response level can greatly affect the detectability at low sensation levels (and thus at thresholds). Of course, this is not directly an issue in this study as stimuli were presented well above threshold levels.
The observed response reduction during the Inv 40 condition would suggest that the plausible situation of binaural testing on unilateral HA users could artificially suppress some response harmonics. Such a strong response suppression, if it occurs unnoticed at near-threshold presentation levels, would result in good HA fittings being pronounced poor. The chance of this occurring could be minimized or eliminated by using a response detector which always considers multiple harmonics. It is currently unexplained why significant reductions in ASSR are seen under the Inv 40 envelope antiphasic condition, but none is seen in the similar Inv 90 condition. The fact that no effect of the simulated spatialized signals was found is encouraging for the clinical implementation of sound-field ASSR, as it seems normal frontal incidence of the stimulus does not need to be maintained. This is in opposition to the auditory brainstem response (ABR) behavior reported in Riedel and Kollmeier (2002), but this is likely because ASSR is dominated by middle latency response power (Bohorquez & Ozdamar, 2008).
Topography
A qualitative analysis of the topographies will provide information on whether the classical vertical montage might need to be reconsidered in cases of dichotic stimulation. The small sample size does not allow statistical analysis, but the topographies provide information about power distribution.
The monotic and diotic conditions produced topographies in line with literature (Saupe et al., 2009). The two monaural responses are equal in level and similar, if slightly mirrored, in topography. Lateralization of the response pattern is seen toward the contralateral side, with greater power always found in the right hemisphere during dichotic simulations and stimulation. This contralateral and right bias is in agreement with the findings of Ross et al. (2006) who investigated the lateralization of 40 Hz ASSR.
Topographies are rather stable across subjects under the monotic and diotic conditions, with the greatest inconsistency being in the precise location and spread of the low level areas around from the occipital area into the parietal and temporal areas. Individual topographies of the Inv 40 and Inv 40 + d do show consistent reductions in response power compared with the diotic case but are otherwise much more diverse, with no visually consistent spatial trends (refer to Supplementary Figure 2).
Comparing in Figure 5 the sum of the monotic responses to the diotic response, we can conclude that the level of the binaural response is globally slightly lower, while the topographies largely do not differ. The simulated summation approach assumes a diotic response results in double the ASSR magnitude (quadruple power) than the monaural, as evidenced by the 6 dB increase in total power. A more moderate increase is seen in reality, indicating increased activity or synchronization but less than predicted. This demonstrates that in-phase summation of responses is likely.
Figure 6 indicates a more complex relation between the simulated monaural difference and the Inv 40 condition. The R − L plot mainly confirms that the left and right monaural responses are in phase and create similar ASSR distributions at the scalp, but each with a contralateral asymmetry, resulting in power remaining in the lateral extremes. In the central regions, cancelation was not total with some power still remaining, indicating imperfect phase alignment between the monaural responses. Circularly shifting the left channel average epoch ahead by the equivalent of 180° produced an extremely similar result to that of the R − L subtraction, as expected (result not shown).
It is interesting to consider that no modification in the Inv 40 condition reduced level of the stimulation. The stimulus was easily perceivable to all subjects, with the sensation of two separate sound sources placed at the entrance of each ear. As all the stimuli were identical in their magnitude spectrum, and were all perceived by the subjects, a somewhat similar neural representation to the diotic stimulus can be assumed to exist within the brain. Phase cancelation within certain neural generators or due to the mixture of opposing electromagnetic emissions must then account for the reduction in response power. This reductive interaction effect seems weaker than that which is predicted by the simulated R − L difference. It is confirmed here, however, that the Inv 40 condition may lower the response power to below that of a response to diotic or monaural stimulation, as shown in the two-channel EEG results.
Finally, Figure 7 R + circL shows a very similar pattern to that of R − L in Figure 6. This is consistent with our expectations, as the circular shift was equivalent to 189°, resulting a similar operation to simply subtraction (at the response harmonics), assuming a symmetric response waveform. The Inv 40 + d topography, however, is distinct to that of any other condition. The overall ASSR power received at the scalp is intermediary between that of the Diotic and Inv 40 responses, illustrating that the response is indeed related to interaural phase alignment.
Conclusion
In conclusion, nominally diotic sound-field ASSR appears reliable and robust against most common situations which may result in dichotic stimulation, such as the sound-field stimuli being incident on the head from the side. It is not robust, however, against large ITDs which may arise when performing binaural unilaterally-aided ASSR tests. A unilateral HA fitting is a plausible clinical condition which causes dichotic ASSR stimulation and may in turn induce a reduction in the ASSR as hypothesized. This artificial and significant response suppression is particularly problematic when establishing aided responses during HA fitting validation, likely leading to false referrals.
Under the inverse modulation conditions, we found it is possible for a binaural measurement, containing twice the stimulus power as a monaural measurement, to produce a response 10 dB lower than the diotic response. Topographies to dichotic stimuli vary between subjects, but group averages clearly infer that binaural responses show less interaction than the simulated complex summations or differences of the monaural responses. This evidences neither a pure summation nor cancelation of monaural ASSRs during diotic and Inv 40 stimulation, respectively. We can speculate that this may be due to binaural cross-over on the auditory pathway and some shared generators between left and right monaural ASSR. Phase cancelation may occur at a source level by inducing neuron asynchrony or simply cancelation of the EEG voltages in the far-field at the scalp. Bohorquez and Ozdamar (2008) report that the brainstem is estimated to contribute only 10% to the overall ASSR at 40 Hz, indicating the large overall level drop between the diotic and Inv 40 conditions level may be due to effects in the cortex.
While the ASSR power suppression still occurs when the stimulus envelope is not precisely in interaural antiphase (the Inv 40 + d condition), it is weaker and the topography shows a transition pattern. This would indicate, however, that the measured binaural ASSR power can also be suppressed by near antiphase dichotic presentation, increasing the chance it may occur incidentally in a clinical environment.
Supplemental Material
sj-pdf-1-tia-10.1177_23312165211031130 - Supplemental material for Potential Destructive Binaural Interaction Effects in Auditory Steady-State Response Measurements
Supplemental material, sj-pdf-1-tia-10.1177_23312165211031130 for Potential Destructive Binaural Interaction Effects in Auditory Steady-State Response Measurements by Sam Watson, Søren Laugesen and Bastian Epp in Trends in Hearing
Supplemental Material
sj-pdf-2-tia-10.1177_23312165211031130 - Supplemental material for Potential Destructive Binaural Interaction Effects in Auditory Steady-State Response Measurements
Supplemental material, sj-pdf-2-tia-10.1177_23312165211031130 for Potential Destructive Binaural Interaction Effects in Auditory Steady-State Response Measurements by Sam Watson, Søren Laugesen and Bastian Epp in Trends in Hearing
Supplemental Material
sj-pdf-3-tia-10.1177_23312165211031130 - Supplemental material for Potential Destructive Binaural Interaction Effects in Auditory Steady-State Response Measurements
Supplemental material, sj-pdf-3-tia-10.1177_23312165211031130 for Potential Destructive Binaural Interaction Effects in Auditory Steady-State Response Measurements by Sam Watson, Søren Laugesen and Bastian Epp in Trends in Hearing
Footnotes
Acknowledgments
The authors acknowledge the contributions of Remi Arnoult and Sascha Bilert in the preparatory data collection and Sinnet Greve Bjerge Kristensen for her consultancy.
Declaration of Conflicting Interests
The authors declared no potential conflicts of interest with respect to the research, authorship, and/or publication of this article.
Funding
The authors disclosed receipt of the following financial support for the research, authorship, and/or publication of this article: Part of this work was supported by the William Demant Fund.
References
Supplementary Material
Please find the following supplemental material available below.
For Open Access articles published under a Creative Commons License, all supplemental material carries the same license as the article it is associated with.
For non-Open Access articles published, all supplemental material carries a non-exclusive license, and permission requests for re-use of supplemental material or any part of supplemental material shall be sent directly to the copyright owner as specified in the copyright notice associated with the article.