
Abstract
The sound-field auditory steady-state response (ASSR) is a promising measure for the objective validation of hearing-aid fitting in patients who are unable to respond to behavioral testing reliably. To record the sound-field ASSR, the stimulus is reproduced through a loudspeaker placed in front of the patient. However, the reverberation and background noise of the measurement room could reduce the stimulus modulation used for eliciting the ASSR. As the ASSR level is heavily dependent on the stimulus modulation, any reduction due to room acoustics could affect the clinical viability of sound-field ASSR testing. This study investigated the effect of room acoustics on the level and detection rate of sound-field ASSR. The study also analyzed whether early decay time and an auditory-inspired relative modulation power model could be used to predict the changes in the recorded ASSR in rooms. A monaural auralization approach was used to measure sound-field ASSR via insert earphones. ASSR was measured for 15 normal-hearing adult subjects using narrow-band CE-Chirps® centered at the octave bands of 500, 1000, 2000, and 4000 Hz. These stimuli were convolved with simulated impulse responses of three rooms inspired by audiological testing rooms. The results showed a significant reduction of the ASSR level for the room conditions compared with the reference anechoic condition. Despite this reduction, the detection rates for the first harmonics of the ASSR were unaffected when sufficiently long recordings (up to 6 min) were made. Furthermore, the early decay time and relative modulation power appear to be useful predictors of the ASSR level in the measurement rooms.
Keywords
Introduction
Effective early diagnosis and intervention of pediatric hearing loss at the age of 6 months, or even before, is crucial for the development of speech to a level comparable to normal-hearing infants (Moeller, 2000; Yoshinaga-Itano et al., 1998). This has led to the implementation of universal newborn hearing screening programs in many countries around the world, for example, most developed countries had implemented such hearing screening programs by 2015 (Morton & Nance, 2006; Naumann et al., 2015; Neumann et al., 2019; Ptok, 2011; Singh, 2015). Such screening programs aim at identifying hearing loss in infants at the earliest possible age, leading to the early treatment of their hearing impairment. The primary goal in early intervention is to ensure that a child has access to speech sounds, due to early critical windows for language and brain development (Sharma et al., 2002; Sininger et al., 2010). A successful early intervention of hearing loss relies on appropriate adjustments of the hearing-aid amplification, which is called hearing-aid fitting. Hearing-aid fitting validation then becomes a critical procedure for ensuring that the infant receives adequate auditory stimuli and for avoiding potential delays in language development (Marcoux & Hansen, 2003). However, the validation of the prescribed hearing-aid gain is challenging in prelingual infants because standard behavioral tests are highly unreliable. For this reason, some researchers have suggested alternative objective procedures based on auditory evoked potentials, such as cortical auditory evoked potentials (e.g., Punch et al., 2016) and auditory steady-state responses (ASSRs; e.g., Picton et al., 1998). These electrophysiological measurements are promising because they can verify that the brain is receiving and processing the auditory input without the need for a voluntary response from the patient. In this study, an approach using the sound-field ASSR is considered for hearing-aid fitting validation. The study focused on investigating the potential challenges in sound-field ASSR recordings associated with the room in which the test is carried out.
The ASSR is an auditory evoked potential in response to repeated transient stimuli or sinusoidally amplitude-modulated tones. It is elicited by specific groups of neurons firing phase locked to the modulation envelope of the auditory signal (Picton et al., 2003; Rance, 2008). The sound-field ASSR involves acoustic stimulation through a loudspeaker instead of presenting the signal via insert earphones as it is traditionally done in the clinic (Picton et al., 1998). The loudspeaker stimulation allows the inclusion of the hearing aid into the stimulation path. In one of the first reported such studies, Picton et al. (1998) estimated physiological hearing thresholds using sound-field ASSR which were not significantly different from behavioral hearing thresholds measured via insert earphones. The majority of research to date has focused on the validation of the sound-field ASSR as an accurate tool for hearing-aid fitting validation, demonstrating a good agreement between physiological and objective thresholds measured in aided and unaided conditions (Damarla & Manjula, 2007; Hernandez-Perez & Torres-Fortuny, 2013; Park et al., 2013; Picton et al., 1998; Sardari et al., 2015; Selim et al., 2012; Shemesh et al., 2012; Stroebel et al., 2007). However, the potential effect of the room on the sound-field ASSR measurement has received little scientific attention. In fact, the studies that investigated sound-field ASSR for hearing-aid fitting validation did not assess the effect of the testing room on the ASSR. Most of these studies only reported the listening environments to be sound-treated-rooms (e.g., Hernandez-Perez & Torres-Fortuny, 2013; Park et al., 2013; Picton et al., 1998; Sardari et al., 2015; Shemesh et al., 2012) with low background noise according to the standard ANSI S3.1 (ANSI S3.1., 2003; e.g., Park et al., 2013; Picton et al., 1998; Sardari et al., 2015), and no information about the reverberation time of the rooms was provided. To understand the effect of the room on sound-field ASSR is crucial, as the reverberation and background noise of the room in which the test is carried out can distort the acoustic stimulus modulation (Houtgast et al., 1980; Plomp, 1983). As the ASSR amplitude is heavily influenced by the modulation of the acoustic signal (e.g., John et al., 2001; Picton et al., 1987), the influence of room acoustics could present a barrier to the future clinical implementation of the sound-field ASSR test for infants’ hearing-aid fitting validation.
Previous studies investigated the ASSR amplitude when the modulation depth for sinusoidally amplitude-modulated stimuli was systematically varied, and they reported that the ASSR amplitude reduces as the modulation depth of the acoustic signal decreases (Bharadwaj et al., 2015; Boettcher et al., 2001; Dimitrijevic et al., 2001; John et al., 2001; Kuwada et al., 1986; Lins et al., 1995; Picton et al., 1987; Rees et al., 1986; Roß et al., 2000; Rønne, 2012). When the ASSR is recorded with stimuli with equal root-mean-square value but different modulation depths, the ASSR amplitude reaches its maximum when it is recorded with 100% amplitude-modulated tones (Dimitrijevic et al., 2001; John et al., 2001). When instead the peak to peak value of the envelope remains equal for different modulation depths, a maximum ASSR amplitude is obtained with a 50% amplitude-modulated tone (Lins et al., 1995; Picton et al., 1987). The reduction in the ASSR amplitude is approximately linear for modulation depth represented in a logarithmic scale (Rees et al., 1986; Roß et al., 2000). The modulation of the ASSR stimulus can be easily controlled when eliciting the neural response through insert earphones (Kuwada et al., 1986; Picton et al., 1987). In sound-field ASSR, however, the resulting stimulus modulation will depend on the acoustics of the room and the loudspeaker and listener position. The stimulus modulation (at the eardrum) could then serve as a potential predictor of the effect of room acoustics on sound-field ASSR.
The influence of room acoustics on the stimulus modulation has been widely investigated for speech intelligibility. It has been demonstrated that the reverberation and the background noise attenuate the natural fluctuations of the speech signal which are necessary for speech comprehension, which leads to poorer speech intelligibility for longer reverberation times and high noise levels (Bradley et al., 1999). The reverberation time (T) is defined as the time it takes for a sound to decrease by 60 dB in a room after an abrupt termination of the sound source (ISO 3382-1, 2009). This can be quantified by standard room parameters, such as the early decay time (EDT) and T20, which use different decay ranges, from 0 to −10 dB and −5 to −25 dB for EDT and T20, respectively (ISO 3382-1, 2009). Due to the close proximity between the loudspeaker and listener position in sound-field ASSR measurements, it is expected that the early reflections, which have larger energy, will have a greater influence on the stimulus modulation. Thus, EDT could potentially be a good predictor to estimate the ASSR level in sound-field ASSR measurements.
The primary objective of this study was to determine whether sound-field ASSR measurements would be affected by the acoustic condition of the measurement room in terms of the ASSR level and detection rate (the proportion of detected responses out of all conditions tested). Only the effect of the reverberation on the stimulus modulation was evaluated, whereas the effect of the background noise in the room was not considered in this study. It was then hypothesized that the response amplitude would be reduced due to the degradation of the stimulus modulation, resulting from the loudspeaker presentation in the measurement room. Consequently, the detection rate will likely also be reduced. This hypothesis was based on two facts: (a) The modulation of any acoustic signal in a room is distorted by its reverberation and background noise (Houtgast et al., 1980; Plomp, 1983); (b) ASSR amplitude reduces as the stimulus modulation decreases (Bharadwaj et al., 2015; Boettcher et al., 2001; Dimitrijevic et al., 2001; John et al., 2001; Kuwada et al., 1986; Lins et al., 1995; Picton et al., 1987; Rees et al., 1986; Roß et al., 2000; Rønne, 2012). The hypotheses were tested with an auralization approach using insert earphones, implemented to mimic sound-field ASSR. This consisted of the convolution of CE-Chirp® (Elberling & Don, 2010) stimuli with three simulated room impulse responses. The ASSR measurements were carried out in normal-hearing adult test subjects who were presented monaurally with the resulting auralized signals. The study also investigated whether it is possible to predict the ASSR level in any given room to determine its suitability for sound-field ASSR measurements. For this purpose, it was analyzed whether ASSR level could be estimated in a room by the EDT and the resulting stimulus modulation, which was here quantified with an auditory-inspired relative modulation power model.
Material and Methods
Participants
Fifteen young adult normal-hearing subjects (seven females, mean age 24 ± 3 years) participated in the test. Their audiological status was verified by means of otoscopy, wide-band tympanometry using the Interacoustics Titan, and air-conduction audiometry using an Interacoustics AC40 audiometer with ER-3A insert phones. All participants had pure-tone threshold equal or better than 20 dB hearing level at 125, 250, 500, 1000, 2000, 4000, and 8000 Hz. They provided written informed consent and were financially compensated with gift cards. The experiment was approved by the Science-Ethics Committee for the Capital Region of Denmark.
Stimuli and Room Acoustic Simulations
The narrow-band (NB) CE-Chirps® for ASSR recording consist of four one-octave-wide NB chirp trains, with center frequencies of 500, 1000, 2000 and 4000 Hz (Elberling & Don, 2010). These chirp trains are complex tones properly designed to compensate for the travelling wave delay in the basilar membrane. Each NB CE-Chirp® is composed by a harmonic series of cosines tones within the specific octave band, which are presented with slightly different time delays such that they all excite the basilar membrane at the same time. Hence, a broader region of the basilar membrane is synchronously excited, resulting in stronger neural responses and in turn, ASSRs with higher amplitudes that can be detected faster. In this study, each of the four commercial NB CE-Chirps® were presented through insert earphones at slightly different repetition rates around 90 Hz, all within a range from 88 to 98 Hz, as used in clinical practice with the Interacoustics Eclipse platform for ASSR recordings. A monaural room auralization approach was used to simulate sound-field ASSR and consisted of the convolution in real time of the NB CE-Chirps® with simulated monaural room impulse responses based on the acoustic Green’s function (Jacobsen & Juhl, 2013). A total of 16 conditions were tested, corresponding to the combination of the four NB CE-Chirps® (presented individually) and the four acoustic conditions (three simulated rooms and one unmodified anechoic stimulus condition that served as reference).
As sound-field ASSR is not a standard clinical test at the moment, there are no specific room acoustic guidelines. The three room acoustic conditions were defined such that their acoustic environments were representative of realistic clinic rooms for other audiological sound-field testing, for example, speech in noise test, sound-field audiometry, fitting of hearing aids. These rooms were expected to be small and have short to medium reberveration times. However, the characteristics of real rooms can vary greatly among clinics due to the lack of regulations for the dimensions and specific acoustic requirements for audiological testing rooms. To the best of our knowledge, only a few standards and guidelines provide recommendations on the test environment for sound-field audiometry. One of such relevant standards is the ISO 8253-2, which defines the adequate acoustic environment in the room for sound-field audiometry based on the variation of the sound-pressure level around the measurement point. This standard establishes a maximum allowable sound pressure level (SPL) variation of ±2.5 dB between the measurement position and a position located at 0.15 m to the front, back, left, right, up, and down from the measurement position (ISO 8253-2, 2009). Another relevant guideline is the practice guidance on the acoustics of sound-field audiometry developed by the British Society of Audiology (BSA, 2019), which recommends a maximum reverberation time of 0.25 s across all frequencies, and minimum dimensions of 6 × 4 m (w × l) for the testing rooms (Health Technical Memorandum 2045, 1996). The implementation of such recommended values, however, has not been broadly adopted due to their nonmandatory nature.
Characteristics of the simulated rooms. Input data for the simulations: dimensions of the room, source and receiver positions and reverberation time in one-octave bands. Estimated Schroeder frequency (fSch) for each individual simulated room, which mimic an audiometric testing booth (ATB), a room recommended by the British Society of Audiology for sound-field audiometry for pediatric assessment (BSA), and a standardized listening room (IEC).

Note. Input data for the simulations: dimensions of the room, source and receiver positions and reverberation time in one-octave bands. Estimated Schroeder frequency (

The implemented room acoustic model accurately calculates the modal behavior of rectangular rooms, which is an important feature of small rooms below the Schroeder frequency (Schroeder & Kuttruff, 1962). The model was implemented in a custom MATLAB script that simulated the monaural frequency response of the rooms from 

ASSR Measurements
The Interacoustics Eclipse platform was used to generate the standard NB CE-Chirps®, as well as to record and process the ASSR responses. Each generated NB CE-Chirp® was sent to an external computer through an RME Fireface UCX sound card. They were then convolved online with the simulated room impulse responses using the virtual studio technology plugin SIR v1.011 running on the free version of the LiveProfessor v1.2.5 software. The resulting stimuli were sent through the Tucker-Davis Technologies HB7 headphone driver, which was connected to the ER-3A insert earphone used to present the stimuli to the subjects.
The ASSRs were measured using a standard clinical four-electrode montage. The four surface electrodes were placed on the high forehead (reference), cheeck (ground), and on each mastoid (left and right, ipsi- and contra-lateral mastoids active). The electrode impedances were kept as equal as possible across the four electrodes and never exceeded 3 kΩ. The signal was preamplified by the ERA preamplifier and was recorded with the commercial Interacoustics Eclipse system. The ASSRs were recorded using the setting accuracy-test method priority and the adult sleeping protocol in the Eclipse software. The accuracy-test method priority determines the significance level used in the ASSR detector algoritm, which corresponds to p=.01. The adult sleeping protocol establishes the repetition rates of the stimuli used (fast repetition rates, around 90 Hz). The electroencephalogram (EEG) response was recorded with a sampling frequency of 30 kHz for a total of 6 min of continuous recording with an artifact rejection level of ±30 μV, which was increased to ±40 μV for restless subjects (higher EEG noise). The recordings were carried out in a darkened, single-walled acoustically treated and electrically shielded booth. During testing, the participants lay on a comfortable bed and were instructed to relax and sleep if possible. The experiment consisted of two sessions of 1.5 h each. The 16 testing conditions were presented once in a random order to each test subject. The ASSRs were recorded for only one ear that was randomly chosen while the non-test ear was blocked with a foam earplug.
To calibrate the tested acoustic conditions, each stimulus was presented via the insert earphones connected to an ear simulator B&K 4157. The presentation levels were then measured with the B&K 4157 ear simulator, which simulates the presentation level at the eardrum. The 16 stimuli (four acoustic conditions and four NB CE-Chirps®) were calibrated individually. The stimuli were calibrated to the target values 68.0, 62.6, 68.0, and 58.7 dB SPL for the NB CE-Chirps® with center frequencies of 500, 1000, 2000, and 4000 Hz, respectively. The levels were defined from the standard method for computing the speech intelligibility index (ANSI S3.5, 1997). These values were selected such that when the stimuli are combined, the resulting overall level matches the long-term spectrum of speech in one-octave wide frequency bands and with a broad-band level of 72 dB SPL at the eardrum position.
Data Analysis
ASSR Postprocessing
Number of Measurements per Condition Included in the Analysis After Postprocessing With an Artifact Rejection Level of ±30 µV.

Note. The tested acoustic conditions correspond to the reference anechoic (REF), and three simulated rooms which mimic an audiometric testing booth (ATB), a room recommended by the British Society of Audiology (BSA) for sound-field audiometry for pediatric assessment, and a standardized listening room (IEC).
Acoustic Descriptors of Simulated Rooms
Early Decay Time
The EDT is a reverberation time measurement estimated from the first 10 dB level drop of the decay curve, thus quantifying the early part of the decay curve. It is known to be closely related to the subjective impression of the reverberation in the room (ISO 3382-1, 2009). Considering that for sound-field ASSR measurements a source to listener distance of 1 m is used, the stimulus modulation is expected to be most affected by the early reflections of the room, which are more important for shorter source to receiver distances. The EDT was derived from the decay rate of the simulated impulse responses for each room condition, as described in the standard (ISO 3382-1, 2009). For the reference condition, the EDT was set to 0 s for the analysis. Figure 1A
EDT (Top Pannel) and Relative Modulation Power (Bottom Panel) of the Acoustic Conditions Tested. Pannel A: The EDT estimated from the acoustic conditions for each octave frequency bands (500, 1000, 2000, and 4000 Hz). Pannel B: The relative modulation power for the first four harmonics of the acoustic conditions per stimulus frequency. The tested acoustic conditions correspond to the reference anechoic (REF), and three simulated rooms which mimic an audiometric testing booth (ATB), a room recommended by the British Society of Audiology (BSA) for sound-field audiometry for pediatric assessment, and a standardized listening room (IEC).
Auditory-Inspired Relative Modulation Power Model
The modulation of amplitude-modulated tones is well described by the modulation depth ( Diagram of the Proposed Auditory-Inspired Relative Modulation Power Model. The reference stimulus and the stimulus recorded in the room are processed through a gammatone filter bank. The envelope of the output of each filter is extracted by applying a Hilbert transform, and are normalized by their respective DC component. The envelope spectrum is calculated per blocks for each filterbank output. The stimulus modulation power is then calculated by averaging the envelope spectrum across all blocks and filter bands. The relative modulation power of the stimulus recorded in the room is then calculated in dB referenced to the modulation power of the first harmonic of the reference stimulus.
The first phase of the model uses a linear filter bank of 12 gammatone filters (Johannesma, 1972) uniformly spaced 1/12th octave apart over the stimulus frequency band of interest to simulate the frequency specificity of the human basilar membrane. The envelope of the output of each gammatone filter is then extracted using the Hilbert transform. The temporal envelopes are normalized by subtracting their respective DC component. The envelopes are split into blocks as described in the ASSR postprocessing section. The discrete Fourier transform is then calculated per block and averaged across all blocks and all filter bands to obtain the stimulus envelope power. These steps are conducted for both the reference and the reverberant signals.
The modulation power is then estimated at the frequency bin of the repetition rate of the stimulus frequency band and its harmonics. Finally, the relative modulation power is calculated in dB referenced to the modulation power of the first harmonic of the reference anechoic signal. This quantifies the changes in the stimulus modulation brought about by the acoustical properties of the measurement room relative to the reference signal for each of the stimulus harmonics. Figure 1B shows the relative modulation power for each of the stimulus band center frequencies of the tested acoustic conditions, where a reduced relative modulation power of the room conditions compared with the reference signal is observed for the harmonics of interest.
Statistical Analysis
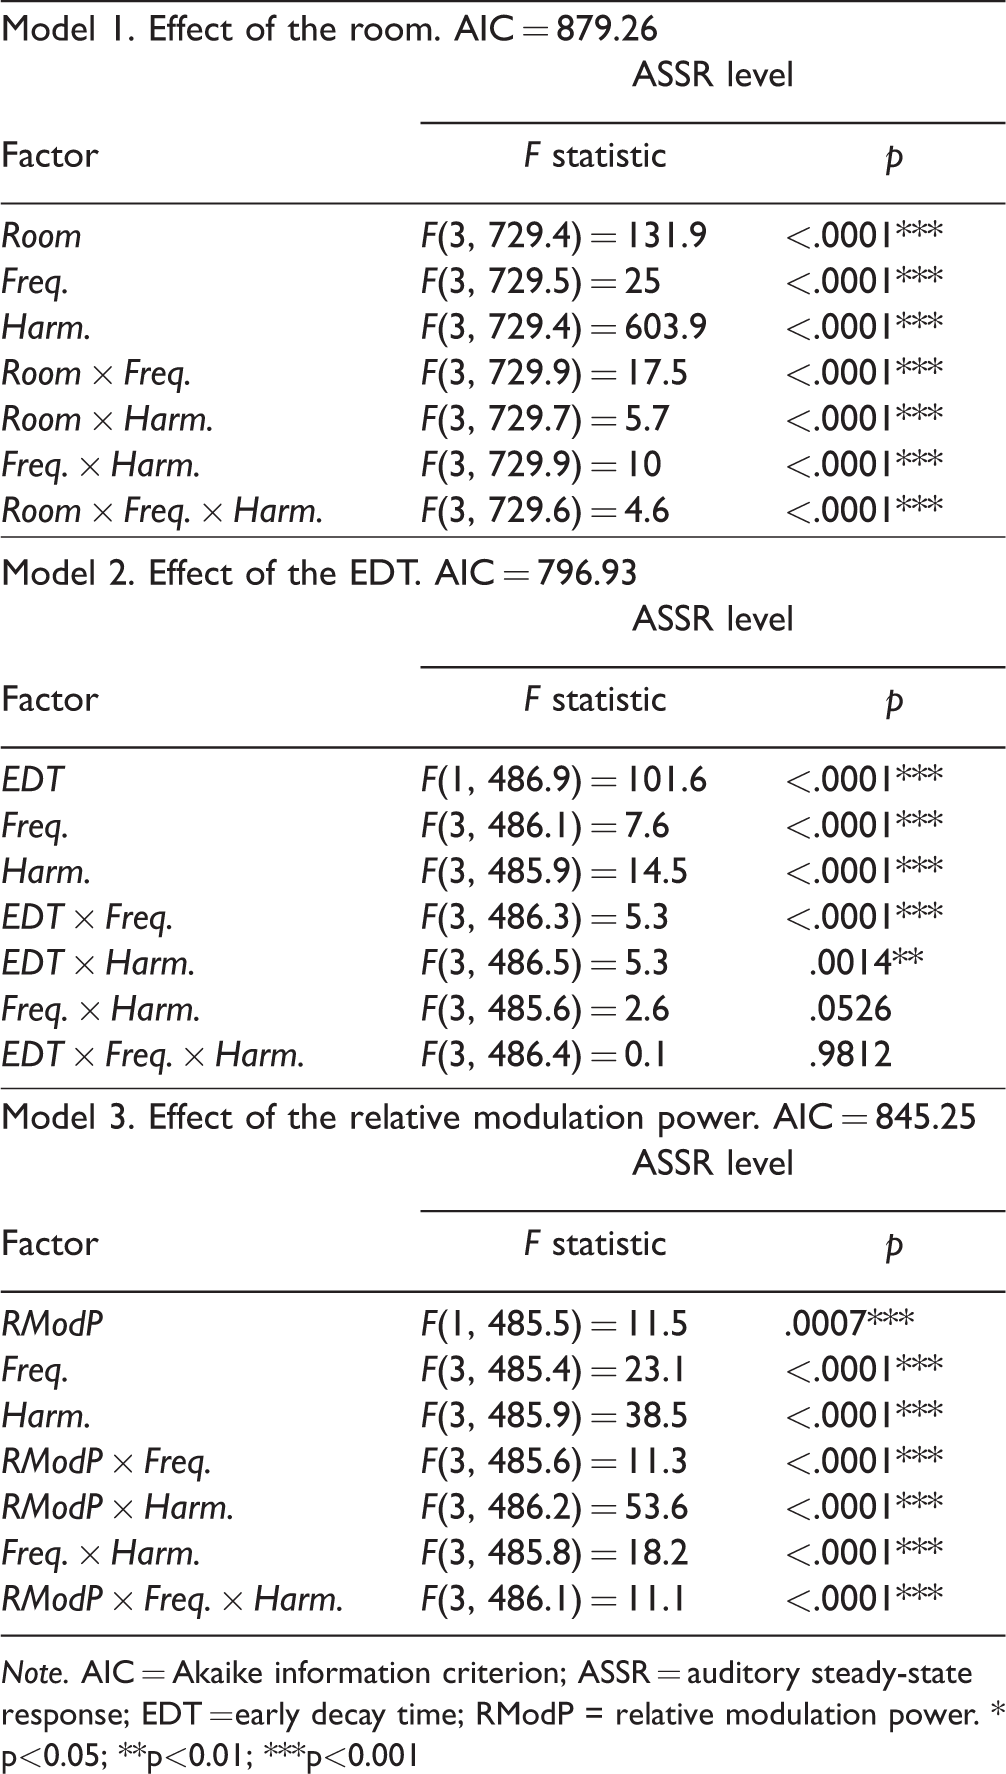
The statistical analysis was carried out using linear mixed-effects models fitted to the ASSR level, considering the participants as a random effect (Test Subjects: 1, 2, 3 . . . 15). All analyses were performed in the software R version 3.5 with the lme4 library (Bates et al., 2015). To analyze the effect of the room on the ASSR level, a first model was estimated including the fixed effects of the room (Room: REF, ATB, BSA, and IEC), stimulus frequency (Frequency: 500, 1000, 2000, and 4000 Hz) and ASSR harmonic (Harmonic: 1, 2, 3, and 4). The predictable (ASSR level) and explanatory (Room, Frequency, and Harmonic) variables were defined as a continuous and categorical variables, respectively. Significance was evaluated for all main effects and their interactions, and those that were not significant were removed. Post hoc analysis was conducted to determine significant differences between the reference condition and each room condition (ATB, BSA, and IEC) across frequencies and harmonics. For this analysis, the estimated marginal means (Searle et al., 1980) with the Tukey method was used (Tukey, 1949).
Two additional linear mixed-effects models were computed to determine whether the ASSR level could be predicted using either EDT or the relative modulation power, which are measurable properties inherent to the rooms. For these analyses, only the post hoc comparisons that turned out significant in the first statistical model for all combinations of reference and room conditions were considered. Instead of the categorical variable Room, the models included the continuous fixed effects of either the EDT (time in seconds) or the relative modulation power (RModP: in dB). Nonsignificant main effects and interactions were removed from the models, which were evaluated with analysis of variances (ANOVAs) and comparing the Akaike information criterion (Akaike, 1974).
Results
Effect of the Room on ASSR Level
Figure 3
ASSR Levels as a Function of the Tested Acoustic Conditions for Each Stimulus Center Band (Columns) and Harmonics (From First Harmonic in the Top Row to the Fourth Harmonic in the Bottom Row). The whiskers of the boxplot indicate the minimum and maximum data points of the distribution, boxes show the 25th (bottom edge) and 75th (top edge) percentiles as well as the median (red line). The green points indicate the individual measurements. The tested acoustic conditions correspond to the reference anechoic (REF), and three simulated rooms which mimic an audiometric testing booth (ATB), a room recommended by the British Society of Audiology (BSA) for sound-field audiometry for pediatric assessment, and a standardized listening room (IEC). Summary Results of the Mixed-Model Analyses of Variance. Note. AIC = Akaike information criterion; ASSR = auditory steady-state response; EDT = early decay time; RModP = relative modulation power. * p<0.05; **p<0.01; ***p<0.001
Subsequently, the post hoc comparisons between the reference condition and the room conditions across all stimulus frequencies and harmonics were analyzed. The rooms for which the ASSR level were significantly different from that obtained in the reference condition are indicated in Figure 3 by horizontal lines with the corresponding significance levels. It is noteworthy that for the stimuli at 500 and 1000 Hz, all three post hoc comparisons between the reference and room conditions were significantly different only for the first ASSR harmonic. In contrast, in the case of the 2000 and 4000 Hz stimuli, the paired comparisons revealed significant differences for all tested harmonics. These results suggest that the effect of the room condition on the stimulus modulation depends on the frequency and harmonics of the ASSR stimuli. Moreover, only at high frequencies, the higher harmonics seem to be informative of the acoustic influence of the room on the obtained ASSR level.
Detection Rate of Simulated Sound-Field ASSR
Figure 4
Detection rates for each tested acoustic condition, across harmonics and frequencies. The tested acoustic conditions correspond to the reference anechoic (REF), and three simulated rooms which mimic an audiometric testing booth (ATB), a room recommended by the British Society of Audiology (BSA) for sound-field audiometry for pediatric assessment, and a standardized listening room (IEC).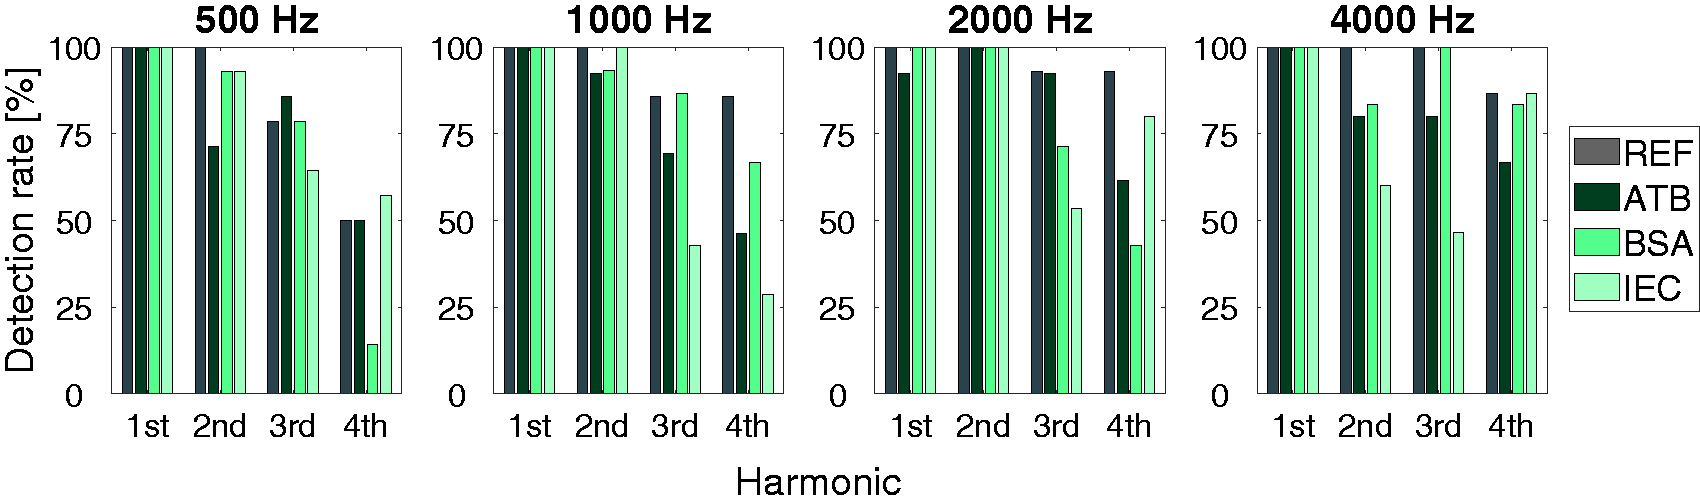
ASSR Level and Early Decay Time
Figure 5
Mean ASSR Level as a Function of EDT for Each Room, Frequency, and Harmonic. Panel A: Results of the first harmonic for all stimulation frequencies. Panel B: Results for the included higher harmonics (second, third, and fourth) for 2000 and 4000 Hz. Error bars indicate standard deviation. Estimated regression lines (- - - -) are added to each panel. The tested acoustic conditions correspond to the reference anechoic (REF), and three simulated rooms which mimic an audiometric testing booth (ATB), a room recommended by the British Society of Audiology (BSA) for sound-field audiometry for pediatric assessment, and a standardized listening room (IEC).
To determine whether the ASSR level can be predicted by the EDT, linear regression models were fit to the data, in terms of the slope and coefficient of determination (R2). Panel A of Figure 5 shows the results for the first response harmonic for each stimulus frequency. A low correlation between the EDT and ASSR level was obtained for 500 (R2 = .06) and 1000 Hz (R2 = .004) for which the ASSR level did not decrease substantially with increasing the EDT. In contrast, a high correlation was found between the EDT and the ASSR response amplitude for 2000 (R2 = .97) and 4000 Hz (R2 = .96). In general, high correlations were also obtained for the higher harmonics, as shown in panel B of Figure 5. The regression models showed that more than 60% of the variation in ASSR level can be explained by the EDT for the second and third harmonics for 2000 Hz, as well as the second harmonic for 4000 Hz. In the case of the fourth harmonic for 2000 Hz, and third and fourth harmonics for 4000 Hz, the linear regression models predicted approximately 20% of the variance of the ASSR data. These results indicate that EDT could be a useful predictor of the ASSR level in the rooms for 2000 and 4000 Hz. In addition, the different slopes obtained for the regression models further support that the effect of EDT on the ASSR level is frequency and harmonic dependent, as reflected in the significant two-way interactions.
ASSR Level and Relative Modulation Power
Figure 6
Mean ASSR Level as a Function of the Relative Modulation Power (RModP) for Each Room, Frequency, and Harmonic. Panel A: Results of the first harmonic for all stimulation frequencies. Panel B: Results for the higher harmonics (second, third, and fourth) for 2000 and 4000 Hz. Error bars indicate standard deviation. Estimated regression lines (- - - -) are added to each panel. The tested acoustic conditions correspond to the reference anechoic (REF), and three simulated rooms which mimic an audiometric testing booth (ATB), a room recommended by the British Society of Audiology (BSA) for sound-field audiometry for pediatric assessment, and a standardized listening room (IEC).
Linear regression models were fit to the data measured for each combination of stimulus band center frequency and harmonic. This was done to test whether the proposed relative modulation power model could account for the changes in the ASSR level due to the acoustics of the room. The linear regression models with their respective slopes and R2 are shown in Figure 6. Panel A depicts the ASSR level as a function of the stimulus relative modulation power for the first harmonic of all stimulus frequencies, and Panel B depicts the results for the higher harmonics for 2000 and 4000 Hz. The regression model showed a good correlation between the relative modulation power and the ASSR level, with varying slopes across stimulus frequencies and harmonics. For the first ASSR harmonic, a high correlation was found for 1000, 2000, and 4000 Hz, with R2 values of .54, .67, and .79, respectively. In contrast, the correlation was low for the stimulus band center frequency of 500 Hz, with an R2 value of .15. For the higher harmonics of 2000 and 4000 Hz, high correlations were obtained with coefficients of determination between .71 (for 2000 Hz, third harmonic) and .98 (for 4000 Hz, third and fourth harmonic). The results suggest that the ASSR level in the room can be partly predicted by the relative modulation power model for all considered frequencies and harmonics.
Discussion
Effect of the Room on the ASSR Level
The main finding that emerged from this study is that the ASSR level indeed was reduced for the nonanechoic room conditions compared with the reference anechoic condition. This is a novel finding as the effect of room acoustics on ASSR level has not been systematically investigated in previous studies, which have been mostly focused on testing the viability of ASSR measurements in sound field for hearing assessment and hearing-aid fitting validation (Damarla & Manjula, 2007; Hernandez-Perez & Torres-Fortuny, 2013; Park et al., 2013; Picton et al., 1998; Sardari et al., 2015; Shemesh et al., 2012; Stroebel et al., 2007; Selim et al., 2012). The reduction in the ASSR level for the room conditions was ascribed to smaller stimulus modulations for the measured nonanechoic conditions (see Figure 2B). This is also consistent with the fact that the modulation of an acoustic signal can be degraded by the reverberation and background noise of the room in which it is reproduced (Houtgast et al., 1980; Plomp, 1983). The reduction in the ASSR level could directly lead to an increase in the measurement time. This is because a longer recording time would be needed for lower ASSR levels to reach the signal-to-noise ratio required for the detection of the response, as demonstrated in earlier studies (Cebulla et al., 2006; Dobie & Wilson, 1996; Laugesen et al., 2018). This could pose a challenge to the clinical implementation of sound-field ASSR, where minimizing the testing time is crucial, especially when testing infants and hard-to-test patients.
Detection Rate of Simulated Sound-Field ASSR
Despite the reduction in the ASSR level, the ASSR was detected in all simulated acoustic conditions tested. For the reference condition, the detection rate analysis showed a reduction in the detected responses toward the higher harmonics. This is in agreement with previous investigations in which the ASSR was measured with traditional insert earphone stimulation (Cebulla et al., 2006; Laugesen et al., 2018). Interestingly, this pattern was not observed consistently across the simulated tested rooms for which the detection rate did not consistently reduce for the higher harmonics. For instance, for the IEC room condition, the percentage of successful detections for the fourth harmonic was higher than for the second and third harmonics of the 4000 Hz frequency band. Considering this, a multiharmonic detector, such as the q-sample detector, might provide higher successful detection rates for sound-field ASSR measurements compared with a one-sample detector that only analyzes a single harmonic (Cebulla et al., 2006). Furthermore, a multiharmonic detector might be particularly useful to compensate for the potential longer detection times caused by the reduced response amplitude obtained in the room conditions.
ASSR Level and Early Decay Time
In this study, it is investigated whether EDT can be used as a predictor of the sound-field ASSR level measured in a room. The results showed high correlations between the EDT and ASSR level for the frequencies of 2000 and 4000 Hz for all harmonics: A reduction in the ASSR level as the EDT increases was clearly observed. In the case of the frequencies of 500 and 1000 Hz, it was surprising that there was no correlation between the ASSR level and EDT as the EDTs observed were similar to those for 2000 and 4000 kHz. Further investigation is required to clarify whether the observed frequency-dependent effect of the EDT on the ASSR level generalizes when considering a larger sample of rooms.
ASSR Level and Relative Modulation Power
The relation between the ASSR level and the stimulus modulation in a room was analyzed. The stimulus modulation was quantified using an auditory-inspired relative modulation power model, which correlated well with the ASSR level. In general, it was observed that as the relative modulation power decreased, ASSR level was also reduced, as expected. However, a direct comparison between this study and the literature is challenging due to the lack of systematic investigations of the effect of stimulus modulation on ASSR measurements. Many studies have reported the effect of the stimulus modulation on the ASSR level as a function of the modulation depth for amplitude-modulated sinusoidal signals presented to normal-hearing subjects through insert earphones (Bharadwaj et al., 2015; Boettcher et al., 2001; Dimitrijevic et al., 2001; John et al., 2001; Kuwada et al., 1986; Lins et al., 1995; Picton et al., 1987; Rees et al., 1986; Roß et al., 2000; Rønne, 2012). Although in these studies the researchers employed different measurement parameters (e.g., stimulus level, carrier and modulation frequency), all of them consistently showed an increase in the ASSR level as the modulation depth increased for the first harmonic of the response.
Modulation-Growth Functions Reported in Literature.

Note. For the Picton et al.’s (1987) data presented at 76.5 dB SPL, only six subjects participated in the recording with 30% modulation depth. For the Bharadwaj et al.’s (2015) data, the stimulus used was an SAM tone in notched noise. For the Lins et al.’s (1995) data, the stimuli were calibrated based on a constant peak-to-peak value.
Level: SPL, sound pressure level; HL, hearing level; SL, sensation level; SAM = sinusoidally amplitude-modulated.
Implication and Limitations
The findings of this study highlighted the importance of the evaluation of room acoustics for the implementation of sound-field ASSR measurements. However, some consideration should be taken into account before generalizing the results to realistic clinic environments: (a) The room acoustic model implemented in this study was limited to a monaural point-to-point simulation, and hence, it did not include the effect of the patient’s head and torso on the local sound field. In addition, the model is most accurate for lightly damped rooms with evenly distributed absorption on the surfaces, which is far from realistic clinic rooms. (b) This investigation only focused on three room conditions, which is a limited sample compared with the variety of audiological testing rooms. It would thus be beneficial to expand the room sample in future studies to consider a broader range of acoustic scenarios that can be found in clinics. (c) Only one measurement point was considered for the analysis of the sound field. In reality, during the sound-field ASSR measurement, it is expected that the patients move their heads, producing local changes in the sound field. (d) The effect of the background noise of the test room on the sound-field ASSR measurements was not considered in this study, which is important due to the high ambient noise levels in audiometric testing rooms (Frank & Williams, 1994; Siegenthaler, 1981). An additional degradation on the ASSR level must be expected due to the background noise of the room as this also reduces the stimulus modulation (Houtgast et al., 1980; Plomp, 1983). (e) This investigation only considered monaural stimulation, which agrees with the preferred approach for hearing-aid (HA) fitting validation: to test each ear separately. However, in consideration of testing time, some audiologists may choose to test both ears simultaneously. Watson et al. (2019) considered binaural stimulation for hearing-aid fitting validation with ASSR, but only in simulated anechoic conditions. Their investigations of effects of head shadow, interaural time differences, and asymmetrical hearing-aid fittings showed slightly stronger responses with binaural versus monaural stimulation, except in an extreme case of an interaural delay that set the stimulus envelope in antiphase between the two ears. In real sound-field ASSR, there will additionally be binaural effects of room reverberation. While the perceptual benefits of binaural over monaural listening are well documented, we are not aware of any published studies of this aspect of sound-field ASSR. These aspects should be further explored for a better understanding of the effect of room acoustics on sound-field ASSR measurements that could lead to the successful implementation in clinics.
Conclusions
This study provides a first step toward understanding the effect of room acoustics on sound-field ASSR measurements. Using a simple room-acoustic model to simulate three rooms inspired by audiological testing rooms, it was shown that room acoustics indeed affects the level of sound-field ASSR measurements. This was evident in the general reduction of ASSR level for all harmonics obtained across the tested room conditions compared with the anechoic reference. This reduction in the ASSR level is likely to be attributed to the degradation of the stimulus modulation due to the nonanechoic reproduction. Although the ASSR level was reduced for all tested room conditions, ASSRs were almost always detected for the first harmonic across all acoustic conditions tested. For the room conditions, the detection rates did not consistently decrease with increasing harmonic number. In contrast, for the reference condition, the number of detected ASSRs reduced toward the higher harmonics. The effect of the room on the ASSR level was characterized in terms of the EDT and relative modulation power. While EDT performed well for 2000 and 4000 Hz, the relative modulation power correlated well for all frequencies. These two parameters appear to be useful to analyze the changes in ASSR level produced by the acoustical properties of the measurement room. The relative modulation power and the EDT are acoustic parameters that can be easily recorded in any room. This will then be important in clinical practice as clinicians could measure the proposed parameters to evaluate the testing environment and determine whether it is acoustically suitable for sound-field ASSR measurements.
Footnotes
Acknowledgments
The authors would like to thank Johannes Zaar for the insightful comments and suggestions.
Declaration of Conflicting Interests
The authors declared no potential conflicts of interest with respect to the research, authorship, and/or publication of this article.
Funding
The authors disclosed receipt of the following financial support for the research, authorship, and/or publication of this article: This research was funded by Interacoustics A/S, the William Demant Foundation and the Innovation Fund Denmark (grant no. 5189-00070B).