
Abstract
The measurement of pupil dilation has become a common way to assess listening effort. Pupillometry data are subject to artifacts, requiring highly contaminated data to be discarded from analysis. It is unknown how trial exclusion criteria impact experimental results. The present study examined the effect of a common exclusion criterion, percentage of blinks, on speech intelligibility and pupil dilation measures in 9 participants with single-sided deafness (SSD) and 20 participants with normal hearing. Participants listened to and repeated sentences in quiet or with speech maskers. Pupillometry trials were processed using three levels of blink exclusion criteria: 15%, 30%, and 45%. These percentages reflect a threshold for missing data points in a trial, where trials that exceed the threshold are excluded from analysis. Results indicated that pupil dilation was significantly greater and intelligibility was significantly lower in the masker compared with the quiet condition for both groups. Across-group comparisons revealed that speech intelligibility in the SSD group decreased significantly more than the normal hearing group from quiet to masker conditions, but the change in pupil dilation was similar for both groups. There was no effect of blink criteria on speech intelligibility or pupil dilation results for either group. However, the total percentage of blinks in the masker condition was significantly greater than in the quiet condition for the SSD group, which is consistent with previous studies that have found a relationship between blinking and task difficulty. This association should be carefully considered in future experiments using pupillometry to gauge listening effort.
Introduction
Effective, everyday communication is a complex skill requiring a myriad of peripheral and central auditory processes. Therefore, a single performance measure, such as a speech intelligibility score, fails to capture all aspects of listening. For example, speech intelligibility does not capture the amount of effort a listener expends. Listening effort is defined as the deliberate allocation of attention-related cognitive resources to perform difficult listening tasks (Pichora-Fuller et al., 2016). A participant’s engagement or motivation to perform the task is also thought to contribute to the amount of effort they expend (Winn et al., 2018). As such, individuals with the same intelligibility score may exert different amounts of effort due to individual factors, such as hearing or cognitive abilities (Ohlenforst et al., 2017; Zekveld et al., 2011). In fact, individuals with hearing loss generally report being more fatigued after an hour of listening and find noisy listening situations to be more cognitively taxing compared with persons with normal hearing (NH; Edwards, 2007; Zekveld et al., 2010). The documented differences in listening effort between hearing-impaired and NH individuals are of interest because elevated effort is associated with stress and fatigue and can also affect social interactions, thus negatively impacting quality of life (Alhanbali et al., 2019; Hughes et al., 2018; Stephens & Hétu, 1991).
Numerous methods have been used to quantify listening effort, including subjective, behavioral, and physiological measures (McGarrigle et al., 2014). The measurement of pupil dilation, or pupillometry, is a particularly appropriate technique for tracking changes in the time course of listening effort. Task-evoked changes in pupil dilation are tightly coupled to the activity of noradrenergic neurons in the locus coeruleus (Aston-Jones & Cohen, 2005) and are therefore thought to be a time-sensitive index of attention and cognitive effort. The ability to capture changes in cognitive effort in real time is important because processing load is dynamic and may fluctuate throughout the duration of a stimulus (Winn et al., 2018). Furthermore, unlike other physiological measures that are subject to electrical and magnetic artifacts (e.g., functional magnetic resonance imaging, electroencephalography), pupillometry is compatible with amplification devices (e.g., hearing aids) and implantable devices (e.g., cochlear implants; Friesen & Picton, 2010; Gilley et al., 2006; Wagner et al., 2019). In addition, pupillometry is relatively fast and inexpensive, making it a practical research technique and giving it the potential to be a valuable clinical tool (Winn et al., 2018).
While the utility of measuring pupil dilation to assess listening effort has been documented (Zekveld et al., 2018), uniform methods for collecting, analyzing, and interpreting pupillometry data are still being established (see Winn et al., 2018). Pupil dilation is a slow physiological response that can be contaminated by biological artifacts, such as blinking, gaze drifting, and participant movement, ultimately introducing noise into the data. Therefore, there is a need for data to be processed or cleaned before they are further analyzed. This process has not been well established across research groups, but reports suggest that data cleansing can include low-pass filtering, analysis and normalization of the baseline pupil measure, identification and rejection of corrupted trials, and de-blinking (Winn et al., 2018). In the present study, we focus on “de-blinking,” which refers to the interpolation of data points within a pupil track where the participant has blinked or where the pupil has been momentarily lost by the eyetracker. Of the three types of eye blinks that have been identified (spontaneous, reflexive, and voluntary), spontaneous blinks are likely the most prominent during pupillometry tasks because these are necessary for visual clarity and keeping the eye hydrated and occur in an extremely symmetrical and coordinated manner (Cruz et al., 2011). Spontaneous blinks have been associated with numerous cognitive factors, including attention, information processing, speech production, and task difficulty (Stern et al., 1984; Tanaka & Yamaoka, 1993). However, the relationship between task difficulty and spontaneous blinks is unclear, with some studies reporting increased blink rate during more difficult tasks (e.g., Recarte et al., 2019; Wood & Hassett, 1983) and others reporting blink inhibition (e.g., Holland & Tarlow, 1972, 1975; Zheng et al., 2012). These contradictory findings can be at least partially explained by the nature of the task, with reports of blink inhibition occurring more frequently in tasks involving a visual component compared with those that do not (Recarte et al., 2019; Stern et al., 1984). Recarte et al. (2019) investigated blink rate, pupil dilation, and subjective rating as a function of mental workload in young adults during three cognitive tasks: listening to speech, producing speech, and performing a mental arithmetic task. They found that each task elicited an increase in blink rate compared with the control condition. When participants were instructed to complete these tasks along with a visual search task, they still observed an increase in blink rate compared with the control condition, but the magnitude of increase was smaller than when there was no visual search task, thus demonstrating the complex relationship between blink rate and task modality. Of particular interest to the current study is their finding that the speech production and mental arithmetic tasks, which elicited the highest blink rates, also resulted in the largest pupil dilations and the highest subjective ratings of difficulty (Recarte et al., 2019). This suggests that blink rate and task difficulty are positively correlated for nonvisual tasks.
Some work has suggested that trials with more than 30% missing data should be discarded from analysis, as these trials may no longer contain meaningful information (Winn et al., 2018). However, other studies have used a more conservative criterion of 15% (e.g., Koelewijn et al., 2012; Zekveld & Kramer, 2014; Zekveld et al., 2011). To our knowledge, no work has clarified how a criterion is established, nor has there been a systematic investigation of its potential consequences. Due to the documented relationship between blink rate and cognitive load, it is important to ensure (a) that valid data are not being unnecessarily discarded and (b) that a chosen blink criterion does not skew results by disproportionately flagging difficult trials due to a higher proportion of spontaneous blinks.
Further, while several studies have investigated listening effort in individuals with bilateral hearing loss, there has been little focus on individuals with single-sided deafness (SSD), who have one ear with near-normal hearing and one with severe-to-profound sensorineural hearing loss. This is a timely population to study, as a number of these individuals are now pursuing cochlear implantation in an attempt to improve spatial hearing abilities and reduce debilitating effects of tinnitus. Outcomes thus far have been promising, with several studies reporting partial or full tinnitus suppression (Arndt et al., 2011; Buechner et al., 2010; Litovsky et al., 2019; Mertens et al., 2016; Távora-Vieira et al., 2013), improved speech perception in noise (Bernstein et al., 2016; Gartrell et al., 2014), better sound localization abilities (Arndt et al., 2011; Gartrell et al., 2014; Litovsky et al., 2019; Vermeire & Van De Heyning, 2009; Zeitler et al., 2015), and improved quality of life after cochlear implantation (Arndt et al., 2011; Dillon et al., 2018; Firszt et al., 2012; Härkönen et al., 2015; Távora-Vieira et al., 2019; Vermeire & Van De Heyning, 2009). However, there is a lack of knowledge regarding how much cognitive load individuals with SSD exert in complex listening environments. This topic has clinical relevance in the context of determining whether cochlear implantation can facilitate reduced listening effort in addition to the aforementioned benefits for individuals with SSD.
The present study examined speech intelligibility and listening effort in individuals with SSD and with NH. Experimental methods differed slightly between SSD and NH listeners and will be presented as two separate experiments. The first aim of this study examined the effect of blink exclusion criteria on speech intelligibility, pupil dilation, and the number of trials included for analysis in each condition. This investigation is imperative due to the observed relationship between blinking and task difficulty and will help establish empirically validated methods for the analysis of pupillometry data. The second aim compared performance and listening effort between SSD and NH listeners to better understand the implications of listening with one ear in complex auditory environments as well as the possibilities for improvement following cochlear implantation.
Experiment 1: Listening Effort and Speech Intelligibility in Participants With SSD
Methods
Participants
Nine individuals with SSD were recruited as part of an ongoing clinical trial that is investigating the effect of cochlear implantation on a variety of auditory and cognitive domains in this population. Participants traveled to Madison, Wisconsin for the study, and testing took place at the University of Wisconsin-Madison Waisman Center over the duration of two days. Age of participants ranged from 26 to 69 years, and all were native English speakers. The etiology of hearing loss was sudden sensorineural hearing loss for seven participants, temporal bone fracture for one, and Meniere’s disease for one. The right ear was the poorer ear for all participants except two. Demographics are reported in Table 1. This study was approved by the University of Wisconsin-Madison Health Sciences Institutional Review Board.
Participant Demographic Information.

Note. Pure tone average was defined as the average hearing threshold in dB HL of 500 Hz, 1000 Hz, and 2000 Hz.
Experimental Setup
Testing was conducted in a standard sound booth. Participants sat in a comfortable chair in front of a table with a fixed head mount, where they rested their chin and forehead. To ensure comfort, the height of the table and/or chair was adjusted for each participant. A computer monitor was attached to the table via an adjustable arm and was positioned so that it was approximately 65 cm away from the headrest. Illumination of the test room was set to 93 lux for all participants. The computer monitor background was set to a neutral color (medium gray) to avoid excessive pupil constriction or discomfort (Winn et al., 2018). A loudspeaker (Tannoy, Coatbridge, Scotland) was positioned at 0° azimuth at a height of 130 cm. Pupil size was measured in pixels using the “Area” setting on an eyetracker (Eyelink 1000 Plus). Pupil area was sampled at a rate of 1000 Hz using a proprietary algorithm developed by Eyelink manufacturers. The eyetracker camera was fixed to the table via a desktop mount 8 cm in front of the computer monitor.
Stimuli
Target stimuli were drawn from the Harvard Institute of Electrical and Electronics Engineers sentence corpus (IEEE, 1969) and were recorded by a male talker. Masker stimuli (two-talker babble) consisted of AzBio sentences (Spahr et al., 2012) recorded by two different male talkers. Prior to testing, all stimuli were equalized to 85 dB sound pressure level (SPL)-A and stored as .wav files. During testing, stimuli were scaled to 65 dB SPL-A and played to the loudspeaker through a USB high-speed audio interface (RME Fireface, Haimhausen, Germany). Target sentences ranged from 4,000 to 6,000 ms in duration. Masker sentences were concatenated into a long sequence, and the starting sample of the maskers was randomly selected for each trial. Maskers began 250 ms prior to the onset of the target sentence and ended 250 ms after the offset of the target. A computer with customized software written in MATLAB (The MathWorks, Natick, MA) was used to deliver stimuli and collect data.
Procedure
Participants were tested in two conditions: (a) quiet, where the target was presented from 0° azimuth and (b) with speech maskers, where the target and maskers were both presented from 0° azimuth at a signal-to-noise ratio (SNR) of 0 dB. Prior to beginning the experiment, participants completed a familiarization procedure in which they heard six sentences in quiet, followed by 5 to 10 sentences with maskers. Stimuli for practice trials were randomly selected and then excluded from the test corpus to avoid any sentence repetitions.
During testing participants were instructed to fixate their gaze on a small cross in the center of the computer screen and attend to target sentences presented in quiet or in the presence of maskers. At the beginning of each trial the cross color turned white to indicate that the trial was about to begin, and then a 1,000-ms baseline measurement in quiet was completed prior to the onset of the stimuli for all conditions. After stimulus offset, there was a 2,000-ms silent period to allow participants to think and prepare to respond. Participants were asked to repeat the target sentence after the 2,000-ms silent period. To prompt the verbal report of what was perceived, the cross on the screen turned green and the participant heard two beeps (Figure 1). Each sentence contained five key words, and an experimenter scored how many words the participant correctly repeated. The experimenter waited 10 to 15 s between trials to allow the pupil to return to baseline before beginning the next trial. Participants were encouraged to guess for sentences that they did not entirely hear. Frequent breaks were given throughout testing to avoid fatigue.
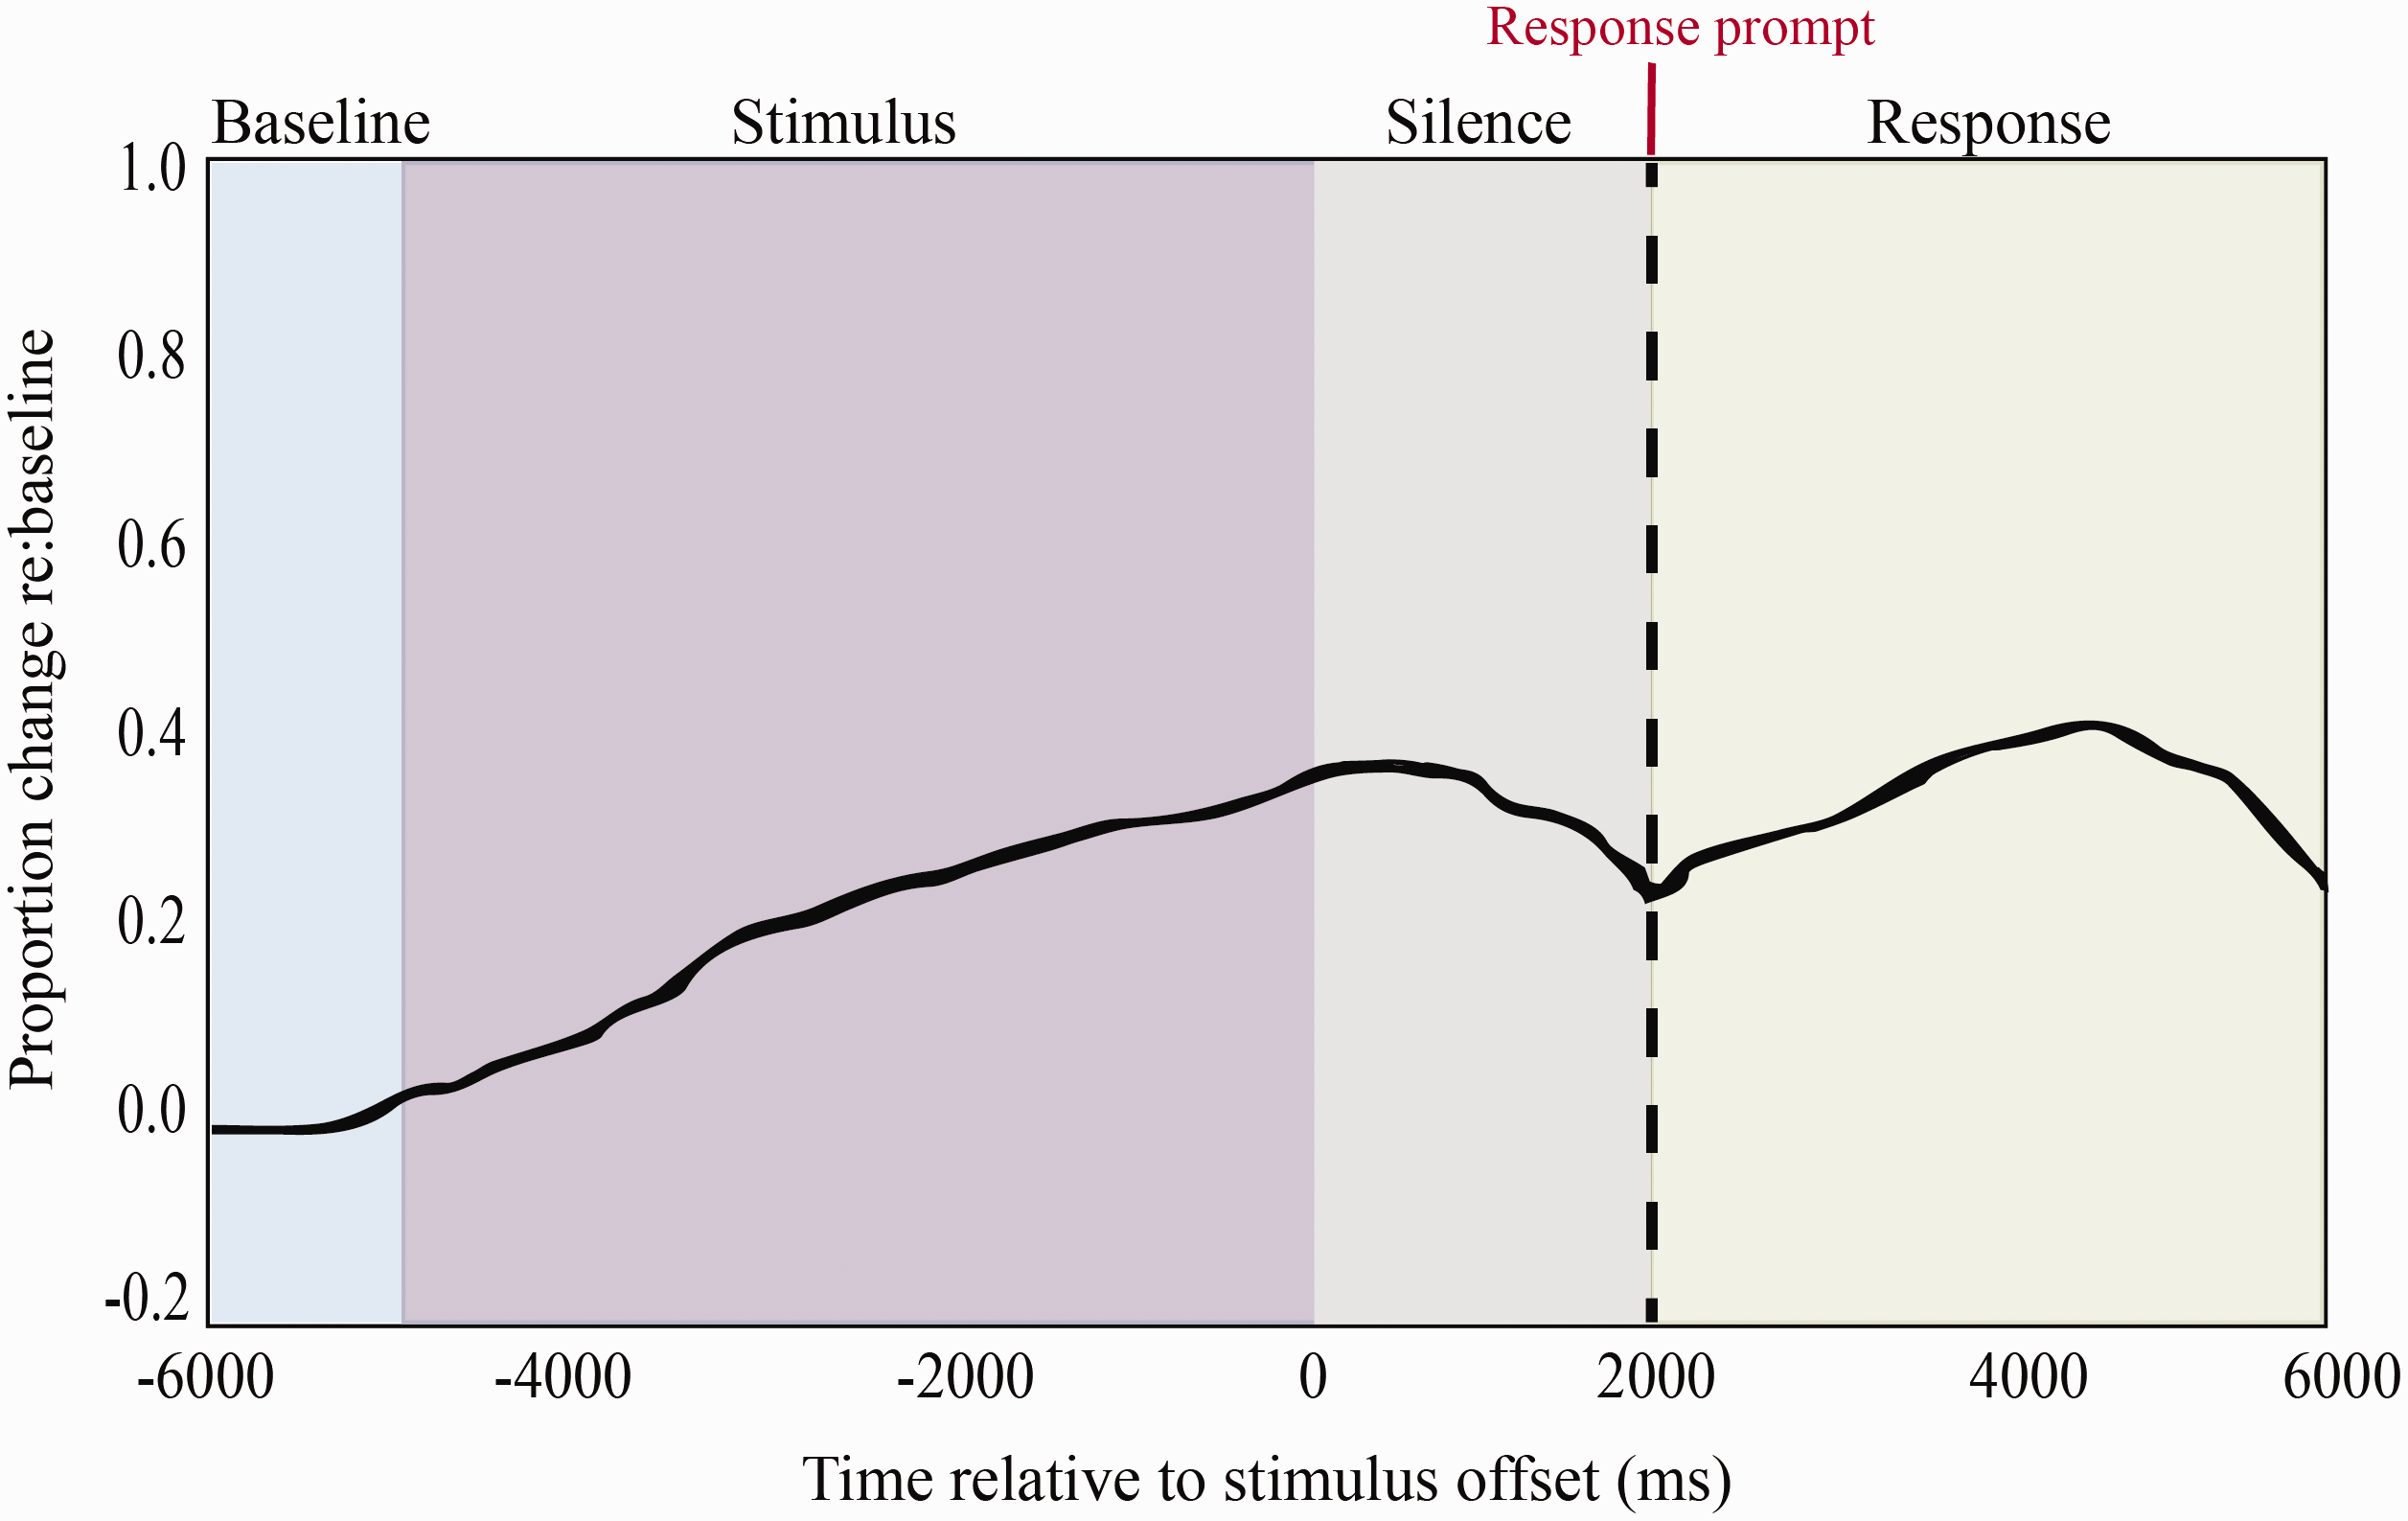
Example of a Pupil Track. Baseline pupil dilation was measured 1,000 ms prior to stimulus onset, the stimulus was then presented, there was a 2,000-ms silent period, participants heard two beeps to prompt a verbal response (dashed line), and then listeners repeated what they perceived.
For both the quiet and masker conditions, stimuli were blocked into runs consisting of 15 sentences. Each participant was tested on at least two runs per condition. If time allowed, a third run was tested for the quiet condition. Research has shown that pupil tracks in easier conditions (e.g., speech perception in quiet) often contain more distortions and have more variability than tracks recorded in more difficult conditions (e.g., with maskers at a low SNR), which reliably elicit large changes in pupil dilation (Winn et al., 2018). If a condition only requires minimal cognitive resources, the pupil response may be small or may not rise above random pupillary oscillations that typically occur. Therefore, a higher number of trials are required to tease apart task-evoked changes in pupil size from noise or other sources of variability (e.g., movement, gaze drifting, etc.). Testing a higher number of trials in the quiet condition was intended to maximize the possibility that small responses would be distinguishable from noise and that an adequate amount of data would be available for analysis after discarding contaminated tracks. Due to time constraints, two out of nine participants (MBI, MBJ) completed only two quiet runs, rather than three. The order of conditions was randomized for each participant, and for each run, target stimuli were randomly selected from the corpus without repetition.
Data Analysis
This study examined the effect of processing pupillometry data with three different blink criteria: no more than 15%, 30%, or 45% of pupil track samples missing from the trial. As previously mentioned, task-evoked pupil dilation is susceptible to biologic artifacts, such as blinking, gaze drifting, and poor baseline measures, even when controlling for factors such as lighting and external distractions. While blinking is the principal cause of lost samples in a track, gaze drifting and equipment error can also contribute to the amount of missing data. At present, it is not possible to disentangle these artifact sources. Therefore, the term blink will be used to refer to all missing samples, regardless of the cause. For a given blink criterion, all tracks with greater than the specified amount of missing data were discarded from analysis. When calculating the percentage of missing samples in a track, only samples from the onset of the baseline to the end of the silent period were considered (Figure 1). The response period was not included in the analysis because this part of the pupil track is influenced by the motor response and is therefore not purely related to task difficulty (Privitera et al., 2010; Winn et al., 2015). Consistent with methods for excluding contaminated trials from analysis, as described by Winn et al. (2018), tracks with vastly irregular baseline measurements, excessive distortions during the stimulus or silent period, or disproportionately large growth that is not typical of task-evoked changes in pupil dilation were also discarded. Further, tracks that contained a large section of missing data in a region of interest (e.g., during the wait period from which maximum pupil dilation is extracted) were also discarded, even if the percentage of missing data was below the specified blink criterion, as the interpolation could flatten the peak of the pupil response. In total, 1.6% of quiet trials and 0.7% of masker trials were discarded due to these types of contamination.
In addition to discarding contaminated trials and processing the data using the three different blink criteria, the data for each condition were “de-blinked” (i.e., linearly interpolated between gaps of missing data) and low-pass filtered with a 10-ms time window using the “smooth” function in MATLAB. Methods for detecting blinks were in accordance with those described by Zekveld et al. (2010), where pupil dilations that fell below three standard deviations (SDs) from the mean were tagged as missing samples. The segments of missing data were linearly interpolated 80 ms before the blink and 160 ms following the blink to account for disturbances in pupil size caused by the eyelid opening and closing (Zekveld et al., 2010). Tracks were then baseline corrected by subtracting the baseline value (calculated by averaging the pupil response measured 1,000 ms before stimulus onset; Figure 1) and then dividing by the baseline value to obtain the proportion of pupil change from baseline. 1 Finally, tracks were time-aligned to stimulus offset and averaged together by condition for each participant.
Both maximum pupil dilation (i.e., maximum proportional change from baseline) and percentage of correctly repeated words were calculated for all included trials. The maximum pupil dilation was calculated during the 2,000 ms after the stimulus offset and before the response prompt, classified as the “silent period” (Figure 1). This period is considered to be a window where listeners process and plan for their response (Zekveld et al., 2010). While the latency for peak pupil dilation can vary across participants, this window has commonly been shown to elicit the greatest amount of pupil dilation throughout the trial for sentence-recognition tasks such as the one used here (Winn et al., 2015, 2018).
Statistical Analysis
An alpha of .05 was used for all tests to determine whether results were significantly different from chance. Shapiro–Wilk normality tests were used to determine whether speech intelligibility and pupil dilation data were normally distributed. To reduce ceiling effects, the speech intelligibility data were transformed into rationalized arcsine units (RAUs) prior to analysis (Studebaker, 1985). RAUs are analogous to percent correct scores in that higher values correspond to better performance. Separate approaches were used for normally distributed and non-normally distributed data to examine differences across conditions for each blink criterion. Either a matched-pairs t test was used or a paired Wilcoxon signed-rank test was used, respectively.
In addition to investigating the effect of blink criteria on speech intelligibility and pupil dilation across conditions, we also examined potential bias toward discarding a higher number of difficult trials due to blinks. In other words, we examined the difference in the number of trials discarded per condition due to the percentage of blinks exceeding the specified criterion. The goal of this analysis was to understand whether more trials were being discarded due to blinks in the masker condition compared with the quiet condition because of the proposed relationship between blinking and task difficulty. A Pearson’s chi-square test of independence was used to determine whether the number of trials included for analysis under the least stringent (45%) and most stringent (15%) criteria was related to the difficulty of the condition (quiet vs. masker). Finally, to further examine a potential relationship between condition difficulty and spontaneous blinks in our task, a matched-pairs t test was used to assess whether the percentage of blinks in the masker condition was significantly different from the quiet condition under the most lenient blink criterion (45%).
Results
Effect of Listening Condition on Speech Intelligibility and Pupil Dilation
Figure 2 plots individual and average speech intelligibility in the quiet and masker conditions for each blink criterion. We expected participants to perform better in the quiet condition compared with the masker condition. In line with our prediction, all participants exhibited near-ceiling performance levels in the quiet condition (e.g., scores under the 45% criterion ranged from approximately 98% to 100% correct). In contrast, with the same blink criterion, the masker condition yielded intelligibility scores between 24% and 64% correct across participants, demonstrating the large variability in performance that exists within this population (Figure 2, right panel). One-tailed matched-pairs t tests confirmed that speech intelligibility in the quiet condition was significantly higher than in the masker condition for all blink criteria (15%: t(8) = 10.75, p < .001; 30%: t(8) = 16.76, p < .001; 45%: t(8) = 16.96, p < .001). This finding indicates that, regardless of the blink criterion used to reject trials, speech intelligibility was more difficult in the 0 dB SNR masker condition than in the quiet condition.

Speech Intelligibility Scores for the SSD Group Measured as Percent of Correctly Repeated Words in the Quiet Condition and the 0 dB SNR Speech Masker Condition Using 15%, 30%, and 45% Blink Criteria. Data were transformed to RAUs for analysis. Black diamonds indicate means for each blink criterion, and small white circles represent individual participants. Group medians (MD) are represented in the box plot by the solid black line and denoted below each plot. Points have been horizontally jittered for visibility. Asterisks indicate the significance level of pairwise comparison results (* for p < .05, ** for p < .01, and *** for p < .001).
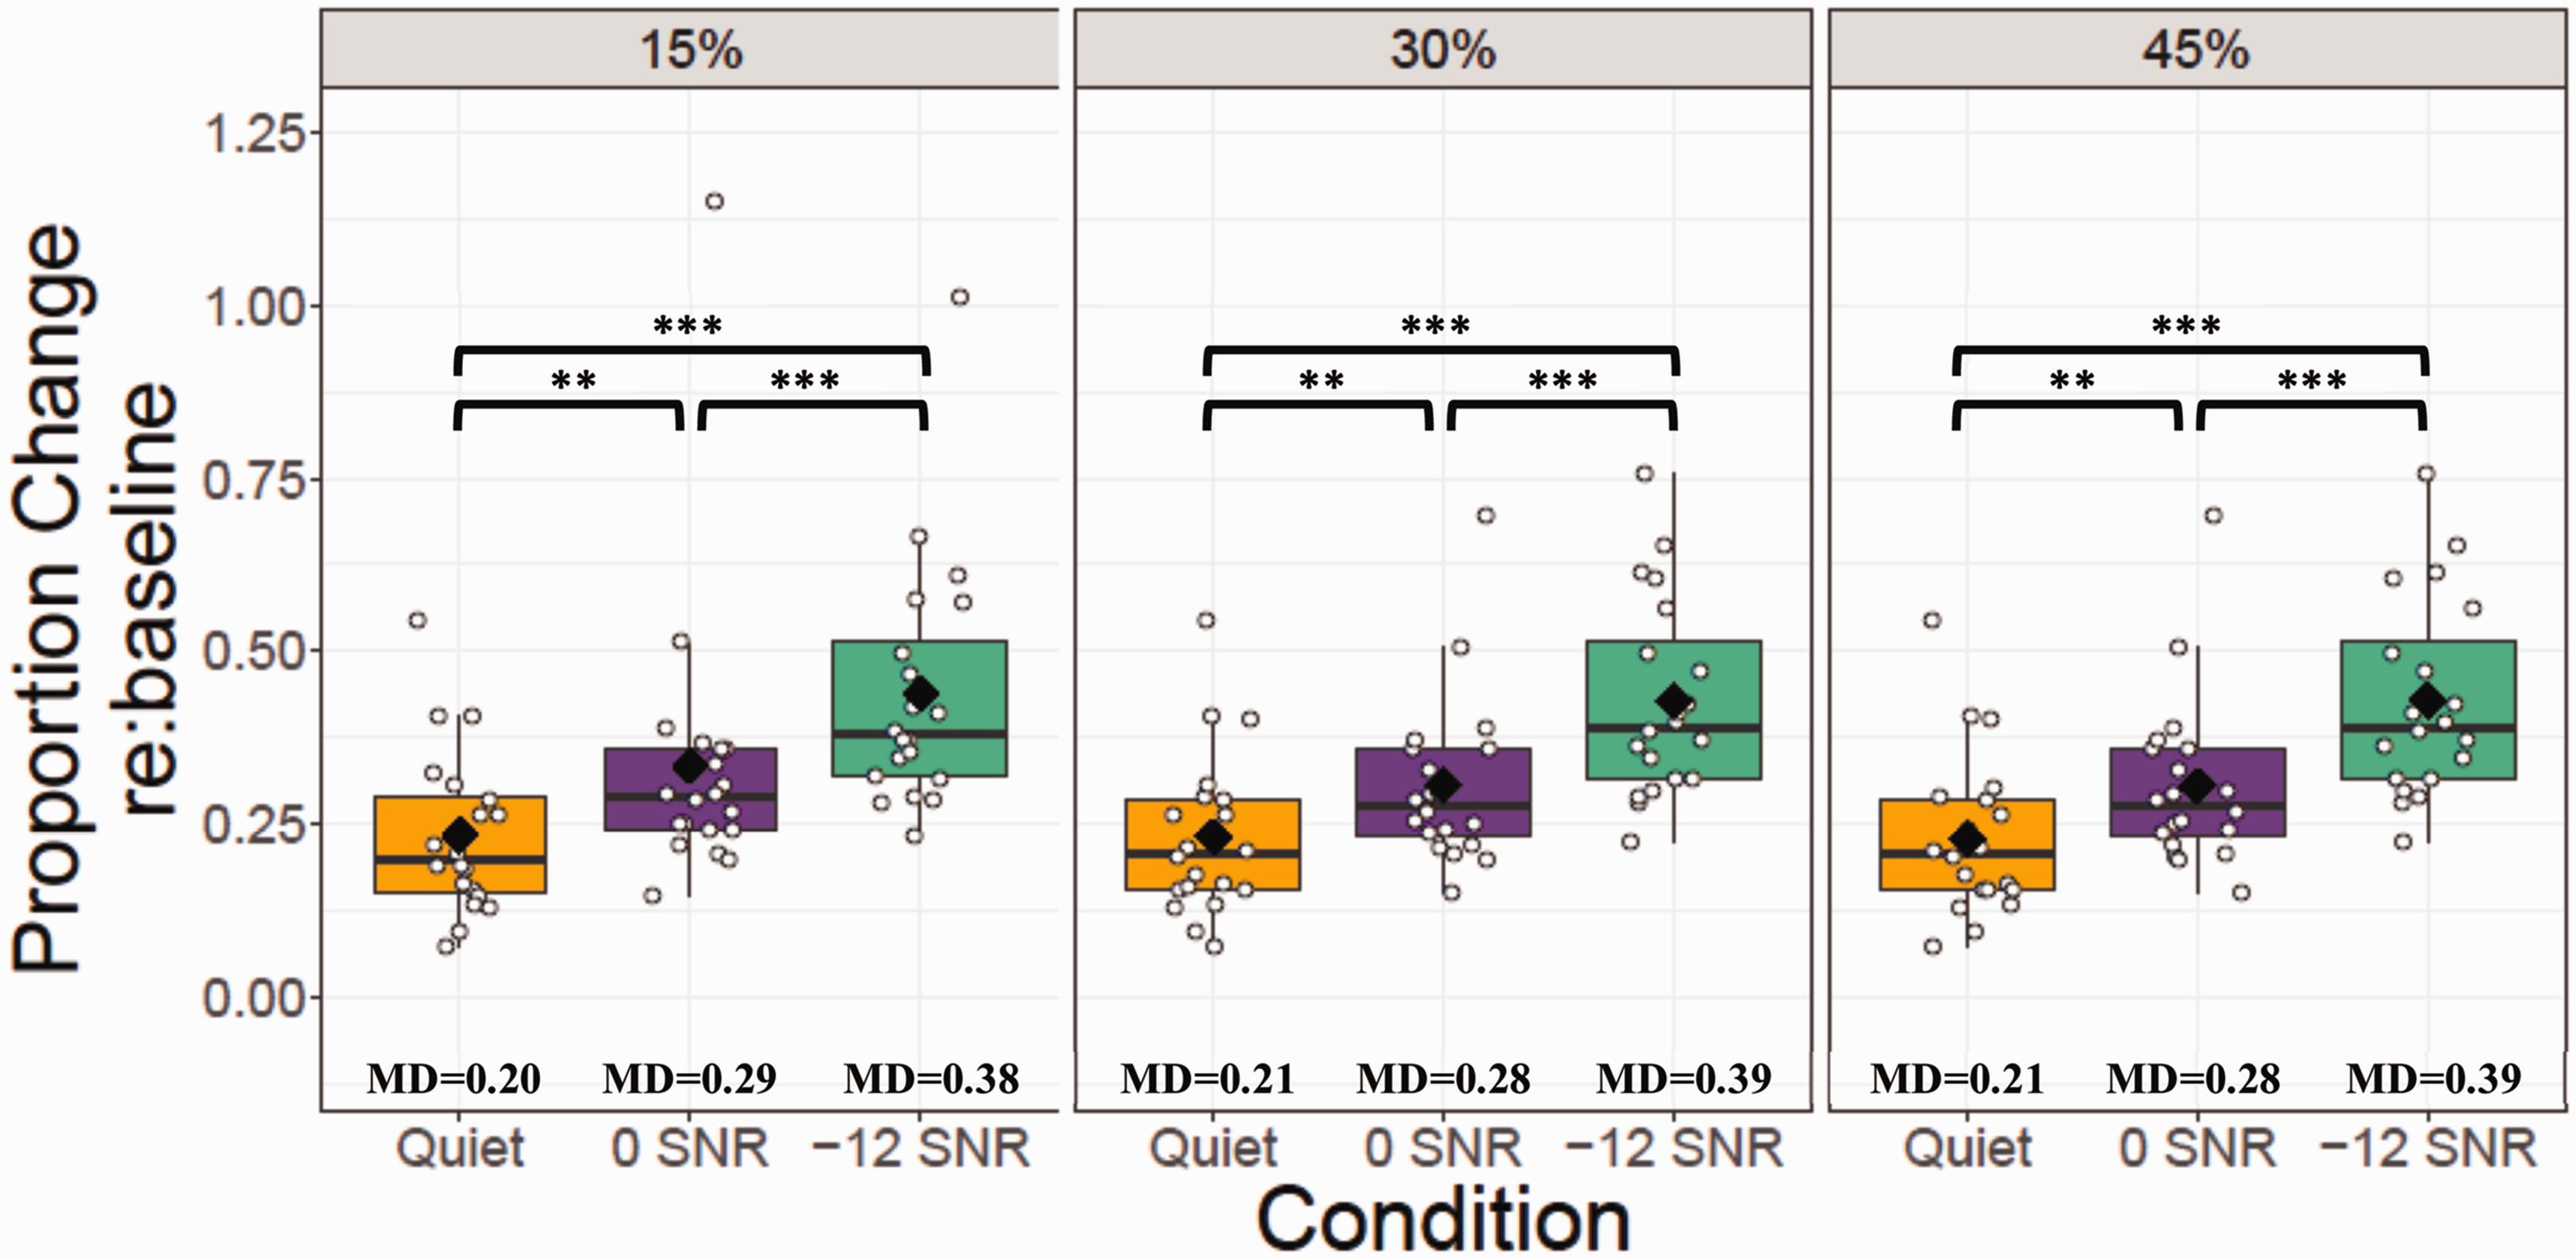
Figure 3 shows individual and average maximum pupil dilation measured during the post-stimulus silent period for each participant in the quiet and masker conditions for the three blink criteria. We expected the masker condition to be more difficult and therefore elicit a larger maximum pupil dilation compared with the quiet condition. One-tailed Wilcoxon signed-rank tests found significant differences in pupil dilation across listening conditions for all blink criteria, with the masker condition resulting in larger maximum pupil dilation than the quiet condition (15% criterion: z = –2.67, p = .002; 30% criterion: z = –2.67, p = .002; 45% criterion: z = –2.67, p = .002). This result suggests that listeners exerted more effort, or task engagement, in the 0 dB SNR masker condition than in quiet.

Maximum Pupil Dilation for the SSD Group Plotted as Proportion Change From Baseline Using 15%, 30%, and 45% Blink Criteria. Maximum dilation is calculated in the poststimulus silent period of the task (2,000 ms window between stimulus offset and response prompt). Black diamonds indicate means for each blink criterion, and small black circles represent individual participants. Group medians (MD) are represented in the box plot by the solid black line and denoted below each plot. Points have been horizontally jittered for visibility. Asterisks indicate the significance level of pairwise comparison results (* for p < .05, ** for p < .01, and *** for p < .001).
Influence of Blink Criterion on Number of Trials Analyzed
Table 2 contains the proportion of trials included for analysis under each blink criterion in the quiet and masker conditions. The least stringent blink criterion (45%) resulted in less than 10% of trials being discarded for both the quiet and masker conditions, while the most stringent (15%) resulted in approximately 22% of trials being discarded for the quiet condition and 27% for the masker condition. It should be noted that the data violated the assumption of independence, as the same participants were tested in the quiet and masker conditions. A Pearson’s chi-squared test determined that there was no significant relationship between blink criterion and listening condition for the number of trials analyzed, χ2(1) = 2.02, p = .169. This indicates that the number of included trials decreased similarly for both listening conditions as blink criterion stringency increased.
Proportion of Trials Analyzed Under Each Blink Criterion in Quiet and Speech Masker Conditions for the SSD Group.
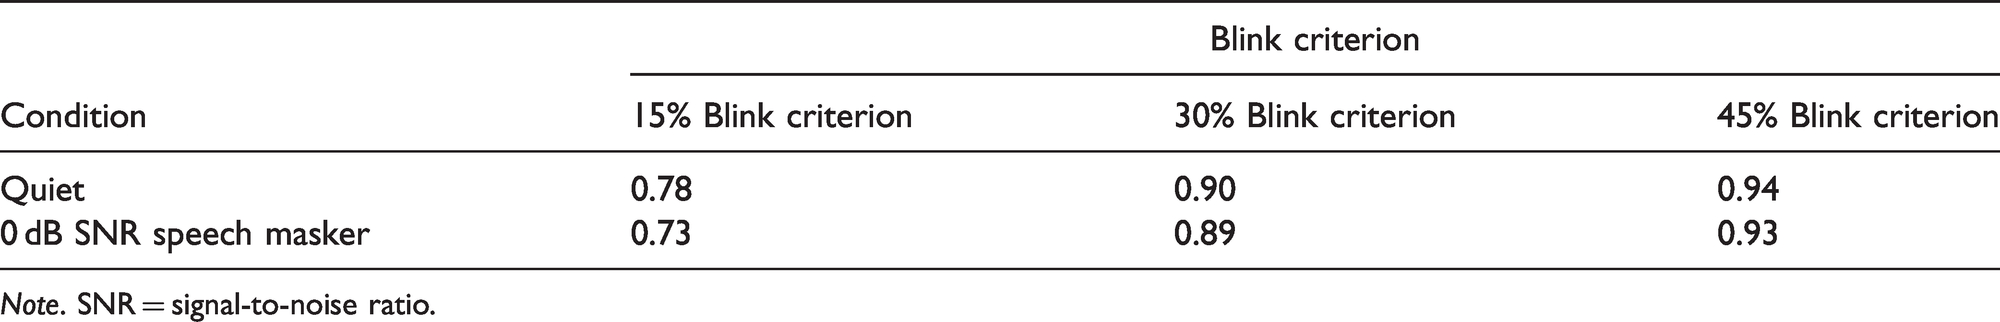
Note. SNR = signal-to-noise ratio.
Relationship Between Percentage of Blinks and Condition
The current literature supports excluding pupil tracks that have greater than 15% to 30% blinks or missing samples (Winn et al., 2018; Zekveld & Kramer, 2014; Zekveld et al., 2011). However, because maximum pupil dilation was very similar for the three blink criteria and the significant difference between listening conditions was present under all criteria, we opted to use only the 45% criterion for this analysis because it allowed for the highest proportion of trials to be included (see Table 2). Figure 4 illustrates the average percentage of blinks for each participant in the quiet versus masker condition. Previously observed relationships between task difficulty and blink rate led us to predict that the masker condition would elicit a higher blink rate and, consequently, a greater percentage of blinks than the quiet condition. We found that this was the case for all but two participants (MBD, MBG; Figure 4). A two-tailed matched-pairs t test revealed that the percentage of blinks was significantly higher in the masker condition compared with the quiet condition, t(8) = –2.73, p = .026. This indicates that there was a direct relationship between percentage of blinks and task difficulty for the SSD listeners tested in this study.
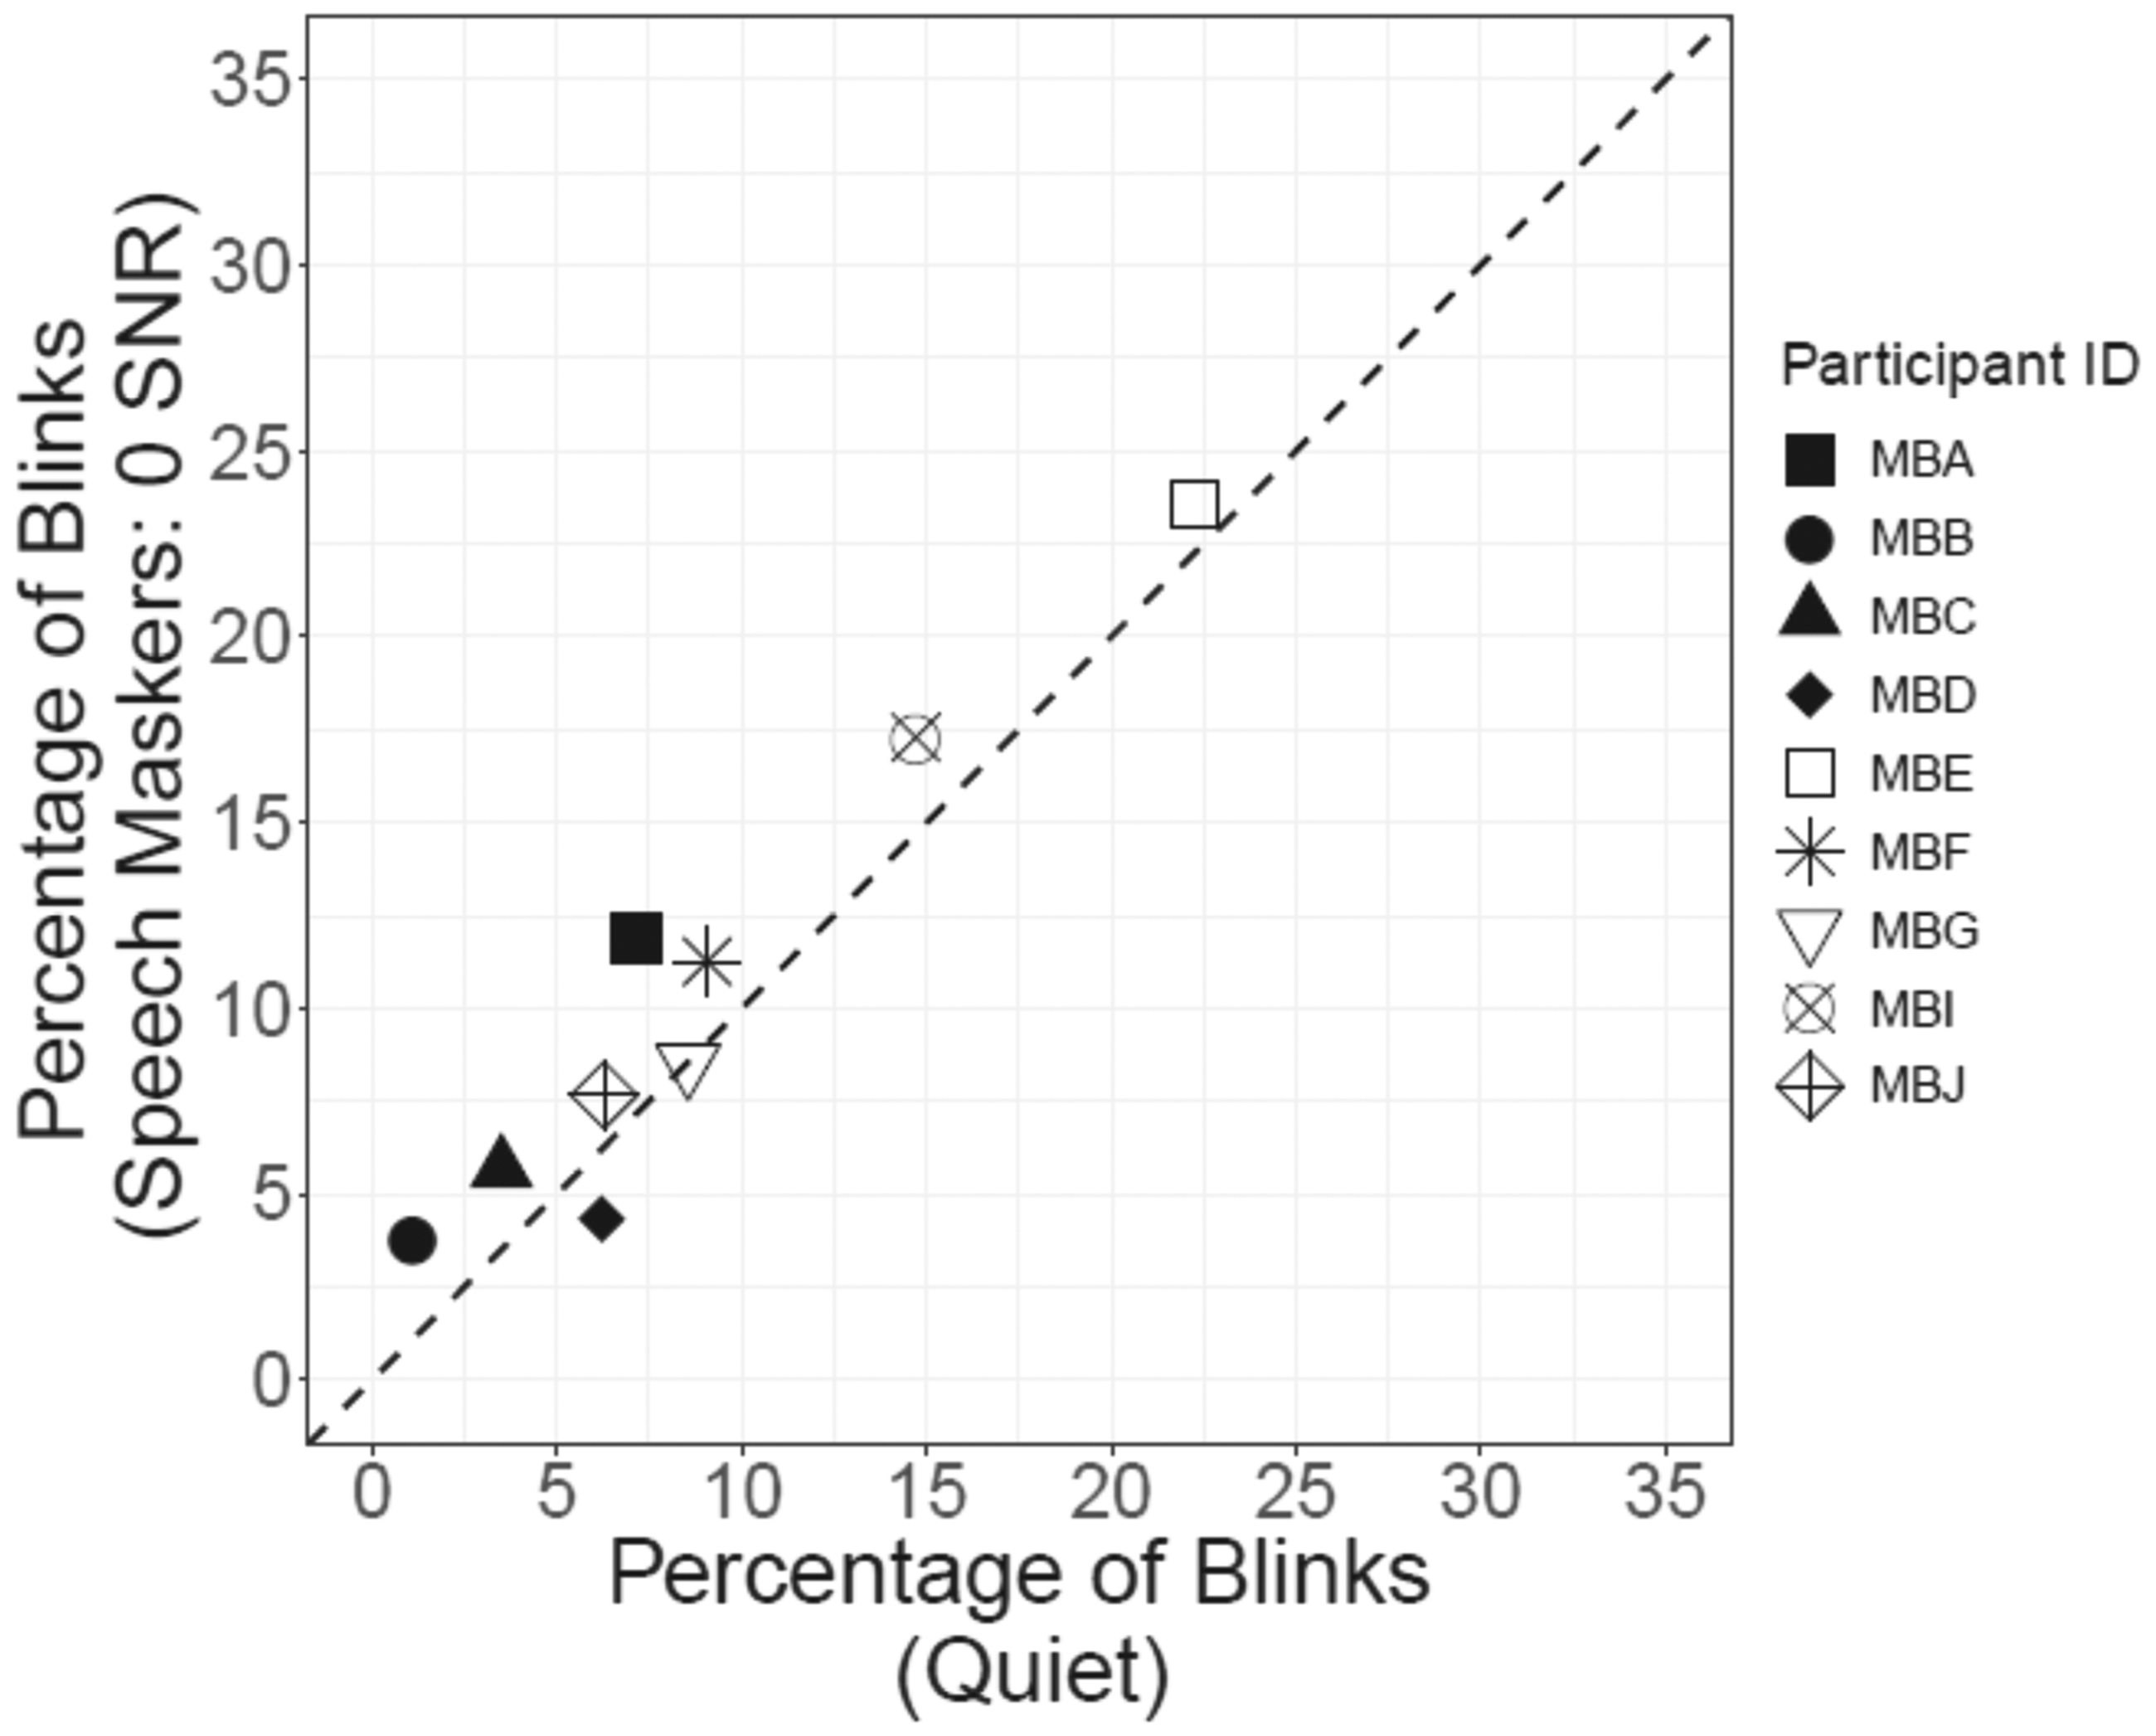
Comparison Plot Showing the Percentage of Blinks for Each SSD Participant for the 0 dB SNR Speech Masker Condition as a Function of the Quiet Condition. The dashed line denotes a line of equivalence. Values below this line indicate that the percentage of blinks in the quiet condition was greater than in the speech masker condition. Points above this line indicate that the percentage of blinks in the speech masker condition was greater than in the quiet condition. SNR = signal-to-noise ratio.
Experiment 2: Listening Effort and Speech Intelligibility in Participants With NH
Rationale
Experiment 1 examined whether a chosen blink criterion would systematically influence the results of a speech intelligibility and pupillometry task in individuals with SSD. In line with our expectations, intelligibility scores in the quiet condition were significantly better (Figure 2), and maximum pupil dilation was significantly smaller (Figure 3) than in the masker condition. This suggests that the masker condition was more difficult and demanded more effort, or engagement, than the quiet condition. Importantly, these results were unaffected by the level of blink criterion used to process the data. However, we did find that participants with SSD exhibited a significantly higher percentage of blinks in the speech masker condition compared with the quiet condition. Due to the fact that Experiment 1 examined a small sample size drawn from a unique listening population, we sought to perform a parallel analysis on a larger, more generalizable population, namely NH listeners. The data set from NH listeners had originally been collected as part of a larger, separate study that sought to examine spatial unmasking and listening effort. Several of the conditions tested were identical to those analyzed in Experiment 1, and the data were collected using similar procedures and methods. One noteworthy difference between the methods in the two studies is that participants in the NH experiment were asked to refrain from blinking during the presentation of the stimulus in each trial. Therefore, we investigated the effect of blink criterion on the results of a younger group of NH listeners who were given explicit instructions not to blink. The data were also compared with the SSD data to enhance our understanding of the implications of unilateral listening in complex acoustic environments.
Methods
All methods and procedures were identical to those used in Experiment 1 unless otherwise specified.
Participants
Twenty participants were recruited from the community; all passed a hearing screening (20 dB HL at octave frequencies from 250 to 8000 Hz). Testing took place at the University of Wisconsin-Madison Waisman Center over the duration of two sessions that were scheduled at least one week apart. The age of participants ranged from 18 to 45 years (mean ± SD = 21.90 ± 6.17), and all were native English speakers. This study was approved by the University of Wisconsin-Madison Health Sciences Institutional Review Board.
Stimuli
Target stimuli were drawn from the Harvard Institute of Electrical and Electronics Engineers sentence corpus (IEEE, 1969). After the start of the SSD study, our lab re-recorded many of our speech materials in order to create a database with a large inventory of high-quality stimuli. Therefore, the target sentences for the NH study were recorded by a different male talker than stimuli used for Experiment 1. Masker stimuli (two-talker babble) consisted of AzBio sentences (Spahr et al., 2012) spoken by the same male talkers as in Experiment 1. A computer with customized software written in MATLAB (The MathWorks, Natick, MA) was used to deliver stimuli and collect data.
Procedure
Participants were tested in three conditions: (a) quiet, where the target was presented from 0° azimuth at 65 dB SPL-A, (b) with speech maskers, where the target and maskers were both presented from 0° azimuth at an SNR of 0 dB, and (c) with speech maskers, where the target and maskers were both presented from 0° azimuth at an SNR of –12 dB. The first two conditions were identical to those tested in Experiment 1. The third condition with a harder SNR was included to analyze a wider range of performance in NH listeners. Prior to beginning the experiment on each day of testing, participants completed a familiarization procedure in which they heard a minimum of 12 sentences with maskers. Stimuli for practice trials were randomly selected and then excluded from the test corpus to avoid any sentence repetitions.
For both the quiet and masker conditions, stimuli were blocked into runs consisting of eight sentences. Each participant completed four runs per listening condition. The order of conditions was randomized for each participant, and for each run, target stimuli were randomly selected from the corpus without replacement. Maximum pupil dilation and percentage of correctly repeated words were analyzed for each condition.
Data Analysis
Akin to Experiment 1, the objective of this study was to examine the effect of processing pupillometry data with three different blink criteria: no more than 15%, 30%, or 45% of trial samples missing from the track. In total, 5.2% of quiet trials, 3.9% of 0 SNR masker trials, and 0.5% of –12 SNR masker trials were discarded due to the types of contamination explained in the “Data analysis” section of Experiment 1. Both maximum pupil dilation (proportion change from baseline) and percentage of correctly repeated words (transformed to RAUs) were calculated for all included trials by means of the same MATLAB analysis code used in Experiment 1.
Statistical Analysis
An alpha of .05 was used for all tests to determine whether results were significantly different from chance. For speech intelligibility, pupil dilation, and percentage of blinks data, Shapiro–Wilk normality tests determined that one or more of the conditions were not normally distributed. Consequently, Friedman’s analysis of variance (ANOVA) tests were used to examine these measures across conditions for each blink criterion. Post hoc pairwise comparisons were completed using one-tailed Wilcoxon signed-rank tests with Bonferroni corrections for multiple comparisons. To investigate a potential bias toward discarding a higher number of difficult trials due to blinking, a Pearson’s chi-squared test of independence was used to determine whether the number of trials included for analysis under the least stringent (45%) and most stringent (15%) criteria was related to the condition (quiet vs. 0 SNR speech masker vs. –12 SNR speech masker). Finally, two-tailed independent-samples t tests for normally distributed data or two-tailed Mann–Whitney U tests for non-normally distributed data were used to compare speech intelligibility, pupil dilation, and percentage of blinks across the SSD and NH groups.
Results
Effect of Listening Condition on Speech Intelligibility and Pupil Dilation
Figure 5 plots individual and average speech intelligibility in the quiet and masker conditions for each blink criterion. We expected performance to be best in the quiet condition and worst in the –12 SNR masker condition, with the 0 SNR masker condition falling in between. All participants exhibited near-ceiling-level performance in the quiet condition (median score under the 45% criterion = 116.50%; Figure 5, right panel). Performance was also high in the 0 dB SNR speech masker condition, with the median score under the 45% criterion equaling 95.32%. In contrast, the –12 dB SNR speech masker condition elicited much lower scores, with the median equaling 37.32% (Figure 5, right panel). Friedman’s ANOVAs indicated that speech intelligibility differed significantly across listening conditions for all blink criteria (45% criterion: χ2(2) = 40.00, p < .001; 30% criterion: χ2(2) = 40.00, p < .001; 15% criterion: χ2(2) = 40.00, p < .001). Post hoc pairwise comparisons revealed that speech intelligibility in the quiet condition was significantly higher than the 0 SNR (45% criterion: z = –3.92, p < .001; 30% criterion: z = –3.92, p < .001; 15% criterion: z = –3.92, p < .001) and –12 SNR masker conditions (45% criterion: z = –3.92, p < .001; 30% criterion: z = –3.92, p < .001; 15% criterion: z = –3.92, p < .001) and that speech intelligibility in the 0 SNR masker condition was significantly higher than the –12 SNR masker condition (45% criterion: z = –3.92, p < .001; 30% criterion: z = –3.92, p < .001; 15% criterion: z = –3.92, p < .001). This indicates that speech intelligibility decreased as the masker level was increased. Blink criteria did not affect this result.

Speech Intelligibility Scores for the NH Group Measured as Percent of Correctly Repeated Words in the Quiet Condition and the Speech Masker Conditions Using 15%, 30%, and 45% Blink Criteria. Data were transformed to RAUs for analysis. Black diamonds indicate means for each blink criterion, and small white circles represent individual participants. Group medians (MD) are represented in the box plot by the solid black line and denoted below each plot. Points have been horizontally jittered for visibility. Asterisks indicate the significance level of pairwise comparison results (* for p < .05, ** for p < .01, and *** for p < .001).
Figure 6 shows maximum pupil dilation measured during the post-stimulus silent period for each participant in the quiet and masker conditions as well as the average for the three blink criteria. We expected pupil dilation to be smallest in the quiet condition and highest in the –12 SNR masker condition, with the 0 SNR masker condition falling in between. Friedman’s ANOVAs indicated that maximum pupil dilation differed significantly across conditions for all blink criteria (45% criterion: χ2(2) = 31.60, p < .001; 30% criterion: χ2(2) = 31.60, p < .001; 15% criterion: χ2(2) = 27.90, p < .001). Post hoc pairwise comparisons revealed that maximum pupil dilation in the quiet condition was significantly smaller than the 0 SNR (45% criterion: z = –3.02, p = .002; 30% criterion: z = –2.99, p = .003; 15% criterion: z = –3.17, p = .001) and –12 SNR masker conditions (45% criterion: z = –3.92, p < .001; 30% criterion: z = –3.92, p < .001; 15% criterion: z = –3.92, p < .001) and that pupil dilation in the 0 SNR masker condition was significantly smaller than the –12 SNR masker condition (45%: z = –3.92, p < .001; 30%: z = –3.92, p < .001; 15%: z = –3.36, p < .001). This indicates that effort or engagement increased with increasing difficulty of the listening condition. This finding was present across all blink criteria.
Maximum Pupil Dilation for the NH Group Plotted as Proportion Change From Baseline Using 15%, 30%, and 45% Blink Criteria. Maximum dilation is calculated in the poststimulus silent period of the task (2,000 ms window between stimulus offset and response prompt). Black diamonds indicate means for each blink criterion, and small black circles represent individual participants. Group medians (MD) are represented in the box plot by the solid black line and denoted below each plot. Points have been horizontally jittered for visibility. Asterisks indicate the significance level of pairwise comparison results (* for p < .05, ** for p < .01, and *** for p < .001).
Influence of Blink Criterion on Number of Trials Analyzed
Table 3 contains the proportion of trials included for analysis under each blink criterion in the quiet and speech masker conditions. The least stringent blink criterion (45%) resulted in less than 1% of trials being discarded for the quiet and both masker conditions, while the most stringent blink criterion (15%) resulted in approximately 11% of trials being discarded for all three conditions. A Pearson’s chi-squared test determined that there was no significant relationship between blink criterion and listening condition for the number of trials analyzed, χ2(2) = 0.34, p = .849. Consistent with the SSD group results, this indicates that the change in number of trials analyzed across blink criteria was similar between the quiet and masker conditions for the NH listeners.
Proportion of Trials Analyzed Under Each Blink Criterion in Quiet and Speech Masker Conditions for the NH Group.

Note. SNR = signal-to-noise ratio.
Relationship Between Percentage of Blinks and Listening Condition
A Friedman’s ANOVA determined that the total percentage of blinks under the 45% blink criterion did not significantly differ by listening condition, χ2(2) = 0.70, p = .773, unlike results in Experiment 1.
Comparison of SSD and NH Data: Quiet and 0 SNR Speech Masker Conditions
Blink criteria did not influence the results of either experiment, therefore between-group comparisons were conducted using the most lenient blink criterion (45%). Because SSD participants were not tested in the –12 SNR condition, between-group comparisons included only the quiet and 0 SNR masker conditions. While speech intelligibility was similar across groups in the quiet condition (SSD mean = 112.37% ± 2.12, NH mean = 115.31% ± 4.90), performance diverged in the speech masker condition, with the SSD group averaging 49.20% ± 11.42 and the NH group averaging 95.92% ± 5.85. To evaluate the effect of noise on speech intelligibility and listening effort in NH and SSD listeners, the differences between the quiet and 0 SNR speech masker condition were compared across groups for both measures (Figure 7). We predicted the SSD group to be more negatively impacted by the noise maskers than the NH group due to their inability to access binaural benefits and consequently to also show a larger increase in pupil dilation across conditions compared with the NH group. On average, the NH group’s intelligibility decreased by 19.39% when speech maskers were added, while the SSD group’s intelligibility decreased by an average of 63.17% (Figure 7A). A two-tailed independent-samples t test confirmed that the SSD group’s intelligibility decreased significantly more than the NH group’s from the quiet to speech masker condition (t(27) = –13.16, p < .001). This indicates that the SSD group’s speech intelligibility performance was much more negatively impacted by the addition of speech maskers compared with the NH group. The changes in maximum pupil dilation (Figure 7B) from the quiet to speech masker condition, on the other hand, were not significantly different between the SSD and NH group (Mann–Whitney U test: z(n1 = 9, n2 = 20) = 1.74, p = .085). However, it should be noted that, in the masker versus quiet conditions, the SSD group exhibited a larger increase in pupil dilation than the NH group (SSD median difference = 0.17; NH median difference = 0.08).

Comparison of SSD and NH groups. A: The difference in speech intelligibility scores (transformed to RAUs) between conditions for the SSD and NH groups under the 45% blink criterion. B: The difference in maximum pupil dilation between conditions for the SSD and NH groups under the 45% blink criterion. The differences were calculated as the 0 SNR masker condition minus the quiet condition. Black diamonds indicate means for each group, and small white circles represent individual participants. Group medians (MDs) are represented in the box plots by the solid black line and denoted below each plot. Points have been horizontally jittered for visibility. Asterisks indicate the significance level of the across-group comparison (* for p < .05, ** for p < .01, and *** for p < .001).
Finally, the percentages of blinks in the quiet and 0 SNR masker conditions were compared across groups. We expected to see differences across groups due to the discrepancy in blink instruction for each experiment (SSD participants were given no instruction regarding blinking; NH participants were instructed to avoid blinking during each trial). The SSD group median percentages were 7.16% in the quiet condition and 8.52% in the masker condition, while the NH group medians were 4.65% blinks in the quiet condition and 4.72% in the masker condition, demonstrating that the percentage of blinks for NH group was less than for the SSD group. Percentage of blinks was compared across groups for each condition separately. Two-tailed Mann–Whitney U tests found the difference in percentage of blinks across groups to be nonsignificant for either condition (Quiet: z(n1 = 9, n2 = 20) = –1.27, p = .216; 0 SNR speech masker: z(n1 = 9, n2 = 20) = –1.89, p = .062).
Discussion
Pupillometry has become an increasingly popular method for capturing changes in mental effort over time and is especially well suited for populations with assistive devices made of ferrous material that are incompatible with other objective methods such as functional magnetic resonance imaging and electroencephalography (Friesen & Picton, 2010; Gilley et al., 2006; Wagner et al., 2019). However, many methods for cleaning and analyzing pupillary data have yet to be empirically investigated. The first aim of this study was to investigate the effect of a common exclusion criterion, percentage of blinks, on speech intelligibility and maximum pupil dilation in individuals with SSD and with NH. Participants were tested in quiet and with speech maskers. We chose to examine this particular trial exclusion criterion because blinking has been related to task difficulty and is a major determinant for excluding pupil tracks from analysis in the pupillometry literature. The second aim was to compare performance and listening effort between the SSD group and NH group. Due to the severity of hearing loss in one ear, individuals with SSD have restricted access to spatial cues, often reporting fatigue and effortful listening (Alhanbali et al., 2017; Dillon et al., 2018; Grantham et al., 2012; Litovsky et al., 2019; Távora-Vieira et al., 2019). Examining listening effort in this population enhances our understanding of the compensatory mechanisms that individuals with hearing loss employ to successfully function in everyday, complex listening situations.
For both the SSD and NH group, we found significant differences in speech intelligibility and maximum pupil dilation in the quiet condition compared to conditions with a speech masker. In line with our expectations, intelligibility in the quiet condition was significantly bettern line with our expectations, intelligibility in the quiet condition was significantly better (Figures 2 and 5) and maximum pupil dilation was significantly smaller (Figures 3 and 6) compared with the 0 SNR masker condition. This suggests that masker conditions were more difficult and demanded more effort or engagement than the quiet condition for both groups. For the NH group, this trend was maintained for the –12 SNR masker condition, in which listeners demonstrated significantly poorer speech intelligibility scores and greater pupil dilation compared with the 0 SNR masker condition. These findings did not change based on the level of blink criterion used to process the data.
We examined the total percentage of blinks in both the quiet and speech masker conditions to investigate a potential relationship between spontaneous blinking and task difficulty in our study. We found that the masker condition elicited a significantly higher percentage of blinks compared with the quiet condition for the SSD listeners (Figure 4). This observation is consistent with previous studies that have demonstrated a significant positive relationship between blink rate and task difficulty (e.g., Recarte et al., 2019). The present study also examined the proportion of trials analyzed under three blink criteria and found that the quiet and masker conditions were similar under the 45% criterion (93% and 94% included for analysis, respectively) and began to diverge under the more stringent 15% criterion (78% and 73% included for analysis, respectively; Table 2). This trend did not reach significance, but when considered in tandem with the significant relationship between blink percentage and condition, it may suggest that a stringent criterion such as 15% could result in a higher proportion of trials being discarded from analysis in difficult conditions. This effect also has the potential to manifest within a condition, with a stringent blink criterion resulting in the exclusion of trials that were more difficult (and had higher pupil dilation), thereby underestimating pupil dilation for the condition and consequently, listening effort or engagement. This did not appear to be the case for our study because pupil dilation for a given condition appeared to be similar across all blink criteria (Figure 3). In contrast, we did not observe similar trends regarding percentage of blinks in each condition or proportion of trials analyzed under each criterion for the NH data. A Freidman’s ANOVA revealed that the total percentage of blinks did not differ between conditions, nor was there a difference in proportion of trials kept between conditions under any of the blink criteria. However, these results must be interpreted with caution because of the explicit instructions given to NH listeners to refrain from blinking during each trial.
To examine differences between the SSD and NH groups, we compared changes in performance from the quiet to 0 SNR masker condition across groups. Due to the well-established benefits that result from access to binaural hearing in noisy environments (e.g., Hawley et al., 2004; Litovsky et al., 2009; Moore, 2003) we expected SSD listeners to be more negatively impacted by the addition of a speech masker than the NH listeners. Our findings confirmed this expectation, with both groups scoring similarly in the quiet condition, but the NH listeners scoring an average of 47% better than the SSD listeners in the speech masker condition (Figure 7). This effect has been shown in previous studies as well. Rothpletz et al. (2012) compared speech reception thresholds of individuals with NH to those with unilateral hearing loss in both a monaural headphone condition and in a colocated free-field condition using the Coordinate Response Measure corpus for both the target and masker stimuli. Their results revealed no difference in performance between the groups on the monaural headphone task. However, when tested in the colocated free-field condition, individuals with unilateral hearing loss performed significantly worse than those with NH, with a difference of about 4.5 dB between thresholds for each group. The results shown by the Rothpletz et al. (2012) study as well as the current study were obtained in colocated target and masker conditions, which lack interaural differences that could be used to separate the two auditory streams. However, in this situation, listeners with two ears do have access to a binaural advantage known as binaural redundancy, or the benefit that listeners receive by having duplicate copies of a signal in the two ears. Binaural redundancy has been shown to result in improved speech intelligibility in noise and increased perceptual loudness (Hawley et al., 2004; Litovsky et al., 2009). Individuals with SSD may be at a disadvantage because they are unable to access these benefits.
In addition to speech intelligibility, we also examined changes in pupil dilation from the quiet to the speech masker condition across groups. Compared with NH listeners, SSD listeners demonstrated a greater decrease in performance from the quiet condition to the speech masker condition. Thus, we expected SSD listeners to exhibit a greater change in pupil dilation between conditions than the NH listeners. While our results were consistent with the expected trend, the difference between groups was not significant (p = .085). One possible explanation is the large age discrepancy between listeners in the SSD and NH groups (SSD mean ± SD = 52.22 ± 14.12; NH mean ± SD = 21.90 ± 6.17). Previous studies have found interactions between aging, hearing loss, and pupillary responses. Kramer et al. (2016) reported that the difference in pupil dilation between quiet and SRT50% conditions was smaller for hearing-impaired listeners than NH listeners. Hearing-impaired listeners had similar pupil dilation to NH listeners in the quiet condition, but significantly smaller pupil dilation in the SRT50% condition, despite the fact that they rated the SRT50% condition as more effortful than the NH listeners. Comparable results were also reported by Zekveld et al. (2011). Effects similar to these may have contributed to the lack of significant difference in pupil dilation change between the two groups in our study. Zekveld et al. (2011) found that middle-aged listeners demonstrated relatively small peak pupil dilations at difficult SNRs and relatively long pupil responses, compared with younger listeners. They proposed that middle-aged listeners do not encode and process speech as deeply as younger individuals (i.e., there is less memory and semantic encoding) and that “aging is associated with increased speech processing time” (Zekveld et al., 2011, p. 507). These concepts are supported by numerous studies that have demonstrated age-related decline in cognitive functions, including working memory (e.g., Gordon-Salant & Fitzgibbons, 1997; for review, see Salthouse, 2010), and compensatory mechanisms to overcome these deficits, including an upregulation of “nontraditional language-related” brain regions and prolonged activation during language processing (Wingfield & Grossman, 2006, p. 2837). In addition, Piquado et al. (2010) proposed a potential age-related change in pupil reactivity, where the pupil becomes less responsive as individuals get older. Based on these explanations, had we tested a NH group that was more similar in age to the SSD group, it is possible we may have seen a larger effect of group on the change in pupil dilation from quiet to speech masker conditions. Another explanation may be the large variability of the NH group compared to the SSD group, which is likely due to the aforementioned effects of aging and hearing loss on the pupil response. The group contained one strong outlier with a value that was greater than 2.5 times the interquartile range. To ensure that the outlier was not affecting the results of the statistical test, the outlier was removed and replaced by a value that was the mean plus two SDs (mean = 0.08, SD = 0.09; Field, 2013, p. 153); however, this transformation did not change the test statistic.
Implications for Pupillometry Data Analysis
Blink criterion stringency did not affect speech intelligibility or pupil dilation results for the SSD or NH group. However, we found a significant difference in the total percentage of blinks in the quiet versus speech masker conditions for the SSD group, but not for the NH group. In the present study, we were not able to deduce whether this was due to the lack of blink instruction given to the SSD group, participant demographics (e.g., age and hearing ability) of the SSD group, or a combination of the two. In addition, our findings are limited by our small sample size. The discrepancy in results and difference in instructions across groups makes it difficult to conclude what should be done regarding blink exclusion criteria. Based on the findings of the SSD group analysis, a conservative recommendation may be to use a more lenient blink criterion (e.g., 30% to 45%) to promote data retention and avoid inadvertently skewing results, which may conceal important information about task difficulty. However, this recommendation may not hold for studies using a different trial structure or shorter stimuli than those presented in this study. In addition, it is imperative that an experimenter visually inspect individual pupil tracks, especially when using a more lenient blink criterion. Tracks that contain a large section of missing data in an important section of the pupil track (e.g., during the wait period from which maximum pupil dilation is extracted) should be discarded, as the interpolation may flatten the peak of the pupil response. Furthermore, while we cannot say for certain whether the higher percentage of blinks for SSD listeners compared with NH listeners was entirely due to the difference in blink instruction, experimenters should give careful thought to the instructions they give, as asking participants to refrain from blinking can improve data quality but may also impose an additional attention-demanding task on participants (Berman et al., 2012). Further research is needed to better understand these relationships, but the present study demonstrates that blink criterion stringency deserves careful consideration in future experiments using pupillometry to gauge listening effort.
Limitations
It is promising that the results of our experiment were not affected by the level of blink criteria used to analyze the data; however, these conclusions are limited by our small sample sizes and differing instructions between Experiment 1 and Experiment 2. Other analytical techniques that make use of curve fitting (e.g., growth curve analysis, generalized additive [mixed] models) could be even more robust to different criterion levels, as they do not depend on the integrity of a single data point. Further, in the present study, only a small portion of the entire pupil track was analyzed to determine maximum pupil dilation (i.e., silent period). Due to the changing task demands throughout the course of the trial (e.g., listening, processing, and responding), participants’ blink rate likely varies systematically within a trial. It is conceivable that other portions of the trial may have been more affected by spontaneous blinks related to task difficulty. Therefore, these results are only generalizable to experiments with trial structures and analysis windows similar to those used in this study. Finally, it is also possible that results from such a unique population may not be generalizable to individuals with other types and/or degrees of hearing loss, or to individuals with devices such as hearing aids or cochlear implants, as all of these factors contribute to patient performance and processing demands.
Summary
In conclusion, the present study revealed that speech intelligibility was better and maximum pupil dilation was smaller in quiet listening conditions compared with noisy conditions in individuals with SSD and with NH. A systematic analysis of blink exclusion criteria showed that varying criterion stringency did not alter the effects observed across quiet and speech masker conditions for speech intelligibility or maximum pupil dilation for either group. Nevertheless, we did find a significantly higher percentage of blinks in the masker condition relative to the quiet condition in the SSD group, suggesting that blink criterion stringency should be carefully considered in studies using pupillometry to measure listening effort.
Footnotes
Authors’ Note
Portions of this work were presented at the 2019 Conference on Implantable Auditory Prostheses, Lake Tahoe, CA, July 2019. The authors would like to thank Shelly P. Godar and Ellen Snodgrass for help with recruitment and data collection, and members of the Binaural Hearing and Speech Lab for assistance with data collection.
The identification of specific products or scientific instrumentation is considered an integral part of the scientific endeavor and does not constitute endorsement or implied endorsement on the part of the author, DoD, or any component agency. The views expressed in this article are those of the author and do not reflect the official policy of the Department of Army/Navy/Air Force, Department of Defense, or U.S. Government.
Declaration of Conflicting Interests
The authors declared no potential conflicts of interest with respect to the research, authorship, and/or publication of this article.
Funding
The authors disclosed receipt of the following financial support for the research, authorship, and/or publication of this article: This research was supported by NIH-NIDCD Grant No. R01DC003083 (to R. Y. L.), NIH-NICHD Grant No. U54HD090256 (to Waisman Center), and by funds provided by the University of Wisconsin-Madison Department of Surgery to J. R.