
Abstract
Effective hearing aid (HA) rehabilitation requires personalization of the HA fitting parameters, but in current clinical practice only the gain prescription is typically individualized. To optimize the fitting process, advanced HA settings such as noise reduction and microphone directionality can also be tailored to individual hearing deficits. In two earlier studies, an auditory test battery and a data-driven approach that allow classifying hearing-impaired listeners into four auditory profiles were developed. Because these profiles were found to be characterized by markedly different hearing abilities, it was hypothesized that more tailored HA fittings would lead to better outcomes for such listeners. Here, we explored potential interactions between the four auditory profiles and HA outcome as assessed with three different measures (speech recognition, overall quality, and noise annoyance) and six HA processing strategies with various noise reduction, directionality, and compression settings. Using virtual acoustics, a realistic speech-in-noise environment was simulated. The stimuli were generated using a HA simulator and presented to 49 habitual HA users who had previously been profiled. The four auditory profiles differed clearly in terms of their mean aided speech reception thresholds, thereby implying different needs in terms of signal-to-noise ratio improvement. However, no clear interactions with the tested HA processing strategies were found. Overall, these findings suggest that the auditory profiles can capture some of the individual differences in HA processing needs and that further research is required to identify suitable HA solutions for them.
Hearing aid (HA) benefit in noisy environments is known to vary substantially among users, and the issue of how to improve individual HA outcome in such scenarios has been the topic of previous investigations (e.g., Lopez-Poveda et al., 2017; Luts et al., 2010; Sanchez-Lopez et al., 2018). Modern HAs come with various features, for example, directional microphones, noise reduction, and dynamic range compression (e.g., Dillon, 2012; Kates, 2008). These features are designed to help individuals with hearing impairment to perceive speech in complex environments. However, none of these features can provide an optimal solution across a large range of speech-in-noise scenarios (Launer et al., 2016), for example, due to distortions caused by the algorithms (e.g., Reinten et al., 2019; Völker et al., 2018). This may explain why large individual differences are often observed in the response to specific HA features (e.g., Brons et al., 2014; Lunner & Sundewall-Thorén, 2007; Neher, 2014; Neher & Wagener, 2016; Picou et al., 2015; Sarampalis et al., 2009). Moreover, the complexity of modern HAs results in numerous possible combinations of advanced signal processing parameters. Currently, there are no clear guidelines available regarding how HA features should be combined for a given HA user to personalize HA fittings beyond the basic gain prescription.
It has been suggested that HA settings should be customized to individual hearing deficits to improve HA outcome (Kiessling, 2001). Individuals with a hearing loss suffer not only from reduced audibility but also from suprathreshold hearing deficits such as impaired binaural, spectral, and temporal processing (Houtgast & Festen, 2008; Johannesen et al., 2016; Plomp, 1978; Santurette & Dau, 2007; Strelcyk & Dau, 2009). A number of studies have reported associations between temporal processing abilities and aided speech-in-noise performance (Lopez-Poveda et al., 2017; Souza et al., 2019), preference for different compression settings (Moore & Sęk, 2016), or prefitting hearing outcome (Perez et al., 2014). Moreover, binaural hearing abilities have been linked to benefit from different beamforming schemes (Neher et al., 2017). Because large individual differences in terms of hearing abilities and HA outcomes are common, it is possible that the benefit offered by different HA processing schemes interacts with the hearing deficits of the user.
To gain a comprehensive view of the hearing deficits of a given HA user, it has been suggested to complement current clinical measures with tests of suprathreshold hearing abilities (e.g., van Esch et al., 2013). Such extra assessments could enable the classification of HA users into subcategories that could then serve as the basis for more personalized HA treatment. For that purpose, a study conducted as part of the Danish Better hEAring Rehabilitation (BEAR) project proposed an auditory test battery for individual hearing loss characterization (Sanchez-Lopez, Nielsen, et al., 2019). This test battery includes six categories of tests that measure aspects related to audibility, speech perception, binaural-processing abilities, loudness perception, spectrotemporal modulation sensitivity, and spectrotemporal resolution. Based on the data from 70 older participants with symmetrical sensorineural hearing loss and five normal-hearing listeners, a data-driven approach was proposed for classifying the listeners into four distinct auditory profiles (Sanchez-Lopez, Nielsen, et al., 2019; Sanchez-Lopez et al., 2020). The profiles—referred to as A, B, C, or D—were defined by their degree of perceptual deficits along two independent dimensions or types of ‘auditory distortion’ Auditory distortion type-I was found to be related to high-frequency hearing loss and reduced speech intelligibility, while auditory distortion type-II was found to be linked to low-frequency hearing loss and abnormal loudness perception (Sanchez-Lopez et al., 2020). Listeners with little auditory distortion in terms of both types and thus near-normal hearing abilities would belong to Profile A. In contrast, listeners exhibiting clear auditory distortions in terms of both types would belong to Profile C. Profile-B and -D listeners, in turn, would be characterized by clear auditory distortions in terms of one but not the other type.
Given these distinct differences in perceptual deficits, it was hypothesized that Profiles A to D would also show different needs in terms of HA processing. For example, due to their near-normal hearing abilities, Profile-A listeners might be sensitive to, and thus less tolerant toward, signal distortions introduced by the HA processing. In contrast, because of their marked auditory distortions, Profile-C listeners might be insensitive to, and thus more tolerant toward, HA-induced distortions. In addition, Profile-C listeners would likely have poorer speech-in-noise outcomes and would therefore benefit from more signal-to-noise ratio (SNR) improvement compared with Profile-A listeners. Profile-B and -D listeners, in turn, would likely lie somewhere in between.
To guide the identification of optimal HA processing strategies for the four auditory profiles, a comprehensive technical evaluation was therefore conducted (Sanchez-Lopez et al., 2018). To that end, an HA simulator that included directional processing, noise reduction processing, and amplitude compression (see HA Simulator and HA Processing Strategies section) was applied to process a range of realistic speech-in-noise signals. The signals at the output of the HA simulator were then analyzed using several technical measures, including the segmental SNR as well as metrics of temporal and spectral distortion. In that manner, both desirable (SNR improvement) and undesirable (temporal and spectral distortion) effects were captured. Based on the results, six HA processing strategies that differed markedly in terms of the considered acoustical effects were selected for further investigations (Sanchez-Lopez et al., 2018).
The purpose of the current study was to explore the perceptual effects of these six HA processing strategies in relation to the four auditory profiles. The evaluation consisted of a speech recognition task, an overall quality rating task, and a noise annoyance rating task, all carried out in a realistic speech-in-noise scenario. In this manner, different response patterns with respect to the tested HA processing strategies were expected to be elicited among the profiles.
Methods
Participants
Sixty subjects aged 60 to 80 years (mean = 70.8 years, 30 females) were enrolled in the current study. Twenty-nine of them were tested at Odense University Hospital (OUH), Odense, Denmark, while the remaining 31 were tested at Bispebjerg Hospital (BBH), Copenhagen, Denmark. All participants had bilateral, symmetrical sensorineural hearing losses and had used their HA devices for at least 9 months. The range of hearing loss configurations was generally in between the N1 and N4 standard audiograms (Bisgaard et al., 2010). The air-bone gap and interaural asymmetry were required to be maximally 15 dB at each audiometric frequency from 0.5 to 4 kHz. None of the participants had a history of any neurological or language disorders. All of them had self-reported normal or corrected-to-normal vision.
Prior to the current study, all participants completed a comprehensive auditory test battery (Sanchez-Lopez, Nielsen, et al., 2019). Based on these measurements, a data-driven statistical analysis was used to divide them into one of four subgroups or auditory profiles labelled A, B, C, or D (Sanchez-Lopez, Fereczkowski, et al., 2019). Eleven of the participants tested here could not be clearly assigned to any of these profiles. They were therefore excluded from all further analyses. The distribution of the remaining 49 participants was as follows: A (N = 12), B (N = 10), C (N = 19), and D (N = 8). Table 1 provides a summary of the overall relative performance on a range of auditory tasks for each of these groups. Listeners from Profile A showed good performance throughout, while listeners from Profile C showed consistently poor performance. Listeners from Profile B had good low-frequency audiometric thresholds but performed relatively poorly on most other tests. Last, listeners from Profile D showed good performance in terms of binaural processing and speech perception, average performance in terms of spectrotemporal resolution, and abnormal loudness perception. Figure 1 shows individual and profile-specific average audiograms. On average, listeners from Profiles A and B had better hearing thresholds in the low frequencies, and listeners from Profiles B and C had poorer thresholds in the high frequencies. Listeners from Profile B tended to have steeply sloping high-frequency hearing losses.
Overall Relative Outcome on the Main Measures From the BEAR Test Battery.

LF = low frequencies; HF = high frequencies; ☺ = good (or close-to-normal) outcome;  = average (or somewhat abnormal) outcome; ☹ = poor (or clearly abnormal) outcome.

Audiograms of the 49 Participants (Thin Gray Lines). The thick lines correspond to the average configurations of the different auditory profiles (see legend).
Test Setup
The measurements were performed in an anechoic chamber (OUH) or a soundproof booth (BBH). Audio playback was via an RME Fireface UC soundcard, an SPL Phonitor Mini Amplifier, and a pair of Sennheiser HDA200 headphones. All stimuli were generated with the help of a HA simulator implemented in MATLAB (Sanchez-Lopez et al., 2018).
Stimuli
For the target speech, DANTALE-II sentences spoken by a female native Danish speaker (Wagener et al., 2003) were used. The target speech was always presented from 0° for the baseline SRT50 measurements (see later). For the subsequent speech recognition scores and the subjective ratings, the target speech was presented either from in front (0°) or the side of the ‘better’ ear (90°). The better ear was defined as the one with the best speech reception threshold (SRT) according to the unaided Hearing in Noise Test (Nielsen & Dau, 2011) that was performed as part of the aforementioned test battery measurements.
To reflect a typical challenging speech-in-noise scenario, two signals were used to simulate a noisy canteen environment. First, the International Speech Test Signal (Holube et al., 2010) was used as a directional distractor from either 90° (target speech from 0°) or 0° (target speech from 90°). The other signal was a spatially diffuse cafeteria noise, which was recorded in a busy university canteen with a pair of HA satellites placed on a dummy-head (Brüel & Kjær Head and Torso Simulator Type 4128-C). The diffuse cafeteria noise was presented at a nominal sound pressure level (SPL) of 65 dB, and the distractor was presented at +2 dB SNR relative to that noise signal. To simplify the test setup, the speech-in-noise signals were precreated at SNRs of –4 to +14 dB in 2-dB steps and then saved as .wav files on the computer.
HA Simulator and HA Processing Strategies
The HA simulator included directional processing (omnidirectional, fixed cardioid, or fixed binaural beamformer setting), noise reduction (maximal attenuation of 0, 5, or 15 dB for ‘off,’ ‘mild,’ and ‘strong,’ respectively), and amplitude compression (attack times of 5 or 250 ms and release times of 10 or 1,250 ms for ‘fast’ and ‘slow’ settings, respectively). The input signals were created using the canteen recording made with the two HA satellites on the dummy-head (see earlier). The same test setup was used to record impulse responses in the empty canteen with loudspeakers positioned at azimuth angles of 0° or 90°. The impulse responses were convolved with the speech and international speech test signals and then mixed with the canteen noise. The stimuli created in this manner were passed through the directional processing stage followed by the noise reduction stage and then the amplitude compression stage. Fully occluding HA fittings were simulated (i.e., there was no direct sound path). The output signals had a sampling frequency of 32 kHz and were played back via headphones (see earlier).
The directional microphone settings were obtained based on impulse responses measured at each of the four HA microphones, with an array of loudspeakers situated in the horizontal plane spaced apart by 5°. A linear filter was designed for each microphone pair (front, rear) and optimized in a least-square sense with respect to a predefined beam pattern. To obtain the cardioid setting, unilateral beamforming was applied above 1 kHz; at lower frequencies, the front microphone signal was used. For the binaural beamformer setting, the signals from all four HA microphones were processed in a similar fashion, resulting in a diotic output signal. To reintroduce some interaural differences and thus improve the spatial sound quality, this signal (85%) was mixed with the original signals from the left and right front microphones (15%).
The noise reduction stage was based on an algorithm described by Boldt et al. (2008). From the two microphone signals of each HA satellite, two first-order differential arrays (cardioids) pointing toward the front or back were created. By comparing the power spectral density estimates of the two output signals in each time-frequency frame, a binary mask was created that determined if a given time-frequency tile contained mainly energy from the front (signal of interest) or the back (noise). This time-frequency mask was then converted into binary gain values that attenuated noise-dominated time-frequency tiles.
The amplitude compression stage consisted of a 15-band filter bank (0.1–10 kHz), a percentile estimator, and a nonlinear amplifier. When compression was applied, the signal envelope in each frequency band was estimated and passed through the percentile estimator. The percentile estimator effectively controlled the time constants of the compressor and calculated the desired gain. The amplifier’s gain function was a broken-stick nonlinearity with a single kneepoint used to set the insertion gain for conversational speech (65 dB SPL). The upper and lower slopes of the function were calculated to match the target gains for soft (50 dB SPL) and loud (80 dB SPL) speech targets. The compressed output signal was obtained by adding the 15 subband signals (Hau & Andersen, 2012; Kates, 2005).
For each listener, nonlinear gains according to the ‘National Acoustic Laboratories – Nonlinear 2’ (NAL-NL2) prescription rule (Keidser et al., 2011) were set. Six HA processing strategies (see Table 2) were evaluated. HA1 corresponded to slow amplitude compression with no advanced features activated. HA1 therefore introduced essentially no distortions into the input signal and did not lead to any SNR improvement either. HA6 was chosen to resemble a common ‘on-the-market’ HA fitting, with relatively conservative advanced feature settings to ensure good sound quality. The other four HA processing strategies were characterized by aggressive feature settings to maximize potential differences among them. HA5 (with the binaural beamformer, strong noise reduction, and fast-acting compression) was the most aggressive setting and caused clear spectral and temporal distortions. Compared with HA1, HA3-5 all produced an SNR improvement when the target signal was at 0° and an SNR reduction when the target speech came from 90°. For further details about the HA simulator, the applied processing, and its acoustical effects, the reader is referred to Sanchez-Lopez et al. (2018).
Overview of the Six Tested HA Processing Strategies and Their Primary Acoustical Effects in the 0° and 90° Target Direction.

DIR = directional processing; Omni = omnidirectional; Bin. BF = binaural beamformer; NR = noise reduction; AC = amplitude compression; Signal distortion = overall degree of temporal and spectral distortion; ☹ = clear SNR improvement/little signal distortion; = some SNR improvement/signal distortion; ☹ = little SNR improvement/clear signal distortion.
Procedure
Each participant attended two visits. At the first visit, aided SRT50 measurements were performed using an adaptive 1-up 1-down procedure for the target speech. The nominal starting level was 71 dB SPL. A step size of 4 dB was used for the first five trials and 2 dB for the remaining ones. Sentence scoring was applied, and the SRT50 was estimated by averaging the SNRs corresponding to the last 15 trials. All stimuli were linearly amplified according to individual NAL-NL2 prescription gains calculated for an input level of 65 dB SPL.
For all subsequent measurements, the SNR of the stimuli was based on the individual participant’s SRT50. The speech recognition scores were collected at input SNRs corresponding to the participants’ individual aided SRT50 measurements rounded up to the nearest SNR at which the speech-in-noise signals had been precreated (see Stimuli section). In the following, we will refer to this rounded aided SRT50 as the ‘test SNR.’ The subjective ratings were collected at the test SNR + 4 dB to increase the intelligibility of the target speech.
During the speech recognition task, the participants were asked to repeat the sentences they heard, and each sentence was scored as correct or incorrect. The speech recognition measurements were repeated at the second visit. In addition, subjective ratings of overall quality and noise annoyance were collected. A multistimulus comparison method with a hidden anchor (‘MUSHRA’) was implemented using the SenseLabOnline software (SenseLab, 2017) for that purpose. On a given trial, the participants were presented with a graphical user interface containing seven playback buttons and sliders (corresponding to 6 HA settings + 1 anchor stimulus). The anchor represented a poorly sounding HA setting. The stimulus was input into the HA at a lower SNR and also distorted using a binary mask processing algorithm (Li & Loizou, 2008) into which signal estimation errors were artificially introduced. In this manner, a poor-quality stimulus with undesired spectrotemporal distortions was obtained. When pressing the playback buttons, a 15-s sequence of the same speech-in-noise environment as the one used in the speech recognition test was played back in a loop. The participants were then asked to compare the seven stimuli and rate them on a scale from 0 to 100. The scale was visually labelled as follows: Excellent (100–80), Good (80–60), Neutral (60–40), Bad (40–20), and Terrible (20–0). Thus, for both attributes (overall quality and noise annoyance), a higher rating corresponded to a more positive outcome (i.e., better sound quality or less noise annoyance). Each stimulus was rated four times per spatial condition and attribute. For the participants tested at OUH, the overall subjective ratings were collected at the first visit and the noise annoyance ratings at the second visit. The opposite order was used at BBH.
Preprocessing of the Collected Data and Statistical Analyses
To assess the reliability of the speech recognition scores, median absolute deviations between the test and retest data were calculated. Test–retest differences exceeding ±2 median absolute deviations were considered unreliable (Leys et al., 2013). In such cases, the lower score of the two available measurements was excluded from all further analyses. Otherwise, the average of the two measurements was used. The subjective ratings were analyzed using the eGauge method (ITU-R, 2014) to identify and exclude unreliable assessors. Following this analysis, the data included 44 participants (A = 11, B = 8, C = 17, D = 8) for overall quality and 42 participants (A = 11, B = 9, C = 15, D = 7) for noise annoyance. Because each HA processing strategy was rated four times per spatial condition, the median of the four ratings was used for all further analyses.
For the speech recognition data in the 90° condition, strong floor effects in the speech scores obtained with HA4 and HA5 (37.2% of the scores were equal to 0% correct performance) were observed. Therefore, these data were excluded from all subsequent analyses, and each spatial condition was analyzed separately in the case of the speech recognition scores.
To assess the effects of the auditory profiles on the different HA outcomes, the data were analyzed using linear mixed-effects models as implemented in R using the lme4 package (Bates et al., 2014). HA1 was set as the reference HA. For the speech recognition scores, the dependent variable was the mean of the test and retest per test condition. The model for each spatial condition (spa) included HA, auditory profile (AuP), and the interactions HA × Test SNR and HA × AuP. Participants were included as random intercepts. For the subjective ratings, the dependent variable was the median rating per test condition for each HA. The model included three main effects (HA, spa, AuP), five two-way interactions (HA × Spa, HA × AuP, AuP × Spa, HA × Test SNR, Spa × Test SNR), and one three-way interaction (HA × Spa × AuP). Participants were, again, included as random intercepts.
The statistical models were built based on a priori considerations combined with a forward stepwise approach. More precisely, in the speech recognition models, the HA × Test SNR interaction was added to a full-factorial model based on HA and AuP because it was expected that the test SNR would have a clear effect on the HA processing (in particular, the AC and NR). Additional interactions were not included because they did not improve the model diagnostics. Similarly, for the subjective ratings, HA × Test SNR and Spa × Test SNR were added to a full-factorial model based on HA, AuP, and spa, whereas all other interactions were excluded.
Results
Effects of Auditory Profiles on Aided SRT50
Figure 2 shows the results of the aided SRT50 measurements for the four auditory profiles. On average, Profile A had the lowest aided SRT50 (mean = –0.7 dB SNR, SD = 1.2 dB SNR), while Profile C had the highest (mean = 5.4 dB SNR, SD = 3.7 dB SNR). A one-way analysis of variance showed a significant effect of auditory profile on the SRT50, F(3, 45) = 14.39, p < .001. According to a series of independent t-tests, Profile B (mean = 3.2 dB SNR, SD = 2.4 dB SNR) and Profile C differed significantly from Profile A and Profile D (mean = 0.6 dB SNR, SD = 1.2 dB SNR), respectively.

Boxplots of the Aided SRT50 Data for the Four Auditory Profiles. *p <.05; ***p < .001; ****p < .0001. Data points marked in grey with a bold outline represent eight participants (A = 4, B = 1, C = 3) with similar audiograms and thus similar gain prescriptions (less than 5 dB difference in gain across frequencies).
Recall that for the SRT50 measurements the stimuli were amplified according to individual linear gain prescriptions (see Procedure section). There were four Profile-A listeners, one Profile-B listener and three Profile-C listeners who had similar audiograms and who therefore received similar gain prescriptions (i.e., within 5 dB across audiometric frequencies of each other). In Figure 2, the SRT50 measurements of these eight listeners are highlighted using thick circles. Broadly speaking, the differences between these thresholds resemble the variability apparent for the whole group of participants, with the three Profile-C listeners showing greater interindividual differences than the four Profile-A listeners.
Effects of Auditory Profiles on HA Outcomes
Speech Recognition
Figure 3 shows mean speech recognition scores for each spatial condition, HA setting, and auditory profile. In the 0° condition with HA1, the mean scores were higher than 50% (and thus elevated relative to the aided SRT50 measurements obtained with similar HA processing) because the individual aided SRT50’s had been rounded up to the nearest SNR at which the speech-in-noise signals had been precreated (see Procedure section).
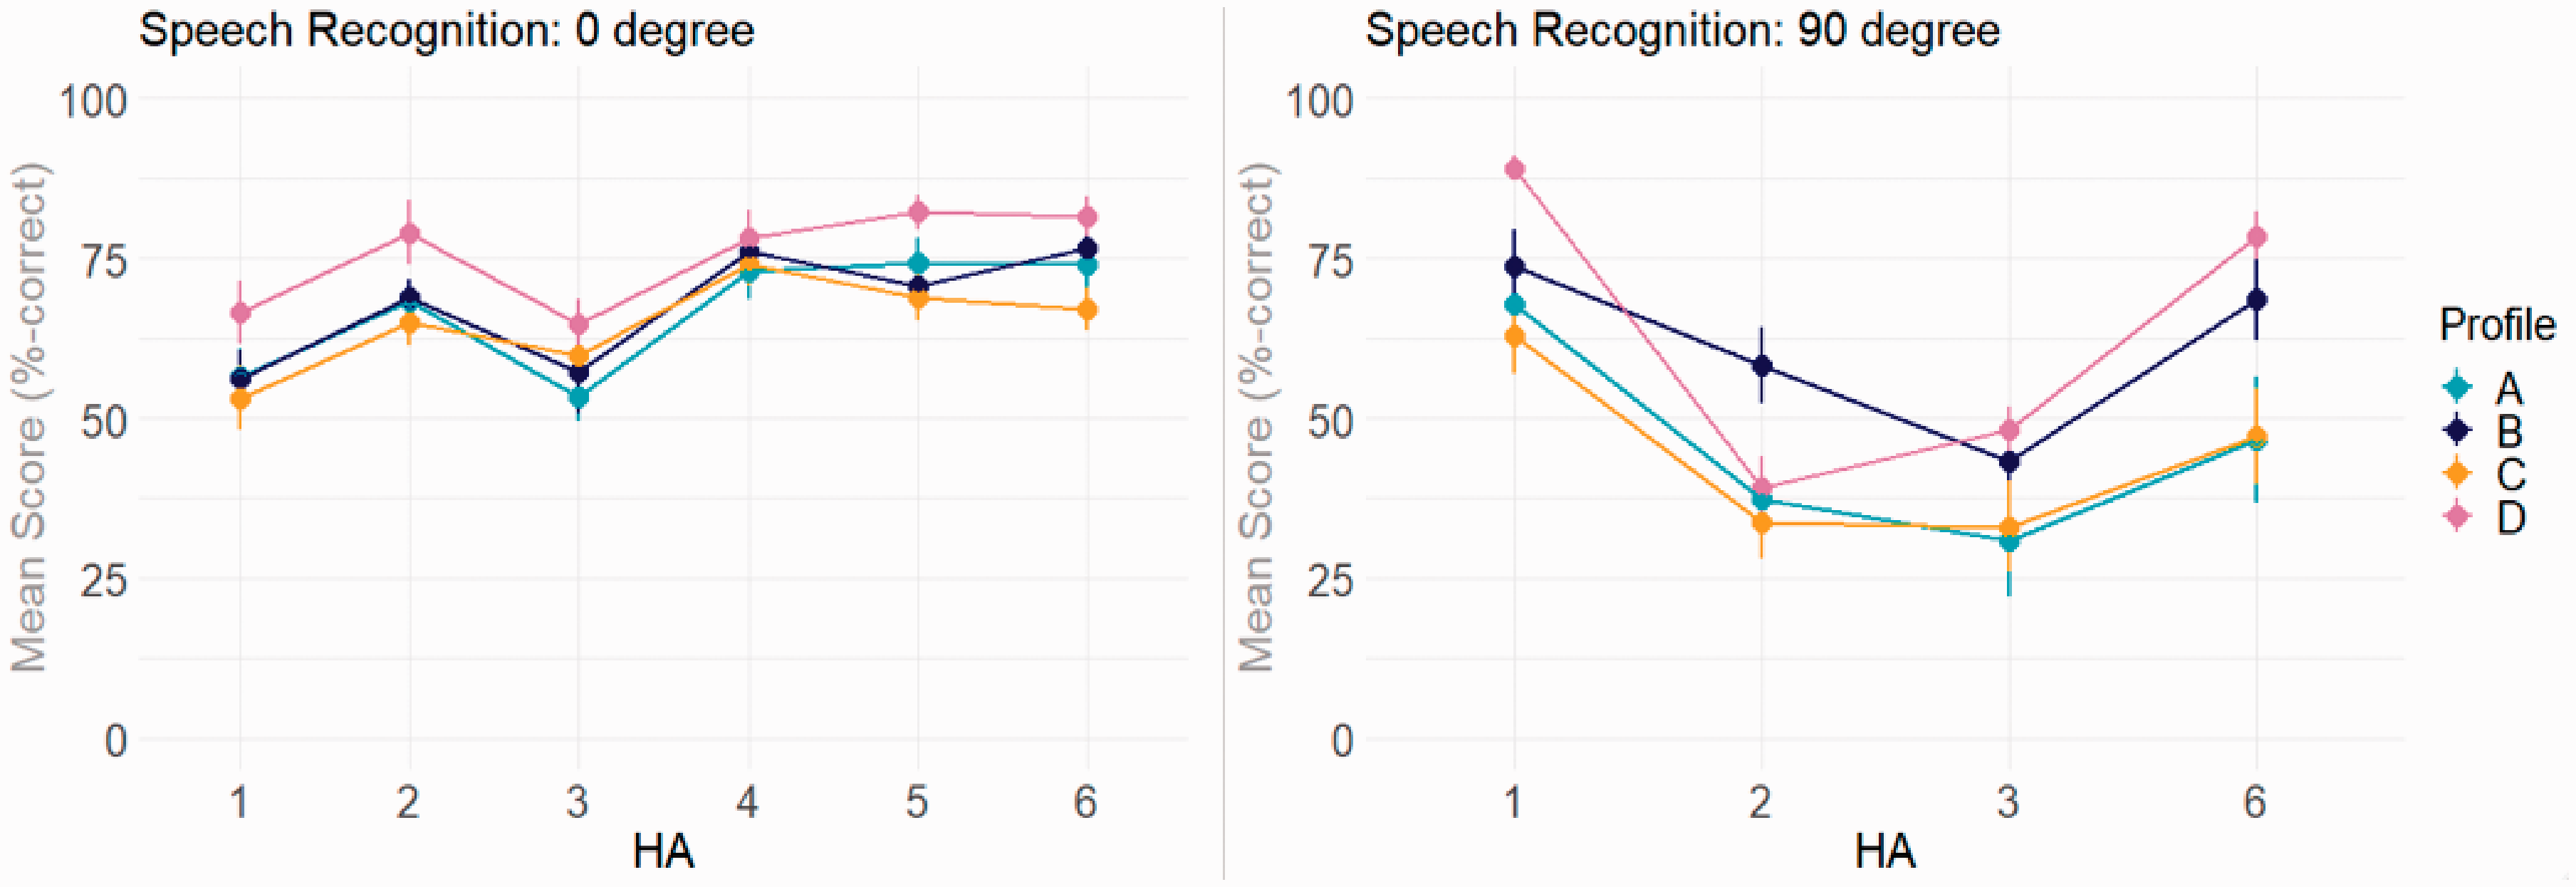
Mean Speech Recognition Scores for the Tested HA Settings and Auditory Profiles. Left: target at 0° and distractor at 90°. Right: target at 90° and distractor at 0°. In the 90° condition, HA4 and HA5 were excluded because of strong flooring effects. Error bars show ±1 standard error of the mean.
For both spatial conditions, there were significant effects of HA, 0° spa: F(5, 219.1) = 32.8, p < .001; 90° spa: F(3, 129.4) = 83.3, p < .001; AuP, 0° spa: F(3, 44.03) = 4.01, p = 0.01; 90° spa: F(3, 44.06) = 4.09, p = 0.01; and HA × Test SNR, 0° spa: F(6, 130.3) = 3.8, p = 0.001; 90° spa: F(4, 86.4) = 4.3, p = 0.003. Moreover, there was a significant interaction between HA and AuP, but only in the 90° condition, F(9, 129.4) = 4.4, p < .001.
To investigate this interaction further, post hoc pairwise comparisons were performed using Tukey’s honestly significant difference tests. For Profile-A and -C listeners, HA1 resulted in the best performance. In comparison, Profile-B and -D listeners achieved the best performance with HA1 and HA6. Thus, the four profiles shared the HA setting that resulted in the highest speech scores (HA1). In contrast, they differed in terms of the HA setting(s) that resulted in the lowest scores. For Profile-A listeners, HA2, HA3, and HA6 resulted in similarly low scores (all p > .05). Profile-B and -C listeners obtained the lowest scores with HA3, which resulted in significantly lower scores than HA6 (all p < .01) but not HA2 (all p > .05). For Profile-D listeners, HA2 and HA3 resulted in significantly lower scores than HA6 (all p ≤ .001).
Subjective Ratings
Figure 4 shows mean overall quality (left panel) and noise annoyance (right panel) ratings for the two spatial conditions. The HA settings with strong noise reduction (HA2, HA4, and HA5) resulted in low ratings in the 90° condition, whereas the HA settings with some degree of microphone directionality and slow-acting compression (HA3, HA4, and HA6) had high ratings in the 0° condition. In the 0° condition for noise annoyance, Profile-A listeners rated HA3 highest, while the other profiles did so with HA4. Otherwise, the HA setting with the highest ratings was similar for the four profiles.

Mean Overall Quality and Noise Annoyance Ratings and ±1 Standard Errors of the Mean for the Tested HA Settings and Auditory Profiles. Left: target at 0° and distractor at 90°. Right: target at 90° and distractor at 0°.
For overall quality, there were significant effects of HA, F(5, 434) = 23.4, p < .001; spa, F(1, 434) = 115.6, p < .001; HA × Spa, F(5, 434) = 37.3, p < .001; and HA × Test SNR, F(5, 434) = 5.7, p < .001. There were no significant effects of AuP, neither on its own nor in conjunction with HA. In other words, the four auditory profiles resembled each other in terms of their overall quality ratings.
For noise annoyance, there were significant effects of HA, F(5, 424) = 11.2, p < .001; spa, F(1, 424) = 48.2, p < .001; HA × Spa, F(5, 424) = 24.1, p < .001; and HA × Test SNR, F(6, 424) = 6.9, p < .001. A significant interaction between HA × AuP was also found, F(15, 424) = 1.9, p = .02. Post hoc pairwise comparisons based on a Tukey’s honestly significant difference tests were run to assess whether the four profiles differed in terms of the HA setting with the highest rating, after averaging the ratings across the two spatial conditions. The results revealed that Profile-A listeners rated HA3 higher than HA2 (p < .0001), HA4 (p < .05), and HA5 (p < .0001), particularly so in the 0° condition (see Figure 4). In general, Profile-A listeners rated the HA settings with strong noise reduction and fast-acting compression (HA2, HA5) lowest and the HA settings with deactivated/mild noise reduction and slow-acting compression (HA1, HA3, HA6; all p < .001) highest. In contrast, Profile-D listeners showed similar preferences for HA1, HA3, and HA6, which they rated higher than HA2 (all p < .05). For Profile-B and -C listeners, the ratings for all HA settings were comparable.
Overall, the noise annoyance ratings were strongly influenced by the effects of spatial condition and the HA × Spa interaction. The HA × AuP interaction had a relatively small influence on these results. Except for Profile-A listeners who rated HA3 highest, there were no differences among the profiles at the high outcome end.
Discussion
Auditory Profiles and Aided SRT50
The current study found clear differences among the four auditory profiles in terms of their mean aided SRT50 data. Even though the profiles were derived based on a test battery that included speech-in-noise measurements, these measurements were performed under unaided conditions, in the presence of stationary speech-shaped noise, and with the Danish Hearing in Noise Test sentences. In other words, there were several important differences between the speech-in-noise data collected for the profiling work and the speech-in-noise data collected for the current study.
While simple linear amplification enabled Profile-A and -D listeners to achieve SRTs of around 0 dB SNR, the same was not true for Profile-B and -C listeners who had clearly elevated thresholds. Interestingly, a subset of Profile-A, -B, and -C participants selected for their similar audiograms and thus gain prescriptions showed an aided SRT50 pattern that was similar to that of the whole group of participants. Overall, this suggests that these differences were, to a large extent, driven by differences in suprathreshold hearing abilities. Moreover, it suggests that audiogram-based HA treatment is not sufficient to address the hearing deficits of Profile-B and -C listeners, as they are in need of (extra) SNR improvement.
Auditory Profiles and HA Processing Strategies
It was initially hypothesized that the physical effects of the tested HA processing strategies would lead to different perceptual outcomes among the four auditory profiles. However, the current study found only few such interactions. In general, the four profiles were similar to each other in terms of the HA settings that led to the best outcomes. The only exception to this was the noise annoyance ratings, which showed that Profile-A listeners rated HA3 highest, whereas the other profiles did not. This could suggest that Profile-A listeners are sensitive to, and thus intolerant toward, signal distortions caused by strong noise reduction and fast-acting compression, whereas the other profiles are not. At the low HA outcome end, some additional differences among the profiles were observed, which in principle might be used to avoid further HA disbenefit. That is, in situations where the target speech comes from the side, Profile-B listeners should not be treated with HA3 (binaural beamformer, NR off, slow AC), while HA2 (omni, strong NR, fast AC) should be avoided for Profile-D listeners. For Profile-A and -C listeners, these two HA settings led to equally poor outcomes.
One possible reason for the shortage of clear interactions at the high outcome end could be that the chosen HA settings were unable to elicit differences among the profiles because they were too aggressive, as also indicated by the flooring effect in the speech recognition scores for the 90° condition. Alternatively, given that hearing-impaired listeners are generally less sensitive to signal distortions than normal-hearing listeners (Brons et al., 2014), the tested HA settings could have been not aggressive enough. More research into profile-based HA settings would therefore be needed to establish links between HA processing strategies and specific hearing abilities.
Another explanation could be that the gain prescription was limited to NAL-NL2 in all conditions. Apart from advanced HA features, the amplification rationale can also affect aided speech perception (Valente et al., 2018). Previous research has suggested that benefit from HA amplification varies with the shape of the audiogram (Keidser & Grant, 2001). Given that the auditory profiles differ, among other things, in terms of their audiometric configurations, it is possible that their aided speech perception would change if another rationale was used for the gain prescription. In other words, the observable differences in aided SRT50 (Figure 2) might vary with the fitting rationale. Whether there is a differential effect of the amplification rationale on the auditory profiles is a topic for further investigation.
The current study applied only one type of background noise (spatially diffuse canteen noise with the international speech test signal as directional distractor). As is apparent from Table 1, the four profiles differ in terms of several psychoacoustic abilities, including their binaural and temporal processing abilities. These abilities can play a role in temporal masking release (e.g., George et al., 2006; Moore, 2008) and spatial masking release (Neher et al., 2009, 2012). It is possible that the use of a scenario with multiple intelligible, spatially distributed talkers or a more modulated background noise signal would elicit more pronounced differences among the profiles and their response to different HA settings. It is also possible that the inclusion of other psychoacoustic (e.g., binaural loudness summation; Oetting et al., 2016) or cognitive (e.g., Foo et al., 2007; Gatehouse et al., 2006; Lunner & Sundewall-Thorén, 2007) measures in the test battery would change the results. Among other things, such additional measurements could help shed some light on Profile-D listeners who in spite of relatively poor low-frequency hearing thresholds show rather good binaural hearing abilities (see Table 1).
Applying auditory profiling as the basis for HA personalization implicitly assumes that such profiles are stable across time. Recent work related to preference for noise reduction processing suggests that this could be so (Neher & Wagener, 2016). Nevertheless, audiometric sensitivity and suprathreshold hearing abilities worsen with higher age (Moore, 2020). Future research should therefore investigate the long-term stability of the auditory profiles.
Conclusions
The current study investigated potential interactions between four distinct auditory profiles and response to six HA processing strategies in a simulated speech-in-noise environment. The perceptual evaluation included speech recognition measurements and subjective ratings of overall quality and noise annoyance. In general, the auditory profiles had little effect on the perceptual outcomes with the six HA processing strategies. This could have been due to the selected HA processing strategies, the chosen noise scenario, or other factors. Nevertheless, the auditory profiles differed clearly in terms of their aided SRT50 results, indicating different needs in terms of SNR improvement in HA signal processing. This suggests that profile-based compensation strategies involving more personalized HA feature settings may enable better hearing rehabilitation. How these findings translate to wearable hearing devices and daily-life environments remains to be investigated in future research.
Footnotes
Author’s Note
Mouhamad El- Haj-Ali is now affiliated with Interacoustics A/S, Audiometer Allé 1, Middelfart, Denmark.
Michal Fereczkowski is also affiliated with Institute of Clinical Research, Faculty of Health Sciences, University of Southern Denmark, Odense, Denmark and Research Unit for Oto-Rhino-Laryngology, Odense University Hospital, Odense, Denmark.
Acknowledgments
The funding and collaboration of all partners is sincerely acknowledged. The authors thank Rikke Skovhøj Sørensen (Technical University of Denmark) and Christer P. Volk (SenseLabOnline, FORCE Technology) for their support. The authors also thank the participants and student helpers of this study.
Declaration of Conflicting Interests
The authors declared no potential conflicts of interest with respect to the research, authorship, and/or publication of this article.
Funding
The authors disclosed receipt of the following financial support for the research, authorship, and/or publication of this article: This work was supported by Innovation Fund Denmark Grand Solutions 5164-00011B (BEAR project).