
Abstract
Many listeners with sensorineural hearing loss have uneven hearing sensitivity across frequencies. This study addressed whether this uneven hearing loss leads to a biasing of attention to different frequency regions. Normal-hearing (NH) and hearing-impaired (HI) listeners performed a pattern discrimination task at two distant center frequencies (CFs): 750 and 3500 Hz. The patterns were sequences of pure tones in which each successive tonal element was randomly selected from one of two possible frequencies surrounding a CF. The stimuli were presented at equal sensation levels to ensure equal audibility. In addition, the frequency separation of the tonal elements within a pattern was adjusted for each listener so that equal pattern discrimination performance was obtained for each CF in quiet. After these adjustments, the pattern discrimination task was performed under conditions in which independent patterns were presented at both CFs simultaneously. The listeners were instructed to attend to the low or high CF before the stimulus (assessing selective attention to frequency with instruction) or after the stimulus (divided attention, assessing inherent frequency biases). NH listeners demonstrated approximately equal performance decrements (re: quiet) between the two CFs. HI listeners demonstrated much larger performance decrements at the 3500 Hz CF than at the 750 Hz CF in combined-presentation conditions for both selective and divided attention conditions, indicating a low-frequency attentional bias that is apparently not under subject control. Surprisingly, the magnitude of this frequency bias was not related to the degree of asymmetry in thresholds at the two CFs.
Sensorineural hearing loss, characterized by elevated auditory thresholds, has been shown to lead to loudness recruitment (e.g., Buus & Florentine, 2001), reduced frequency selectivity (e.g., Kidd et al., 1984; Moore & Glasberg, 1986; Tyler et al., 1983), poor frequency discrimination (e.g., Moore & Peters, 1992; Nelson & Freyman, 1986), and reduced temporal resolution (e.g., Fitzgibbons & Wightman, 1982; Nelson & Freyman, 1987) as compared to listeners with normal-hearing (NH). In terms of audiometric configuration, audiometric thresholds typically are more elevated at higher frequencies than at lower frequencies in most listeners with hearing loss (Davis, 1989). When considering the perceptual consequences of these threshold differences across frequency, a persistent question is whether higher thresholds in a particular frequency region result in a change in how listeners make use of the information that is distributed across the frequency spectrum. That is, as a result of long-standing high-frequency hearing loss, will a listener learn to rely less on or attend less to high-frequency information than to low-frequency information? This could be the case even if the listener is a regular wearer of hearing aids. Amplification compensates to some extent for reduced audibility and loudness recruitment but cannot fully restore the stimulus fidelity compromised by the other degradations that are concomitant with sensorineural hearing loss (e.g., poorer frequency and temporal resolution). Thus, despite the benefits provided by amplification, the acoustic information may still be degraded and/or unreliable for the hearing aid user. Alternatively, equal audibility may be sufficient to mitigate the development of cross-frequency bias or the listener may even learn to rely more on/attend more to the high frequency information in order to extract as much information as possible. The question of interest in this study is whether long-term degradations concomitant with sensorineural hearing loss result in a change in how hearing-impaired (HI) listeners attend to cross-frequency information compared to NH listeners. We hypothesize that greater hearing loss in certain frequency regions results in reduced attention to auditory information in those regions relative to regions with better hearing. In contrast, NH listeners—who have NH across the frequency range—distribute attention more evenly across all frequency regions.
The idea that the use of cross-frequency information may differ in NH and HI listeners is not new. One approach to characterizing how listeners make use of information in different frequency regions is to measure perceptual weights with a procedure that relates trial by trial responses to random perturbations in some aspect of the stimulus (e.g., Berg, 1989; Lutfi, 1995; Richards & Zhu, 1994). Several previous studies have examined how HI listeners weight frequency information compared to NH listeners using stimuli that were multitone complexes with widely spaced frequency components (Doherty & Lutfi, 1996, 1999; Jesteadt et al., 2014; Lentz & Leek, 2003). In that approach, random level perturbations are applied to each frequency component independently from trial to trial. Post hoc analyses regress the responses of the subject to the relative levels of the frequency components on a presentation by presentation basis. This analysis yields correlation coefficients that are assumed to reflect the weight the listener gives to each individual component. Thus, this approach may reveal differences in the pattern of weights across frequency due to hearing loss. Lentz and Leek (2003) reported that HI listeners appeared to rely less on the spectral components in the center of the multitone complex than on the spectral components at the edge of the complex when compared to NH listeners. However, on average, the HI group and the NH group exhibited similar overall weighting efficiency (i.e., degree to which the weights were optimal). Doherty and Lutfi (1996, 1999) reported that HI listeners placed greater weight in the frequencies around 4 kHz—corresponding to regions of greater hearing loss—than did NH listeners. However, it has been suggested that this latter result may have been influenced by the higher overall presentation levels used for the HI subjects (Jesteadt et al., 2014; Leibold et al., 2009).
A similar correlational approach measuring frequency weights has been applied to speech stimuli. These studies measured speech identification in noise when the signal-to-noise ratios were randomly varied from trial to trial across frequency bands (Calandruccio et al., 2016; Calandruccio & Doherty, 2008) or when additional noise was applied randomly in preselected spectro-temporal regions of the stimulus (Varnet et al., 2019). Calandruccio and Doherty (2008) reported that HI listeners placed greater weight on the highest frequency band of speech than did NH listeners. However, in a follow-up study, Calandruccio et al. (2016) found that NH weights matched those of HI when they were presented with higher-level stimuli, suggesting that the group differences were due to presentation level differences. In contrast, Varnet et al. (2019) reported that HI listeners with high-frequency hearing loss placed slightly less relative weight on the high-frequency versus the low-frequency information as compared to the NH listeners.
Another approach to examining whether hearing loss alters the way that information is used in different parts of the spectrum measured listeners’ identification of filtered speech. Although studies employing these methods did not measure spectral weights or frequency-directed attention, they did indicate how well listeners made use of audible speech cues across the frequency range of speech. Typically, these studies employed speech tokens that were low-pass filtered over a range of cutoff frequencies and were presented in quiet (Ching et al., 1998; Dubno et al.,1989; Hogan & Turner, 1998) and/or in noise (Horwitz et al., 2008; Turner & Henry, 2002). Performance predictions were made based on a function relating the speech intelligibility index (SII; ANSI, 1997; see also French & Steinberg, 1947, for a description of the related articulation index)—which considers the importance of different frequency bands for speech intelligibility and the audibility within these bands—to recognition scores for NH listeners. In some studies, poorer-than-predicted benefit of the high frequencies for speech recognition—and even decreases in speech recognition with increasing audible bandwidth—have been observed for HI listeners who exhibited greater than a moderate high-frequency hearing loss (Ching et al., 1998; Hogan & Turner, 1998). However, again, the interpretation of these results is qualified by evidence suggesting that the results may have been influenced by other factors. Specifically, other investigators have found that instances of reduced or negative benefits with increasing audible bandwidth may have been related to the presence of cochlear dead regions (Baer et al., 2002; Vickers et al., 2001). Still other studies have shown that HI listeners demonstrated continued improvement with the addition of high frequencies in noise (Horwitz et al., 2008; Turner & Henry, 2002) and in quiet as long as individualized gain was applied to the stimuli (Horwitz et al., 2008). This latter finding indicates that some HI listeners can take advantage of high-frequency information in frequency regions where hearing loss is most pronounced. Furthermore, even in the absence of dead regions and with SII-based predictions that consider differences in audibility, other peripheral effects of hearing loss—such as poorer frequency and temporal resolution—are not easily accounted for in speech experiments and may influence the results.
Overall, regarding the question of whether HI listeners make use of information across the spectrum differently than NH listeners, the results from these studies (perceptual weights for nonspeech and speech stimuli and intelligibility of filtered speech) must be considered equivocal and, in some cases, even contradictory. There is some evidence from the perceptual weighting paradigm that HI listeners place greater weight on the regions of hearing loss (high frequencies) than NH listeners, but there remains other evidence that suggests the opposite. Furthermore, there is evidence from the speech filtering studies suggesting that HI listeners make less efficient use of high-frequency information than do NH listeners. In all cases, however, these conclusions are tempered by potential stimulus confounds due to the difficulty in controlling for the differences in audibility and stimulus resolution between the NH and HI groups.
The two classes of studies just discussed, for the most part, examined weighting or use of spectral information for complex signals in which the constituent elements presumably were perceptually grouped together. Inferences were drawn about the contributions of individual elements to the overall perception of the stimulus. However, those approaches were not designed to examine, in a controlled way, how listeners deploy attention when independent auditory information is presented concurrently in different frequency regions. Although the findings of those studies possibly support the idea that hearing loss alters, in some manner, the perception/weighting of information in different frequency regions, they do not provide a satisfactory answer to the question of whether HI listeners exhibit a consistent bias—independent of any possible peripheral degradation of the stimulus—in the attention to information in regions of NH versus hearing loss.
Another class of studies has used a different approach that is grounded in masking and, in particular, informational masking (IM; see Kidd et al., 2008, for a review). In that approach, the ability of NH and HI listeners to selectively attend to content in one frequency region, while ignoring masking content at other frequencies, is examined (e.g., Alexander & Lutfi, 2004; de Laat & Plomp, 1985; Grose & Hall, 1996; Kidd et al., 2001; Micheyl et al., 2000; Roverud et al., 2016). Typically, these studies aim to rule out, or account for, the contributions of peripheral factors to the observed masking effects. As a result, NH and HI listeners may be compared in terms of their susceptibility to IM. IM is thought to occur despite a representation of the stimulus in the auditory periphery that is sufficient to solve the task and thus is due to limitations on processing at higher levels of the auditory system such as listener uncertainty (e.g., Durlach et al., 2003; Kidd et al., 2002; Watson, 2005). IM usually is contrasted with energetic masking, which is due to competition for neural representations at the peripheral stages of the auditory system (e.g., on the basilar membrane or in the auditory nerve).
Two relevant IM studies that employed a selective attention paradigm—de Laat and Plomp (1985) and Grose and Hall (1996)—used three simultaneously presented melodies composed of sequences of pure tones presented in different frequency regions. The listeners were instructed to selectively attend to the center frequency (CF) region and perform a melody discrimination task. The results indicated that the HI group required a much wider frequency separation of the melodies than the NH group to achieve the same level of performance. However, within the HI group, frequency separation was not correlated with degree of hearing loss or with estimates of frequency selectivity. The authors concluded that the HI group experienced more difficulty with selective attention, but that this was not as a result of any peripheral consequences of hearing loss.
In other IM studies, NH and HI listeners detected a target tone or sequences of tones in the presence of simultaneous multitone maskers (Alexander & Lutfi, 2004; Kidd et al., 2001; Micheyl et al., 2000). Whereas the results from Kidd et al. (2001) indicated reduced selective attention in HI listeners compared to NH listeners not accounted for by peripheral factors, Micheyl et al. (2000) found no difference between the groups in terms of susceptibility to IM. More in line with the findings of Micheyl et al. (2000), Alexander and Lutfi (2004) reported differences between NH and HI groups that were attributed to peripheral stimulus factors rather than to differences in IM.
Although some of the IM studies just described found evidence that HI listeners exhibit deficits in selective listening along the frequency dimension, only one target frequency was examined, and the target frequency used did not appear to be selected to correspond to a region of greater hearing loss in the HI group. Thus, it was not possible to compare listeners’ ability to selectively attend to different frequency regions corresponding to more and less severe hearing loss, a procedure that may have revealed biases across frequency. Furthermore, these prior IM studies did not make individual stimulus adjustments to compensate for all consequences of hearing loss (e.g., reductions in frequency discriminability) that can vary across frequency. As such, frequency variations in masker tones or patterns may not have been as discriminable in HI listeners in some studies (e.g., de Laat & Plomp, 1985; Grose & Hall, 1996; Kidd et al., 2001). Finally, using tasks that only require the listeners to selectively attend to a particular frequency as in these prior IM studies may not reveal any inherent frequency biases. The listener’s goal in a selective attention task is to fully focus attention on the designated frequency region, which presumably could allow the listener to override any natural frequency biases. As such, the presence of IM would reveal a failure of selective attention to the desired target frequency—possibly because of a natural tendency to attend more strongly to the masker frequency than to the target frequency. If IM is reduced when the masker frequency is made the target, this would confirm a natural bias that cannot be overridden with intention. In contrast, a divided attention task in which the listeners are not instructed as to which frequency information to report until after stimulus presentations may more directly reveal whether a natural preference or bias exists toward a particular frequency region. Specifically, if the target is equally likely to occur at either frequency, the listener has no exogenously driven motivation (see Spence & Driver, 1994) to attend more to one frequency over the other and thus asymmetries in performance must be a result of endogenous factors (i.e., inherent frequency biases). These two approaches together—selective and divided attention tasks—may answer the question of whether hearing impairment results in bias in the attention to information in frequency regions with different sensitivities and whether this bias can be overridden with listener intention.
In a study that forms a precursor to the present investigation, Roverud et al. (2016) examined selective and divided attention to two frequency regions using a pattern identification task. In that paradigm, listeners identified one of four previously learned spectro-temporal patterns (sequences of pure tones) on each trial. The patterns were centered at 850 Hz and 3500 Hz and were presented at 15 dB sensation level (SL) to ensure equal audibility across center frequencies and listeners. NH and HI listeners first underwent a stimulus adjustment phase in which the frequency separation of the tones comprising a pattern were adjusted so that 79% correct pattern identification performance was achieved at each CF in quiet. Next, patterns were presented at both CFs simultaneously and listeners were instructed to attend to the low or high CF either in advance of each trial (selective attention blocks) or after each presentation (divided attention blocks). Both groups showed a frequency asymmetry in the combined-presentation conditions—a greater performance decline when the target was the high CF in the presence of a low CF pattern than vice versa. However, this asymmetry was more extreme for the HI group and only the HI group showed more confusion errors (incorrectly identifying the non-target pattern) for a high CF target than for a low CF target. Counter to expectations, there was no significant difference in performance overall between the selective and divided attention tasks. Roverud et al. (2016) did not directly test the hypothesis that the asymmetries in hearing thresholds contributed to (or were correlated with) the asymmetries in attention across frequency in the HI group.
Roverud et al. (2016) proposed that the similar performance in selective and divided conditions may have been due to a failure to perceive the content at the two CFs as separate streams during the stimulus presentation (see Shinn-Cunningham & Best, 2008, for a related discussion). As a result, listeners may have always been performing the task by dividing attention—holding both patterns in memory and attempting to perform the selection of the desired pattern after each presentation. One reason for this may have been the short stimulus duration on each trial: each pattern consisted of eight contiguous 60-ms duration pure tones. The buildup of stream segregation can occur over the course of seconds (Anstis & Saida, 1985; Bregman, 1978), although for the frequency separations in the Roverud et al.’s study, the streams were likely to have been segregated sooner (see Deike et al., 2012). If longer stimuli had been presented on each trial, there may have been more opportunity for separate streams to form and for differences between selective and divided attention conditions to be observed.
This study compared young NH and young HI listeners in their attention to two frequency regions with a modified version of the Roverud et al. (2016) experiment. A pattern discrimination task was used in which three sequential patterns generated by random selection of frequencies were presented to both CFs (similar in some ways to the methods of de Laat & Plomp, 1985; Grose & Hall, 1996). With the longer durations of the individual tones constituting the patterns, our goal was to provide more time for individual streams to form; and with the greater memory demand inherent in this task, the intent was to increase the cost of divided listening. This was done with the aim of observing any differences in frequency biases between selective and divided attention conditions that would presumably reflect inherent frequency biases (divided attention condition) and a listener’s ability to overcome a bias with intention (selective attention condition). To rule out the possible influence on performance of peripheral degradations due to hearing loss, the stimuli were presented at equal SL and the frequency separation of the tones making up the patterns was adjusted to ensure equal discriminability across listeners and CFs. Also, to rule out the possibility that cochlear dead regions could affect our results, the majority of HI listeners underwent the threshold-equalizing noise (TEN) test for cochlear dead regions (Moore et al., 2000). The overall goal was to test the hypothesis that hearing loss that differs across frequencies contributes to a reduction in the allocation of attention to regions corresponding to poorer hearing thresholds, even after correcting for bottom-up hearing loss-driven stimulus degradations.
Methods
Participants
Participants were 12 young adults (mean age: 21.33, SD = 3.14) with NH and 12 young adults (mean age: 26.08, SD = 6.46) with sensorineural hearing loss with known existence since infancy or childhood. NH was defined as hearing thresholds ≤20 dB HL at audiometric frequencies from .25 to 8 kHz. HI participants all had bilateral sensorineural hearing loss. The left ear of each listener was tested in the experiments, with the exception of HI11 whose right ear was tested due to listener preference. The average left-ear audiogram of the NH subjects and the left-ear (or right-ear for HI11) audiograms of each of the HI subjects are shown in Figure 1.

Test Ear Audiograms for All Subjects. Filled squares show the average thresholds for the NH listeners. Error bars are standard deviations. Thresholds for individual HI listeners are shown by other symbols. The symbol key to the right of the figure reports the results of the Threshold Equalizing Noise (TEN) Test (Moore et al., 2000) for dead regions. DNT = did not test; CNT = could not test.
Apparatus, Stimuli, and Procedures
To test for the possibility of dead regions, the TEN test was administered using the TEN test setting of the GSI Audiostar Pro audiometer to a subset of the HI listeners (for whom time permitted). The test frequencies were .5, .75, 1, 2, 3, and 4 kHz. The listener was seated in a sound-treated booth and the audiometer output was routed through ER-3A insert earphones. At each test frequency, the TEN level was set at least 10 dB above quiet pure-tone threshold (initially measured in 2-dB steps) and thresholds in the TEN noise were again measured in 2-dB steps. Participants were queried about the comfort of the TEN levels, and the TEN test was not administered if the TEN level was deemed too loud. A dead region was defined as a test frequency for which the threshold was at least 10 dB greater than the TEN level. In Figure 1, the symbol key depicts the results of the TEN test. No listener tested showed evidence of dead regions at the measured frequencies. Note that for listeners HI6 and HI11, the TEN test could not be administered at some frequencies due to TEN level discomfort or because maximum audiometer output levels had been exceeded.
For the main experiment, participants were seated in a double-walled sound-attenuating booth in front of a computer monitor with a keyboard and mouse. Participants wore Sennheiser HD280 Pro headphones. The stimuli were generated through a MATLAB 2011 b (Mathworks Inc., Natick, MA) program using a sampling rate of 44.1 kHz, delivered to a RME HDSP 9632 24-bit soundcard (ASIO), and presented to the test ear.
Several types of tasks were used in the study: quiet thresholds, frequency discrimination just noticeable differences (JNDs), masked thresholds, quiet pattern discrimination, and masked pattern discrimination. The order of these tasks is shown in Table 1.
Ordering of the Tasks Conducted in the Study.

Note. JND = just noticeable difference.
For the measurement of quiet thresholds, frequency discrimination JNDs, and masked thresholds, the stimuli were pure tones that were 150 ms in duration with 5 ms ramps. First, quiet thresholds (A in Table 1) were measured for a 750-Hz tone and for a 3500-Hz tone. A three-interval, three-alternative forced choice adaptive procedure was used. On each trial, the target tone was presented in one randomly selected interval and the other two intervals contained silence. The temporal intervals were marked visually on the computer monitor via a MATLAB graphical user interface (GUI). The listener selected the interval containing the tone by mouse click and was provided visual feedback as to whether the response was correct or incorrect. The tone level was adjusted using a two-down, one-up tracking procedure estimating 70.7% correct (Levitt, 1971). The step size was 5 dB for the first two reversals and 2 dB for the final eight reversals. Threshold was calculated as the average of the levels at the final eight reversals. Adaptive tracks for each frequency were run twice, and the final threshold was the average of the thresholds from the two tracks.
Following this, tone levels were set to 15 dB SL and frequency discrimination JNDs (B in Table 1) were measured for center frequencies of 750 and 3500 Hz. The exact frequencies of the tones for the measurement of JNDs never occurred at the CFs, but rather symmetrically surrounded the CFs. The frequency below the CF (LowTone) was calculated as LowTone = CF − (fspread/2), where fspread corresponds to the frequency spread in Hz, initially set as a percentage of the CF. The frequency above the CF (HighTone) was calculated as HighTone = CF + (fspread/2). A two-interval, two-alternative forced choice adaptive procedure was used. On each trial, the LowTone was presented in one interval and the HighTone was presented in the other interval in random order. The listener was instructed to select the interval containing the higher pitched tone and was provided with visual feedback. The fspread was adjusted using a three-down, one-up tracking procedure estimating 79% correct (Levitt, 1971). For the first track, the starting fspread was 6% of the CF for NH listeners and 18% of the CF for HI listeners. The fspread was adjusted at each reversal by a factor of 1.2. The track terminated after 10 total reversals, and frequency discrimination JND was calculated as the average of the fspread values at the final eight reversals. For each CF, the final JND was the average of two adaptive tracks. For the second track at each CF, the starting fspread was the final fspread of the first track multiplied by 1.2. The final CF-specific JNDs will be denoted JND750 and JND3500.
Next, quiet thresholds (C in Table 1) were measured for the frequencies corresponding to the resulting JNDs × 4 for both CFs (four total frequencies). Specifically, thresholds were measured for frequencies corresponding to 750 ± (JND750 × 4)/2 and 3500 ± (JND3500 × 4)/2. See Figure 2, Panel A for example frequencies corresponding to the JNDs × 4 for the 750 Hz CF; open symbols are LowTones and filled symbols are HighTones. These thresholds were measured in order to derive a threshold interpolation curve so that the signal levels at the frequencies used in the pattern discrimination tasks (in parts E, F, and G) could be set to 15 dB SL more precisely. As with the measurement of quiet thresholds, a three-interval, three-alternative forced choice procedure was used with a two-down, one-up tracking procedure.

A: Example frequencies corresponding to LowTones (open symbols) and HighTones (filled symbols) for a range of multiples of a JND for the 750 Hz center frequency (CF). B: An example pattern generated from the two frequencies corresponding to the 4 × JND multiplier. C: An example trial at one CF in the three-interval, two-alternative forced choice procedure, where interval one is the referent and intervals two and three are comparison intervals (interval two is the correct response). JND = just noticeable difference.
Next, in order to verify that there was no energetic masking for tones at the 750 Hz and 3500 Hz CFs presented simultaneously, masked thresholds (D in Table 1) were measured for the nearest tones at the two CFs (i.e., the LowTone of the 3500 Hz CF and the HighTone of the 750 Hz CF). Specifically, masked thresholds were measured for a target tone with a frequency corresponding to 3500 Hz − (JND3500 × 4)/2 in the presence of a masker tone with a frequency corresponding to 750 Hz + (JND750 × 4)/2. In addition, masked thresholds were measured for a target tone with frequency of 750 Hz + (JND750 × 4)/2 in the presence of a masker tone with frequency of 3500 Hz − (JND3500 × 4)/2. The masked tone level was set to 15 dB SL according to the threshold interpolation curve. A three-interval, three-alternative forced choice procedure was used. The masker tone was presented in all three intervals and the target tone was presented in one randomly selected interval. The subject selected the interval containing the target tone and its level was adjusted using a tracking procedure estimating 70.7% correct. Due to time constraints, some listeners did not participate in this task (four NH listeners and one HI listener).
For the pattern discrimination tasks, patterns were tonal sequences consisting of six temporally contiguous (at zero amplitude crossings) pure tones, each 150 ms in duration with 5 ms onset and offset ramps. Patterns were generated by randomly selecting the frequency at each temporal position from the two possible frequencies with equal probability (see Figure 2, Panels A and B). Quiet pattern discrimination (E in Table 1) was measured to determine the frequency spread corresponding to 90% correct performance for each CF individually. Initially, four frequency spread values were selected corresponding to 1, 2, 3, and 4 × JND, and patterns were constructed using these spreads (note that for some participants run earlier, this range was 0.5, 1, 2, and 3 × JND). The levels of the tones were set to 15 dB SL based on the threshold interpolation curve. A three-interval, two-alternative forced choice procedure was used (see Figure 2, Panel C). The gap between each presented pattern on a trial was 500 ms. On each trial, a randomly generated pattern was deemed the referent and presented in the first interval. This pattern was also presented in either interval two or three, with equal probability on each trial. The interval not containing the referent contained another randomly generated pattern. Prior to testing, subjects listened to a familiarization block in which a three-interval trial example was played at each CF with each of the frequency spread values. The presentations were labeled on the GUI Low Pitch or High Pitch according to CF and subjects did not respond. During the testing phase, the subject selected the interval (two or three) that contained the same pattern as the referent interval and visual feedback was provided. For each CF, each frequency spread and resulting pattern trial was presented 25 times. The 25 repetitions of the four frequency spreads (100 trials) were randomized and blocked into four blocks of 25 trials for a given CF. The CF tested was alternated on each block. Following these eight blocks, performance (proportion correct) for each multiplier was determined and the multiplier range was adjusted if needed for each CF. For example, if performance remained below 90% for all multipliers, multipliers >4 were selected. Pattern discrimination was measured again using this set of four multipliers (which may or may not be different from the original set), this time presented 50 times in random order, blocked into eight blocks of 25 trials for a given CF. Once again, the CF was alternated on each block. Following these 16 blocks, data for the initial multiplier set with 25 repetitions were combined with the adjusted multiplier set with 50 repetitions to construct a psychometric function for each CF. These psychometric functions (frequency spread vs. pattern discrimination performance) were fitted with logistic functions and the frequency spread corresponding to 90% correct pattern discrimination performance was determined as the final frequency spread (FFS).
Using these subject- and CF-specific FFS, combined-presentation pattern discrimination performance (F in Table 1) was measured in selective and divided attention blocks. On each trial, patterns were presented at both CFs simultaneously in all three intervals. Subjects first listened to a familiarization block in which a three-interval trial was presented at the 750 Hz CF alone (and labeled Low Pitch on the GUI) and then repeated in the presence of the 3500 Hz CF (with the instructions now listen to these Low patterns in the presence of the High patterns printed on the GUI). Next, a three-interval trial was presented at the high CF (labeled High Pitch on the GUI) and then repeated in the presence of the low CF (with the instructions now listen to these High patterns in the presence of the Low patterns printed on the GUI). Subjects did not respond during familiarization. During testing, subjects responded by selecting interval two or three and were provided with feedback. In selective attention blocks, the subject was informed prior to the start of the block whether to attend to the low CF or the high CF and perform the pattern discrimination task (see Figure 3). The target CF was 750 Hz in six blocks of 25 trials, and was 3500 Hz in six blocks of 25 trials and the CFs were alternated with each block. In divided attention blocks, the subject was instructed to listen to the patterns at both pitches and were informed after each trial whether to perform the discrimination task based on the low CF or high CF information (see Figure 3). The target was the low or high CF an equal number of times, but the order of target CF was randomized across any two blocks of 25 trials. There were 12 total divided attention blocks, yielding 150 trials per CF.

Example Trial in the Combined-Presentation Pattern Discrimination Task. The difference between the selective attention and divided attention tasks is in the instructions before stimulus presentation.
At the end of the experiment, quiet pattern discrimination (G in Table 1) was measured using FFS to determine the exact percent correct at each CF. Three blocks of 25 trials at the low CF and three blocks of 25 trials at the high CF were presented. The low CF and high CF were alternated on each block.
Results
Figure 4 shows quiet thresholds for the LowTone of the 3500 Hz CF (solid filled bar) and the HighTone of the 750 Hz CF (open bar) corresponding to 3 or 4 × JNDs and masked thresholds for these tones when the nearest tone at the other CF was presented simultaneously (hatched bars). The top panel shows NH results and the bottom panel shows HI results. The risk of peripheral interaction (i.e., energetic masking) of patterns presented simultaneously at the two CFs was greater for the HI listeners due to the higher presentation levels (Figure 4), the generally wider frequency spreads required at each CF (Figures 5 and 6), and because listeners with cochlear hearing loss generally demonstrate broader auditory filters and greater interaction of frequency-separated tones than do NH listeners (e.g., Florentine et al., 1980). To test this, masked thresholds for the nearest tones at each CF were compared to quiet thresholds at the corresponding frequencies using one-tailed Student’s t tests for all listener data shown in Figure 4. In two listeners, there was an indication of poorer masked threshold than in quiet: masked threshold at the 3500 Hz CF appeared to be poorer than quiet threshold for HI7 (t = −11.4, p = .004) and for HI11 (t = −4.78, p = .02), although these t tests did not reach significance at the Bonferroni-corrected significance level of p = .0013. These two HI listeners—the only listeners with greater hearing loss at the low frequency than at the high frequency—required a higher presentation level at the 750 Hz CF than at the 3500 Hz CF. It is possible that there was sufficient upward spread of masking in these two cases to result in a shift in quiet threshold for the nearest band at the 3500 Hz CF. The influence of these listeners’ data on the overall trends and conclusions will be discussed later. Aside from these results, there was no evidence of energetic masking for the simultaneous presentation of tones at the two CFs in other cases—note the close correspondence of quiet and masked thresholds for 750 Hz and 3500 Hz within each subject.

Quiet Thresholds and Masked Thresholds for the NH Listeners (Top Panel) and HI Listeners (Bottom Panel). See inset legend for a description of bar types. Error bars are +1 standard deviations. NH = normal-hearing; HI = hearing-impaired.

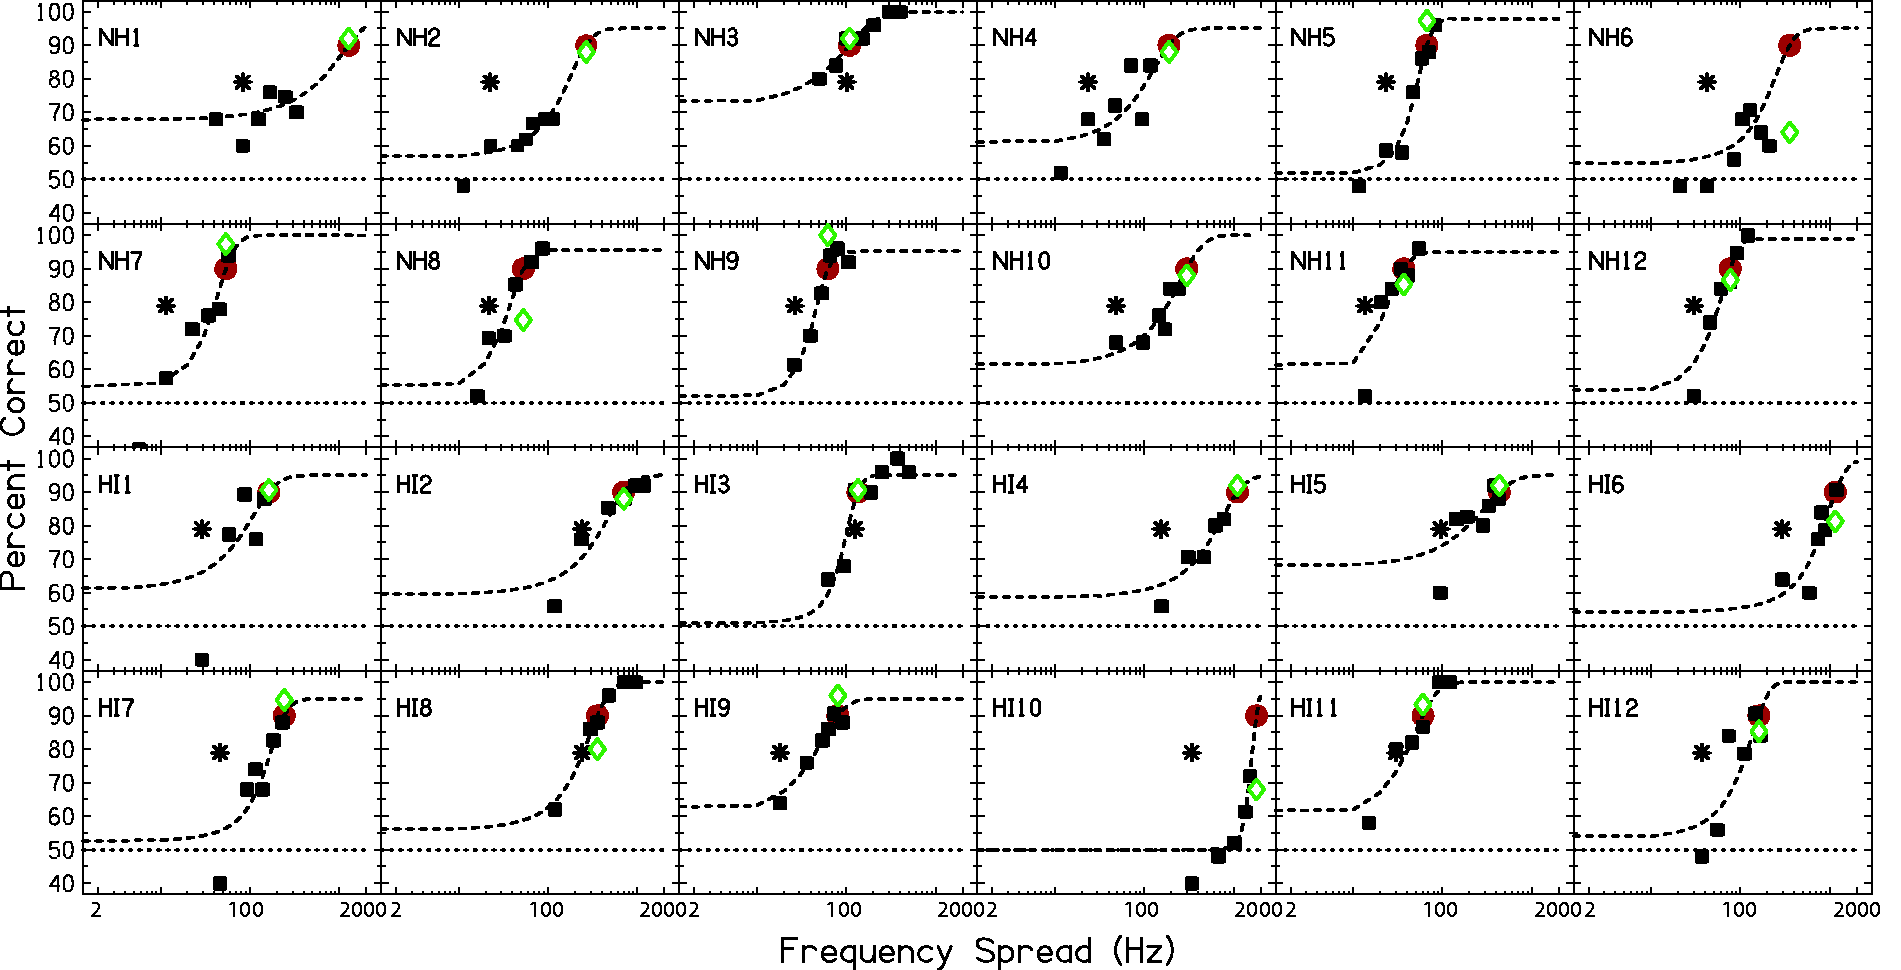
Psychometric Functions (Squares) and Logistic Function Fits (Dashed Lines) for Pattern Discrimination at a 750 Hz CF. Asterisk symbols indicate pure tone frequency discrimination JNDs. Circles (red) indicate frequency spreads from the logistic function fits estimating 90% correct pattern discrimination. Diamonds (green) show actual performance at this extracted frequency spread. Chance performance (50%) is indicated by the horizontal dotted line in each panel. NH = normal-hearing; HI = hearing impaired.
Psychometric Functions (Squares) and Logistic Function Fits (Dashed Lines) for Pattern Discrimination at a 3500 Hz CF. Asterisk symbols indicate pure tone frequency discrimination JNDs. Circles (red) indicate frequency spreads from the logistic function fits estimating 90% correct pattern discrimination performance. Diamonds (green) show actual performance at this extracted frequency spread. Chance performance (50%) is indicated by the horizontal dotted line in each panel. NH = normal-hearing; HI = hearing-impaired.
The psychometric functions for quiet pattern discrimination for each subject are shown as square symbols in Figure 5 for the 750 Hz CF. The 3500 Hz CF functions are shown in Figure 6. Pattern discrimination performance is generally a monotonic function of frequency spread. However, nonmonotonicities in the psychometric functions were found for some subjects at both CFs: NH1, NH6, and HI2 at 750 Hz and NH1, NH6, and HI3 at 3500 Hz. Extrapolations of the data were necessary in some cases in order to extract 90% correct frequency spreads: at 750 Hz for NH2, NH4, NH6, NH8, HI1, HI5, HI6 and HI10; at 3500 Hz for NH1, NH2, NH4, NH6, NH10, HI1, HI4, HI5, HI7, and HI10. The accuracy of these extrapolations can be gauged by the vertical distance between the circles and diamonds in each panel. The influence of the deviations of quiet performance from 90% correct will be explored in the following analyses.
Average percent correct pattern discrimination performance in quiet, selective, and divided attention conditions for NH and HI groups are shown in Figure 7. Pattern discrimination in quiet was intentionally pegged at 90% correct for all listeners at both CFs to ensure that differences in the combined-presentation conditions were not due to inherent pattern discrimination differences in quiet. As shown in Figure 7, quiet performance on average was very near the targeted 90% correct for both CFs and groups. One-sample, two-tailed t tests revealed that average quiet performance was not statistically significantly different from 90% in any of the four cases (NH Low CF: t(11) = −1.647, p = .128; NH High CF: t(11) = −.766, p = .46; HI Low CF: t(11) = −.772, p = .457; HI High CF: t(11) = −1.015, p = .332). However, as shown earlier, there were unintended individual subject deviations in quiet performance from the targeted 90% correct (compare red circles and green diamonds in Figures 5 and 6). To determine whether individual subject deviations from the expected 90% correct contributed to subject-by-subject variations in combined-presentation performance, correlations between these variables were examined. Quiet performance at 750 Hz was positively correlated with selective attention performance at 750 Hz (r(22) = .545, p = .006) but not with divided attention performance at 750 Hz at a Bonferroni-corrected level of p = .0125 (r(20) = .487, p = .016). Quiet performance at 3500 Hz was not correlated with selective attention performance at 3500 Hz (r(22) = .446, p = .029), or with divided attention performance at 3500 Hz (r = .249, p = .24).

Averaged Pattern Discrimination for NH and HI Groups in All Conditions. Error bars are standard errors. The upper dashed line shows the expected performance in the quiet condition. The lower dotted line shows chance performance. NH = normal-hearing; HI = hearing-impaired.
Given that quiet performance for some subjects and conditions deviated from the intended 90% correct, and given that combined-presentation performance was correlated with quiet performance (at 750 Hz), it is possible that in some listeners differences between CFs in combined-presentation conditions were influenced by differences in quiet between CFs. To correct for differences between CFs in quiet as sources of CF differences in combined-presentation conditions, CF-specific change in combined-presentation performance relative to quiet was calculated for each listener. The averaged results are shown in Figure 8. A repeated measures analysis of variance was performed for the change from quiet data in Figure 8 with within-subjects factors of condition (selective and divided) and frequency (750 Hz and 3500 Hz), and a between-subjects factor of group (NH and HI). The results revealed a significant effect of condition (F(1, 22) = 28.228, p < .001), a significant effect of frequency (F(1, 22) = 4.843, p = .039), and a significant two-way interaction of Frequency × Group (F(1, 22) = 16.494, p < .001). No other main effects or interactions were significant. Note that the main effect of frequency is no longer significant after a Bonferroni correction for the seven comparisons (the three factors, three two-way interactions, and one three-way interaction) within the analysis of variance is applied (corrected alpha, p = .007).

Averaged Change from Quiet Performance in Selective and Divided Attention Combined-Presentation Conditions in NH and HI Groups. The asterisk indicates the selective attention condition that was significantly different between NH and HI groups. NH = normal-hearing; HI = hearing-impaired. Sel = Selective; Div = Divided.
Of particular interest was the extent to which a frequency asymmetry occurred in combined-presentation conditions and whether the frequency asymmetry differed for NH and HI groups. The significant interaction of Frequency × Group found for the data in Figure 8 indicates that the effect of frequency differed between groups. To more clearly depict frequency asymmetries, the percentage change from quiet for 750 Hz and 3500 Hz CFs was subtracted within each listener and condition—these values will be subsequently referred to as Pdiff. The mean Pdiff results for the two groups are shown in Figure 9. Plotted in this way, symbols above the zero line indicate a larger decrement in combined-presentation conditions at the low CF than at the high CF and symbols below the zero line indicate a larger decrement in combined-presentation conditions at the high CF relative to the low CF. Using two-tailed t tests with a Bonferroni-corrected alpha of p = .006, Pdiff was significantly different between NH and HI groups in the selective attention (t(22) = 3.768, p = .001) and divided attention (t(22) = 3.622, p = .0015) conditions. In the NH group, Pdiff was not significantly different from zero in either selective attention (t(11) = 1.665, p = .12) or divided attention (t(11) = .84, p = .42) conditions. In the HI group, the opposite pattern was found: for each of the conditions, selective and divided attention, Pdiff was significantly different from zero (t(11) = −3.589, p = .004; t(11) = −4.301, p = .001, respectively). However, when the data from the two HI listeners who showed evidence of energetic masking were excluded (HI7 and HI11), the HI Pdiff was no longer significantly different from zero in the selective attention condition (mean = −11.87, SD = 13.56, t(9) = −2.768, p = .022), but remained significantly different from zero in the divided attention condition (mean = −12.80, SD = 8.733, t(9) = −4.64, p = .001).

Frequency Difference in Change From Quiet (as Shown in Figure 8), Also Called Pdiff, Averaged Across Listeners Within Each Group. Values above the zero difference line indicate a larger decline in performance in combined-presentation conditions from quiet for the low CF relative to the high CF. Values below the zero difference line indicate a larger decline in performance in combined-presentation conditions from quiet for the high CF than for the low CF. Asterisks and brackets indicate significant differences between NH and HI groups. Asterisks to the right of the symbols indicate Pdiff values significantly less than or greater than 0 (after correcting for multiple comparisons). NH = normal-hearing; HI = hearing-impaired.
One hypothesis discussed in the Introduction was that listeners may learn to rely less on frequency information in regions with poorer hearing. According to this hypothesis, listeners with threshold asymmetry in the direction of poorer hearing in the high frequencies would show more negative Pdiff values (indicating larger performance decrements for the high-CF target combined-presentation conditions than for the low-CF target combined-presentation conditions). The relationship was examined between Pdiff and pure-tone threshold difference at 750 Hz and 3500 Hz. The Pearson correlation coefficients and p values are shown in the first column of Table 2. These threshold differences were compensated for by presenting information at the two CFs at equal SL. Thus, listeners with larger threshold asymmetries also had greater asymmetries in presentation levels. As such, the relationship between these variables may be interpreted as either the relationship between Pdiff and presentation level difference or the relationship between Pdiff and long-standing threshold asymmetries experienced by the listener (but which are compensated for in the stimuli). Regardless of the interpretation, the relationship between Pdiff and threshold difference at the two CFs was not statistically significant according to Pearson correlation coefficients for selective (r(22) = .162, p = .449) or divided (r(22) = .164, p = .445) attention conditions.
Pearson Correlation Coefficients (r) and p Values of the Relationships Between Pdiff and Various Other Measures in Selective Attention (Upper Row) and Divided Attention (Lower Row) Conditions.

Note. JND = just noticeable difference.
As an extension of the hearing loss asymmetry hypothesis, it may be that listeners learn to rely less on regions of hearing loss because of poor stimulus representation in that region. Pure-tone JNDs measured initially (tracking 79% correct) indicate frequency selectivity at the CF regions and may serve as a proxy for each frequency region’s spectral selectivity. HI listeners generally showed larger pure-tone JNDs and a larger difference in JNDs between CFs on average (750 Hz: mean = 19.54 Hz, SD = 12.99; 3500 Hz: mean = 163.61 Hz, SD = 144.56) than NH listeners (750 Hz: mean = 6.38 Hz, SD = 3.78; 3500 Hz: mean = 47.30 Hz, SD = 38.68). The second column in Table 2 presents the correlation coefficients and p values for the relationship between Pdiff and difference in pure-tone JNDs at 750 and 3500 Hz. The relationship was not significant in either selective (r(22) = −.334, p = .110) or divided (r(22) = −.175, p = .412) attention conditions.
Finally, rather than asymmetries in hearing across frequencies contributing to Pdiff values, absolute degree of hearing loss may explain masked decrement asymmetries. The third column of Table 2 presents the correlation coefficients and p values for the relationship between Pdiff and pure-tone thresholds at 750 and 3500 Hz. Just the relationships for the HI group are considered here given that the Pdiff values already were compared for the groups, and the groups are divided by thresholds. For the selective attention condition, Pdiff was not significantly correlated with threshold at 750 Hz (r(10) = −.398, p = .20) or with threshold at 3500 Hz (r(10) = .255, p = .449). For the divided attention condition, Pdiff was not significantly correlated with thresholds at 750 Hz (r(10) = −.562, p = .057) or 3500 Hz (r(10) = .187, p = .560). According to the fourth column in Table 2, the relationship between Pdiff and pure-tone JNDs at 750 and 3500 Hz (analyzed using all listener data) was not significant at a Bonferroni-corrected significance level of p = .0125 in any condition: selective attention condition versus JNDs at 750 Hz (r(22) = −.406, p = .049) and at 3500 Hz (r(22) = −.365, p = .080); divided attention condition versus JNDs 750 Hz (r(22) = −.428, p = .037) and or at 3500 Hz (r(22) = −.212, p = .320).
Taken together, these results suggest that hearing status—whether a listener is NH or HI—but not frequency selectivity, asymmetry in thresholds or asymmetry in frequency selectivity, may explain the extent to which a listener shows variation across frequency in their ability to selectively attend to or divide attention between low or high frequencies presented simultaneously.
Discussion
Interpretation of Findings
The aim of this study was to determine whether HI listeners differ from NH listeners in their ability to selectively attend to auditory information at different frequencies or to divide attention among different frequencies. The underlying hypothesis was that the HI listeners would show a frequency asymmetry in performance because they would preferentially attend to information in the frequency region of better hearing. The complementary hypothesis was that, because this asymmetry would be due to hearing loss, no such effect would be found for the NH listener group. Furthermore, we speculated that this putative bias might be stronger—or even only would be apparent—in a divided attention condition where preference toward processing stimuli in different frequency regions might be more likely to be observed. The study was designed to minimize the contribution of reduced audibility and peripheral stimulus degradation in the HI results to ensure that any biases observed would not be due to inherent performance differences at the two CFs. Rigorous controls were implemented to reduce these potential confounds due to hearing loss—stimuli were presented at equal SL, the frequency separation of the tonal elements within a pattern was adjusted for each listener so that equal pattern discrimination performance was obtained for each CF in quiet, 1 , 2 and HI participants who could be tested for dead regions did not show evidence of having them. Given these controls, our findings support the conclusion that HI listeners do indeed reveal consistent differences in their ability to attend to independent sources of information in different frequency regions.
Selective and divided attention conditions were both examined to assess inherent frequency biases and to determine whether these biases can be overcome with explicit instructions. In the divided attention condition, frequency asymmetries in performance decline (Pdiff in Figure 9) are assumed to reflect inherent biases in attention to frequency because each target CF is equally likely and listeners are not informed of the target CF until after each presentation. As predicted, the results indicated that the NH listeners gave approximately equal attention to both CFs (Pdiff values were not significantly different from zero, see Figure 9), but that the HI listeners attended more to the low CF information.
In the selective attention condition, the listeners knew beforehand which frequency region would contain the target; i.e., which signal should be processed and which signal should be ignored. Given this a priori certainty about the target, any frequency asymmetries observed in performance decline (re: quiet performance) reflect asymmetries in the ability to focus on one frequency region due to an inability to ignore information from another frequency, a circumstance indicating differences in the susceptibility to IM across frequency. The presence of IM may be due to difficulties with segregating target and masker content or selection of the target, and, in cases where there is more IM for one target frequency than for another, it may be as a result of obligatory processing of the biased information. The NH group did not show a significant difference in performance across the two CFs suggesting that susceptibility to IM was not different across frequency. However, the HI group did show an asymmetry in performance at the two frequencies—favoring the low frequency as discussed earlier—suggesting a significantly greater susceptibility to IM at the high CF than at the low CF (see Figure 9).
The statistically significant group mean effect of attention condition (selective vs. divided) indicates that there was an overall cost of divided attention on performance. This is illustrated in Figure 8 where the performance decrements relative to the quiet condition were generally greater in the divided attention condition than in the selective attention condition. Note that this general finding of a significant cost of divided attention is in contrast to the findings of Roverud et al. (2016) who reported no significant cost of dividing attention between frequency regions. The lack of a divided listening cost in the earlier study may have been due to the relatively brief stimulus durations used, which may not have provided sufficient time to support the buildup of stream segregation (see Anstis & Saida, 1985), limiting performance in the selective listening case so that any additional costs of divided attention were obscured. The primary interest here, though, was whether the bias in attention to different frequency regions found in this study (reflected in Pdiff; Figure 9) differed between selective and divided attention conditions. If a listener was able to override an inherent frequency bias (a bias that would be revealed in the divided attention condition) with explicit instructions, then the asymmetry in performance across frequency should have been reduced in the selective attention condition and the Pdiff value should have been nearer to zero. As discussed earlier, the Pdiff values for the NH group were not significantly different from zero in either selective or divided attention conditions, indicating no significant bias in either case. For the HI group, Pdiff values were significantly different from zero (indicating a bias) in both conditions, and the Pdiff was not statistically significantly different between selective and divided attention conditions—t(22) = 0.744, p = .465. The fact that similar biases were obtained in both selective and divided attention conditions may indicate that the frequency bias is not under the listener’s control and that the underlying factors contributing to the bias are the same in both conditions. Further research is needed to determine the extent to which HI listeners could learn to override their inherent frequency biases after more and explicit training—an issue that is relevant to determining the best means for rehabilitation (e.g., amplification).
The HI listeners’ results suggest preferential attention to low-frequency regions. We theorized that a bias toward the low-frequency information, if observed, could be due to the listener’s past experience with the usefulness (e.g., fidelity, reliability) of information in regions with little or no hearing loss versus in regions with greater hearing loss. However, contrary to our hypothesis, the size or presence of this bias was not related to differences in the degree of hearing loss across frequency. Specifically, Pdiff was not correlated with threshold asymmetry, nor was it correlated with asymmetry in frequency discriminability across CFs. There was a subtle positive trend—the opposite direction from predicted—in the relationship between Pdiff and threshold asymmetry (see first column of Table 2). This appeared to have been driven by the two HI listeners (HI7 and HI11) who have poorer hearing at low frequencies than at high frequencies and whose results may be influenced by energetic masking. Thus, this trend should be interpreted with caution. When these listeners’ data were excluded, the correlations changed to fit the expected trend but still were not significant.
In general, Pdiff was related to hearing status (NH vs. HI). However, the relationship between Pdiff and pure-tone JNDs (fourth column of Table 2) was not statistically significant, and the relationship with absolute thresholds in the HI group was not significant (third column of Table 2). One difference between the groups that should be discussed is that the HI listeners were presented with higher overall presentation levels. Some previous results reported by Roverud et al. (2015) may shed light on the effect of presentation level on Pdiff. That study tested listeners in a pattern identification task with presentation levels set based on a loudness matching procedure as well as at equal (15 dB) SL. In that study, the majority of HI listeners displayed higher thresholds at the high (3500 Hz) CF than at the low (850 Hz) CF. In the loudness matching procedure, the high CF was set to 15 dB SL and the low CF was adjusted to equal loudness. As a result of this procedure, the low CF was presented at a higher presentation level than in the equal SL condition—the equivalent of approximately 20 dB SL in the NH group and 25 dB SL in the HI group. In the NH group, the results did not change in the two presentation level conditions. In the HI group, absolute performance became better at the low CF and poorer at the high CF in all conditions in the Equal Loudness condition (with a higher presentation SL for the low CF). However, because the same magnitude of changes also occurred in quiet, there were no apparent differences in change from quiet between Equal SL and Equal Loudness conditions. Thus, there was no clear effect of low CF presentation level on the results. These findings suggest that the group differences in Pdiff observed in this study are unlikely to be explained by differences in presentation levels.
Given the adjustments made to the stimuli to compensate for the peripheral effects of hearing loss in this study, we conclude that the difference in across-frequency attention in the HI group most likely was a result of central processes; i.e., top-down driven biases. The finding that the same degree of bias was present in both selective and divided attention conditions suggests that the bias is intrinsic and is not easily overcome with listener volition (i.e., as per the task instructions). Furthermore, the source of this group difference and which aspect of the hearing loss has led to this bias remain unclear. The difference in the HI listeners may be due to an as-yet unexplored factor (e.g., consistent use of hearing aids) or it may be due to a combination of factors. A larger scale study may be needed to identify these factors.
Comparison to Previous Studies
To the extent that the conclusions of this study may be compared to the earlier work discussed in the Introduction, our findings are more nearly consistent with the speech filtering studies that indicated poorer intelligibility for stimuli limited to regions having hearing loss (Ching et al., 1998; Hogan & Turner, 1998). The current findings thus appear to be inconsistent with past studies reporting that HI listeners place greater weight on tones falling in regions of hearing loss than in regions with better hearing (Doherty & Lutfi, 1996, 1999). However, there are many important differences between our study and these other studies that limit the usefulness of direct comparisons. As noted in the Introduction, both the analysis of filtered speech recognition and derivation of perceptual weights from perturbations of components in the loudness judgments of multitone complexes involve very different tasks, stimuli, and underlying assumptions. It is beyond the scope of this study to attempt to reconcile these very diverse reports. However, what we can say is that the current findings clearly indicate a reliable difference in cross-frequency processing of independent streams of information between NH and HI groups. This difference is in the direction of reduced attention to high-frequency signals in the HI group.
Several previous studies have reported an increased susceptibility to IM in HI compared to NH that could not be explained by peripheral factors (de Laat & Plomp, 1985; Grose & Hall, 1996; Kidd et al., 2001). The data shown in Figure 8 are most relevant to the findings from those studies, as they reflect performance decrements in conditions when listeners were instructed to attend to one CF and ignore the masker at the other CF. As shown in Figure 8, in the selective attention condition, the performance decrements were significantly different between NH and HI groups—with the HI performance decrements larger than NH—at the 3500 Hz CF, but not at the 750 Hz CF. That is, the present findings are consistent with those previous IM study conclusions, but only at the 3500 Hz CF. Thus, the differences in susceptibility to IM between NH and HI listeners may depend on the target frequency tested.
Summary
This study examined the hypothesis that, as a result of hearing loss that differed across frequencies, HI listeners would show differences in attentional bias across frequency regions. Young NH and HI listeners performed a pattern discrimination task at two CFs (750 Hz and 3500 Hz). To correct for the effects of hearing loss in the stimuli, the patterns were presented at 15 dB SL, and the frequency separation of the tonal elements within a pattern at each CF was adjusted so that 90% correct pattern discrimination performance was achieved in quiet for each listener. In combined-presentation conditions, patterns were presented at both CFs simultaneously and listeners were instructed to attend to the low or high CF before each block (selective attention condition) or after each trial (divided attention condition). Masked thresholds measured for the tones used in the patterns confirmed that there was no energetic masking for these stimuli, with the possible exception of the two HI listeners who exhibited greater hearing loss in the low frequencies than in the high frequencies. Combined-presentation pattern discrimination results were expressed as change from quiet to account for variations in actual quiet performance from the targeted 90% correct. Within each group and attention condition, results for the low CF and high CF were subtracted to represent the direction of frequency bias under combined-presentation conditions. The NH group did not show a significant bias across frequency, but the HI group showed a bias toward the low CF (larger performance declines for the high CF target in the presence of low CF patterns than vice versa). This bias in the HI group remained in the divided attention condition even when the data from the two HI listeners showing evidence of energetic masking were excluded. Although overall performance was poorer in the divided attention condition than in the selective attention condition, the bias was not significantly different between selective and divided attention conditions, suggesting that inherent frequency biases were not overridden when listeners were given explicit instructions. The frequency bias was not correlated with asymmetries across CFs in pure-tone thresholds or frequency JNDs or with absolute thresholds or JNDs at either CF. Thus, the source of the frequency bias in attention in the HI group remains unclear.
Footnotes
Acknowledgments
The authors wish to thank Walt Jesteadt and another anonymous reviewer for their helpful feedback on this manuscript.
Declaration of Conflicting Interests
The authors declared no potential conflicts of interest with respect to the research, authorship, and/or publication of this article.
Funding
The authors disclosed receipt of the following financial support for the research, authorship, and/or publication of this article: This research was supported by a grant to the first author from NIH NIDCD K01DC016627 and by a grant to the third author from NIH NIDCD R01DC04545.