
Abstract
Recent achievements in hearing aid development, such as visually guided hearing aids, make it increasingly important to study movement behavior in everyday situations in order to develop test methods and evaluate hearing aid performance. In this work, audiovisual virtual environments (VEs) were designed for communication conditions in a living room, a lecture hall, a cafeteria, a train station, and a street environment. Movement behavior (head movement, gaze direction, and torso rotation) and electroencephalography signals were measured in these VEs in the laboratory for 22 younger normal-hearing participants and 19 older normal-hearing participants. These data establish a reference for future studies that will investigate the movement behavior of hearing-impaired listeners and hearing aid users for comparison. Questionnaires were used to evaluate the subjective experience in the VEs. A test–retest comparison showed that the measured movement behavior is reproducible and that the measures of movement behavior used in this study are reliable. Moreover, evaluation of the questionnaires indicated that the VEs are sufficiently realistic. The participants rated the experienced acoustic realism of the VEs positively, and although the rating of the experienced visual realism was lower, the participants felt to some extent present and involved in the VEs. Analysis of the movement data showed that movement behavior depends on the VE and the age of the subject and is predictable in multitalker conversations and for moving distractors. The VEs and a database of the collected data are publicly available.
Introduction
Head- and gaze-movement behavior could play an important role in future generations of hearing aids. Algorithms have already been developed which allow hearing aids to interact with head orientation, such as high directivity beamformers and binaural source localization algorithms (Farmani, Pedersen, Tan, & Jensen, 2016; Hadad et al., 2017; Li, Benesty, Huang, & Chen, 2016; Picou, Aspell, & Ricketts, 2014). The locus of the spatial auditory attention of the hearing aid user, which can be used to enhance attended sources and suppress unattended ones, can be determined from eye- and head-movement behavior (Best, Roverud, Streeter, Mason, & Kidd, 2017; Favre-Félix, Graversen, Dau, & Lunner, 2017; Grimm, Kayser, Hendrikse, & Hohmann, 2018; Grimm, Luberadzka, Müller, & Hohmann, 2016; Hart, Onceanu, Sohn, Wightman, & Vertegaal, 2009; Lu, McKinney, Zhang, & Oxenham, 2018; Tessendorf et al., 2011) or from electroencephalogram (EEG) signals (Fiedler et al., 2017; Mirkovic, Debener, Jaeger, & De Vos, 2015; O'Sullivan et al., 2015).
The full development and evaluation of such hearing aid algorithms require knowledge of typical movement behavior and EEG signals in everyday situations. One approach to obtaining this information is via field recordings (Bleichner & Debener, 2017; Lu et al., 2018; Tessendorf et al., 2012; Vertegaal, Slagter, Van Der Veer, & Nijholt, 2001). This ensures ecological validity and automatic selection of relevant situations, provided the measurements are made while people go about their daily life. However, in the field, it is difficult to make and reproduce measurements and systematically assess variables. An alternative approach is to use virtual environments (VEs) in the laboratory. We have previously shown that including visual cues is important when measuring movement behavior (Hendrikse, Llorach, Grimm, & Hohmann, 2018), and so these VEs should be audiovisual. We have also shown that animated characters can be used instead of a video of real persons to measure movement behavior. The advantages of using VEs in the laboratory are that they give high reproducibility and control, and rendering engines for VEs can provide full access to acoustic and visual stimuli, which allows analysis of the signal-to-noise ratio and of the hearing aid performance. However, it can be argued that measurements with VEs in the laboratory are less ecologically valid than field tests, and that it is challenging to create and design realistic VEs (Llorach, Grimm, Hendrikse, & Hohmann, 2018) and to specifically design relevant everyday situations that would occur naturally in the field. To fully exploit the potential of using VEs in hearing aid research, behavioral data and subjective quality assessments of a broader range of realistic VEs are therefore needed.
In this article, we describe an experiment to define typical movement behavior and identify different behavioral groups, using realistic VEs in the laboratory that simulate everyday situations. Obviously, it was clear to the participants that they were in the laboratory (see Methods for details) and that the VEs were not real-life experiences; despite this, our goal was to reach a level of realism that allows participants to imagine being in the real situation and behave accordingly. To describe the movement behavior, several measures of the movement and similarity in behavior were considered and compared between different environments and different age groups.
For this study, we selected a small number of relevant everyday situations for both normal-hearing and hearing-impaired persons, based on earlier findings (Eckardt, Holube, Fichtl, & Müller, 2013; Wagener, Hansen, & Ludvigsen, 2008; Wolters, Smeds, Schmidt, Christensen, & Norup, 2016; see Environments section). These were a living room, a lecture hall, a cafeteria, a train station, and a street. Audiovisual VEs were created for the selected situations and presented to younger and older normal-hearing participants in the laboratory while they were seated or standing. Normal-hearing listeners were used in this study to develop and evaluate the VEs and to provide reference movement data for later studies involving hearing-impaired participants or participants with hearing aids. The participants were asked to pay attention to one or more speech sources in each VE and to answer content-related multiple-choice questions afterward. Head, eye, and body movements and EEG signals were recorded on the timeline of the presented VEs.
We began this study with several expectations. First, we expected that the participants would be able to imagine being in the real situation while experiencing the VEs (Expectation
Furthermore, we expected movement behavior to differ between the different VEs (Expectation
Finally, we also expected many individual differences in movement (Expectation
Method
Participants
The experiment was carried out with 22 younger, normal-hearing participants (11 males and 11 females) aged between 20 and 34 years (mean 25 ± 3.6 years), most of them students at Oldenburg University, and 21 older, normal-hearing participants (9 males and 12 females) aged between 60 and 77 years (mean 69 ± 5.4 years), recruited via the Hörzentrum Oldenburg. For each subject, the audiogram was measured to ensure normal hearing (Pure-Tone Average < 20 dB HL at 500–4000 Hz, bilaterally). Two elderly participants had to be excluded because their Pure-Tone Average was more than 20 dB HL in one or both ears. Participants had normal or corrected-to-normal vision and were not suffering from any conditions that could have affected movement.
Environments
For this study, we selected a range of situations that have a high importance and occurrence in the everyday life of both younger and older normal-hearing and hearing-impaired persons. We designed the VEs to have a large range of different target sources (one or multiple live speakers or loudspeakers, close or further away) and distractors (competing speakers or other sounds, close or further away, moving or stationary). The selection of everyday situations for this study was based on research by Wagener et al. (2008) and Eckardt et al. (2013), who made recordings and categorizations of everyday listening situations of normal-hearing and hearing-impaired listeners of different ages with and without hearing aids, and Wolters et al. (2016), who provided a literature overview and structured framework of common sound scenarios.
The following VEs were selected: living room, lecture hall, cafeteria, train station, and street. In all VEs, the task was to actively listen to a specified target; in the cafeteria VE, we additionally measured a dual-task condition with a hand-eye coordination task, and in the street VE, we additionally measured a passive listening condition in which no target was specified. The following paragraphs give a brief description of the reasons for selecting the VEs and the properties of the implemented VEs. Figure 1 shows a panoramic view of the VEs. The virtual characters used in the VEs made speech-based lip movements (Llorach, Evans, Blat, Grimm, & Hohmann, 2016) and had conversational gaze behavior, that is, they were looking at the active speaker.
Images of the virtual audiovisual environments with panoramic view. From top to bottom: living room, lecture hall, cafeteria, train station, street_active, and street_passive.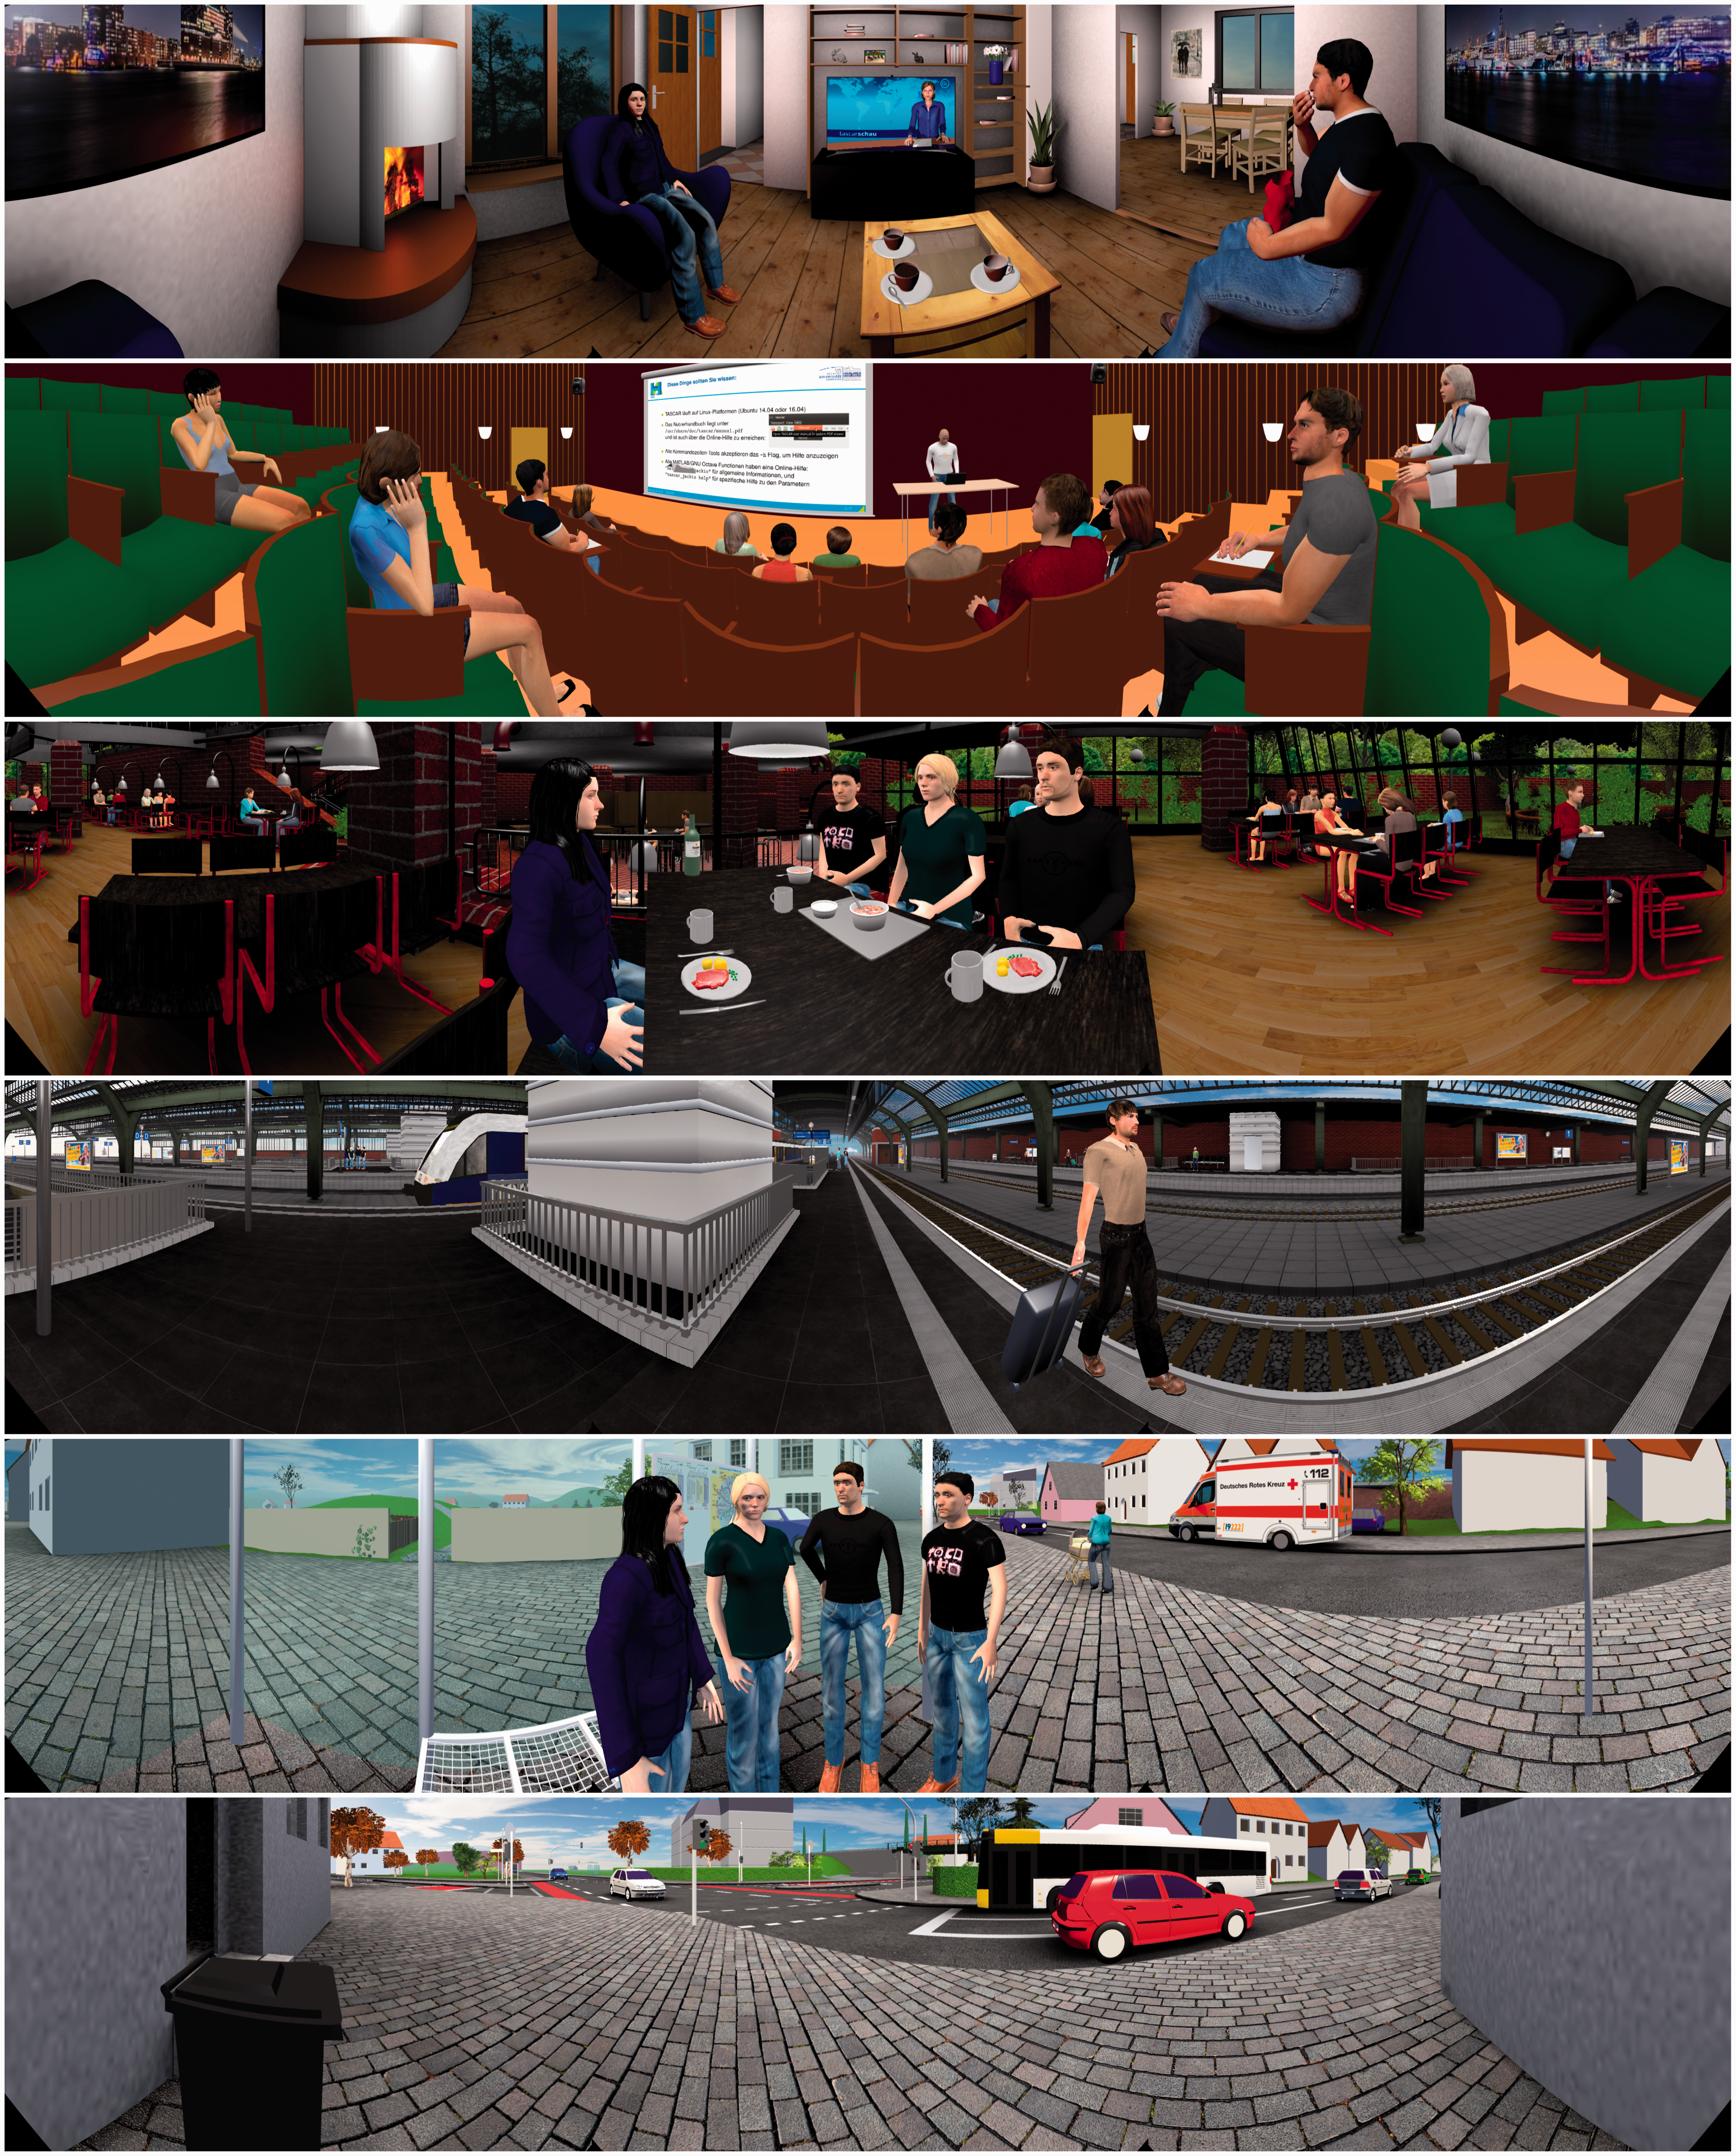
Living room
The situation of watching TV in the living room is a focused listening scenario that is highly relevant and occurs frequently, especially for older participants. In the implemented VE, the listener was simulated to be inside a furnished room sitting on a sofa with a TV in front (at an azimuth of −4°, negative angles are to the right), a person sitting on the right eating chips −90°), and a person sitting on the left in a separate chair making comments (45°). In the corner of the room was a fireplace with a crackling fire and there were some noises from the kitchen. The task of the participant was to listen to the news playing on the TV.
Lecture hall
Listening to a lecture represents another important and (for students) frequently occurring focused listening scenario, with live sound and a larger distance to the speaker. In the implemented VE, the listener was sitting in the audience, while a lecture was given about an acoustic scene-rendering toolbox. The voice of the lecturer (−15°) was amplified with two loudspeakers (51° and −38°) inside the lecture hall. The task of the participant was to listen to the lecturer. Presentation slides were shown on a screen (25°). There were general noises from the audience (coughing, sniffing, sighing, and pencil writing), which happened at different times and orientations during the lecture, and there was a paper plane flying from the back of the audience to the screen once in the middle of the lecture.
Cafeteria
To represent speech communication scenarios with multiple people, we selected a typical cafeteria. We modeled it after the cafeteria at the natural sciences campus of the University of Oldenburg. The listener was simulated to be sitting at the edge of a table where four persons (−28°, −4°, 8° and 34°) were having a conversation. The background consisted of several point noise sources, such as competing conversations at neighboring tables, laughter and music, and diffuse noise. The diffuse noise was a real recording of a cafeteria (babble noise and noise of plates and cutlery). We set two tasks in this VE. In the cafeteria listeningonly task, the participants had to listen to the four-person conversation, whereas in the cafeteria dualtask task, the participants had to do this and at the same time put pins in the holes on a Purdue Pegboard (Tiffin & Asher, 1948). The Pegboard task was chosen to simulate the situation of eating and listening to a conversation at the same time, where it is necessary to do something with the hands and look down every now and then.
Train station
Although the situation of listening to announcements in a train station occurs less frequently, we chose it because it is a focused listening scenario with a large distance to the loudspeakers and without any visual cues of the target. Furthermore, the background noise of a typical train station is considerably different from that in the other situations. We modeled our VE after Oldenburg central station, in which the listener was standing on a platform, and there were announcements from multiple loudspeakers about trains arriving or departing. The task was to listen to these. There was a group of four persons having a conversation on a neighboring platform (98°), and general noises of trains arriving, persons with trolleys walking past, and beeping from the ticket validation machine. There was also diffuse background noise from a recording of a real train station.
Street
For a second example of a speech communication scenario with multiple people, we chose listening at a bus stop because the background noise is different from the background noise in the cafeteria, as it is traffic noise with lots of moving sources. In the implemented VE (street active ), the listener was standing at a bus stop where four persons (−17°, 4°, 23°, and 42°) were having a conversation. The participant's task was to listen to the conversation in front of him while vehicles were passing by on the street on the participant's right side. The traffic on the street was composed of cars, a bus, a truck, a rescue car with sirens (ambulance), a bicycle, and a train driving past in the distance. Furthermore, there were the sounds of a mother with pram walking past singing lullabies, noises from playing kids at the nearby school playground, and a diffuse background noise with traffic and birds singing. According to Wolters et al. (2016), passive listening (with no intent of listening to a specific target) is also a category of scenarios with high occurrence. Therefore, we also decided to include a traffic situation with passive listening (street passive ). In this case, the listener was standing at a street corner with traffic on the street. The noises were the same as in the street active VE, but with two persons walking past having a conversation, and it ended with a car making an emergency stop. The participant's task was to stand there and wait for the person they had an appointment with to arrive. There was a (virtual) person approaching at the end.
Overview of Main Acoustic Features for the Different Virtual Environments.

Note. Properties of the target and noise sources and the duration of the presented communication sequence are listed. As scene description parameters, the sound level (Leq) and DD are listed. Room acoustic parameters are described with the reverberation time (T60), EDT, DRR in the better ear, and IACC. DD = degree of diffusiveness; EDT = early decay time; DRR = direct-to-reverberant ratio; IACC = interaural cross-correlation.
Setup
Acoustic Rendering Method per Environment and Source Type.

Note. 2D HOA = two-dimensional horizontal seventh-order Ambisonics panning; 3D NSP = three-dimensional nearest-speaker panning.
For the visual presentation, three projectors (NEC U321H) and the Blender Game Engine (version 2.78a, Roosendaal, 1995) were used with a 3.52-m diameter, acoustically transparent cylindrical screen. The combined field of view was about 300°. The warping necessary for projecting onto a cylindrical screen was done on a graphics card (Nvidia Quadro m5000) and manually calibrated. All equipment was attached to a cloth-covered metal frame that reduced environmental sounds as well as light and room reflections (see Hendrikse et al., 2018, for illustrations).
A simulation of movement parallax was added to increase the presence and involvement of the participants. This allowed participants to change the visual perspective in the VE and move closer to sound sources. To do it, the head position of the subject was used to change the position of the virtual camera and receiver in the VEs by half of the physical displacement of the head, that is, a head translation of 10 cm would be equivalent to a camera and receiver translation of 5 cm in the VEs. The movement parallax simulation worked for the small sways and slight translations the participants made; they were asked to stay close to the center of the setup during the measurement.
To measure the head movement of the participants, an infrared camera (TrackIR 5 by Naturalpoint) was used, which tracked six reflective markers on a custom-made cap worn by the participants, using a sample rate of 120 Hz. Rotations around the three rotational axes (yaw, pitch, roll) were measured, as well as translations along all three axes with a sensor noise below 0.1°. To measure the eye movement (angle relative to the head in the horizontal plane), two types of custom-made wireless electrooculogram (EOG) amplifiers were used. One EOG sensor had a built-in first-order high-pass filter to compensate for the electrode voltage drift. The signal was measured with a sample rate of 50 Hz at 10-bit resolution and was sent to the data logging with the Bluetooth serial protocol. The other sensor transmitted via Wi-Fi with a sample rate of 33 Hz and a resolution of 16 bits. Both EOG sensors had an accuracy of roughly ±10°. The head tracker and EOG sensors were calibrated by displaying a cross on the cylindrical screen at the currently measured head direction while the subject was seated in front of it. Participants were then asked to adjust the cap until they felt the cross matched the direction they faced. For the EOG sensor calibration, the cross was then moved to the left/right of the currently measured head direction by a known number of degrees and the participants were asked to follow the cross with their eyes. To track body movements, a depth camera (Microsoft Kinect) was used. The positions of the joints (head, neck, chest, shoulders, elbows, wrists, torso, pelvis, hips, knees, and ankles) were tracked by the built-in skeleton-tracking software and sent to the data logging as Open Sound Control messages using the program NI mate with a sample rate of 30 Hz. The EEG signal was measured with around-the-ear cEEGrid electrodes (Bleichner & Debener, 2017) and an SMARTING (mBrainTrain) amplifier with a 250 Hz sample rate. The TASCAR and LabStreamingLayer packages (Medine, 2016) were used for time synchronization and data logging.
Experimental Procedure
The procedure was approved by the ethics committee of Oldenburg University. First, the participants were informed about the experiment and were asked for their written consent. Then, the electrodes and sensors were attached and the calibration for the EOG and head tracker was done. During the measurements, the participants were either standing on the floor or sitting on a chair on a platform so that their ears were at loudspeaker height, depending on the VE. For one half of the participants, the seated VEs were measured first, and for the other half, the standing VEs were measured first. When seated, the participants were instructed that they could move how they normally would in such an environment. When standing, they were told they could also turn if they wanted, but that their feet always needed to stay close to a yellow dot on the floor indicating the center of the lab (and of the head movement sensor field-of-view). For each VE, they were instructed about where they should focus their attention and the content-related multiple-choice questions that were to be answered after each VE. Then a short clip (30 s) of the VE was played with a muted target source, so that they could get familiar with the VE and look around. Subsequently, the main measurement was started. At its conclusion, they were given a paper with multiple-choice questions, required to complete it, and the next VE was started. Halfway through the experiment, there was a short break to switch from standing to sitting or vice versa. Finally, the sensors and electrodes were taken off and they were asked to fill in the main questionnaires.
Data Preprocessing
Head movement
The head movement data from the TrackIR sensor were first cut to the VE duration. Next, erroneous angle jumps were removed by detecting data points where the angular velocity was larger than 200 deg/s and the jump was larger than 6°. This was done for yaw, pitch, and roll. To calculate the relative orientation of the head tracker to the real world, we subtracted the average values obtained during the EOG calibration procedure, as during its calibration, the participants were instructed to look straight ahead and not move the head, so head yaw, pitch, and roll should have been 0°.
Eye movement
The processing of the eye movement data depended on which sensor was used. One sensor had a built-in first-order high-pass filter to compensate for the electrode voltage drift, but this filter failed to work adequately, so an inverted filter was applied to undo it. For both sensors, there was now electrode voltage drift in the data, so a more suitable filter was applied to remove it. The drift was approximated by linearly extrapolating the data and then smoothing with a moving-average filter with a length of 500 samples (8–14 s). This approximated drift was subtracted from the eye movement data. Then, the data were cut to the VE duration. One younger participant had to be excluded from the movement behavior analysis because an error during the calibration procedure resulted in very high and thus invalid values for the eye angle.
Gaze movement
The head- and eye-movement data points were resampled to the same time line with a 120-Hz sampling rate. To get the gaze trajectories, the resampled head and eye data points were summed.
Torso movement
For calculation of the torso rotation, the four-quadrant inverse tangent of the difference between the left and right shoulder x- and y-positions (from the depth data) was computed. The torso rotation was resampled to the same time line as the head- and eye-movement data at a 120-Hz sampling rate. Sometimes, the depth camera did not function during the measurement, especially when the participants were seated and an object was covering part of the body (e.g., the table with the Pegboard in cafeteria dualtask ). This resulted in some missing data points. In cafeteria dualtask , the data from six participants were missing completely and the data from two participants partially, and in the other VEs where the participants were sitting, the data from two to three participants were missing completely and the data from one to two participants partially. In the VEs where the participants were standing, few data points were missing; the worst case was street passive , in which 55% of the data from one participant were missing. In the seated VEs, the participants could not move the torso much, so a torso rotation of 0° was assumed for the missing data points, or the data were interpolated/extrapolated if it was partially missing. In the standing VEs, the data were also interpolated/extrapolated for the missing data points.
After data preprocessing, we had the head, eye, gaze, and torso movement of all participants in all VEs on the same time line. Further analyses were derived as described in the following sections.
Measures and Analyses
A number of questionnaires were used to evaluate the subjective experience of the VEs, as described later. Furthermore, the test–retest reliability of the measured movement behavior and the proposed measures was evaluated by calculating the correlation between the test and the retest. Checking the test–retest reliability is a standard way to validate new measures (e.g., Kollmeier et al., 2015). In this case, a retest was done with 10 of the younger participants. For each subject, eight measures were computed in each VE (living room, lecture hall, cafeteria listeningonly , cafeteria dualtask , train station, street active , and street passive ). The overall test–retest correlations were calculated using the Pearson correlation coefficient for all measures, by pooling all data points per measure for the test and correlating this with the data points for that measure for the retest. Moreover, to determine the test–retest reliability of the measured behavior, a measure was needed to quantify the similarity between the test and retest gaze trajectories. A weighted difference between the gaze trajectories was used for this purpose as described later.
List of All Measures Computed From the Raw Movement Data, Including a Brief Description and a List of Environments in Which They Were Calculated.

Note. VE = virtual environment.
Questionnaires
To check the complexity of the VEs, the listening effort was measured with the Adaptive Categorical Listening Effort Scaling (ACALES) questionnaire (Krueger, Schulte, Brand, & Holube, 2017). In this questionnaire, the participants were asked to answer for each VE how hard it was to listen to the speech. The listening effort was rated on a 14-point scale, where no effort corresponded to a score of 0, very little effort to 2, little effort to 4, moderate effort to 6, considerable effort to 8, very much effort to 10, and extreme effort to 12. The participants could answer “only noise” if they did not hear any speech, corresponding to a score of 13.
Second, the participants had to complete the Igroup Presence Questionnaire (IPQ; igroup.org—project consortium, 2016; Schubert, Friedmann, & Regenbrecht, 2001), because this questionnaire measured the overall sense of presence, spatial presence, involvement, and experienced realism. Some minor changes were made to this: In Item 4, the denial was taken out, because this was confusing; Item 5 was removed, because it was not possible to operate something in our VEs; for Item 13, two questions were added to ask about the realism of the acoustic and visual VE separately. The complete list of items that were used (including changes with respect to the original) is reported in Appendix A. Although the IPQ is normally used to look at differences between conditions (e.g., Bessa, Melo, Augusto de Sousa, & Vasconcelos-Raposo, 2018), our application of the IPQ was to test
Finally, an open interview was conducted, in which we asked which VE they thought was most and least realistic and why. This was so we could know in detail what the participants thought of the VEs and identify things that could be improved in the future.
Movement Measures
As measures for the amount of movement, we calculated the mean gaze speed (“GazeSpeedMean”) and the number of gaze jumps (“NGazeJumps”). The GazeSpeedMean was calculated by differentiating the smoothed gaze trajectories and then taking the mean of the absolute values. The mean speed has also been used in other studies to characterize head movement (Kim, Mason, & Brookes, 2007; Kim et al., 2013). The NGazeJumps was calculated from the smoothed gaze trajectories by thresholding the data to find data points where the speed was more than 100°/s. These were considered data points during a gaze jump. The start and end of the jump were found by looking for the closest changes in direction (i.e., sign changes in the differences between adjacent data points). Gaze jumps smaller than 5° or shorter than 0.1 s were rejected and considered as noise. The number of gaze jumps was also used in our previous study to characterize the gaze behavior (Hendrikse et al., 2018). The number of gaze jumps was normalized by the duration of the VEs to enable a comparison between the VEs.
To measure the variation in gaze direction, the standard deviation of the gaze trajectories (“GazeStd”) was calculated, because this is more robust to measurement errors than the range. To look for latency differences in gazes, we needed events with a sudden onset, so that the delay between the event onset and the next gaze jump in the right direction could be calculated (“GazeDelay”). This measure was therefore only calculated in the cafeteria and street active VEs, because there the speaker changes could be used as timing events with a sudden onset.
To quantify the ratio between head and eye movements, “HeadGazeRatio,” at each time point of the movement trajectories, the absolute head angle relative to the torso was divided by the absolute gaze angle relative to the torso and then the average was taken over time. There were three criteria for excluding certain time points: (a) if the time point was during a head/eye saccade; (b) if the head angle was bigger than the gaze angle, or of opposite sign; and (c) if the gaze angle was smaller than 10°. Time points during head/eye movement were excluded because we were interested in the static situation; the head and eyes do not move at the same time or speed and including these time points would result in a large spread of ratio values. The second exclusion criterion was applied because it was unclear what the ratio would represent in such a situation. The third exclusion criterion was applied to avoid division by zero and because the values for the ratio in this range would be mostly determined by the sensor noise. The ratios of excluded data points over the total number of data points for each criterium were used as three subsidiary measures: (a) “HeadGazeRatio_excl_move,” (b) “HeadGazeRatio_excl_behavior,” and (c) “HeadGazeRatio_excl_smallangle.” On average, 60.1% ± 16.7% of the data points were excluded for the calculation of the HeadGazeRatio, with a maximum of 100% for two participants in the cafeteria dualtask and living room VEs.
Similarity Measures
To determine whether the participant was looking at an object (target or distractor) and to compare the gaze behavior between participants and between test and retest, we needed to compare pairs of time signals. We looked at the angular difference over time between the signals, because we considered two angular trajectories to be similar if they had the same angular position at the same time (e.g., two participants looking in the same direction at the same time). For our purpose, it did not matter if the difference was 90° or bigger, because in these cases it is clear that the two participants were looking in entirely different directions. We were therefore interested in the range of angular differences between 0° and 90° and chose to calculate a weighted difference. For the weighted difference, the absolute angular difference between two signals at each time point was converted, nonlinearly, to a value between zero and one and then the mean over time was calculated. Values of this “similarity value” close to one indicate a high similarity between signals, that is, two participants looking in the same direction irrespective of their head direction, whereas values close to zero indicate a low similarity. Angular differences smaller than 20° were converted to a value of one, to compensate for measurement inaccuracy. The conversion function decreased exponentially, being 0.5 at 45° angular difference and then close to zero at angular differences bigger than 90°. The following is the formula for the similarity measure:

The first application of the similarity measure was to describe the aim of the gaze, that is, whether the gaze focused on a distractor or on a target. This calculation used the angular difference between the gaze trajectories of the participants and the angular position of an object (target, distractor). The similarity measure to the target (“TargetSim”) was calculated using the participants' gaze direction and the angular target position. We did not calculate it in the train station and street passive VEs, because there were multiple simultaneous target positions (loudspeakers) or because there was no clear target position (passive listening). The similarity measure to each distractor object (“DistractorSim”) was computed using the participants' gaze direction and the angular distractor positions. If there were multiple distractors, the similarity measure was calculated at all time points where the distractors were active and the average over time was taken afterward. If the distractors were active simultaneously, the similarity measure was the time average of the maximum similarity over all distractors. The DistractorSim was not calculated in the cafeteria VEs, because there were no relevant point distractors there.
The second application of the similarity measure was to check for individual differences between participants. In this case, the similarity measure was applied to the angular difference between the gaze trajectories of the participants in a pairwise manner, providing one outcome for every different pair of participants. We call this the “BetweenParticipantSim”. To check the test–retest reliability, two gaze trajectories of the same participant were compared, so in this case the measure is called the “WithinParticipantSim”.
Results
Subjective Experience of the VEs
Analysis of listening effort
Listening Effort Ratings (ACALES scores) for the VEs, Separated by Age-Group.

Note. The VEs were rated on a 14-point scale, where 0 is no effort, 12 is extreme effort, and 13 corresponds to only noise. VE = virtual environment.
Analysis of IPQ
Mean Scores and Statistics for the Different Items of the Igroup Presence Questionnaire.
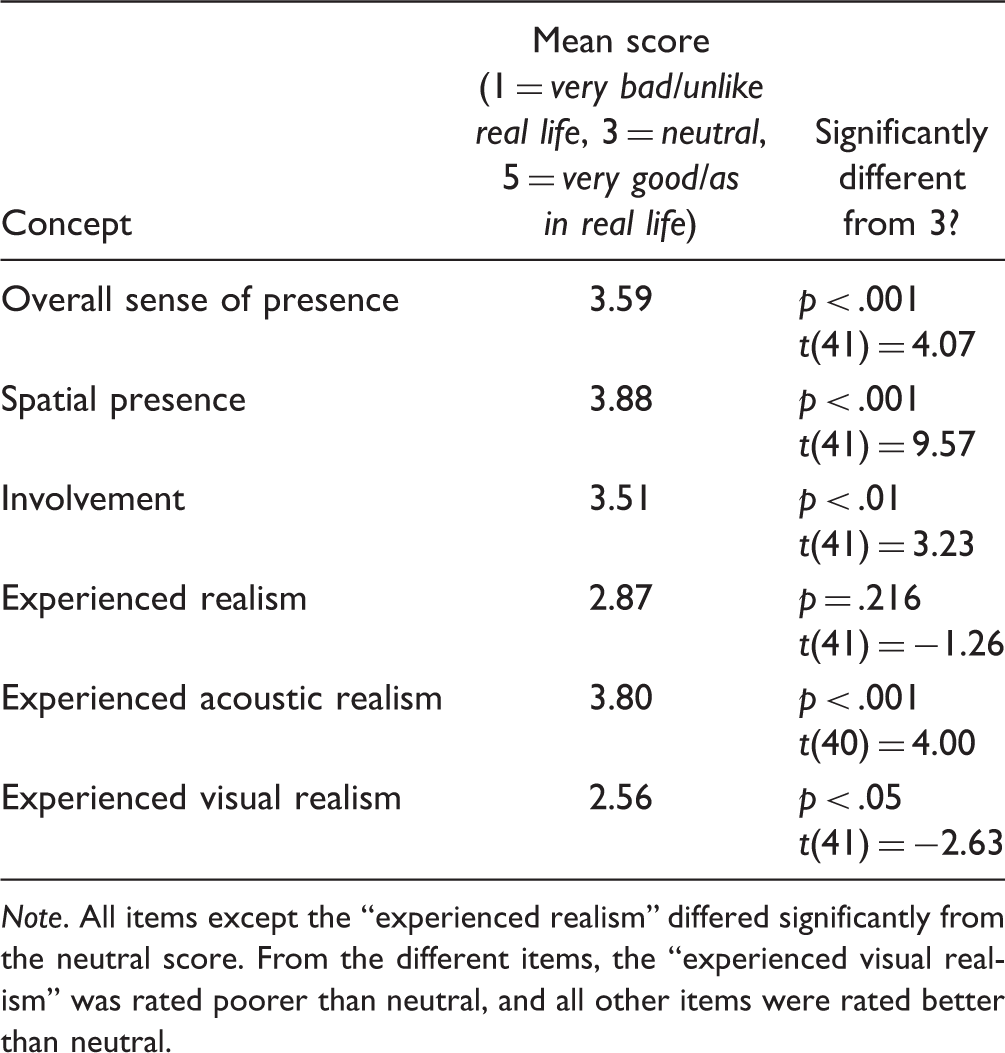
Note. All items except the “experienced realism” differed significantly from the neutral score. From the different items, the “experienced visual realism” was rated poorer than neutral, and all other items were rated better than neutral.
Analysis of open interviews
Participants' Votes for the Most and Least Realistic VEs, for the Younger Participants and Older Participants and Overall Percentage of Votes, per VE.

Note. Some participants voted for more than one VE and some could not make a decision, so the number of votes does not correspond with the number of participants. Those VEs based on real environments known to the participants (train station for both age groups, cafeteria for the younger participants) received more votes for being the most realistic VEs. VE = virtual environment.
The train station was rated as the most realistic VE by the majority of both the younger and older participants. As a common argument for this VE being realistic, the participants named the acoustic environment (28 participants). Also, some said that they recognized the environment or the situation (13 participants), as the VE was based on the Oldenburg train station. This recognition seems to be an important factor for experiencing realism, because the cafeteria, which was based on the cafeteria at the Oldenburg University natural sciences campus, also received many votes for being the most realistic VE from the younger participants (10 participants), many of whom were students of the Oldenburg University, and likely familiar with it. Three participants mentioned that they thought the train station was most realistic because the objects and people are further away there; when the objects are further away, the small details that are difficult to model are not that visible.
In addition to receiving many votes from the younger participants for being the most realistic VE (10 younger participants), the cafeteria also received the most votes from both younger and older participants (8 younger, 8 older) for being the least realistic VE. Many (14 participants) complained that the speakers in the target conversation were speaking too softly or that they were mumbling and that it was too difficult to understand. The older participants noticed this more than the younger participants (9 older, 5 younger). Because the target conversation was not recorded in background noise, there was no Lombard speech in the target conversation, and it was therefore close to reception threshold even though the signal-to-noise ratio was reasonable. Four participants even made a specific remark about this, saying that normally in such a situation people would adapt their voice and would not mumble. The street passive received as many votes from the younger participants as the cafeteria for being the least realistic VE (8 younger participants). Many, especially younger, participants (6 younger, 1 older) said that the movements made by the cars driving around the corner and the people walking by looked unrealistic. Other arguments for a VE being less realistic were, as for the cafeteria VE, that the loudness or difficulty did not feel right, that there were no or unrealistic mimic and gestures or that the objects in the VE looked unrealistic.
Test–Retest Reliability
The WithinParticipantSim (test–retest) and BetweenParticipantSim for the gaze trajectories were calculated in the different VEs (Figure 2) to check the test–retest reliability of the measured movement behavior of the participants (N = 10). The WithinParticipantSim in the cafeteria
dualtask
, cafeteria
listeningonly
, lecture hall, living room, and street
active
VEs was high (>0.8), indicating that in these VEs the participants behaved consistently. The BetweenParticipantSim was also high in these VEs, suggesting that all participants behaved similarly here. The WithinParticipantSim and BetweenParticipantSim for the train station and street
passive
VEs were much lower; here the participants behaved inconsistently. This could be due to the test method or it could be a property of the typical behavior in these VEs. The mean of the WithinParticipantSim was higher than the mean of the BetweenParticipantSim in all VEs.
Similarity measure based on the angular difference between gaze trajectories of test and retest (for 10 of the younger participants) for the different VEs. WithinParticipantSim values are on the diagonal (blue upper left value is the mean of the diagonal). BetweenParticipantSim values are the off-diagonal values, the mean of which is shown in the black box in the bottom-right corner. WithinParticipantSim and BetweenParticipantSim were lowest for the street_passive and train station environments.
Overall Test–Retest Correlations for All Measures and Their p Values.

Note. A significant test–retest correlation was found for all measures except for GazeDelay.
Movement Behavior
Statistical analysis of movement and similarity measures
The movement and similarity measures were calculated for the gaze trajectories in the different VEs for the different age groups. Principal component analysis showed that the first five principal components each explained more than 5% of the variance and that each measure had a coefficient of 0.23 or higher for at least one of these components. This means that all movement and similarity measures were important to explain the variance, so a statistical analysis was done for all of the movement and similarity measures. One mixed multivariate analysis of variance was performed for the GazeStd, GazeSpeedMean, and NGazeJumps measures, and a separate one for the HeadGazeRatio, HeadGazeRatio_excl_move, HeadGazeRatio_excl_behavior, and HeadGazeRatio_excl_smallangle measures, because there were two participants with missing values for the HeadGazeRatio (all data points excluded). Because the GazeDelay, DistractorSim, and TargetSim measures could not be calculated for all VEs, three separate mixed analyses of variance were done for these measures. The significance level was adjusted to 0.01 for all analyses to account for the number of comparisons. Age-group, gender, and whether or not the participant wore glasses were tested as between-subject factors. The environment type was tested as a within-subject factor.
Statistical Outcomes for the Main Effects of “Environment Type,” “Age-Group,” “Gender,” and “Wearing Glasses” on the Movement and Similarity Measures.

Note. Outcomes of significant effects are displayed in boldface. Significant first-order interaction effects are also listed. F values indicated with an asterisk had a significant sphericity according to Mauchly's test and were corrected with the Greenhouse–Geisser estimate of sphericity. The environment had a significant effect on all measures except for GazeDelay. The age-group and wearing glasses had a significant effect on HeadGazeRatio (older participants and subjects wearing glasses showed a larger value than younger participants). Gender did not show a significant effect on any of the measures.
Differences between environments
Paired comparisons revealed for which movement and similarity measures the VEs differed from each other (Figure 3). The individual and mean gaze trajectories for all participants in each VE are plotted in Figures 4 to 11. In the supplementary materials accompanying the database (Hendrikse, Llorach, Hohmann, & Grimm, 2019a), the gaze trajectory plots are provided for the younger and older participants separately. Differences between the VEs are described for each of the categories as mentioned in the expectations: VEs with frontal listening, VEs with multitalker conversation, and VEs where the participants were standing and the target was not visible or not specified.
Pairwise comparisons between VEs for the GazeStd, GazeSpeedMean, NGazeJumps, HeadGazeRatio, DistractorSim, and TargetSim measures. Plotted is the mean difference (row minus column VE) for each measure with stars indicating significant (<.01) p values. Only the lower triangle is plotted because the matrix is skew-symmetric. If the measure was not calculated in the VE, it was plotted in black. It can be seen that the train station and street_passive VEs differ from the other VEs for most measures. Gaze (head plus eye angle) trajectories for all participants in the living room VE. Individual data are plotted as gray lines; the black line and dark gray area show the mean trajectory and 15th and 85th percentiles. The position of the target (TV) is plotted in green. The position of the person commenting on the news is plotted in orange when this person is speaking.

The living room and the lecture hall VEs both represent situations with frontal listening. The gaze trajectories in the living room VE (Figure 4) show that most participants did not move at all and looked at the TV the whole time. In the lecture hall, however, participants moved significantly more (higher GazeSpeedMean and NGazeJumps), because they were looking back and forth between the lecturer and the presentation slides (Figure 5). After a change to a new slide in the presentation, most participants looked at the new slide. Moreover, most participants looked at the paper plane when it flew past, which can also be seen from the high DistractorSim. There were no differences in the HeadGazeRatio between the living room and the lecture hall VEs.
Gaze (head plus eye angle) trajectories for all participants in the lecture hall VE. Individual data are plotted as gray lines; the black line and dark gray area show the mean trajectory and 15th and 85th percentiles. The position of the target (lecturer) is plotted in green. Distractor positions are plotted in orange: Changes of slides are plotted as orange crosses at the position of the center of the screen and the position of the paper plane is indicated.
The cafeteria and street
active
VEs represent situations with a multitalker conversation. It can be seen that the participants closely followed the active speaker in the cafeteria
listeningonly
and street
active
VEs (Figures 6 and 9) and that, especially around the time instances of a speaker change, the behavior was synchronized (small area between 15th and 85th percentile). In the cafeteria
dualtask
VE (Figure 7), some participants looked at the active speaker (green line in the figure), but on average there was not much movement. This is reflected by the GazeStd, which was significantly lower than in the cafeteria
listeningonly
VE, and the NGazeJumps, which was significantly lower than in the street
active
VE. Also, the TargetSim was significantly lower than for the cafeteria
listeningonly
VE, indicating that the participants followed the active speaker less closely. However, the TargetSim was not significantly different from the street
active
VE, probably because some participants briefly looked at the distractors in the street
active
VE (Figure 8). The vertical gaze direction might also be different in the cafeteria
dualtask
VE, because the participants had to look at the Pegboard from time to time. The vertical eye angle could not be measured due to the limitations of the device (EOG), so we cannot know whether the participants were looking at the Pegboard. However, the pitch angle of the head (Figure 8) could indicate the vertical direction of the gaze; in the cafeteria
dualtask
VE, the participants pointed their head either in the same vertical direction as in the cafeteria
listeningonly
VE, or pointed their head down.
Gaze (head plus eye angle) trajectories for all participants in the cafeteria_listeningonly VE. Individual data are plotted as gray lines; the black line and dark gray area show the mean trajectory and 15th and 85th percentiles. The position of the active target speaker is plotted in green. Most subjects followed the active speakers with their gaze. Gaze (head plus eye angle) trajectories for all participants in the cafeteria_dualtask VE. Individual data are plotted as gray lines; the black line and dark gray area show the mean trajectory and 15th and 85th percentiles. The position of the active target speaker is plotted in green. The active speaker was not followed as much as in the single task condition (Figure 5). Angular histogram of the head pitch in the cafeteria_dualtask and cafeteria_listeningonly VEs. It can be seen that in the dual-task condition, the participants divided their time between looking straight ahead and looking down, whereas they always looked straight ahead in the listening only condition. Gaze (head plus eye angle) trajectories for all participants in the street_active VE. Individual data are plotted as gray lines; the black line and dark gray area show the mean trajectory and 15th and 85th percentiles. The position of the active target speaker is plotted in green. Distractor positions are plotted in orange, including labels.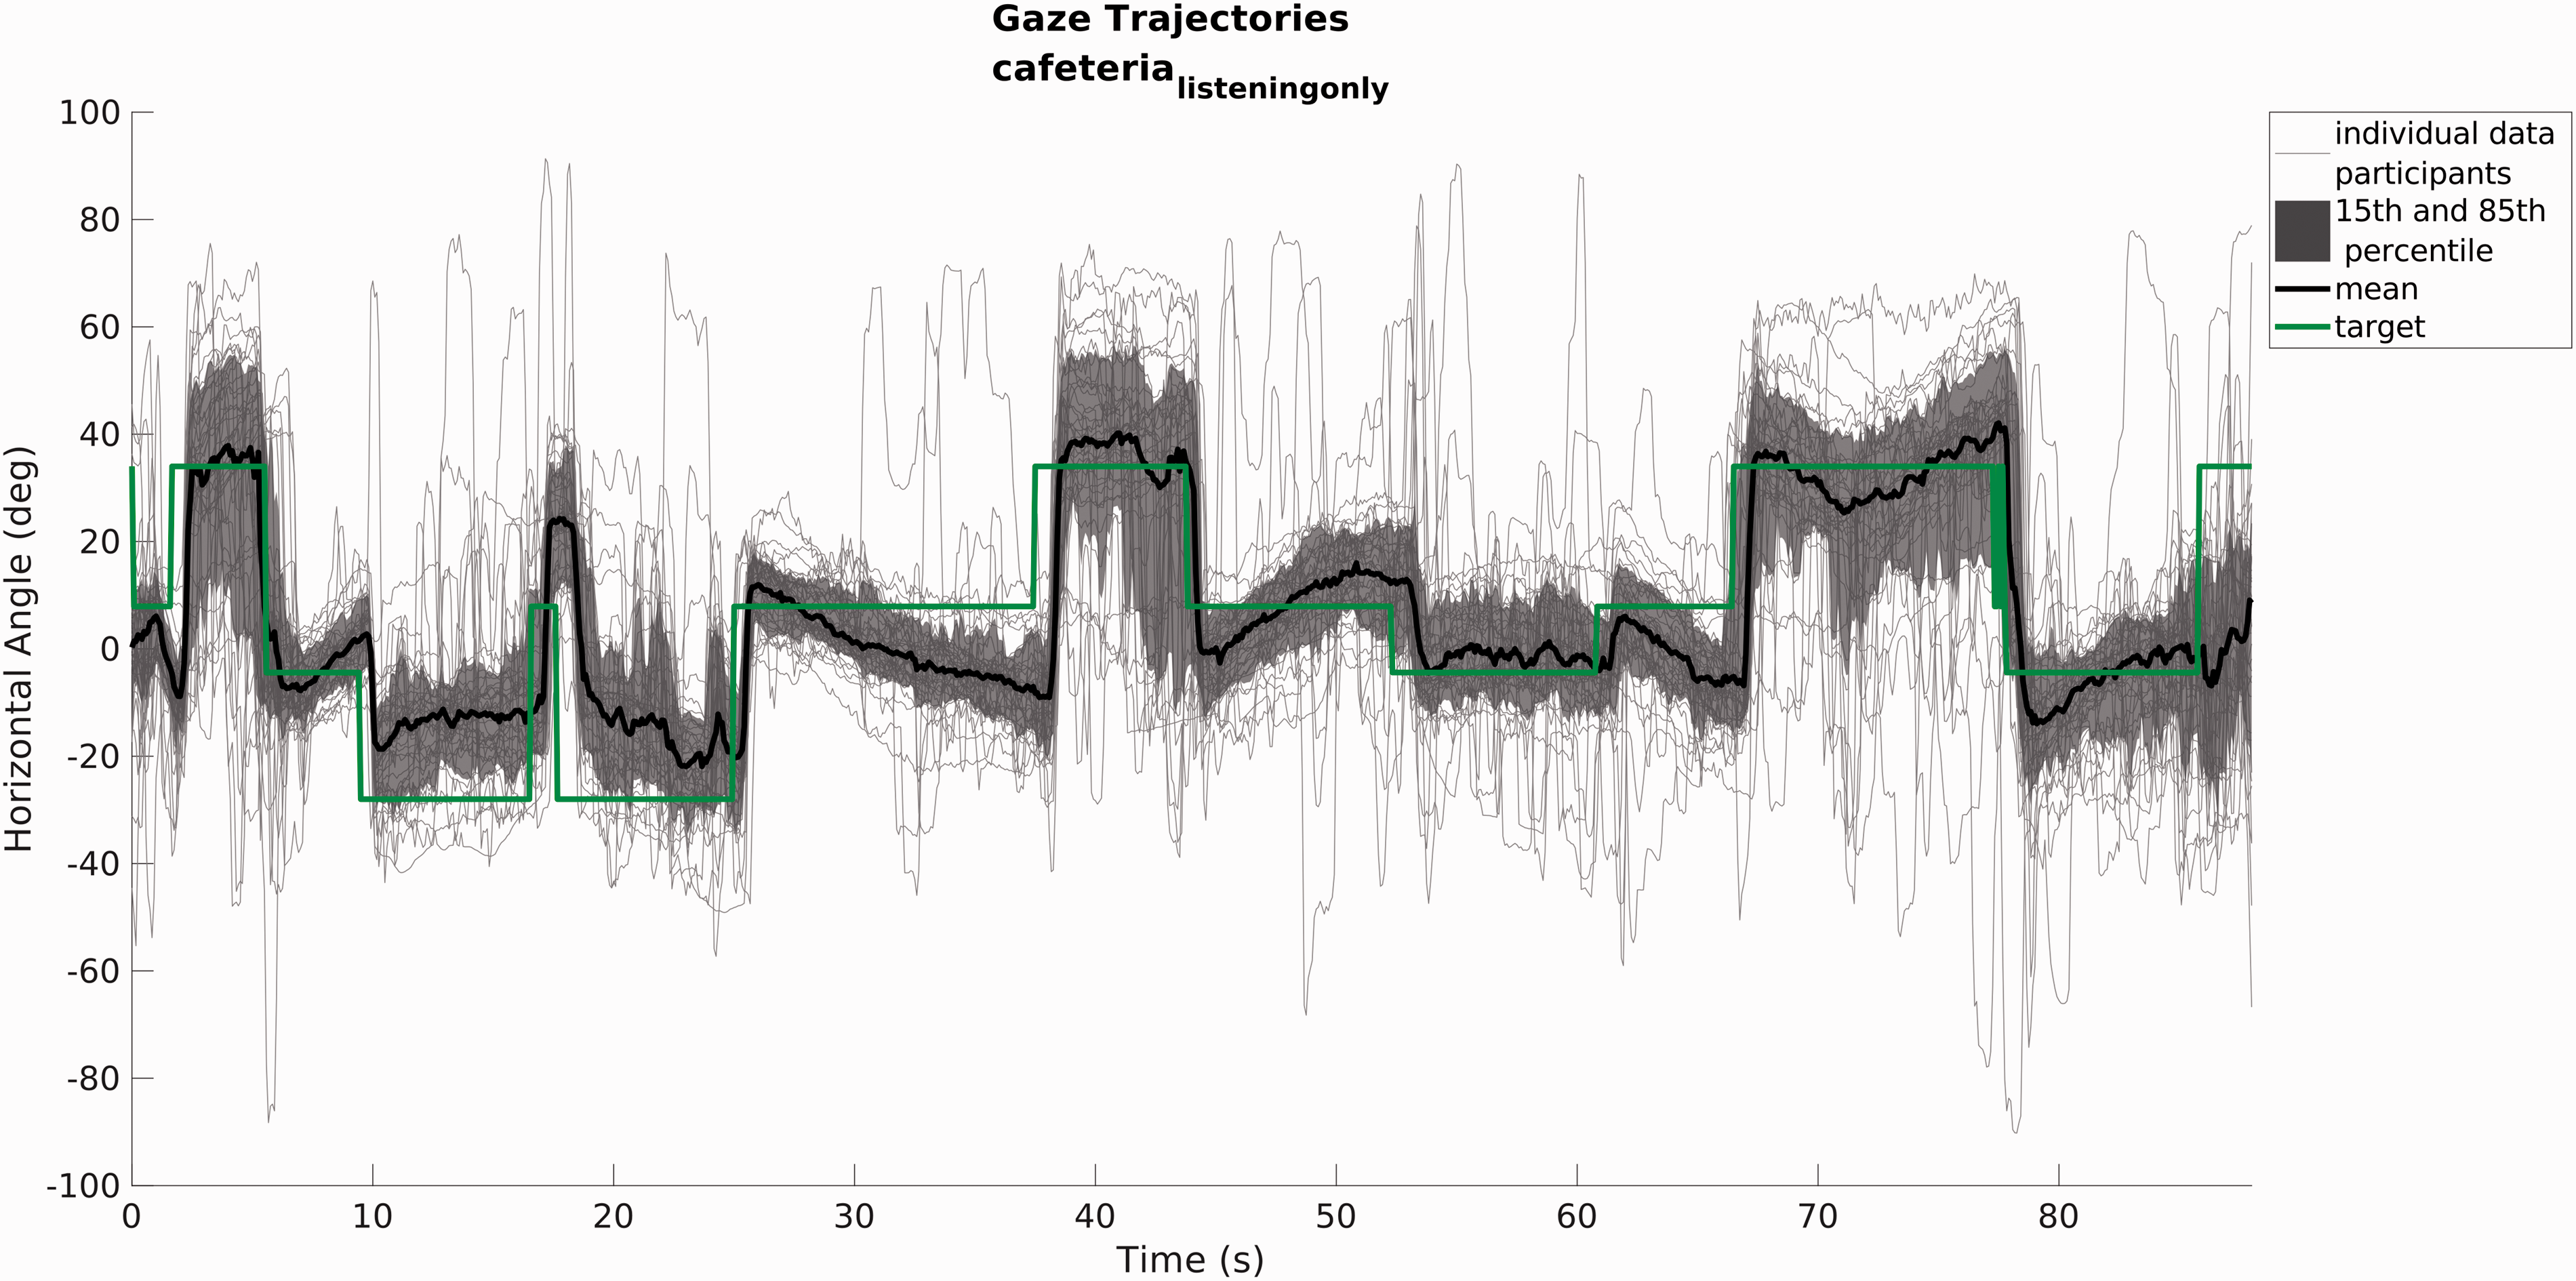


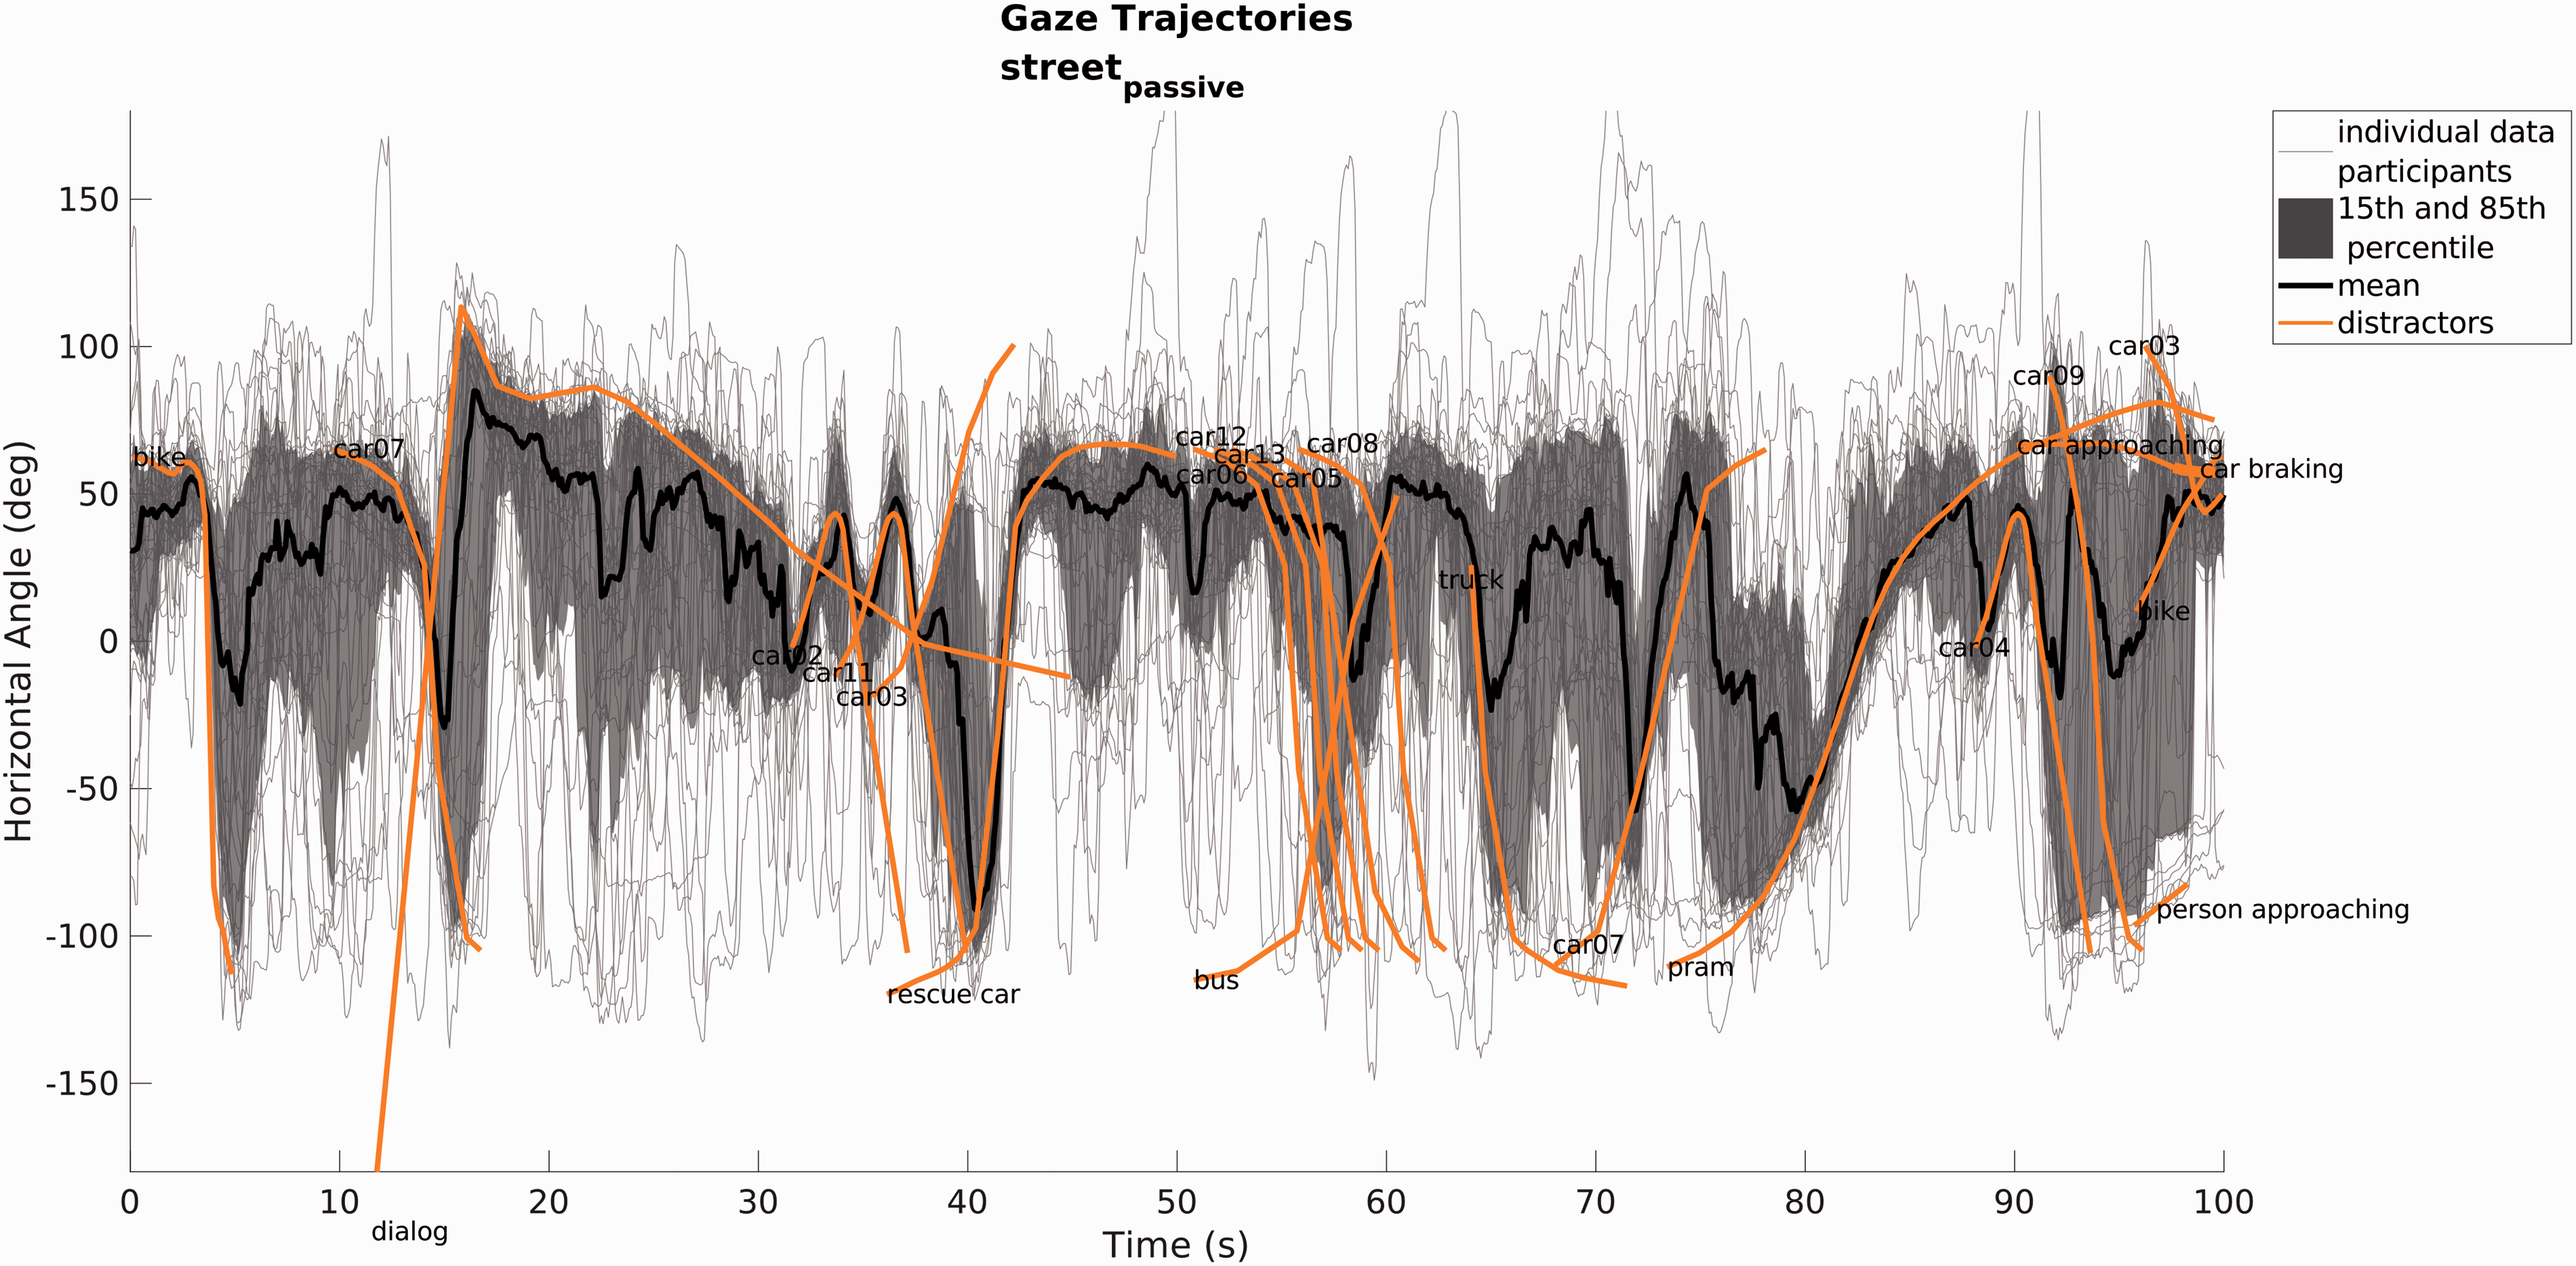
In the train station and street
passive
VEs, the participants were standing and the target was not visible or not specified. The gaze trajectories in these VEs (Figures 10 and 11) show that the participants made a lot of movements in different directions, as the area between the 15th and 85th percentile is large. In the street
passive
VE, the participants moved significantly more than in the train station VE (higher GazeStd, GazeSpeedMean and NGazeJumps). In some time periods, the participants moved similarly in these VEs, as indicated by the small area between the 15th and 85th percentile when certain distractors were passing by. The HeadGazeRatio was similar in the two VEs, but in the street
passive
VE, it was significantly higher than in most of the other VEs.
Gaze (head plus eye angle) trajectories for all participants in the train station VE. Individual data are plotted as gray lines; the black line and dark gray area show the mean trajectory and 15th and 85th percentiles. Distractor positions are plotted in orange, including labels. Gaze (head plus eye angle) trajectories for all participants in the street_passive VE. Individual data are plotted as gray lines; the black line and dark gray area show the mean trajectory and 15th and 85th percentiles. Distractor positions are plotted in orange, including labels. Some events (e.g., car02, car11, car03, rescue car, pram) triggered a similar movement for most participants.
Differences between participants
The statistical analysis (Table 7) revealed a significant main effect of the age-group on the HeadGazeRatio. The older participants had a significantly higher HeadGazeRatio than the younger participants, so on average they were doing more of the movement with the head than the younger participants. Moreover, the participants wearing glasses had a slightly higher HeadGazeRatio than the participants who were not wearing glasses, although the effect was insignificant. There was also a significant main effect of the age-group on the HeadGazeRatio_excl_smallangle: For the older participants, fewer data points were excluded because the gaze angle was too small. Pairwise comparisons of the Age-Group × Environment interaction effect revealed that this was the case for the lecture hall VE, F(1,34) = 8.1, p = .008, and living room VE, F(1,34) = 13.9, p = .001. So in these VEs, the older participants spent less time looking straight ahead than did the younger participants. Finally, there was a significant interaction effect between the environment type and the age-group for the DistractorSim. Pairwise comparisons revealed that in the street passive VE, the older participants had a significantly higher DistractorSim than the younger participants, F(1,36) = 12.8, p < .001. Thus, the older participants were following the distractors more closely in this VE.
In Figure 12, the distributions of the HeadGazeRatio and DistractorSim measures are plotted, to look for individual differences. There was no clearly visible clustering into behavioral groups. However, there were some outliers, according to the adjusted outlyingness measure of Hubert and Van der Veeken (2008). This analysis of outliers was also done for the other movement measures, revealing that there were some participants who seem to have moved a bit more and over a larger range than the others, in more than one VE. Likewise, there were also some participants who seem to have moved a bit less and over a smaller range than the others in more than one VE. It should be noted that all participants who moved a bit more and over a larger range (outliers) were older participants.
Outcomes of HeadGazeRatio and DistractorSim measures for the different VEs for the younger (dark gray) and older (light gray) participants. Individual data points are plotted as well as the distribution and the mean (red cross). Outliers were determined by calculating the adjusted outlyingness after Hubert and Van der Veeken (2008) and are marked with a blue “x,” including the participant number. The older participants had a higher HeadGazeRatio than the younger participants (top panel), indicating that the older participants did more of the movement with their head. The older participants also had a higher DistractorSim in the street_passive VE (bottom panel), indicating that they were looking more closely at the traffic passing by in this VE.
There may also have been participants who had some environment-dependent behavior that was different from the behavior of the other participants. To investigate this, the BetweenParticipantSim was calculated for each pair of participants in each of the VEs. The resulting matrices are plotted in Figure 13. The mean similarities for the living room (0.95), cafeteria
listeningonly
(0.92), cafeteria
dualtask
(0.89), street
active
(0.88) and lecture hall (0.82) VEs were high, so participants seem to have behaved similarly in these VEs. However, some darker lines can be seen in the matrices of Figure 13 for these VEs, corresponding to participants that had a lower similarity than the other participants and may have behaved differently. The train station (0.58) and street
passive
(0.64) VEs clearly had much lower mean similarities, so there were more individual differences in the participants' behavior in these VEs. Nevertheless, there were time instances for the street
passive
VE where there was synchronization in the gaze behavior (Figure 11). To check what the movement behavior of the outliers in the BetweenParticipantSim was, the gaze trajectories of the outliers were compared with the other participants. The outliers in the BetweenParticipantSim measure were partly the same outliers for the movement and target-distractor similarity. These outliers showed the same gaze trajectory patterns as the others but their movement and range had extreme values in some VEs.
Pairwise between-subject similarity measure (BetweenParticipantSim) based on the angular gaze difference for all VEs. Outlier detection was done using the adjusted outlyingness for skewed data, after Hubert and Van der Veeken (2008); possible outliers are indicated in red (similarity below median) and blue (similarity above median). BetweenParticipantSim was lower in the train station and street_passive VEs. Some participants seem to have behaved differently from the others (dark lines in cafeteria_listeningonly and street_active).
Head, eye, and torso rotation
In Expectation Angular histograms of the torso (orange), head (blue), and gaze (green) rotation in the (from top to bottom) train station, street_passive, street_active, and living room VEs, plotted for the younger (left) and older (right) participants separately. Participants rotated their torso more in the standing VEs (top three panels) compared with the sitting VE (living room). In the street VEs, older participants moved their torso more than the younger participants.
We saw significant differences in HeadGazeRatio between the younger and older participants in the living room and street active VEs. To determine whether there was also a difference in torso rotation between the two age groups, the angular histograms for the two age groups are plotted separately (Figure 14): The older participants moved their torso more than the younger participants in the train station and both street VEs. Finally, the significantly larger HeadGazeRatio for the older participants in the living room and both street VEs was confirmed by these angular histograms, because the older participants had larger off-axis peaks for the head rotation, whereas the angular histograms for the gaze look similar.
Angular histograms of the other VEs can be found in the supplementary materials accompanying the database (Hendrikse et al., 2019a). Because the participants were seated in the other VEs, there was only very little torso movement.
Discussion
Subjective Experience of the VEs
The analysis of the IPQ showed that, as expected (
The participants rated their experience of acoustic realism on the positive end of the scale, but they rated their experience of visual realism on the negative end of the scale. Thus, there is room for improvement here. The open interview confirmed that a realistic acoustic VE was the most important argument for experiencing a VE as realistic and revealed some specific points for improvement.
Most importantly, the participants complained that the conversation in the cafeteria VEs were too soft and unclear. This is in line with the listening effort ratings that were unrealistically high for the cafeteria VEs. The reason for this is that the recorded conversation was not Lombard speech. The conversations in the cafeteria should therefore be replaced with conversations that have Lombard speech. Moreover, participants commented about some objects looking unrealistic, but this was only noticed if the objects were close. Therefore, VEs where the objects were further away (i.e., train station) were seen as more realistic. Bishop and Rohrmann (2003) suggest that these details might also be less critical if people are familiar with the real environment on which the VE was based, because they only need to be reminded of the environment and can fill in the rest with their memory or imagination. This could also explain why the train station and cafeteria VEs were rated as more realistic, because they were based on real environments. It could be argued that not too much detail should be added even if the VE is not based on a real environment, to allow room for the imagination of the participants. However, care should be taken that the VEs are not too empty. Finally, the movements of the objects and mimic and gestures of the animated characters were seen as unrealistic. There is definitely room for improvement here, but it takes a lot of time and effort to improve these animations.
Test–Retest Reliability
The WithinParticipantSim (test–retest) showed that in the train station and street
passive
VEs, the participants behaved inconsistently. In all other VEs, the participants behaved similarly for the test and the retest, as expected (
The test–retest results give reason to doubt the test–retest reliability of the GazeDelay measure. All other measures showed significant correlations between the outcomes for the test and the retest, as expected (
The similarity plot with the test–retest data (Figure 2) shows not only the WithinParticipantSim but also the BetweenParticipantSim. The average WithinParticipantSim was higher than the BetweenParticipantSim in all VEs. This shows that the similarity measure is reliable, because the differences within participants are expected to be smaller than the differences between participants if there are behavioral differences between participants.
Movement Behavior
Environment-dependent movement differences (E3)
The participants' movement differed depending on the environment. As expected, in the VEs with multitalker conversations (both cafeteria and street active VEs), the gaze direction of the participants followed the speaker changes and they were moving similarly during these speaker changes. However, in the cafeteria dualtask VE, the participants looked less closely at the active speaker, because they were also looking at the Purdue Pegboard. Whether the participant was standing or sitting in the multitalker VEs made a difference in the range of torso rotation, as shown in the street active VE, where participants had a larger range of torso rotation. This is in accordance with our expectation. The torso rotation was also larger in the other standing VEs (train station and street passive ), although this could have been because there was no discrete target and there were multiple audiovisual distractors from different orientations.
For the VEs with more frontal listening (living room and lecture hall) on the other hand, little gaze movement was expected. For the living room, this was partly true: The participants looked at the TV almost the whole time, but some participants looked occasionally in another direction (probably due to the distractors). For the lecture hall, the participants exhibited quite a lot of gaze movement, because the participants looked back and forth between the lecturer and the presentation slides. In the lecture hall, the participants were moving similarly when the paper plane flew past.
In the train station and street passive VEs, a larger range of gaze direction was expected, because there were no clear targets, and there were distractors in many different directions. The results show that the participants indeed made more gaze movements and over a larger range than in the other VEs. In the street passive VE, the participants were moving similarly during almost all time periods in which distractors were passing, and in the train station, only when the trolley moved past.
Individual movement differences (E4)
From the movement and similarity measures, no behavioral groups could be identified within the age groups. Although the low BetweenParticipantSim in the train station and street passive VEs hinted that there could be behavioral groups, the test–retest data showed that the participants behaved inconsistently in these VEs, so the differences were probably not related to different movement strategies.
There were significant differences between the age groups in the ratio of head movement to eye movement (HeadGazeRatio). Namely, the older participants preferred to use head rotations more than eye movements in comparison with the younger participants. This confirms the preliminary results of Lu et al. (2018). The older participants also made more torso movements in the VEs where they were standing. Isler, Parsonson, and Hansson (1997) showed that older adults often suffer from a restricted range of head rotation, with an average decrement of about 25° for adults aged 60 years or older compared with adults younger than 30 years. The increased torso movement might thus be necessary to compensate for this decrement.
Wearing glasses was found to have a small effect on the HeadGazeRatio. Although this effect was insignificant, it could play a role and should therefore be taken into account in future analysis. Participants wearing glasses also tended to prefer head rotations more than eye movements compared with participants without glasses. The reason for this could be that the glasses limit the maximum possible eye angle.
Furthermore, the older participants followed the distractors in the street passive VE more closely, but this was not found in other VEs, so there is insufficient evidence to say that older adults have a heightened distractibility.
Finally, all participants who moved more and over a larger range than the rest (outliers) were older, possibly indicating that older participants are prone to move more than younger participants. This is also supported by the finding that the older participants had significantly fewer data points excluded from the calculation of the HeadGazeRatio due to a gaze angle smaller than 10° (HeadGazeRatio_excl_smallangle). Thus, they were moving more out of this range than the younger participants. However, this was not true for all older participants, otherwise the movement measures related to the amount of movement and the range would have shown significant differences between age groups.
Consequences for Hearing Aid Research
This study measured only the movement behavior of normal-hearing listeners. Hearing-impaired listeners and hearing-aid users could move differently, and this needs to be investigated in future studies. This section makes predictions about the consequences for hearing aid research based on the measured behavior for normal-hearing listeners. The predictions are therefore speculative.
Static beamformers or directional microphones are common hearing aid algorithms that work by amplifying sound coming from the frontal direction with respect to the head. Dillon (2001) provides an overview of such algorithms, and Elko and Pong (1995) and Rohdenburg, Hohmann, and Kollmeier (2007) provide specific examples. This study shows that older people move their head more than younger people when looking in the same direction. This suggests that static beamformers would work better for older than for younger people, because their head is turned more toward the gaze direction (where the target usually is). In addition, there was a lot of variance in the eye–head relationship (HeadGazeRatio) between participants even within the same age-group (Figure 12), which is an indication that a static beamformer would work better for some people than for others. However, the average HeadGazeRatio for the older participants was still only 0.57, which means that on average they did 57% of the movement with their head (the rest with their eyes). Thus, there is still a considerable mismatch between head and gaze direction. Moreover, there are situations, as shown in the cafeteria dualtask VE, where the participants looked only briefly at the target speaker. In such situations, a static beamformer would probably perform poorly, because the head is not turned in the target direction. The database presented here can be used to investigate how big the benefit of such a static beamformer still is in realistic everyday environments.
Important consequences for hearing-aid algorithms that predict spatial auditory attention based on the gaze movement behavior also follow from this study. The analysis of movement behavior shows that gaze behavior is very predictable when listening to multitalker conversations (cafeteria listeningonly and street active ) or when there is frontal listening (living room). In these VEs, the participants looked at the target source most of the time, so determining the spatial auditory attention based on the gaze direction would work well here. Problems could arise when people have to do another task simultaneously, such as the Purdue Pegboard task in the cafeteria dualtask VE. In the cafeteria dualtask VE, the participants looked at the Pegboard most of the time, and the algorithms probably would have trouble determining the spatial auditory attention. Moreover, the participants did not look at the target when it was coming from loudspeakers (in the train station or lecture hall). Thus, determining the spatial auditory attention based on the gaze behavior is difficult here, too. In the lecture hall, there was also direct sound from the lecturer. The participants did look not only at the lecturer but also at the screen to see the presentation slides. However, hearing aids could work with a tele-coil here and predicting the spatial auditory attention based on the gaze behavior might not be necessary in the lecture hall. Furthermore, it could be seen that the participants were distracted easily, and most participants looked at the distractors briefly or somewhat longer (paper plane in lecture hall, woman commenting on news in living room, traffic in street active , and trolleys in train station VE). The algorithms have to take this into account, so that the estimated spatial auditory attention remains on the target source.
Finally, the participants moved a lot in the street passive VE. Although it is unclear what a hearing aid should do in a passive listening scenario, this could affect the classifier of a hearing aid that determines which program to use. As the amount of movement was the most, and unique, for the passive listening scenario, this knowledge could be used to improve the classifier.
Conclusion and Outlook
In this article, realistic audiovisual VEs were described that try to mimic everyday situations with a high relevance for younger and older normal-hearing and hearing-impaired persons. The VEs were designed so that they cover a large range of different target and distractor sources.
The data show that reproducible and reliable measurements of movement behavior are possible in the VEs and that the VEs allow participants to imagine being in the real situation. Furthermore, movement behavior was found to be highly individual, but predictable in multitalker conversations and for moving distractors. Significant effects of relevant factors such as age-group or type of environment on the movement behavior were found. Taken together, these findings suggest that the proposed VEs and test methods may be used to gather valid movement data in the tested complex acoustic communication conditions.
The data predict that the performance of hearing-aid algorithms may be influenced by listener movement. Although speculative, because hearing aid users may behave differently, the measured movement data predict that the performance of beamformer algorithms may be reduced in specific listening conditions and reveal listening situations that may be challenging for algorithms that estimate spatial auditory attention based on the gaze direction.
A database has been published containing the VEs and data from this article (see next section). We have shown that this database contains reliable data that may be useful for the development and evaluation of hearing aid algorithms. In this study, the movement behavior of normal-hearing participants was analyzed. These data establish the reference for future studies that will investigate the movement behavior of hearing-impaired listeners and hearing aid users for comparison. We hope that the VEs will be an inspiration for other researchers to develop more realistic test environments in the laboratory in the future.
Database and Audiovisual Environments
The audiovisual environments that were used in this study and the database of movement behavior and EEG that was created were made publically available. The database of movement behavior and EEG can be found under DOI: 10.5281/zenodo.1434090 (Hendrikse et al., 2019a). The virtual environments are published under DOI: 10.5281/zenodo.1434115 (Hendrikse, Llorach, Hohmann, & Grimm, 2019b).
Footnotes
Acknowledgments
The authors thank the associate editor, Michael Akeroyd, and the two anonymous reviewers for their helpful comments.
Declaration of Conflicting Interests
The authors declared no potential conflicts of interest with respect to the research, authorship, and/or publication of this article.
Funding
The authors disclosed receipt of the following financial support for the research, authorship, and/or publication of this article: This study was funded by the Deutsche Forschungsgemeinschaft (German Research Foundation)—project 352015383—SFB 1330 B1 and by European Union’s Horizon 2020 research and innovation program under the Marie Sklodowska-Curie grant agreement No. 675324 (ENRICH).