
Abstract
The German short form of the Speech, Spatial, and Qualities of Hearing Scale (SSQ) was administered in a cross-sectional study based on stratified random samples complemented by audiometric tests and a general interview. Data from 1,711 unaided adults aged 18 to 97 years were analyzed in order to determine a distribution of hearing abilities considered as normal and the main factors that impact self-assessments. An innovative mathematical approach was used to overcome the constraints of statistics based on the mean. Quantile regression analysis yielded a benchmark distribution of SSQ scores that might support audiologists in setting realistic SSQ score targets and estimated how the effect of auditory and nonauditory factors changes across the distribution of SSQ scores. Regression models showed significant effects for nonauditory factors on SSQ ratings when controlled for pure-tone hearing and interaural asymmetry. Self-reporting of hearing difficulties, when asked in general terms, was substantially related to SSQ ratings. This effect was observed in both high and low scoring participants and led to a considerable score decrease in all SSQ subscales. Gender, educational level, and self-reporting of health issues also were significantly related to SSQ ratings, but the corresponding effects were regularly unbalanced across the score distribution and particularly large at lower quantiles. The estimated effects of age, however, were mostly small in size, inconsistent regarding the direction, and failed significance for all SSQ items. Overall, the results suggest that nonauditory factors and cumulative effects must be considered when evaluating rehabilitative interventions against an ideal outcome.
Introduction
Audiologists would hardly dispute that hearing rehabilitation is a multidimensional process. Rather, the interdisciplinary debate revolves around theoretical and methodological issues related to improving the rehabilitative practice for the benefit of persons with hearing impairment. Benefit is a comprehensive term, but it certainly includes ameliorating hearing disabilities to approximate a state considered as normal—although this state may never be reached. In this context, questionnaire-based measures receive particular attention for monitoring subjective perceptions and for evaluating rehabilitative interventions. The Speech, Spatial, and Qualities of Hearing Scale (SSQ) is among the most prominent of these questionnaires. Gatehouse and Noble (2004) developed the SSQ questionnaire, based on a sample of 153 hearing-impaired adults not fitted with hearing aids. The SSQ comprises 50 items describing everyday situations involving listening tasks. The respondents rate how well they can accomplish the task using a visualized scale ranging from 0 to 10, which corresponds to “not at all” and “perfectly” for most items. In the meantime, the SSQ has been translated into several languages and edited to various short forms. The properties of the SSQ questionnaire have been carefully analyzed and discussed during this time, yet still not examined in the general population. Thus, the current analysis basically addressed three research questions: First, SSQ was used in a large population-based sample to derive a benchmark score distribution that might support audiologists in interpreting SSQ profiles during the hearing rehabilitation process. Second, the relationship between self-reported hearing difficulties, if asked in general terms, and SSQ scores, was examined. Third, the effect of pure-tone thresholds, age, gender, educational level as well as the report of hearing difficulties, tinnitus, ear diseases, and a rather poor general health condition on SSQ scores was analyzed. Parametric statistics would tend to produce biased results, because their fundamental assumptions are rarely met. Therefore, quantile regression as an appropriate approach was used, to deal, for example, with nonnormal and heteroscedastic data distributions (see Kneib, 2013, for a comprehensive overview of methods beyond regression to the mean). To our knowledge, quantile regression has been underused in hearing research so far. Guest, Boggess, and Attia (2012) used quantile regression to examine the relative risk of elevated hearing thresholds in technical aircraft personnel compared to normative populations. Flamme and Deiters (2016) established the distribution of hearing thresholds as a function of age, gender, and other factors using a quantile regression approach.
Population statistics on SSQ have been reported in a few earlier studies. Aiming to describe an ideal outcome for clinical interventions in hearing rehabilitation, Noble, Naylor, Bhullar, and Akeroyd (2012) took a population-based approach. They sent a six-item SSQ short form (ssq6), together with other questionnaires, to randomly selected adults. Retrospectively, age range was limited to 50- to 80-year-old adults, to form eight stratified samples with approximately 50 adults each, according to age, self-reported hearing difficulties, and low versus high SSQ score. In the general population, high abilities were assumed if the ssq6 mean score exceeded 6.5 scale points and was used for stratification. Other studies focused mainly on young, normal-hearing students to define a benchmark for rehabilitative goals. Banh, Singh, and Pichora-Fuller (2012) compared SSQ ratings of 48 students from a psychology study course (mean age: 19 years) to the ratings given by 48 randomly selected elderly adults (mean age: 70 years) with comparatively good pure tone thresholds (better than the corresponding median described by ISO 7029:2000). They used a rule of thumb based on the between-group difference score. Differences greater than 1.4 scale points were regarded as noteworthy. Similarly, Demeester et al. (2012) contrasted SSQ scores in 103 normal-hearing students (mean age: 20 years) to SSQ scores in elderly adults (mean age: 63 years), including 24 adults with clinically normal thresholds. The mean scores derived in this Dutch student group matched the results of Banh et al. (2012) rather well. Demeester et al. (2012) set SSQ disability cut-off points at two standard deviations (SD) from the mean SSQ scores derived from the student group. Olsen, Hernvig, and Nielsen (2012) examined the effect of unilateral hearing loss. For reference, they assembled 97 normal-hearing adults from family, students, and friends (18–66 years, median: 27 years). Ability ratings more than 2 scale points lower than in the reference group were regarded as the minimal, clinically important difference. Zahorik and Rothpletz (2015) displayed the score distribution of SSQ items derived from 233 students (median age: 21 years) in box-percentile plots and marked corresponding mean scores reported by, for example, Banh et al. (2012) and Demeester et al. (2012). Since a negatively skewed score distribution can be assumed in normal-hearing samples, the mean score is expected to be lower than the median. For most items, however, the results of Zahorik and Rothpletz (2015) indicated a median score lower than the mean published by both Banh et al. (2012) and Demeester et al. (2012). Moulin, Pauzie, and Richard (2015) included 100 students (mean age: 21 years) next to 216 hearing-impaired adults (mean age: 54 years) in their comprehensive study on the validation of the French SSQ. In young adults, they observed significantly lower scores for 21 of the 46 items than those reported by Demeester et al. (2012) and by Banh et al. (2012) for a similar population, particularly in the spatial subscale. In general, such ability assessments are likely to be influenced by nonauditory factors. On a large population-based sample, the association between subjective and objective hearing was found to be significantly influenced by, for example, gender, age, and education (Kamil, Genther, & Lin, 2015). Therefore, it is critically important to define benchmarks based on groups that are rather homogenously composed in social terms.
With regard to auditory factors that influence SSQ ratings, the effects of audibility and asymmetric thresholds have been thoroughly examined. Obviously, audibility is the key for the interpretation of self-assessed hearing abilities, although Gatehouse and Noble (2004) tried to design settings where audibility would not be the “primary issue.” SSQ scores were mostly significantly correlated with better-ear pure-tone thresholds in hearing-impaired samples (e.g., Akeroyd, Guy, Harrison, & Suller, 2014; Gatehouse & Noble, 2004; Moulin & Richard, 2016), but not in subclinical samples (Moulin & Richard, 2016; Singh & Pichora-Fuller, 2010). Banh et al. (2012) found no correlation between SSQ scores and pure-tone hearing in young normal-hearing subjects, but isolated counterintuitive correlations for elderly normal-hearing subjects (poorer hearing thresholds and higher ability). Olsen et al. (2012) did not find statistically significant correlations between pure-tone hearing and SSQ subscale scores both for adults with normal-hearing and for those with unilateral hearing loss. Furthermore, Demeester et al. (2012) analyzed audiogram configurations, but found no effects on SSQ ratings in hearing-impaired adults. Citing earlier studies, the authors emphasized that, in general, disability measures like the SSQ seem to show only weak correlations to impairment measures such as pure-tone audiometry. The effect of asymmetric hearing on SSQ scores, particularly on the spatial items, is widely recognized (e.g., Dwyer, Firszt, & Reeder, 2014; Gatehouse & Noble, 2004; Moulin & Richard, 2016; Noble & Gatehouse, 2004; Olsen et al., 2012; Vannson et al., 2015).
Among the nonauditory factors that possibly influence SSQ ratings, age is the most discussed. Banh et al. (2012) and Demeester et al. (2012) found, overall, lower scores in healthy, normal-hearing elderly than in young adults; this was particularly pronounced in the speech subscale and not satisfactorily explained by audibility measures. For hearing-impaired adults, Moulin and Richard (2016) observed a tendency toward an age effect, whereby the authors additionally considered gender and education as possible influencing factors. They found associations between SSQ ratings and years of education for various items and noted an effect of gender based on the speech-to-spatial differential subscale score.
In sum, the SSQ questionnaire and its properties, including various short forms, has mostly been examined in tailored study samples. Going for a benchmark approach, students from similar study programs were often recruited, resulting in rather homogenous study samples when seen from the social perspective. Moreover, contrasting normal-hearing to clearly clinical samples emphasizes the differences and thus ignores the fact that to some extent hearing loss and the associated disabilities are incremental phenomena in the general population. Therefore, this contribution takes up findings from previous studies to explore the impact of auditory and nonauditory factors on SSQ ratings in a population-based sample.
Methods
Study Population
Data were collected in the cross-sectional hearing study HÖRSTAT conducted between 2010 and 2012 in northwest Germany (von Gablenz, Hoffmann, & Holube, 2017; von Gablenz & Holube, 2015, 2016, 2017). Random samples stratified by age and gender from two medium-sized towns were balanced to approximate the national sectorial distribution of industry and crafts, services, and administration. The response rate was low in young age bands below 40 years (12%) and above 80 years (21%), but fairly high in middle-aged and elderly adults from 40 to 79 years (30%). The overall response rate was 21% (von Gablenz & Holube, 2015). In total, 1,903 noninstitutionalized adults completed comprehensive hearing tests and passed a standardized interview that addressed, for example, education, occupation, net equivalent income, noise exposure, health, and ear-related disorders.
Exclusion criteria for the subsequent analysis were missing or invalid pure-tone threshold data at the octave frequencies from 250 Hz to 4 kHz (n = 37), missing SSQ17 (n = 24), inconsistent report in the general interview (n = 3), and insufficient reading and communicative skills (n = 1). Further, 111 adults used hearing aids to compensate for mostly mild and moderate hearing impairment due to the pure-tone average at 0.5, 1, 2, and 4 kHz (PTA4) exceeding 25 dB HL in the better ear. Data for hearing aid users were excluded from analysis to avoid a mismatch between ability ratings relating to an aided condition and audiometric measures relating to an unaided condition. However, SSQ17 data of hearing aid users were compared against the benchmark score distribution derived in the study sample.
In total, this analysis included data from 1,711 adults aged 18 to 97 years, 765 males and 946 females. The distribution of age and gender in the study sample approximates the distribution in the general population. Figure 1 shows the study group’s distribution by gender and age in comparison to the European Standard Population (2013; Eurostat).
Distribution of age and gender in the study sample compared to the ESP of equal gender proportions. ESP = European Standard Population.
Middle to older age-groups were overrepresented in our sample. The social composition was biased toward higher social status groups according to the skill level assigned by the International Classification of Occupations (ISCO-08, 2012; von Gablenz & Holube, 2017). ISCO Skill Level 4 (highest) was ascribed to 36% of the participants in the study sample, followed by 19% and 35% assigned to Skill Levels 3 and 2, respectively. The lowest skill level was represented by only 3%. As occupational positioning is often still underway in the young age-groups, social stratification according to ISCO failed in 8% of the cases. Therefore, stratification was based on school education, which, additionally, favors comparability to the results of Moulin and Richard (2016). School education was aggregated to three levels according to the national educational system: basic, intermediate, and high level. To classify atypical school education, occupational information was also used for classification. In the total sample, 53% attained high, 27% intermediate, and 20% basic education.
Hearing impairment, defined as PTA4 > 25 dB HL in the better ear, affected 179 participants (11%) and both genders alike (two-sided Pearson Empirical cumulative functions of PTA4, low and high PTA in the study sample. PTA = pure-tone average.
SSQ17 Short Form
The German SSQ short form (SSQ17) was developed and evaluated by Kiessling, Grugel, Meister, and Meis (2011). The speech, spatial, and qualities subscales of the original SSQ were reduced to five items each. Following the original numbering (Gatehouse & Noble, 2004), the SSQ17 includes the speech items (1.4, 1.5, 1.7, 1.9, and 1.10), the spatial items (2.5, 2.6, 2.7, 2.9, and 2.12), and the quality items (3.3, 3.4, 3.8, 3.9, and 3.10), complemented by the items “understanding speech in quiet” (#1.2) and “listening effort” (#3.18). The SSQ17 items and the match to international short forms are given in Supplement Table 1s. Please note that the German short form is cited under the acronym “SSQ15” in some publications. The participants received the questionnaire together with the HÖRSTAT invitation letter and were asked to return the completed SSQ17 during the examination appointment.
Missing Values
Based on items, 28,613 valid assessments of the 29,087 response possibilities (1,711 × 17 items) were given in the completed questionnaires. This corresponds to an overall missing values rate of 1.6% (1.0% classified as not applicable and 0.6% no response). The three highest missing values rates pertain to the spatial items #2.5 (6.4%), #2.9 (4.1%), and #2.12 (2.9%). Missing rates were lowest for qualities items.
On a subject basis, 84% assessed every single item, 10% returned the questionnaire with one missing value, and 6% left two and more items without assessment. Multiple binary logistic regression was performed with “at least one missing value” as the outcome variable and age (categories: <40, 40–59, and 60+ years), gender, school education, and hearing impairment as predictor variables. Missing values increased with age with odds ratio (OR) of 1.5 and were, by the age of 40, more likely in females than in males with OR = 1.7 and 2.1, respectively. OR met the significance criterion set by the upper and lower limit of the 95% confidence interval (CI) located either below or above 1.0. In this analysis, missing values are dealt with by imputation through regression with error. Regression models were constructed to predict values for each single item. The remaining 16 single items were included as covariates. Similarities in the answers were used for a more accurate prediction of missing items. These regression models had adjusted R2 of .53 to .77. Further covariates were not included, as they needed to serve as covariates in the subsequent analyses to also estimate dependencies from the imputed values. Finally, a normally distributed error to the imputed values was added to impede an overall decrease of variance.
No missing values were found for item #3.18. For all other items, 10% to 56% of the missing values were imputed, which reduced the overall missing rate to 0.6%.
Statistical Analysis
Quantile regression
In a classical multiple regression model

In contrast, a quantile regression model extends the ordinary regression beyond the mean, to capture effects of covariates in all parts of the distribution of the response variable y (Koenker, 2005; Koenker & Bassett, 1978). The basic assumption in a quantile regression model is that for a prefixed quantile level τ, the τ-quantile of the residuals is also zero. The same regression model is then estimated for multiple quantiles


As the minimum of the loss function cannot be obtained through direct calculations, the estimated regression coefficients usually result from a linear programming numerical optimization. The regression quantile resulting from the weighted loss criterion still has the quantile attribute that a share of τ observations is located below the estimated regression line. Depending on the chosen level τ, a quantile regression model will estimate effects of covariates on a tail of the distribution of the response—SSQ scores in this analysis—with the specified extremeness τ. Hence, an influence of a covariate, for example, may only be found on the upper tail of the response. A dense set of regression quantiles at multiple levels
This analysis allows for more complex covariate effects than in a multiple linear model. If a covariate effect is assumed to be nonlinear without a specific idea of its form, a flexible concept is needed to estimate unknown forms of nonlinear dependencies. Here, penalized B-splines (P-splines) for the flexible appraisal of an unknown function were used (Eilers & Marx, 1996). The functional estimate is composed from a rich set of basic polynomial spline elements, and a quadratic penalty is added to the loss function to enforce an appropriate level of smoothness of the function. Each polynomial spline is assigned a regression coefficient that determines its amplitude. The weighted sum of all splines comprises the estimated function. The use of P-splines in quantile regression is numerically rather challenging due to the quadratic nature of the P-splines penalty. The combination of the absolute loss criterion of quantiles and the flexibility of a semiparametric regression model originating in mean regression requires a sophisticated estimation algorithm to achieve sensible results (e.g., Bollaerts, Eilers, & Aerts, 2006; Schnabel & Eilers, 2013).
Modeling SSQ17
In this article, the results for two separate quantile regression models and one binary logistic regression model are presented. In the first model, quantile regression was used to estimate a benchmark distribution for the SSQ and its subscales for the population-based sample from the HÖRSTAT study. Therefore age, asymmetric hearing, self-reporting of hearing difficulties, tinnitus, previous ear diseases, and self-reporting of health issues were included as covariates. The effect of age was modeled with a P-spline basis in this analysis to obtain a representative picture for all ages.
Further, a second quantile regression model was constructed to estimate the impact of auditory measurements on the SSQ. The model extends the first quantile regression by the covariates PTA4 (with P-splines), gender, and education. Hence, this analysis had to take into account a possible confounding among the covariates: Especially necessary was a reduction of the bias arising from dependencies between sociodemographic variables and pure-tone audiometric measurements. Therefore, a two-stage regression model was estimated, to obtain less biased regression coefficients when modeling the SSQ. In the first stage, the PTA4 was set as the response variable and all sociodemographic covariates, as well as self-reported hearing difficulties, were included. The residuals from the first stage were then added as an additional covariate in the final regression model with the sole purpose of reducing the bias (Sobotka, Marra, Radice, & Kneib, 2013). The regression coefficients for this covariate cannot, however, be interpreted in any way. In this model, age was grouped into six categories to further control for the confounding in the presence of PTA4. The lowest age category (18–39 years) served as the reference for basically decadic age categories (40–49, 50–59,… 80 and above).
The model selection process was restricted to produce the same model for all quantile levels. This was achieved by choosing the Akaike Information Criterion (AIC, Akaike, 1974) as selection criterion and then computing the mean AIC of all quantiles as introduced by Spiegel, Sobotka, and Kneib (2017). Mean AIC can be used in the same way as the regular AIC, since the model with the minimum AIC is the selected final model. The selection was performed using a manual backwards algorithm removing the variable that resulted in the steepest decrease in the mean AIC.
Furthermore, the addition of interaction terms was explored in a manual forward selection. All pairwise interactions of the variables age, gender, education, self-reported hearing difficulties, and PTA4 were allowed to enter the model, again based on the decrease in the mean AIC. An interaction between gender and self-reported hearing difficulties and an interaction between age and education were selected into the speech subscale model.
Finally, logistic regression was performed with SSQ17 scores as the predictor variable and self-reported hearing difficulties as the outcome, additionally including age categories as covariate to further research an effect of age.
Analyses were conducted using R 3.4.1 with the add-on packages “quantreg” (Koenker, 2018) for the estimation algorithm and “expectreg” (Sobotka et al., 2014) for the construction of the semiparametric model, as well as using SPSS 25.0 for the descriptive analyses.
Results
Benchmark Distribution for SSQ
Figure 3 shows the mean-by-subject score distribution for SSQ17 and the speech, spatial, and qualities subscales by age in the study sample (see Supplement Table 2s for descriptive statistics). The regression lines refer to the 0.1, 0.25, 0.5, 0.75, and 0.9 quantile in participants who did not report hearing difficulties, tinnitus, ear diseases, or health issues and who showed symmetric hearing thresholds, termed practically subclinical, that is, for all intents and purposes, in the following. The 0.1 and 0.9 quantiles are assumed to describe population-based benchmark distributions for the SSQ17 and its subscales (see Supplement Tables 3s to 6s for numerical results). Note that the quantiles shown in Figure 3(a) deviate to a small extent from results reported earlier for SSQ data derived in HÖRSTAT (von Gablenz et al., 2018), mainly because the present analysis excluded data of aided participants in the quantile regression models and included additional covariates. SSQ scores derived in aided HÖRSTAT participants are graphically displayed for comparison.
SSQ scores averaged by subject in the study sample as a function of age (dots). Quantiles (lines) refer to practically subclinical study participants. SSQ data of participants using hearing aids are only graphically displayed and not included in the model (open circles). (a) SSQ17. (b) Speech subscale. (c) Spatial subscale. (d) Qualities subscale. Colored triangles indicate mean SSQ scores published for normal-hearing adults. SSQ = Speech, Spatial, and Qualities of Hearing Scale.
SSQ scores largely decreased with age, as expected, since hearing performance decreases with age. In participants who feel comfortable with both their hearing and their general health condition, however, the decrease in reported hearing abilities was rather modest, for both the SSQ17 and its subscales. Score decrease was almost negligible in the upper deciles. At the median and the lower decile, scores decreased roughly 0.5 and 1 scale points, respectively, over the five age decades. Variance of scores increased slightly with age and was lowest in the qualities and highest in the spatial subscale. The symbols added to Figure 3 refer to the equivalent mean score reported from different studies. The equivalent mean score was calculated from mean SSQ scores for only those items that are included in the German SSQ17. As the SSQ data in young and normal-hearing adults were usually negatively skewed, the mean was expected to be lower than the median. On average, the mean score was about 0.3 scale points lower than the median in the Zahorik and Rothpletz’ study (2015, numerical data kindly provided) and in the present data set. It should be noted that the mean scores derived from young reference samples by Moulin et al. (2015) and Zahorik and Rothpletz (2015) lay within the interquartile range of the present distribution. The equivalent mean scores in Demeester et al. (2012) and Banh et al. (2012), in contrast, were mostly very close to the 0.9 quantile estimated for almost all subscales and items in the present data set. The mean responses of elderly normal-hearing subjects reported in the same studies, however, matched the interquartile range estimated for the present data set.
HÖRSTAT participants provided with hearing aids gave, on average, lower ability scores than expected for practically subclinical participants of the same age. In SSQ17, 48% of hearing-aid users scored below the 0.1 quantile and 62% below the 0.25 quantile. The gap between the ideal outcome and reported SSQ score was largest for the speech subscale, with 71% of the aided participants scoring lower than the expected median in practically subclinical participants. However, the spread of SSQ scores was very large. An ability score higher than the expected median was reported by 30% of the hearing aid users, with almost no differences between the subscales (29%–31%).
Impact of Auditory and Nonauditory Factors on SSQ Ratings
Subscale level
Hereafter, the quantile regression models relating to the SSQ17 and its three subscales are presented that estimate the effect of nonauditory and auditory factors on the association between SSQ ratings and pure-tone hearing. Each of these models is delineated by a diagram that shows SSQ quantiles as a function of PTA4 (Figures 4 and 5; see Supplement Tables 7s to 10s for numerical results), together with a table showing the parametric coefficients β for age and factors that additionally impact hearing-ability ratings (Tables 1 to 4). The lines from the quantile regression refer to highly educated male participants without known ear-related anomalies or health-related complaints. Given that observations for elevated PTA4 are scarce in the present data, regression lines are dashed to indicate the high uncertainty of the curve characteristics for PTA4 > 35 dB HL.
SSQ scores averaged by subject as a function of PTA4 (dots) for SSQ17 (left panel) and for the speech subscale (right panel). Quantiles (lines) refer to practically subclinical males estimated in multiple regression including auditory and nonauditory predictors (see Table 1 for SSQ17 and Table 2 for the speech subscale). Dashed lines indicate high uncertainty of the curve characteristics. SSQ = Speech, Spatial, and Qualities of Hearing Scale; PTA = pure-tone average. SSQ scores averaged by subject as a function of PTA4 (dots) for the spatial subscale (left panel) and for the qualities subscale (right panel). Quantiles (lines) refer to practically subclinical males estimated in multiple regression including various predictors (see Table 3 for the speech subscale and Table 4 for the qualities subscale). Dashed lines indicate high uncertainty of the curve characteristics. PTA = pure-tone average. Parametric Coefficients and SD of the Association of SSQ17 Scores and PTA4 Shown in Figure 4 (Left Panel). Note. Coefficients > 1.96 SD are considered to be significant (in bold). Reference categories are in brackets. SSQ = Speech, Spatial, and Qualities of Hearing Scale; SD = standard deviation; PTA = pure-tone average. Parametric Coefficients and SD of the Association of SSQ Speech Subscale Scores and PTA4 Shown in Figure 4 (Right Panel). Note. This model includes an interaction term (i.a.) between age and education to adjust for the additional dependency between the two variables. Regression coefficients were very small and therefore omitted from the table. Coefficients > 1.96 SD are considered to be significant (in bold). Reference categories are in brackets. SSQ = Speech, Spatial, and Qualities of Hearing Scale; SD = standard deviation; PTA = pure-tone average. Parametric Coefficients and SD of the Association of SSQ Spatial Subscale Scores and PTA4 Shown in Figure 5 (Left Panel). Note. Coefficients > 1.96 SD are considered to be significant (in bold). Reference categories are in brackets. SSQ = Speech, Spatial, and Qualities of Hearing Scale; SD = standard deviation; PTA = pure-tone average. Parametric Coefficients and SD of the Association of SSQ Qualities Subscale Scores and PTA4 Shown in Figure 5 (Right Panel). Note. Coefficients > 1.96 SD are considered to be significant (in bold). Reference categories are in brackets. SSQ = Speech, Spatial, and Qualities of Hearing Scale; SD = standard deviation; PTA = pure-tone average.


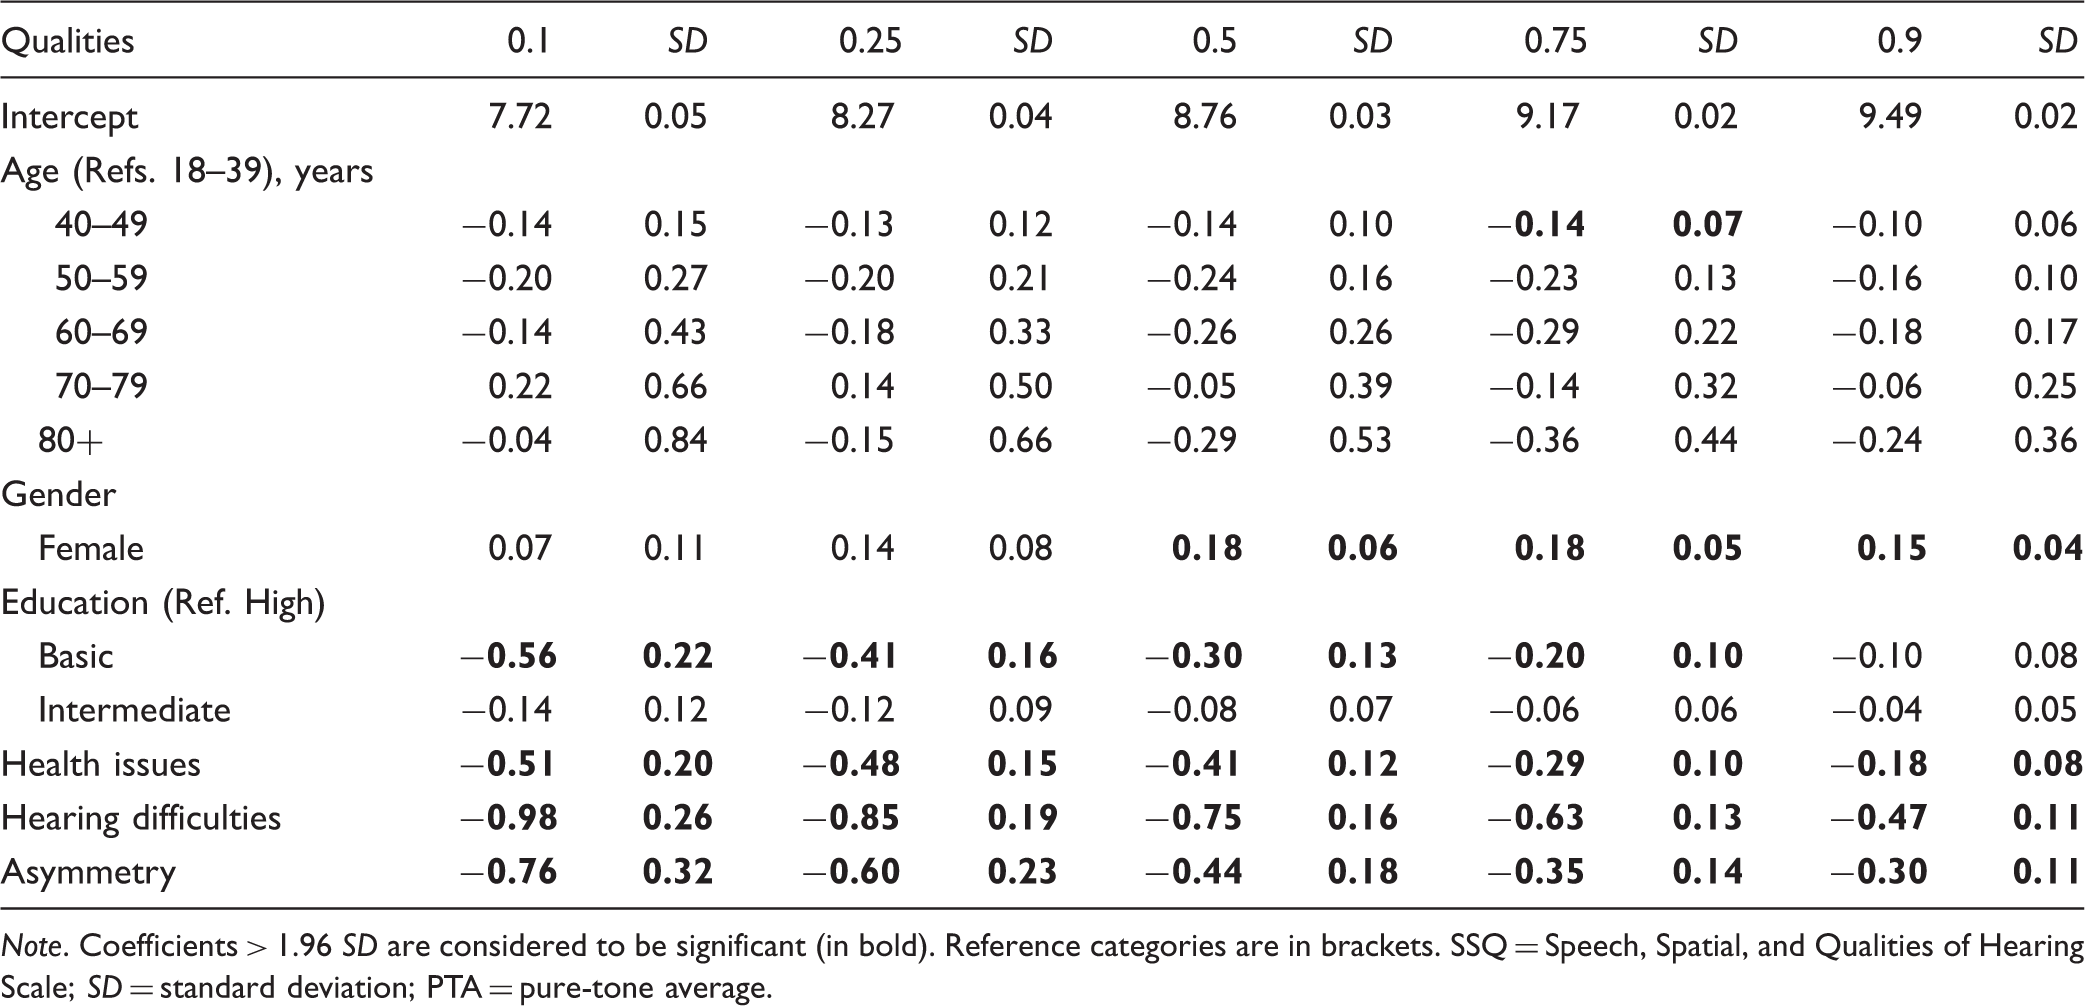
Coefficients β from quantile regression listed in Tables 1 to 4 can be directly interpreted as estimated score increase or decrease. Thus, a coefficient of −0.5 for an attribute a at quantile τ means that the expected SSQ quantile curve τ indicated in the corresponding graph would be shifted down by −0.5 scale points if the attribute a applied. Coefficients were summed to estimate the effect of combined attributes. To give a hypothetical example based on Table 3 for the spatial subscale, female participants with basic school education who reported health issues are estimated to assess their abilities 1.62 scale points lower at the 0.25 quantile (
As expected, audibility represented by PTA4 was associated with SSQ scores, although the strength of these associations differed considerably between the subscales. The quantile functions of the SSQ17 scores were practically straight for low PTA4 and gently sloping when PTA4 exceeded approximately 15 dB HL. In the speech subscale, the decrease of ability scores with increasing PTA4 was comparatively steep and almost linear. The slope was approximately 0.5 scale points per 10 dB HL at PTA4. This was true from the lowest to the highest quantile. In the spatial subscale, in contrast, scores hardly followed PTA4. Scores slightly decreased with increasing PTA4 in the lower half of their distribution, but the upper quantiles remained practically unchanged or rather slightly increased. In the qualities subscale, median and upper quantile functions were similarly straight for low PTA4 and decreased gently for PTA4 above approximately 15 dB HL. The sloping of the quantile functions below the median begins at lower PTA4 and is, although marginally, steeper than for high quantiles.
The regression coefficients listed in the tables quantify the effects of age, gender, educational level, hearing asymmetry, self-reporting of hearing difficulties, tinnitus, and health issues. As self-reported ear diseases did not show any effect on ability ratings, the respective variable was deselected from the models at an early stage. To provide an overview of the tabulated results, the impact of the principal factors on ability ratings is visualized in Figure 6. Covariates were only included in this effects summary when the corresponding coefficients were equal or larger than |0.3| for the median and met the significance criterion in not less than four of the five quantiles. Coefficients smaller than |0.3| at median were considered as negligible, even if significance was reached, to avoid overemphasizing marginal effects that were mostly well below 0.5 scale points even in the most affected quantiles.
Variability factors leading to significantly lower SSQ ability ratings (effect summary based on Tables 1 to 4). Covariates were only included when the significance criterion was met in not less than four of the five quantiles. Category β refers to the mean of coefficients β for the 0.1, 0.25, 0.75, and 0.9 quantiles. A balanced effect was assumed if the mean of low quantile coefficients (0.1 and 0.25) and the mean of upper quantile coefficients (0.9 and 0.75) differed by less than one third. SSQ = Speech, Spatial, and Qualities of Hearing Scale.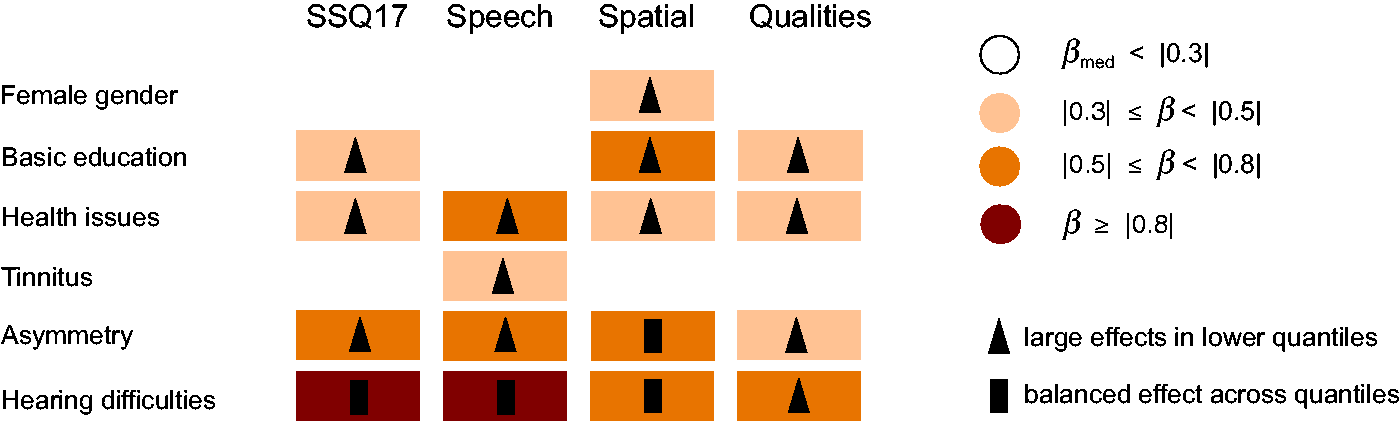
Self-reporting of hearing difficulties is by far the most influential factor that leads to substantial score decreases between 0.7 and 1.3 scale points; it is most pronounced in the speech subscale. Hearing asymmetry and self-reporting of health issues impacted ability ratings in all subscales as well as the total SSQ17. Effects were considered moderate for hearing asymmetry and small for self-reporting of health issues in most subscales. Basic educational level was associated with lower ability scores in the SSQ17, the spatial and qualities subscale. Respective effects were small to moderate. Gender and tinnitus, by contrast, affected ratings only in a single subscale. Females’ ability scores were somewhat lower in the spatial domain than the scores estimated for males, and tinnitus took effect on the speech subscale. Although the effect of self-reported hearing difficulties was almost balanced across the complete score distribution (except in the qualities subscale), the remaining factors showed larger effects in the lower than in the upper quantiles. A consistent interaction was observable in the speech subscale model, with slightly higher scores in female than male participants if hearing difficulties were reported.
Quantile regression coefficients estimated for age were quite low and consistently failed to reach significance. Figure 7 summarizes the coefficients by age category, as given in Tables 1 to 4 for the SSQ17 and its subscales. The absolute value of coefficients for age was generally larger in the lower than in the upper quantiles. However, age coefficients forming different patterns in particular subscales and age categories are more interesting than their absolute value. Except for the 70 to 79 age category, coefficients for age were negative or practically zero for SSQ17 and the qualities subscale, that is, older participants scored lower than estimated for the 18 to 39 years’ reference category, given similar values in all remaining covariates. In the spatial subscale, coefficients for age were negative for almost all age categories in the upper quantiles and mostly positive for the median and lower quantiles. The speech subscale showed a reverse pattern, with positive coefficients for most age categories and quantiles, that is, older participants scored higher than estimated for the reference category. No systematic increase or decrease was discernable, but the assessments for the 70 to 79 year age-group required particular attention. Regression coefficients mostly indicated higher ability scores for participants 70 to 79 years of age than for the 18 to 39 year reference category, markedly so in the speech subscale, with coefficients ranging from 0.4 to 0.7. Unlike other age-groups, all quantile coefficients were positive for the 70 to 79 age category in the SSQ17 model.

Item level
Quantile regression models built for single items widely confirmed the impact of the auditory and nonauditory factors displayed earlier. Figure 8 gives an overview of the main effects observed on item level (analogous to Figure 6; see Supplement Tables 11s to 27s for numerical results). Asymmetric hearing, self-reporting of hearing difficulties, and health issues showed considerable effects on each of the speech items. Applying the pragmatic subscale division proposed by Gatehouse and Akeroyd (2006), the speech-in-noise item #1.4 and the speech-in-speech item #1.7 are the items most sensitive to influence from auditory factors, including PTA4. The moderate impact of education on ability ratings in the spatial subscale derives mainly from items #2.7, #2.9, and #2.12 (distance and movement). Effects were especially pronounced at the low quantiles, reaching a score decrease of up to 1 scale point. Female gender was equally associated with lower ability scores for all spatial items, although the inclusion criteria for the effect summary were barely missed for two items. Item #2.9 was the least sensitive item in the spatial subscale, showing moderate effects for gender and education but, contrary to all other subscale items, showed no notable effects of the auditory- or health-related factors. Effects on the qualities items were smaller than for speech or spatial items and were concentrated on the lower quantiles. The overall largest effect among the SSQ17 items was observed for self-reported hearing difficulties on item #3.18 (listening effort), with an estimated score decrease by 1.3 to 1.9 scale points.
Variability factors leading to significantly lower SSQ ability ratings (per item). Covariates were only included when the significance criterion was met in not less than four of the five quantiles. Category of β refers to the mean of coefficients for the 0.1, 0.25, 0.75, and 0.9 quantiles. A balanced effect was assumed if the mean of low quantile coefficients (0.1 and 0.25) and the mean of upper quantile coefficients (0.9 and 0.75) differed by more than one third.
Coefficients for age categories at item level were highly consistent with the results presented for the subscales. Figure 9 gives an overview for age coefficients analogous to Figure 7. The significance criterion was not met for any item or any age category, but parametric coefficients were particularly large for the items #1.4 and #1.7 in the 70 to 79 year and—to a lesser extent—for the 80+ year category. The assessments point toward a score increase of about 1 scale point at the median with reference to the young adult category. By contrast, coefficients for the highest age categories did not exceed |0.2| in the model corresponding to the speech-in-noise item #1.5. All coefficients estimated for age were negative for the least challenging item #1.2 (speech in quiet), indicating, particularly in the low quantiles, an almost steady decrease of ability scores.
Summary of coefficients β estimated per item for age-groups with reference to 18 to 39 year participants. Signs and β refer to the mean of coefficients for the 0.1, 0.25, 0.75, and 0.9 quantiles.
Hierarchy of Difficulty
The hierarchy of item difficulty as well as Spearman correlation coefficients describing the association PTA4 in the better ear and SSQ scores are given here to facilitate comparison to international study results. Rank correlation coefficients were −0.33 for SSQ17, −0.32 for the speech, −0.19 for the spatial, and −0.31 for the qualities subscales. Correlations were significant using a significance level of 0.01 (two-tailed). Correlations were weaker, though still significant, in normal-hearing participants with r ≈ 0.24 for SSQ17, the speech and qualities subscale. The correlation coefficient dropped to r = −0.14 in the spatial subscale. The correlation coefficients between better-ear PTA4 and SSQ scores did not meet significance in hearing-impaired participants. Spearman coefficients ranged between −0.02 for the spatial and −0.12 for the speech subscale.
In terms of the five most difficult and the easiest SSQ17 items, #1.10 (multiple speech streams) showed the lowest mean score, followed by items #2.9, #2.5, #1.4, and #2.12. The highest mean score was observed for #1.2 (speech in quiet), as expected, followed by the qualities items #3.8, #3.9, #3.10, and #3.4. On the subscale level, the mean score is 7.3 (bootstrapped 95% CI: 7.3–7.4) for the speech, 7.5 (7.4–7.6) for the spatial, and 8.8 (8.7–8.8) for the qualities subscales. Overlap of CI indicates that the speech and the spatial mean subscale scores did not differ. To present the results thus is, in some ways, misleading, as the reported quantile regression models mentioned earlier indicate that the hierarchy of difficulty is certainly influenced by subject selection. In participants who did not report hearing difficulties, the mean score for both the speech and the spatial subscale was 7.7 and CI widely overlap, whereas in participants stating hearing difficulties, the mean score was 5.8 (5.6–6.0) in the speech and 6.8 (6.6–7.0) in the spatial subscale. Similarly, hierarchy of difficulty differed by gender. The mean of 7.5 scale points (7.3–7.6) for the speech and 7.4 scale points (7.3–7.5) for the spatial subscale was basically the same in females, while significantly different in males, with a mean score of 7.2 (7.1–7.3) for the speech and 7.7 (7.6–7.8) for the spatial subscales.
Self-Reporting of Hearing Difficulties and Ability Assessment
A logistic model was built to analyze the association of SSQ ability scores and self-reporting of hearing difficulties. SSQ17 scores were included as predictor to ensure that all hearing dimensions were addressed and evenly balanced. Figure 10 shows the probability for reporting hearing difficulties as a function of SSQ17 scores separately by age. Lines showing the probability functions are dotted when extrapolated beyond the observation with the smallest covariate value, to denote high uncertainty regarding the progression of the curves. As expected, the probability for self-reported hearing difficulties increased as SSQ17 scores decreased. Of particular note is that probability curves are shifted with regard to age. Estimated maxima of probability values relate to age and ranged between 0.64 and 0.88 for participants aged 80 or more and for adults younger than 40, respectively. Probability functions converged toward 0, such that a probability of 0.05 corresponded basically for all age-groups to an SSQ17 score of 10 scale points. The probability of 0.5, indicating a 50% chance for reporting hearing difficulties, corresponded to 5.6 scale points in participants below 40 and 5.2 scale points in participants aged 40 to 49 years, respectively. For participants assigned to higher age categories, the probabilities of .5 increased only slightly from 5.7 to 6.3 scale points. This suggests, conversely, that elderly adults assessing their abilities with the same SSQ score as young adults are more likely to report hearing difficulties of any kind when asked in general terms. With regard to the whole study sample, the probability of 0.5 corresponded to almost exactly 6 scale points, that is, participants scoring 6 scale points or less were more likely to report hearing difficulties, whereas participants scoring higher than 6 scale points were more likely not to report hearing difficulties.
Probability of self-reported hearing difficulties as a function of SSQ17 scores by age. Dotted lines indicate extrapolated progression of the curve. SSQ = Speech, Spatial, and Qualities of Hearing Scale.
Discussion
This study examined hearing abilities using the German SSQ17 short form in a population-based sample of 1,711 adults, largely naïve with regard to hearing testing and corresponding questionnaires. The main research questions motivating this analysis were to derive a kind of benchmark SSQ score distribution and to examine the effects of auditory and nonauditory factors on hearing assessments. Quantile regression was used to deal with the nonnormal heteroscedastic distribution of SSQ scores that is generally observed in samples with a dominant proportion of normal-hearing participants. This innovative mathematical approach shed particular light on the distributional characteristics of auditory and nonauditory variability factors. The results of this analysis both confirm and relativize fundamental properties of this questionnaire reported earlier for studies based on highly selective samples.
Ideal Outcome Profile
The SSQ17 and subscale score distribution that most reasonably describes the benchmark for hearing abilities as a function of age was estimated for adults with symmetric pure-tone hearing and no self-reporting of hearing difficulties, tinnitus, ear diseases, or health issues. In short, males and females aged 18 to 97 years who felt comfortable with their hearing and general health condition were considered an appropriate reference sample. It is not surprising that as hearing performance declines with age, the score quantile functions indicate a decline of hearing abilities with age. Rather surprising is, perhaps, that this score decline is quite slight. The SSQ17 quantile functions 0.1 to 0.9 span roughly 3 scale points and describe—using the term used by Noble et al. (2012)—an ideal outcome. In contrast to a single reference value, displaying the score distribution allows the comprehensive evaluation of SSQ ratings. The statement that an individual SSQ is situated below the 0.25 quantile or above the median expected for practically subclinical peers in age provides more meaningful information than the simple score difference—just as improvement after hearing-aid uptake translated into a distributional shift tells more than the comparison of pre and post scale points. This also holds for group results, such as when 48% of the aided participants in the HÖRSTAT study scored below the age-related 0.1 quantile in the SSQ17, but 30% gave ability scores above the median. For evaluations of that kind and for clinical practice, numerical data describing the benchmark score distribution of the SSQ17, its subscales and items are provided in the supplement.
Comparing SSQ short forms, Moulin and Richard (2016) noted an effect of education on the SSQ17 qualities subscale, but concluded that the SSQ17 has the potential to keep, on the subscale level, the information of the full SSQ. Hence, the benchmark distribution derived in this analysis may be regarded as being applicable to other SSQ versions. The distributional approach thereby supports several previous findings. Noble et al. (2012) reported an ideal outcome with respect to the pragmatic subscales, therefore the results cannot be compared in detail. However, they used ssq6 to differentiate low and high abilities in 50 - to 80-year-old adults. The cut-off set at 6.5 scale points corresponds, for example, approximately to the 0.1 quantile estimated for participants 65 years of age, as can be seen in Figure 3(a). Moreover, the median score expected for elderly participants according to our model and the mean reported for elderly adults with good pure-tone hearing by both Banh et al. (2012) and Demeester et al. (2012) correspond well for both the SSQ17 and the subscales. However, the mean scores reported for young adults in the latter studies are high and mostly touch the 0.9 quantile estimated in this analysis. Moulin and Richard (2016) also reported somewhat higher SSQ scores (except for the spatial subscale), while the data of Zahorik and Rothpletz showed an overall good, and partly almost perfect, agreement with the present results. All studies in the comparison were based on student populations and, as far as specified, dominated by female gender. Questionnaire administrations, as well as language, were diverse and provide per se no plausible explanation for these large differences. Mean subscale scores differ by 0.9 to 1.1 scale points between these designated benchmark or reference groups. This certainly underlines that rather homogeneous samples, when seen from the social perspective, combined with single reference values, must be considered as critical for the purpose of benchmarking.
General Question About Hearing Difficulties Versus SSQ
The general question about hearing difficulties is certainly the least complex disability measure. When asked in general terms (Which of the following apply to you? Please check all that apply: Hearing difficulty, poor eyesight, high blood pressure, back problems, none of these), 21% of the participants in this study reported hearing difficulties. This prevalence might appear high in a population sample but complies with the results based on the UK Biobank. Prevalence is 26% in adults aged 40 to 69 years in the UK Biobank data (Moore et al., 2014) and, if age range is considered, 25% in this study. Logistic regression with SSQ score predicting self-reported hearing difficulties was performed to examine the relationship between the two disability measures. An SSQ17 score of 6 scale points was found to predict the self-reporting of hearing difficulties on a chance level. Generalized to the population, a score below 6 scale points is more likely among adults who report hearing difficulties. This cut-off is somewhat lower than the 6.5 scale points set by Noble et al. (2012) for the ssq6 short form. Since it recurred in experience and clinical data, the authors assumed this cut-off to be applicable to the general population. It is certainly problematic to compare mean scores derived using these two different short forms, the more so as Noble et al. retrospectively found that ssq6 cannot reliably substitute full SSQ. In any case, full equivalency on the level of mean scores was neither studied nor assumed, as the SSQ17 and the ssq6 share only three items (see Supplement Table 1s). Taking these uncertainties into account, both estimates differ only slightly overall, as 6.5 scale points correspond to a probability of 0.58 for self-reported hearing difficulties. Including age as covariate in the logistic regression model further showed that the association of SSQ17 scores and self-reported hearing difficulties changes with age, that is, self-reporting of hearing difficulties corresponds to increasingly higher SSQ scores. The proportion of participants who report hearing difficulties together with high abilities is larger in elderly than in young participants. This kind of second-order age effect is difficult to interpret, because it remains obscure as to why participants report hearing difficulties when globally asked. Since this finding relates to the association of two disability measures, it does not necessarily establish an independent effect of age on SSQ ratings. Explanatory approaches point toward a counterintuitive age effect, possibly reinforced by excluding hearing-aid users from analysis. These aspects are discussed in the following sections.
Variability Factors of SSQ Scores
To quantify the impact of auditory and nonauditory factors on SSQ scores, multiple quantile regression models were built both on subscale and on item level that describe the nonlinear association of PTA4 in the better ear and SSQ scores controlling for asymmetric hearing, tinnitus, age, gender, education, and self-reporting of health issues and hearing difficulties. Coefficients estimated for various quantiles are parametric, thus they can easily be incorporated within the SSQ scale. The estimated effects were mostly larger in the lower than in the upper half of the score distribution including the median for most factors under study—except for interaural asymmetry in the spatial subscale, and for self-reported hearing difficulties, which affected ability ratings in almost a balanced way across the distribution.
Pure-tone hearing
In the present data, the spread of SSQ scores over pure-tone hearing data is huge. Hence, the association between scores and pure-tone hearing thresholds is modest. Controlling for age and the other factors listed earlier, the regression models still show a decrease of SSQ scores with increasing hearing loss in SSQ17 and the subscales except for the spatial subscale. The speech subscale scores are almost linearly associated with PTA4 in the better ear, while SSQ17 and the qualities subscale scores develop into a gentle decrease for PTA4 exceeding approximately 15 dB HL. Spearman correlations calculated to facilitate comparison to international study results gave significant results in the total data set (r ≈ 0.3 except spatial items) and—if only due to the large sample size—in normal-hearing participants (r ≈ 0.2). Significance failed for all correlations in hearing-impaired participants, most probably owing to the dominance of only a mild hearing impairment affecting 152 of the 179 adults in this subpopulation (see Figure 2).
Interaural asymmetry, tinnitus, and ear diseases
Asymmetry of pure-tone hearing at PTA4 leads to a lower median score of approximately 0.4 to 0.7 scale points than expected for participants with symmetrical PTA4 in the quantile regression model. This effect was almost equally pronounced for speech and spatial items, though more balanced in the spatial subscale if the entire score distribution is taken into account. Interaural asymmetry was an early focus in the development of the SSQ questionnaire and has been extensively studied in unaided clinical samples (Gatehouse & Noble, 2004; Noble & Gatehouse, 2004). Using the asymmetry criterion and controlling for better-ear PTA4, Noble and Gatehouse (2004) observed pronounced effects for the spatial items and, overall, more than 1 scale point lower scores in adults with asymmetric hearing compared to adults with symmetric hearing thresholds, that is, almost twice as much as in the present data set. Such a difference is plausible against the background of sample composition. Mean PTA4 in the Glasgow asymmetry sample was 39 dB HL in the better ear and 74 dB HL in the worse ear and had thus a 35-dB interaural difference compared to an interaural difference of 20 dB among the participants with asymmetric hearing in the present data, who mostly retained normal hearing in the better ear. Moulin and Richard (2016) found better-ear PTA4 and asymmetric hearing to be the only significant predictors for SSQ scores in a two-step linear regression analysis using data of a clinical sample with a mean PTA4 of 26 dB HL in the better and 44 dB HL in the worse ear (Moulin et al., 2015). Regression coefficients for asymmetric hearing were comparatively low and ranged between −0.18 for the qualities and −0.38 in the spatial subscale. Moulin et al. found similar results performing linear regressions for the SSQ17 subscales using the French data.
Tinnitus lowers ratings on the speech items #1.4 and #1.7 by 0.6 scale points in the lower part of the distribution, but the overall effect was rather small, confirming the findings of Noble et al. (2012). Self-reporting of ear diseases had no effect on SSQ scores in the present data and was omitted from further analysis.
Gender, education, and self-reported general health
The regression model showed significant effects of gender, education, and the self-reporting of health issues on SSQ ratings. Considerable gender effects were limited to three spatial items and indicated lower scores for females than for males by 0.5 to 0.9 scale points at median and lower quantiles, which resulted in 0.4 scale points on the subscale level, while leaving the overall SSQ17 score unaffected. Moulin and Richard (2016) had already observed lower spatial scores and a larger difference between the mean speech and spatial subscale score in females than in males. The authors suggested that this observation can be explained by gender-linked differences in the visuo-spatial domain. Olsen et al. (2012), in contrast, did not observe any effect of gender. Other recent studies using SSQ did not examine any effects of gender (e.g., Banh et al., 2012; Zahorik & Rothplez, 2015) and some did not even report the distribution of gender for the sample (e.g., Demeester et al., 2012; Dwyer et al., 2014).
The participants’ ratings on spatial items and—to a lesser degree—on qualities items were associated with their educational level. Coefficients estimated for basic education with reference to the highest school attainment level were −0.5 and −0.3 at the median for the spatial and qualities subscale, respectively. Significance was also met for SSQ17. Similarly, Moulin and Richard (2016) found that the years of education were associated with lower scores for the qualities subscale of the SSQ17. Given this consistent finding, this factor merits increased attention. Readability, difficulties imagining the situations depicted and tiredness on responding might at least partially explain the effect of education, as argued by Moulin and Richard. Since the effect of education was largest in the spatial subscale (item positions 7 to 11 in the questionnaire), and the participants were only asked to respond on the SSQ17 in this study, tiredness is likely to be a minor issue. Moreover, an equally significant effect of education was found for the first SSQ17 item in the present data, the speech-in-quiet item #1.2. Participants who attained only a basic educational level rated their ability to understand speech in quiet to be in the bottom half of the distribution and 0.5 to 1.2 scale points lower than highly educated participants. Wording of this item is far from complex in the German version, so that readability should not constitute a major problem, provided that literacy can be assumed. Functional illiteracy, which is indeed an often underestimated problem in economically advanced societies (Grotlüschen & Riekmann, 2011), might play a role in the self-administered mode. However, if it were a more profound readability problem, we would have expected randomly distributed effects. However, coefficients for this factor are below a median of |0.2| for each item of the speech subscale. The absence of any effect on the speech subscale items also contradicts the hypothesis that rating on this least difficult item would possibly mark a different internal reference shaped on the sociopsychological pathway, that is, low education or less self-confidence in one’s own abilities.
To the authors’ knowledge, the general state of health has not yet been explicitly considered as a factor of variability in SSQ ratings. In the present data set, the self-reporting of a less than “good to excellent” health status yielded considerable and stable effects in the SSQ17 and in each subscale. Speech items under adverse conditions were the most, and items of the qualities subscale the least affected. Coefficients estimated for the speech items mostly ranged between −0.7 and −0.9 in the distribution’s lower half, indicating substantially lower scores in this subpopulation. Self-reporting of health issues was associated with a score decrease of approximately 0.5 scale median points in 13 of the 17 items, thus appears to be less specific. Possibly, the overall sensation of being in a rather poor physiological condition generalizes to a low rating of hearing abilities.
Taken separately, the impact of gender, education, and self-reported health issues is small to moderate. Considering the general self-reported state of health and common sociodemographic measures in the SSQ analysis, however, might contribute to disentangling the mélange of “personality aspects” that has been estimated to explain a significant proportion of reported disability (Gatehouse, 1991).
Self-reporting of hearing difficulties
Self-reporting of hearing difficulties was by far the most influential factor in the quantile regression. Substantial effects were detected in the speech subscale and in SSQ17. Its impact on spatial and qualities items was less, but still the most prominent among the categorical covariates. Estimated coefficients were a median of 1.3 in the speech subscale, 0.9 in the SSQ17, and 0.7 in the spatial and the qualities subscale. This effect was almost constant from the 0.1 quantile to the 0.9 quantile in SSQ17 and the speech subscale, and still balanced in the spatial subscale, but shifted to the lower half of the score distribution in the qualities subscale. Studies examining the properties of the SSQ questionnaire mostly rely on audiometric performance and do not consider self-reported hearing difficulties (e.g., Banh et al., 2012; Demeester et al., 2012; Moulin et al., 2015; Moulin & Richard, 2016; Zahorik & Rothpletz, 2015). Agus, Akeroyd, Noble, and Bhullar (2009) and Noble et al. (2012), however, integrated self-reported hearing difficulties and SSQ ability assessment following an elaborated factorial design. Agus et al. (2009) found a difference by, on average, 1.4 scale points in the overall SSQ between adults stating and denying hearing difficulties. The recalculation of mean scores (depicted from Agus et al., 2009; Table 1) for the five speech subscale items included in SSQ17 resulted in a difference of 1.7 scale points between these two groups. For the present data, the equivalent score difference was 1.9 scale points. Based on the coefficients for the median in the regression model, self-reporting of hearing difficulties corresponds to a score decrease of 1.3 scale points in the speech subscale. Taking the different approaches into account, simple subtraction versus model-based estimation, our results seem well in line with the finding of Agus et al. (2009).
It was expected that self-reporting of hearing difficulties would show an effect on SSQ scores, since the relationship between the general question about hearing difficulties and SSQ resembles a kind of chicken-egg dilemma. Both are disability measures and address the same cognitive construct. The answer to the general question about hearing difficulties is derived from some kind of experience summation and possibly including third-party reporting that consolidate in belief and statement, whereas SSQ ratings are far more a result of interlinked processes of memory and imagination prompted by the depicted situations and the listening task. In the terms of Kahneman (2011), it is the remembering self, always at risk of falling into cognitive traps, that makes the accounting and replies to the SSQ items, not the experiencing self. Adults who report hearing difficulties of any kind are arguably more likely to underestimate their hearing abilities—and vice versa.
Age
According to the results of quantile regression, chronological age has no effect on SSQ ratings that can be considered to be an independent variability factor. Estimated quantile coefficients for age failed the significance criterion in SSQ17, in each subscale and each item. Since the age span is wide in the study sample, age was categorized in order to detect potential effects on the level of age cohorts and to make results easy to grasp. An alternative model that included age as a metric variable next to the discussed covariates qualitatively confirmed the current results. Parametric coefficients for age were mostly negatively signed and well below |0.3| until the age of 70, but often positively signed and elevated, particularly in the 70 to 79 age band. This pattern is similar for participants aged 80 or more. Since this highest-age category was broad with regard to age range and small in sample size, the corresponding estimates should be treated with caution. Nevertheless, the coefficients show a pattern indicating higher ability scores in elderly participants aged 70 years or more than estimated for young adults aged 18 to 39 years, particularly in the speech subscale, if pure-tone hearing and the aforementioned factors are controlled for. Such a counterintuitive trend was already found, for example, by Lutman, Brown, and Coles (1987), and Gatehouse (1991), and more recently supported by Kamil et al. (2015) using different methodological approaches. For the SSQ, Demeester et al. (2012) and Banh et al. (2012) observed an intuitive effect of age when comparing SSQ scores of healthy normal-hearing young and elderly adults, that is, lower ability scores in normal-hearing elderly than in young adults. Pure-tone hearing of both groups did not perfectly match and the older adults had poorer thresholds than young adults, although the audiometric inclusion criteria were reasonably strict in the Dutch study (thresholds ≤ 25 dB HL for 0.125–8 kHz) and more tolerantly defined in the Canadian study (PTA 0.25, 0.5, 1, 2, and 3 kHz ≤ 25 dB HL). Both studies excluded participants with asymmetric hearing using the same criterion as in this study. In the Canadian study, both samples were additionally matched in terms of English fluency and years of education. As displayed in Figure 3, the mean scores yielded in elderly adults met our results, but the mean scores reported for the young reference groups were higher. This also holds for the results of Zahorik and Rothpletz (2015) and—to a minor degree—Moulin and Richard (2016). Owing to a high mean score stated for the young reference group, the score difference between young and elderly normal-hearing adults amounted to 0.8 in the Dutch and 1.2 scale points in the Canadian study (calculated from the published mean scores for SSQ17 subscale items). This comparatively strong intuitive effect of age is ambiguous, since Banh et al. reported significant counterintuitive effects for isolated spatial items. In hearing-impaired adults, Moulin and Richard reported intuitive age effects mainly for the speech scale and isolated counterintuitive age effects for spatial and quality items. Olsen et al. (2012), by contrast, found no effect of age on SSQ ratings.
Focusing on age as a variable for physiological processes and pure-tone hearing to explain SSQ score differences of about 1 scale point is not promising, as long as factors belonging to the social and psychological domain that most likely influence self-assessments of any kind are ignored. Yet chronological age is an empty variable (Settersten & Mayer, 1997), it can be interpreted both physiologically and (psycho)socially. If audibility is controlled for, it is more convincing to assume that age impacts SSQ ability ratings on the social and psychosocial pathway than on the physiological pathway of higher auditory processing. The social and psychosocial perspective does admittedly provide arguments for an intuitive as well as a counterintuitive effect of age. Coming to an age when hearing problems are commonly considered to be an attribute of aging, and at which it bothers an increasing proportion of peers in age, might compromise self-confidence in one’s own abilities and lead to overcritical ratings. On the other hand, lifestyle changes with age, at least on the average and cohort level, as do situations and places. Wu and Bentler (2012) established different auditory lifestyles in adults between 40 and 88 years of age using a momentary assessment approach based on acoustical data collection and assessments. Results suggested that older adults spent more time in listening situations that place fewer demands on hearing. The itemized situations and listening tasks in the SSQ are supposed to evoke imaginations coined by real-life experiences. Thus, switching focus from assessing the ability to assessing the situation could additionally reinforce the impact of different lifestyle patterns in young and elderly adults on SSQ ratings. Finally, the belief in “getting off lightly” compared to age peers might lead to overoptimistic ratings. The internal reference for ability assessment is, being internal, not exempt from social calibration.
Overall, SSQ research findings with regard to age as an independent variability factor of SSQ scores are inconclusive. Uncertainty regarding possible age effects is high in our results. This suggests that age should not be used in evaluating individual SSQ scores.
Strengths and Limitations
This study is based on a large, population-based sample, and this is certainly an advantage when benchmarks and ideal outcomes are to be discussed. This strength, however, is double-edged and also constitutes a serious limitation that might bias estimations on the association of SSQ scores to age and to pure-tone hearing. The proportion of participants with poor hearing in the sample is small and further reduced by excluding aided participants. As a consequence, hearing performance is, on average, better than in the original HÖRSTAT sample and in the general population. Disabling hearing loss with PTA4 ≥ 35 dB HL is rare in the present sample and affects in total only 71 of 1,711 participants. As a consequence, the effect of PTA4 on SSQ ratings might be underestimated in the present results. This equally may have indirectly contributed to the counterintuitive age trend in the elderly age cohorts. Participants in the 70 to 79 year age-group retained notably better hearing than their peers in age. About 62% had better PTA4 than expected for the median PTA4 according to ISO 7029:2017, and this standard is based on populations that were strictly screened for, for example, noise exposure, ear and health related disorders, and familial hearing loss. Benchmarked against the peers in age, the elderly participants in this study sample are, or possibly believe themselves to be, better off with regard to hearing abilities. In the full HÖRSTAT sample, one out of five participants aged 70 years and older used hearing aids (23%). They are missing in this study sample, but certainly not among the study participants’ relatives, friends, or acquaintances.
Cumulative Effects
This analysis provided evidence that gender, education, and self-reporting on health state and hearing difficulties change the association of SSQ ratings and pure-tone hearing. Effects were more pronounced in the lower half than in the upper half of the score distribution and often indicated a shift of the order of 0.5 scale points—except for self-reported hearing difficulties, which, very roughly rounded, accounted for 1 median scale point. An estimated score shift by 0.5 or 1 scale points might seem moderate. Bearing in mind, however, that whoever takes up hearing aids obviously reports hearing difficulties, then cumulative effects may easily produce considerably larger shifts, that is, when more than one of the characteristics analyzed earlier applies.
Whether the effects estimated for gender, educational level, and self-reporting on health and hearing difficulties might get swamped or masked by increasing hearing loss is arguable. Moulin and Richard (2016), however, also noted significant effects of education and gender in hearing impaired adults. Therefore, when evaluating individual SSQ scores, it is reasonable to interpret self-assessed hearing abilities on a broader view as a screenshot of a cognitive and social construct. This is precisely what the inventory is intended to provide: an individual and subjective perspective that complements diagnostic results in hearing rehabilitation.
Conclusion
In a large population-typical sample, the German SSQ17 short form was used, along with hearing tests and a standardized interview. Instead of heading for a strict disability cut-off value, this contribution followed a distributional approach in analyzing SSQ scores from 1,711 adults who were not provided with hearing aids. Quantile regression, an innovative mathematical method still little used in hearing research, was applied to derive an ideal outcome profile for hearing rehabilitation and to examine the impact of auditory and nonauditory variability factors on SSQ ratings. Describing an ideal outcome based on SSQ scores from practically subclinical adults allows for benchmarking individual or group SSQ scores against the SSQ assessed hearing abilities considered to be normal. In our opinion, this approach facilitates a more comprehensive evaluation of hearing disability and rehabilitative outcomes than a binary decision compelled by a single disability cut-off value, particularly in clinical practice. Multivariable quantile regression models produced evidence that self-reporting of hearing difficulties and of health issues and low educational level are associated with lower SSQ scores, as also is female gender for spatial items. The impact is small-to-moderate and substantial for self-reported hearing difficulties, but, due to cumulative effects, this requires care. Analyses pointed toward a counterintuitive effect of age in elderly cohorts, that is, comparatively high ability ratings even if hearing difficulties were reported. However, uncertainties of regression estimates with regard to age were notably increased, suggesting the overall conservative conclusion that age does not consistently change SSQ ability scores if hearing loss is controlled for. Results were based on adults who, at the main, retained good pure-tone hearing thresholds. Therefore, to examine the robustness of the effects, nonauditory variability factors of SSQ scores merit further study in hearing-impaired adults.
Supplemental Material
Supplemental material for Adjusting Expectations: Hearing Abilities in a Population-Based Sample Using an SSQ Short Form
Supplemental material for Adjusting Expectations: Hearing Abilities in a Population-Based Sample Using an SSQ Short Form by Petra von Gablenz, Fabian Otto-Sobotka and Inga Holube in Trends in Hearing
Footnotes
Acknowledgments
Declaration of Conflicting Interests
The authors declared no potential conflicts of interest with respect to the research, authorship, and/or publication of this article.
Funding
The authors disclosed receipt of the following financial support for the research, authorship, and/or publication of this article: This work was supported by the Research Association of German Hearing Aid Acousticians, the Lower Saxony Department of Science and Culture, and the European Regional Funding with HÖRSTAT. Further analysis was financed from the federal resources of Niedersächsisches Vorab within the research focus “Hearing in everyday life (HALLO)”.
Supplemental Material
Supplementary material for this article is available online.
References
Supplementary Material
Please find the following supplemental material available below.
For Open Access articles published under a Creative Commons License, all supplemental material carries the same license as the article it is associated with.
For non-Open Access articles published, all supplemental material carries a non-exclusive license, and permission requests for re-use of supplemental material or any part of supplemental material shall be sent directly to the copyright owner as specified in the copyright notice associated with the article.